

Structural Characterization of an N-Acetyl Sugar Amidotransferase Involved in the Lipopolysaccharide Biosynthesis in Bacteria


Abstract
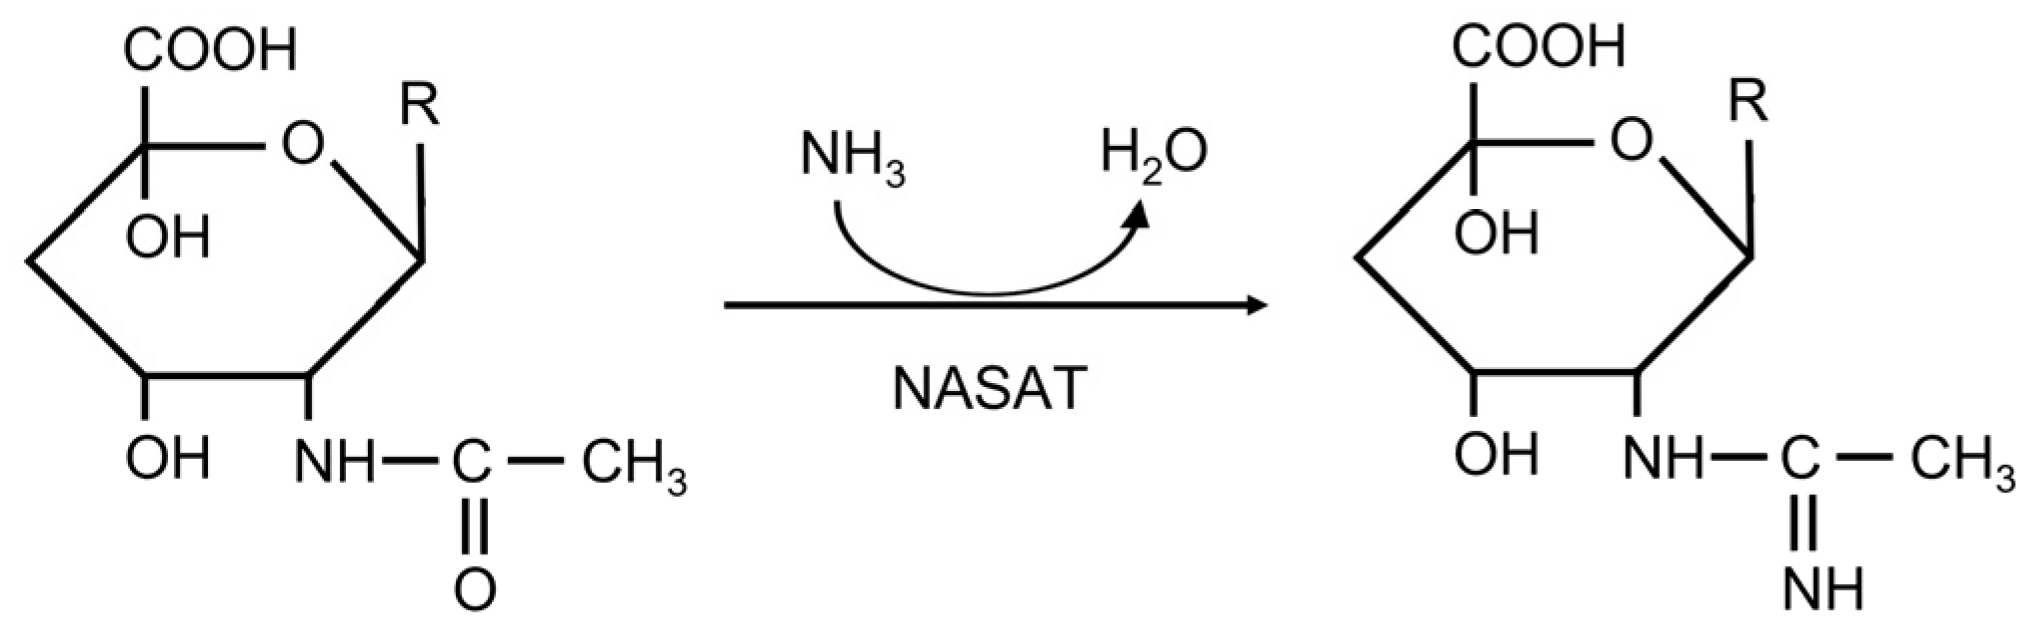
:1. Introduction
2. Results and Discussion
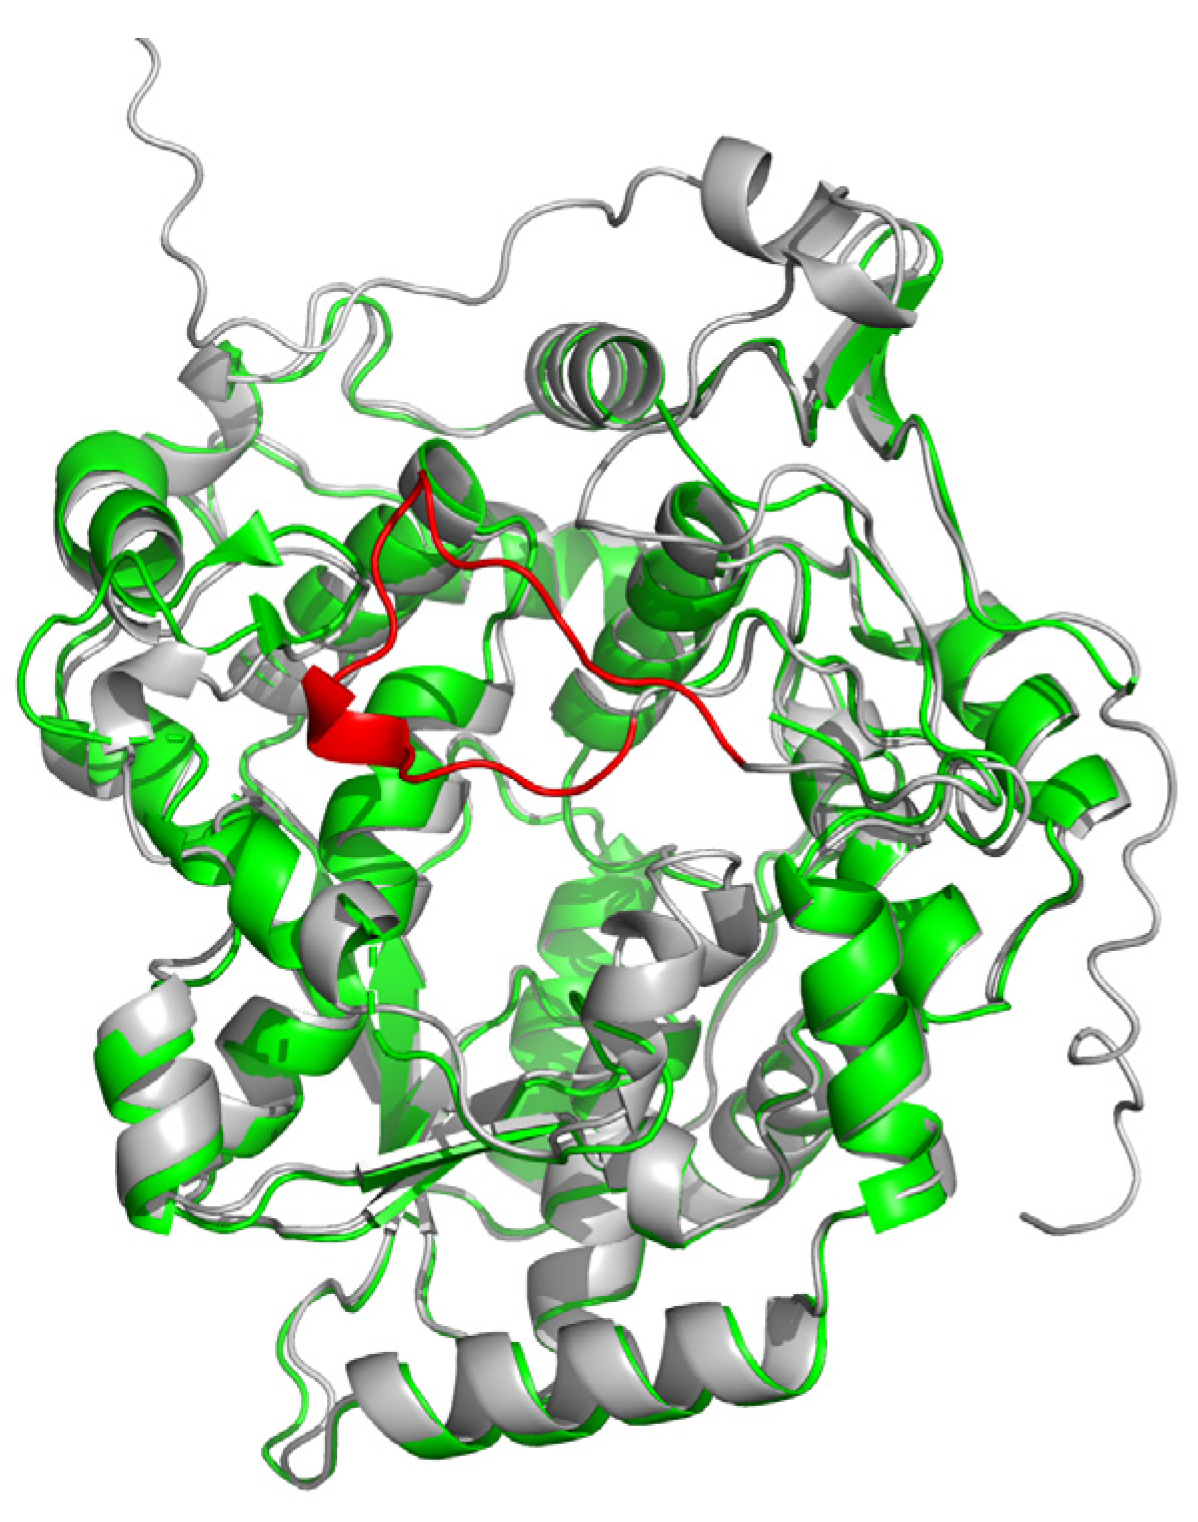
2.1. Overall Structure
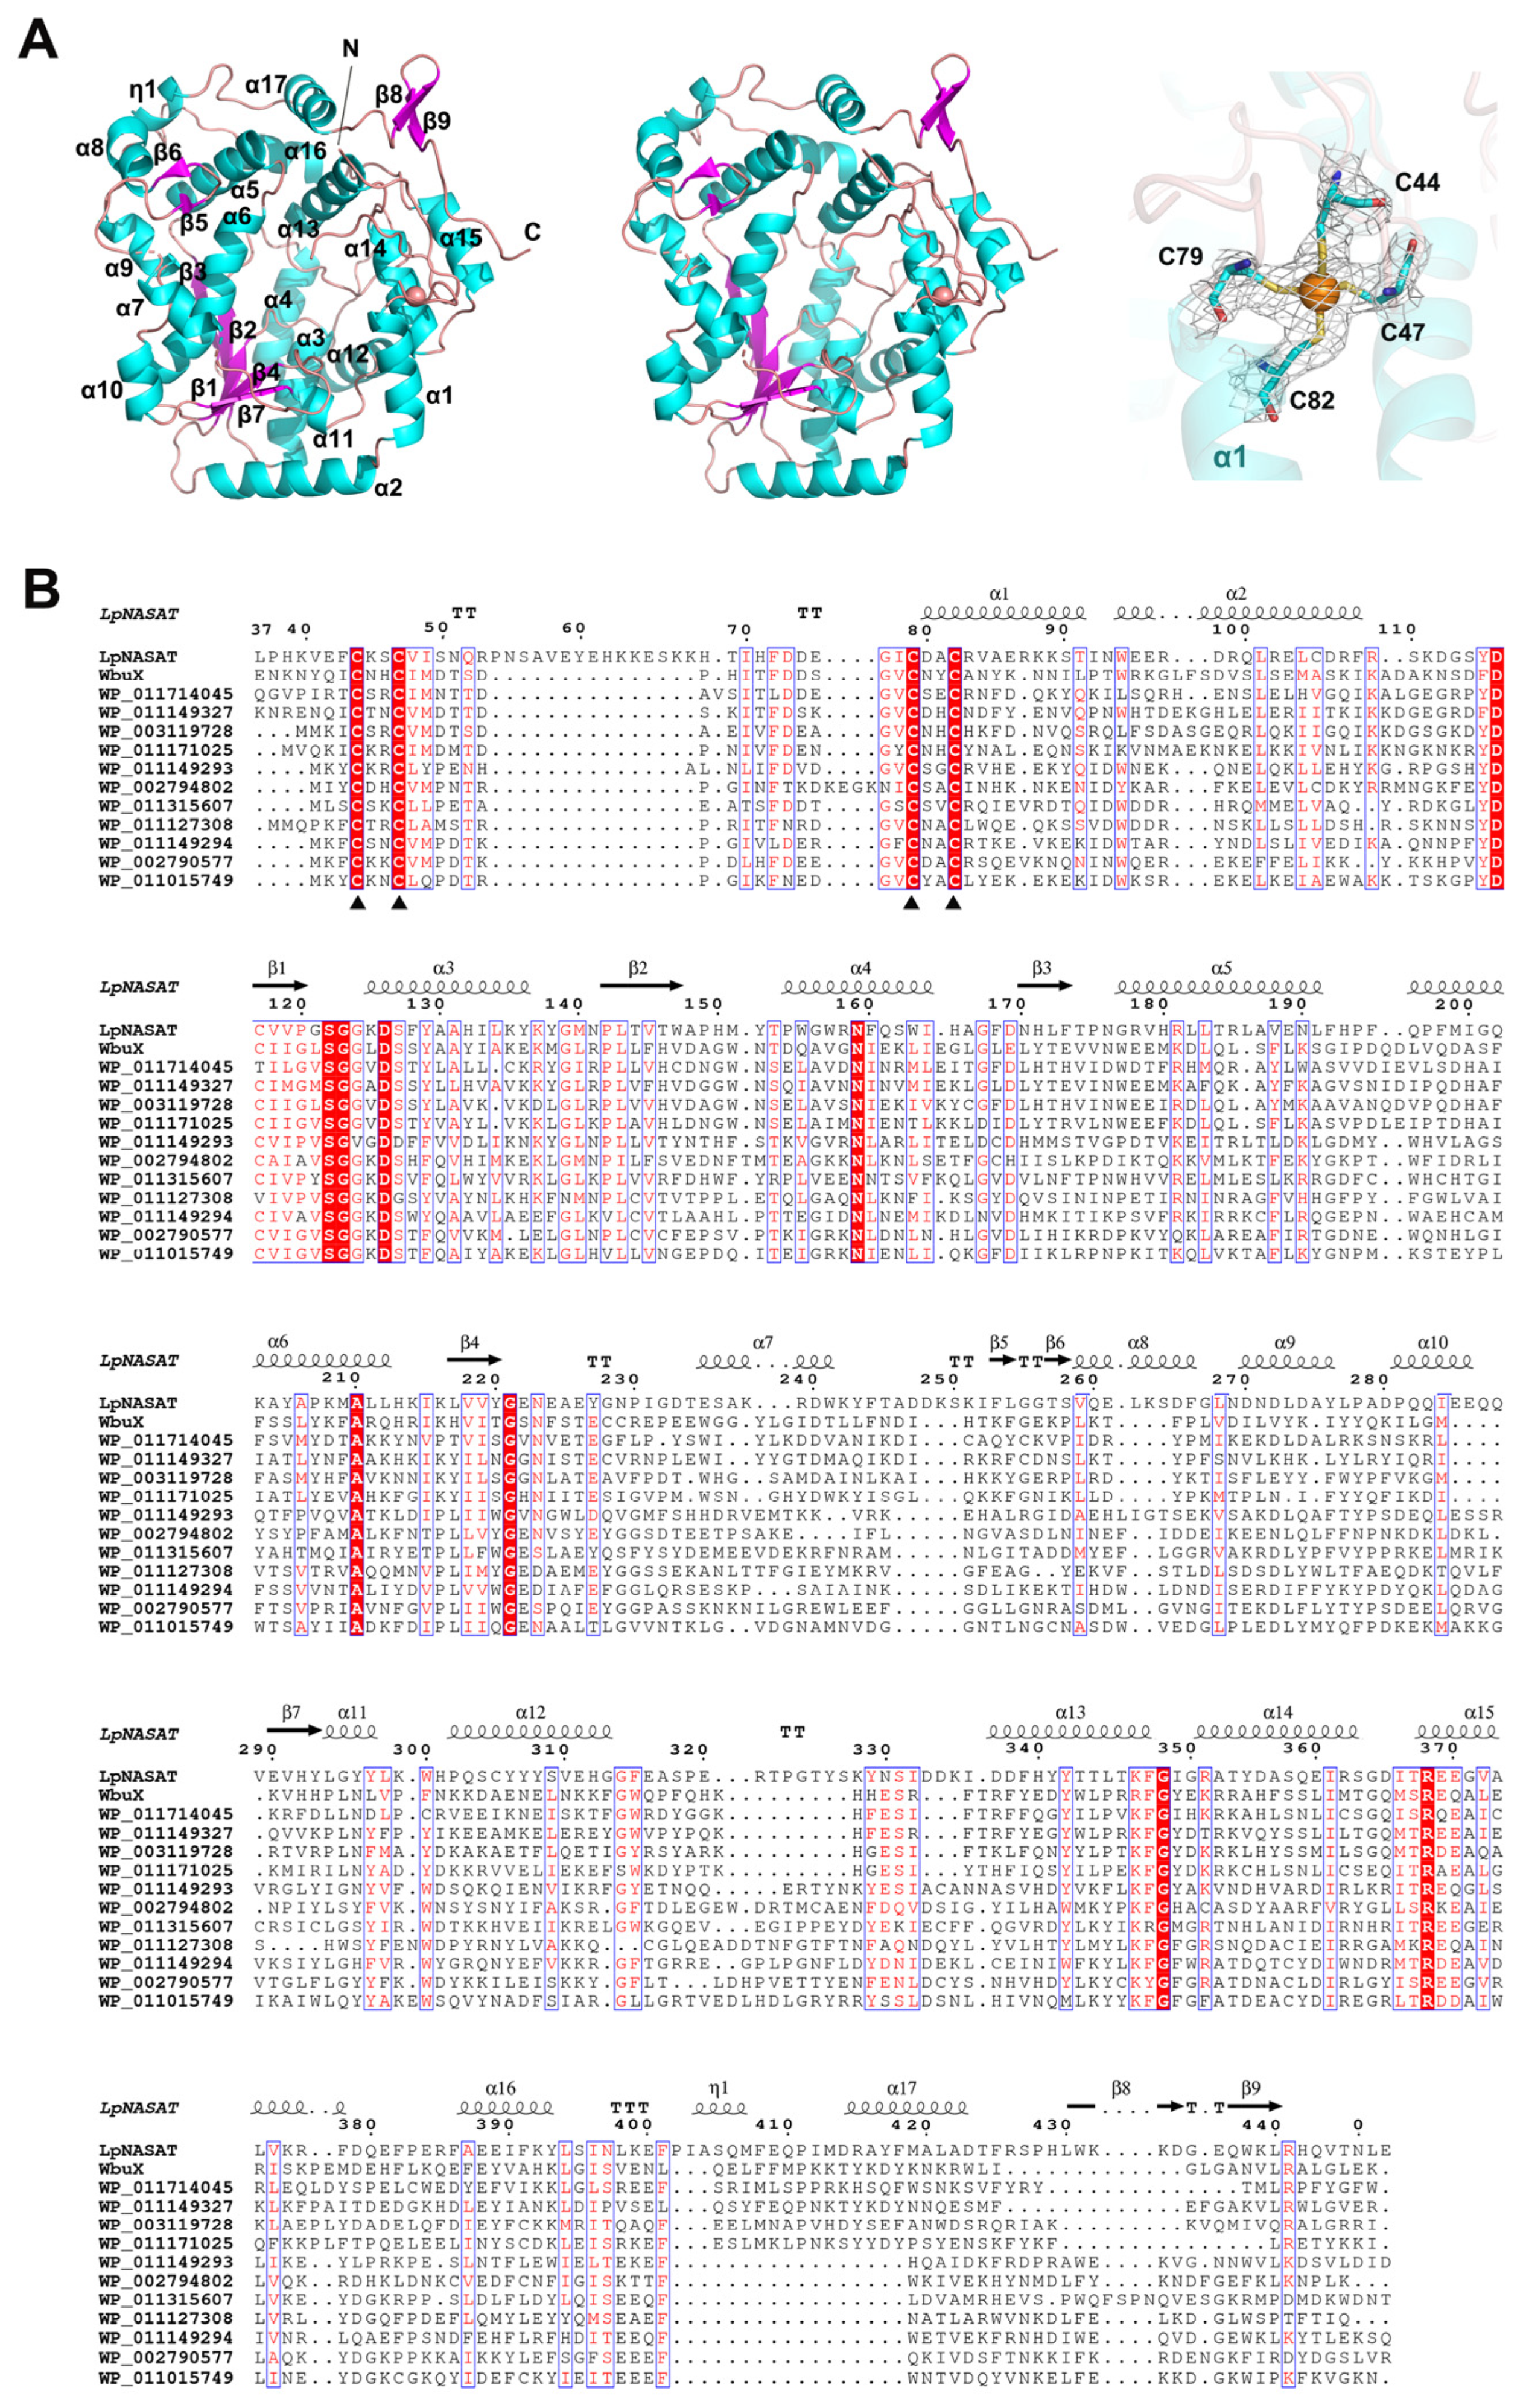
2.2. LpNASAT Crystallizes as a Dimer
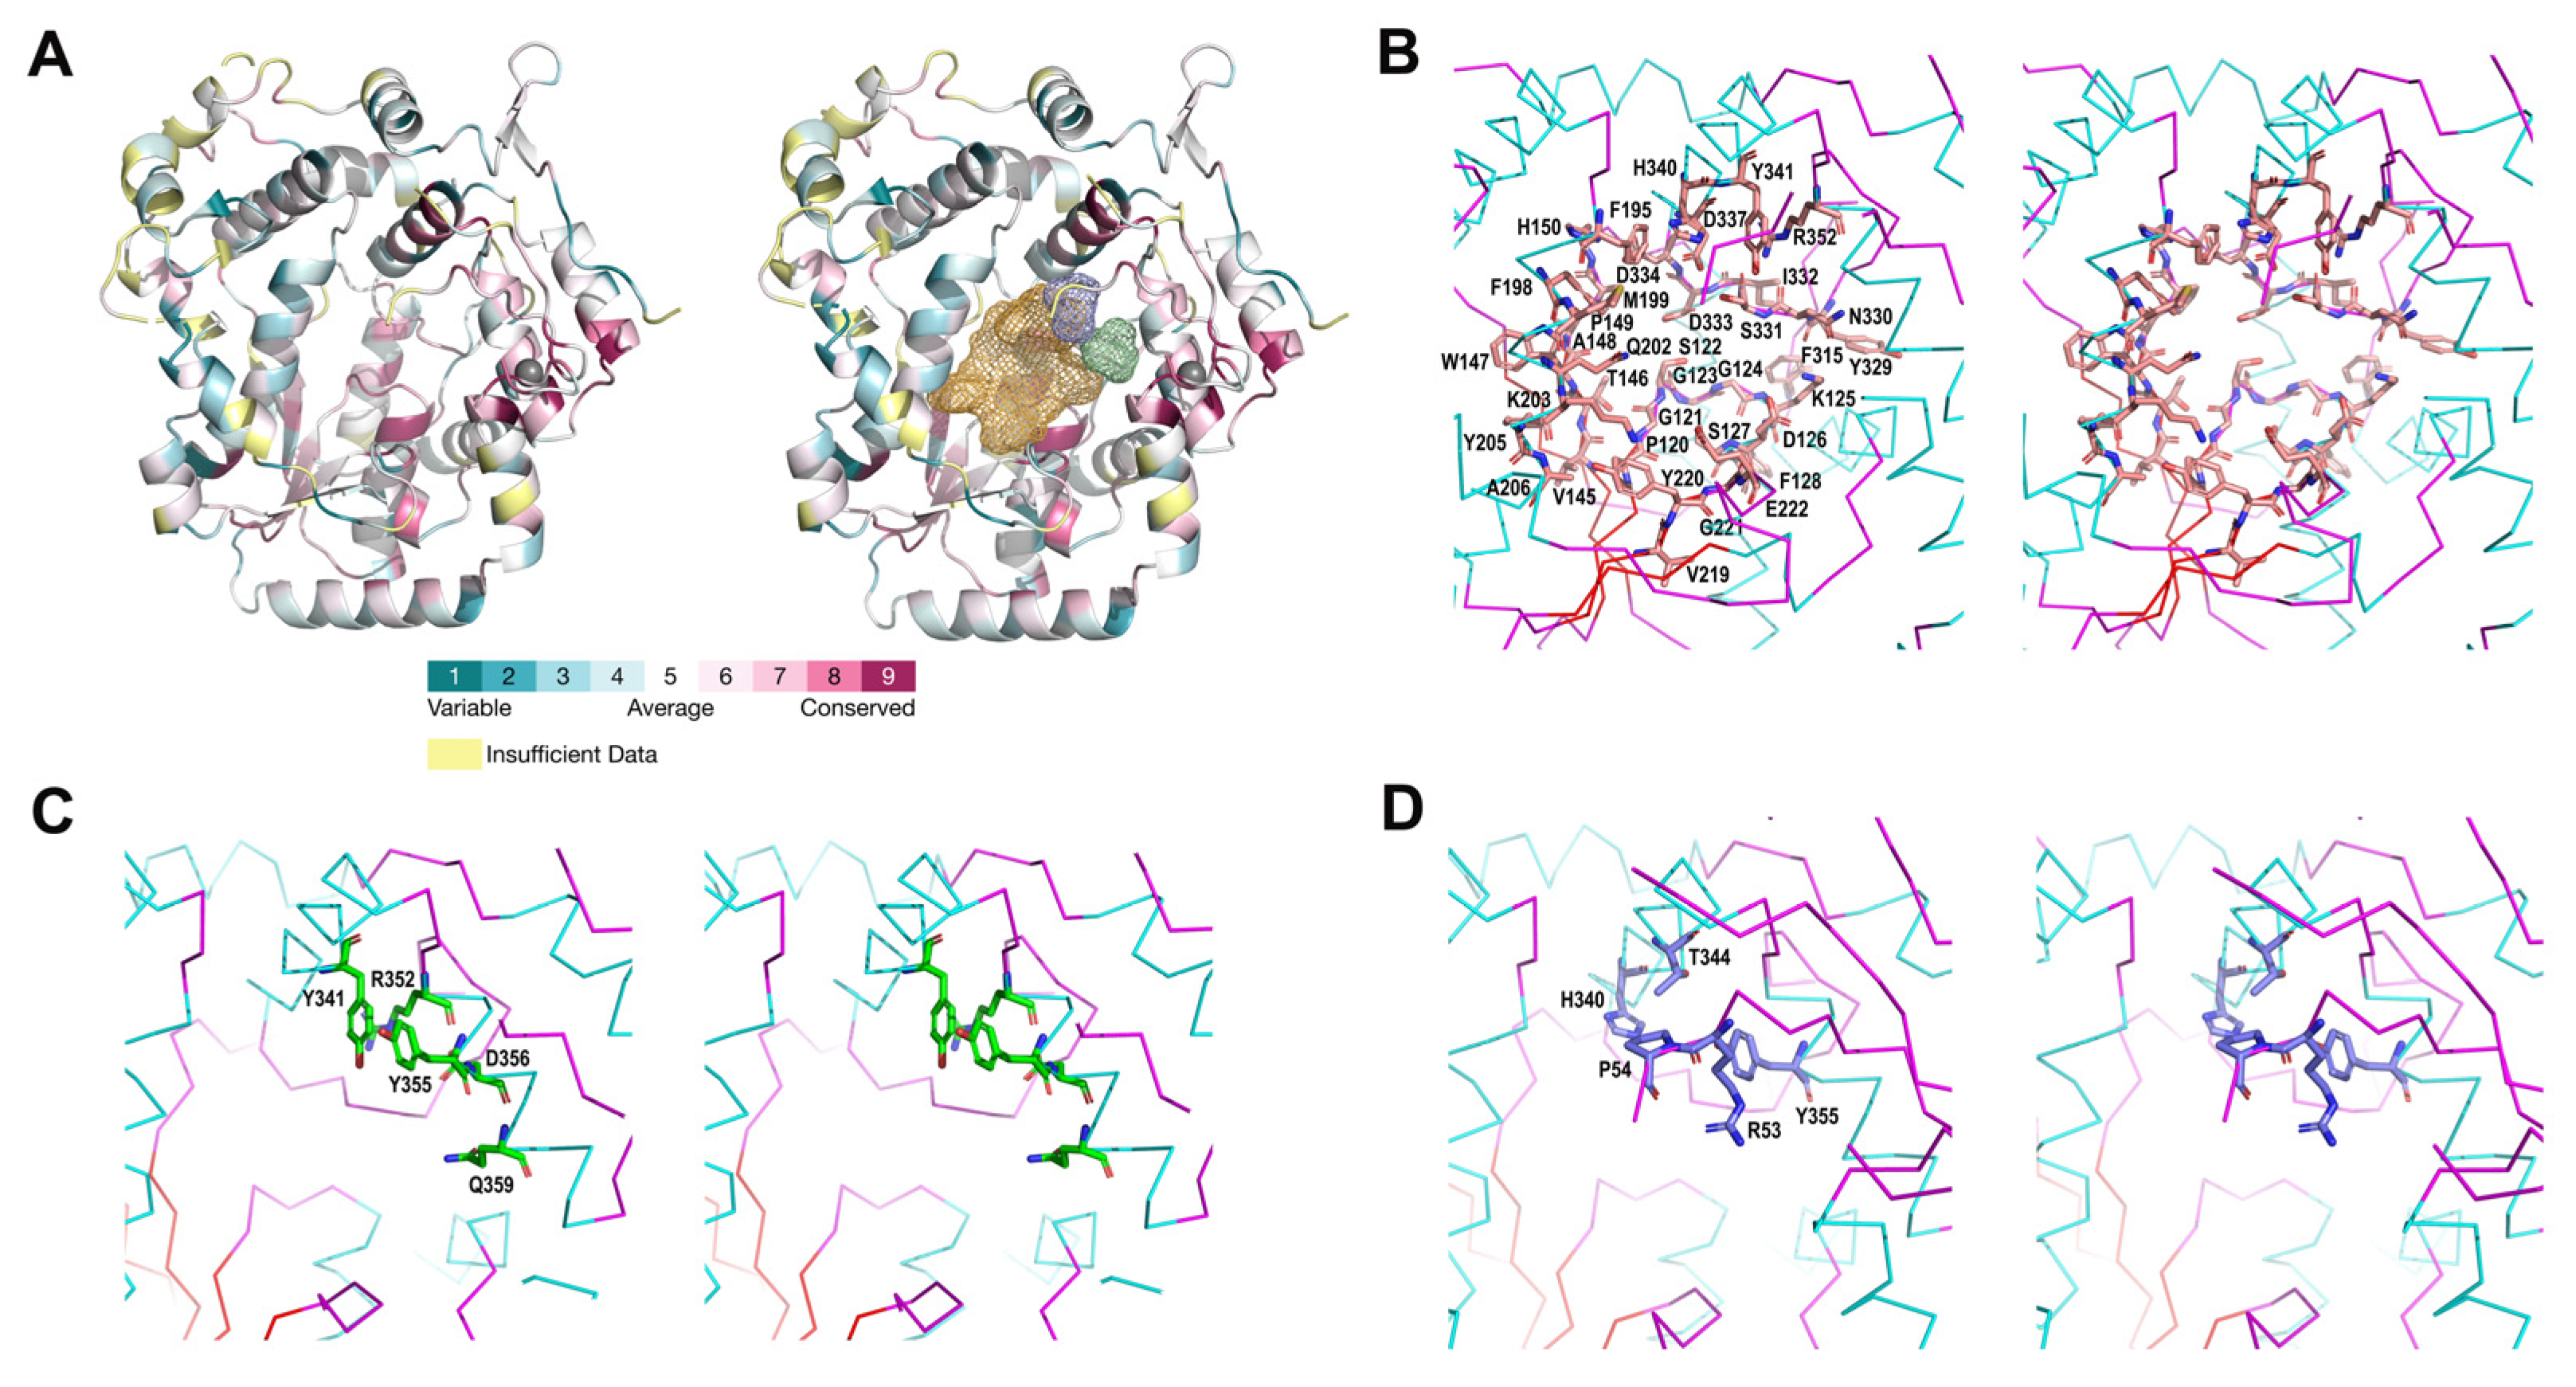
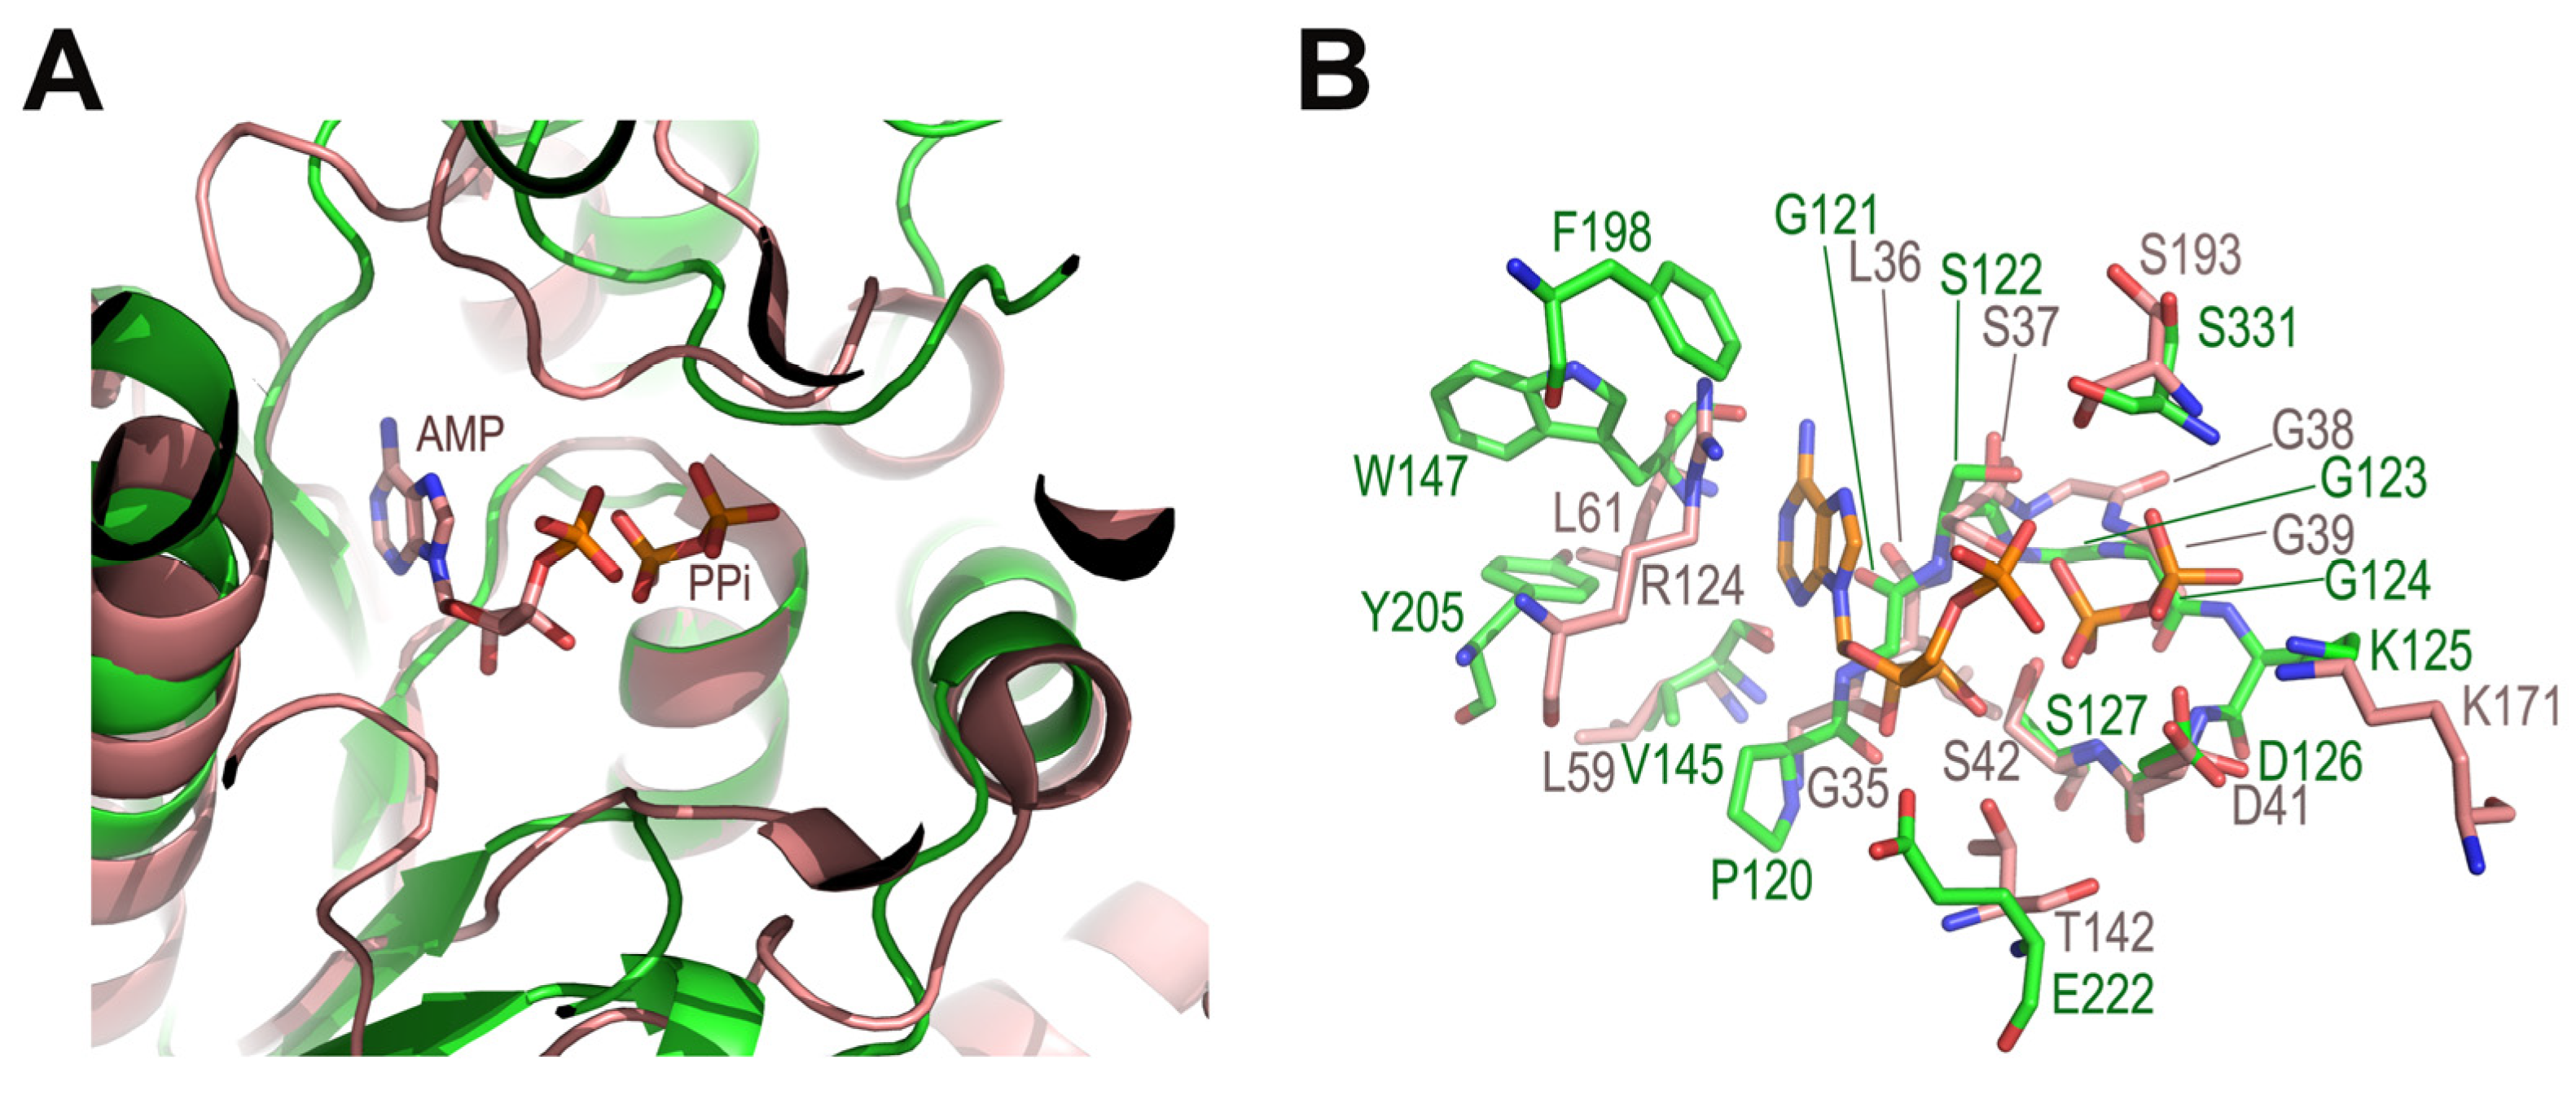
2.3. Possible Functional Regions
3. Materials and Methods
3.1. Expression and Purification of Recombinant LpNASAT
3.2. Crystallization, Data Collection and Structure Determination
3.3. Inductively Coupled Plasma Mass Spectroscopy (ICP-MS)
3.4. Size-Exclusion Chromatography
3.5. ConSurf Analysis of Evolutionary Conservation
Supplementary Materials
Author Contributions
Funding
Institutional Review Board Statement
Informed Consent Statement
Data Availability Statement
Acknowledgments
Conflicts of Interest
References
- Zhang, G.; Meredith, T.C.; Kahne, D. On the essentiality of lipopolysaccharide to Gram-negative bacteria. Curr. Opin. Microbiol. 2013, 16, 779–785. [Google Scholar] [CrossRef]
- Nikaido, H. Molecular basis of bacterial outer membrane permeability revisited. Microbiol. Mol. Biol. Rev. 2003, 67, 593–656. [Google Scholar] [CrossRef]
- Bertani, B.; Ruiz, N. Function and Biogenesis of Lipopolysaccharides. EcoSal Plus 2018, 8, 10–1128. [Google Scholar] [CrossRef] [PubMed]
- Dasgupta, T.; de Kievit, T.R.; Masoud, H.; Altman, E.; Richards, J.C.; Sadovskaya, I.; Speert, D.P.; Lam, J.S. Characterization of lipopolysaccharide-deficient mutants of Pseudomonas aeruginosa derived from serotypes O3, O5, and O6. Infect. Immun. 1994, 62, 809–817. [Google Scholar] [CrossRef] [PubMed]
- Lu, S.; Wang, J.; Chitsaz, F.; Derbyshire, M.K.; Geer, R.C.; Gonzales, N.R.; Gwadz, M.; Hurwitz, D.I.; Marchler, G.H.; Song, J.S.; et al. CDD/SPARCLE: The conserved domain database in 2020. Nucleic Acids Res. 2020, 48, D265–D268. [Google Scholar] [CrossRef] [PubMed]
- Aravind, L.; Anantharaman, V.; Koonin, E.V. Monophyly of class I aminoacyl tRNA synthetase, USPA, ETFP, photolyase, and PP-ATPase nucleotide-binding domains: Implications for protein evolution in the RNA. Proteins 2002, 48, 1–14. [Google Scholar] [CrossRef]
- King, J.D.; Kocincova, D.; Westman, E.L.; Lam, J.S. Review: Lipopolysaccharide biosynthesis in Pseudomonas aeruginosa. Innate Immun. 2009, 15, 261–312. [Google Scholar] [CrossRef]
- Rocchetta, H.L.; Burrows, L.L.; Lam, J.S. Genetics of O-antigen biosynthesis in Pseudomonas aeruginosa. Microbiol. Mol. Biol. Rev. 1999, 63, 523–553. [Google Scholar] [CrossRef]
- Feng, L.; Senchenkova, S.N.; Tao, J.; Shashkov, A.S.; Liu, B.; Shevelev, S.D.; Reeves, P.R.; Xu, J.; Knirel, Y.A.; Wang, L. Structural and genetic characterization of enterohemorrhagic Escherichia coli O145 O antigen and development of an O145 serogroup-specific PCR assay. J. Bacteriol. 2005, 187, 758–764. [Google Scholar] [CrossRef]
- Medvedev, K.E.; Kinch, L.N.; Schaeffer, R.D.; Grishin, N.V. Functional analysis of Rossmann-like domains reveals convergent evolution of topology and reaction pathways. PLoS Comput. Biol. 2019, 15, e1007569. [Google Scholar] [CrossRef]
- Arragain, S.; Bimai, O.; Legrand, P.; Caillat, S.; Ravanat, J.L.; Touati, N.; Binet, L.; Atta, M.; Fontecave, M.; Golinelli-Pimpaneau, B. Nonredox thiolation in tRNA occurring via sulfur activation by a [4Fe-4S] cluster. Proc. Natl. Acad. Sci. USA 2017, 114, 7355–7360. [Google Scholar] [CrossRef] [PubMed]
- Chen, M.; Asai, S.I.; Narai, S.; Nambu, S.; Omura, N.; Sakaguchi, Y.; Suzuki, T.; Ikeda-Saito, M.; Watanabe, K.; Yao, M.; et al. Biochemical and structural characterization of oxygen-sensitive 2-thiouridine synthesis catalyzed by an iron-sulfur protein TtuA. Proc. Natl. Acad. Sci. USA 2017, 114, 4954–4959. [Google Scholar] [CrossRef]
- Sorci, L.; Martynowski, D.; Rodionov, D.A.; Eyobo, Y.; Zogaj, X.; Klose, K.E.; Nikolaev, E.V.; Magni, G.; Zhang, H.; Osterman, A.L. Nicotinamide mononucleotide synthetase is the key enzyme for an alternative route of NAD biosynthesis in Francisella tularensis. Proc. Natl. Acad. Sci. USA 2009, 106, 3083–3088. [Google Scholar] [CrossRef]
- Fellner, M.; Rankin, J.A.; Desguin, B.; Hu, J.; Hausinger, R.P. Analysis of the Active Site Cysteine Residue of the Sacrificial Sulfur Insertase LarE from Lactobacillus plantarum. Biochemistry 2018, 57, 5513–5523. [Google Scholar] [CrossRef]
- Sievers, F.; Higgins, D.G. Clustal Omega for making accurate alignments of many protein sequences. Protein Sci. Publ. Protein Soc. 2018, 27, 135–145. [Google Scholar] [CrossRef] [PubMed]
- Robert, X.; Gouet, P. Deciphering key features in protein structures with the new ENDscript server. Nucleic Acids Res. 2014, 42, W320–W324. [Google Scholar] [CrossRef]
- Krissinel, E.; Henrick, K. Inference of macromolecular assemblies from crystalline state. J. Mol. Biol. 2007, 372, 774–797. [Google Scholar] [CrossRef] [PubMed]
- Schrodinger, LLC. The PyMOL Molecular Graphics System; Version 1.8; Schrodinger, LLC: New York, NY, USA, 2015. [Google Scholar]
- Laskowski, R.A.; Swindells, M.B. LigPlot+: Multiple ligand-protein interaction diagrams for drug discovery. J. Chem. Inf. Model. 2011, 51, 2778–2786. [Google Scholar] [CrossRef]
- Ngan, C.H.; Hall, D.R.; Zerbe, B.; Grove, L.E.; Kozakov, D.; Vajda, S. FTSite: High accuracy detection of ligand binding sites on unbound protein structures. Bioinformatics 2012, 28, 286–287. [Google Scholar] [CrossRef]
- Ashkenazy, H.; Abadi, S.; Martz, E.; Chay, O.; Mayrose, I.; Pupko, T.; Ben-Tal, N. ConSurf 2016: An improved methodology to estimate and visualize evolutionary conservation in macromolecules. Nucleic Acids Res. 2016, 44, W344–W350. [Google Scholar] [CrossRef]
- Jumper, J.; Evans, R.; Pritzel, A.; Green, T.; Figurnov, M.; Ronneberger, O.; Tunyasuvunakool, K.; Bates, R.; Zidek, A.; Potapenko, A.; et al. Highly accurate protein structure prediction with AlphaFold. Nature 2021, 596, 583–589. [Google Scholar] [CrossRef]
- Fellner, M.; Hausinger, R.P.; Hu, J. A structural perspective on the PP-loop ATP pyrophosphatase family. Crit. Rev. Biochem. Mol. 2018, 53, 607–622. [Google Scholar] [CrossRef] [PubMed]
- Wang, L.; Yun, Y.; Zhu, Z.; Niu, L. AutoPX: A new software package to process X-ray diffraction data from biomacromolecular crystals. Acta Crystallogr. D Struct. Biol. 2022, 78, 890–902. [Google Scholar] [CrossRef]
- Baek, M.; DiMaio, F.; Anishchenko, I.; Dauparas, J.; Ovchinnikov, S.; Lee, G.R.; Wang, J.; Cong, Q.; Kinch, L.N.; Schaeffer, R.D.; et al. Accurate prediction of protein structures and interactions using a three-track neural network. Science 2021, 373, 871–876. [Google Scholar] [CrossRef] [PubMed]
- McCoy, A.J.; Grosse-Kunstleve, R.W.; Adams, P.D.; Winn, M.D.; Storoni, L.C.; Read, R.J. Phaser crystallographic software. J. Appl. Crystallogr. 2007, 40, 658–674. [Google Scholar] [CrossRef]
- Emsley, P.; Lohkamp, B.; Scott, W.G.; Cowtan, K. Features and development of Coot. Acta Crystallogr. D Biol. Crystallogr. 2010, 66, 486–501. [Google Scholar] [CrossRef] [PubMed]
- Murshudov, G.N.; Skubak, P.; Lebedev, A.A.; Pannu, N.S.; Steiner, R.A.; Nicholls, R.A.; Winn, M.D.; Long, F.; Vagin, A.A. REFMAC5 for the refinement of macromolecular crystal structures. Acta Crystallogr. D Biol. Crystallogr. 2011, 67, 355–367. [Google Scholar] [CrossRef] [PubMed]
- Liebschner, D.; Afonine, P.V.; Baker, M.L.; Bunkoczi, G.; Chen, V.B.; Croll, T.I.; Hintze, B.; Hung, L.W.; Jain, S.; McCoy, A.J.; et al. Macromolecular structure determination using X-rays, neutrons and electrons: Recent developments in Phenix. Acta Crystallogr. D 2019, 75, 861–877. [Google Scholar] [CrossRef]
- Chen, V.B.; Arendall, W.B., 3rd; Headd, J.J.; Keedy, D.A.; Immormino, R.M.; Kapral, G.J.; Murray, L.W.; Richardson, J.S.; Richardson, D.C. MolProbity: All-atom structure validation for macromolecular crystallography. Acta Crystallogr. D Biol. Crystallogr. 2010, 66, 12–21. [Google Scholar] [CrossRef]
- Holm, L.; Laiho, A.; Toronen, P.; Salgado, M. DALI shines a light on remote homologs: One hundred discoveries. Protein Sci. Publ. Protein Soc. 2023, 32, e4519. [Google Scholar] [CrossRef]


| LpNASAT | |
|---|---|
| Data collection | |
| SSRF beamline | BL17U |
| Wavelength (Å) | 0.97914 |
| Space group | P3212 |
| Molecules/ASU | 2 |
| Cell parameters | |
| a/b/c (Å) α/β/γ | 74.72/74.72/319.68 90/90/120 |
| Resolution range (Å) | 45.67–2.33 (2.39–2.33) |
| No. of unique reflections | 44,179 (3210) |
| Rpim 1 (%) | 4.6 (28.6) |
| Average I/σ(I) | 19.8 (2.7) |
| CC1/2 | 0.998 (0.602) |
| Completeness (%) | 100 (100) |
| Redundancy | 17.2 (17.4) |
| Refinement | |
| PDB entry | 8WEX |
| Resolution limits (Å) | 19.99–2.33 (2.42–2.33) |
| No. of reflections | 44,010 (4224) |
| R factor 2 (%) | 20.6 (29.7) |
| Free R factor 3 (%) | 24.9 (36.5) |
| No. of protein atoms | 6236 |
| No. of ligands | 2 |
| No. of solvent molecules | 232 |
| rmsd 4 in bond lengths (Å) | 0.012 |
| rmsd in bond angles (°) | 1.51 |
| Wilson B-factor (Å2) | 45.5 |
| Average B-factor (Å2) | 55.8 |
| macromolecules | 56.0 |
| ligands | 57.0 |
| waters | 49.1 |
| Ramachandran plot (%) | |
| favored/disallowed | 96.68/0 |
Disclaimer/Publisher’s Note: The statements, opinions and data contained in all publications are solely those of the individual author(s) and contributor(s) and not of MDPI and/or the editor(s). MDPI and/or the editor(s) disclaim responsibility for any injury to people or property resulting from any ideas, methods, instructions or products referred to in the content. |
© 2023 by the authors. Licensee MDPI, Basel, Switzerland. This article is an open access article distributed under the terms and conditions of the Creative Commons Attribution (CC BY) license (https://creativecommons.org/licenses/by/4.0/).
Share and Cite
Gao, J.; Xu, W.; Liu, T.; Sun, W.; Wang, N.; Ma, J.; Ge, H. Structural Characterization of an N-Acetyl Sugar Amidotransferase Involved in the Lipopolysaccharide Biosynthesis in Bacteria. Int. J. Mol. Sci. 2023, 24, 15491. https://doi.org/10.3390/ijms242015491
Gao J, Xu W, Liu T, Sun W, Wang N, Ma J, Ge H. Structural Characterization of an N-Acetyl Sugar Amidotransferase Involved in the Lipopolysaccharide Biosynthesis in Bacteria. International Journal of Molecular Sciences. 2023; 24(20):15491. https://doi.org/10.3390/ijms242015491
Chicago/Turabian StyleGao, Jiajia, Wenwen Xu, Tianqi Liu, Wenjie Sun, Na Wang, Jinming Ma, and Honghua Ge. 2023. "Structural Characterization of an N-Acetyl Sugar Amidotransferase Involved in the Lipopolysaccharide Biosynthesis in Bacteria" International Journal of Molecular Sciences 24, no. 20: 15491. https://doi.org/10.3390/ijms242015491
APA StyleGao, J., Xu, W., Liu, T., Sun, W., Wang, N., Ma, J., & Ge, H. (2023). Structural Characterization of an N-Acetyl Sugar Amidotransferase Involved in the Lipopolysaccharide Biosynthesis in Bacteria. International Journal of Molecular Sciences, 24(20), 15491. https://doi.org/10.3390/ijms242015491