Article

Characterizing Early Cardiac Metabolic Programming via 30% Maternal Nutrient Reduction during Fetal Development in a Non-Human Primate Model

by
Susana P. Pereira
1,2,3,4,*,
Mariana S. Diniz
2,5,
Ludgero C. Tavares
2,6,
Teresa Cunha-Oliveira
2,
Cun Li
7,
Laura A. Cox
8,9,10,11,
Mark J. Nijland
4,
Peter W. Nathanielsz
8 and
Paulo J. Oliveira
2,3
1
Laboratory of Metabolism and Exercise (LaMetEx), Research Centre in Physical Activity, Health and Leisure (CIAFEL), Laboratory for Integrative and Translational Research in Population Health (ITR), Faculty of Sports, University of Porto, 4200-450 Porto, Portugal
2
CNC-UC, Center for Neuroscience and Cell Biology, University of Coimbra, 3004-504 Coimbra, Portugal
3
CIBB—Centre for Innovative Biomedicine and Biotechnology, University of Coimbra, 3004-504 Coimbra, Portugal
4
Center for Pregnancy and Newborn Research, University of Texas Health Science Center at San Antonio, San Antonio, TX 78229, USA
5
PDBEB—Ph.D. Programme in Experimental Biology and Biomedicine, Institute for Interdisciplinary Research (IIIUC), University of Coimbra, 3030-789 Coimbra, Portugal
6
CIVG—Vasco da Gama Research Center, University School Vasco da Gama—EUVG, 3020-210 Coimbra, Portugal
7
Texas Pregnancy & Life-Course Health Research Center, Department of Animal Science, University of Wyoming, Laramie, WY 82071, USA
8
Center for Precision Medicine, Wake Forest University Health Sciences, Winston-Salem, NC 27157, USA
9
Section on Molecular Medicine, Department of Internal Medicine, Wake Forest University School of Medicine, Winston-Salem, NC 27157, USA
10
Southwest National Primate Research Center, Texas Biomedical Research Institute, San Antonio, TX 78227, USA
11
Section on Comparative Medicine, Department of Pathology, Wake Forest University School of Medicine, Winston-Salem, NC 27157, USA
*
Author to whom correspondence should be addressed.
Int. J. Mol. Sci. 2023, 24(20), 15192; https://doi.org/10.3390/ijms242015192
Submission received: 9 August 2023 / Revised: 28 September 2023 / Accepted: 6 October 2023 / Published: 14 October 2023
(This article belongs to the Special Issue Heartfulness: Contributors of Healthy and Unhealthy Cardiac Aging)

Abstract

:
Intra-uterine growth restriction (IUGR) is a common cause of fetal/neonatal morbidity and mortality and is associated with increased offspring predisposition for cardiovascular disease (CVD) development. Mitochondria are essential organelles in maintaining cardiac function, and thus, fetal cardiac mitochondria could be responsive to the IUGR environment. In this study, we investigated whether in utero fetal cardiac mitochondrial programming can be detectable in an early stage of IUGR pregnancy. Using a well-established nonhuman IUGR primate model, we induced IUGR by reducing by 30% the maternal diet (MNR), both in males (MNR-M) and in female (MNR-F) fetuses. Fetal cardiac left ventricle (LV) tissue and blood were collected at 90 days of gestation (0.5 gestation, 0.5 G). Blood biochemical parameters were determined and heart LV mitochondrial biology assessed. MNR fetus biochemical blood parameters confirm an early fetal response to MNR. In addition, we show that in utero cardiac mitochondrial MNR adaptations are already detectable at this early stage, in a sex-divergent way. MNR induced alterations in the cardiac gene expression of oxidative phosphorylation (OXPHOS) subunits (mostly for complex-I, III, and ATP synthase), along with increased protein content for complex-I, -III, and -IV subunits only for MNR-M in comparison with male controls, highlight the fetal cardiac sex-divergent response to MNR. At this fetal stage, no major alterations were detected in mitochondrial DNA copy number nor markers for oxidative stress. This study shows that in 90-day nonhuman primate fetuses, a 30% decrease in maternal nutrition generated early in utero adaptations in fetal blood biochemical parameters and sex-specific alterations in cardiac left ventricle gene and protein expression profiles, affecting predominantly OXPHOS subunits. Since the OXPHOS system is determinant for energy production in mitochondria, our findings suggest that these early IUGR-induced mitochondrial adaptations play a role in offspring’s mitochondrial dysfunction and can increase predisposition to CVD in a sex-specific way.

1. Introduction

Cardiovascular disease (CVD) incidence is increasing worldwide at an alarming rate, especially among the young adult population [1,2]. In comparison with >50-year-old adults, the incidence of CVD for younger adults for the same period is either similar or has increased [1]. CVD risk is sex-specific, since men present an increased risk to develop CVD at an earlier stage in life than women [3].
It is now well accepted that maternal nutrition influences the intrauterine environment and, consequently, the offspring’s short- and long-term health [4,5]. Maternal nutrient restriction is a common cause of intrauterine growth restriction (IUGR) [6], in which the fetus might not reach its full growth potential [7]. Multiple studies have provided evidence that fetuses experiencing nutrient deprivation during development exhibit a phenotype characterized by being born small for gestational age (SGA) [8]. These infants often display cardiovascular abnormalities in comparison to infants who have achieved appropriate size for gestational age. Additionally, these individuals commonly exhibit impaired heart systolic and diastolic functions [9]. Animal studies support progeny’s cardiac remodeling in IUGR conditions characterized by reduced cardiomyocyte maturation [10], and increased apoptotic rates [9].
Using a well-established nonhuman IUGR primate model of moderate maternal nutrient reduction (MNR), which consisted of a 30% nutrient reduction in comparison with control mothers, and that shares a high level of gene homology with humans (94%) [11], we previously showed that term IUGR offspring (165 days old—0.9 gestation, 0.9 G) [12] exhibited disrupted cardiac mitochondrial fitness, with a two-fold increase in fetal cardiac left ventricle (LV) mitochondrial DNA (mtDNA), increased transcripts levels for several respiratory chain subunits and increased abundance for the mitochondrial proteins NADH dehydrogenase (ubiquinone) 1 beta subcomplex, 8 (NDUFB8), ubiquinol-cytochrome c reductase core protein I (UQCRC1), and cytochrome c and adenosine triphosphate (ATP) synthase. However, IUGR fetal cardiac mitochondria displayed significantly decreased complex-I and -II/III activities, possibly contributing to the 73% decreased ATP content and increased lipid peroxidation. The impairment of oxidative phosphorylation (OXPHOS) due to mitochondrial oxidative damage can contribute to an exacerbation of reactive oxygen species (ROS) production and oxidative disturbances [13]. This creates a detrimental feedback loop, where increased ROS production further damages mitochondria and perpetuates oxidative stress [14]. MNR fetal left ventricle (LV) also showed mitochondrial dysmorphology with sparse and disarranged cristae. Furthermore, our findings demonstrated that MNR induced sex-specific adaptations in cardiac mitochondrial biology among term fetuses in this animal model [12]. This suggests that an early-impaired cardiac mitochondrial function could predispose MNR offspring to an increased CVD risk later in life [12]. Right before birth, term MNR fetuses presented cardiac structural and functional alterations (i.e., extracellular fibrosis, miRNA expression levels, lipid metabolism [12]), which could be indicative of MNR-induced early cardiac adverse adaptations in this animal model [12]. After birth, MNR offspring presented 11% less weight than control offspring [15]. In fact, in this non-human primate (NHP) model, 3.5-year-old MNR offspring fed a control diet postnatally presented cardiac abnormalities, such as myocardial remodeling, impaired physiological function in both ventricles and altered diastolic and systolic functions [12,16]. During the young and adult phases of the offspring, mitochondrial dysfunction can become accentuated, leading to an increased occurrence of mitophagy (selective degradation of damaged mitochondria [17]) and mitochondrial membrane permeabilization [18]. This process enables the release of mitochondrial DNA (mtDNA) into the cytosol [19], which, in turn, activates inflammatory [20] and apoptotic pathways [21]. In utero programming of mitochondrial function likely contributes to the documented developmental programming of adult cardiac dysfunction, indicating a programmed mitochondrial inability to deliver sufficient energy to cardiac tissues as a chronic mechanism for later-life heart failure [22]. However, little is known about the in utero fetal cardiac mitochondrial nutritional plasticity and how early these metabolic adaptations can be detected. This information is relevant to understanding the etiology of several mitochondrial-related human diseases.
Despite the glycolytic dependence of fetal cardiomyocytes [23] and that during early embryonic stages, oxygen availability is reduced in comparison with postnatal stages [24] (highly aggravated by IUGR, which has been suggested to induce a hypoxic environment) and mitochondrial OXPHOS system activity is decreased [25], mitochondria play a crucial role supporting early-stage fetal growth [26] and cardiac development [27]. For instance, mitochondrial oxidative metabolism is essential for cardiac differentiation from embryonic stem cells (i.e., cardiac specification and contraction ability) [28,29], which starts in the first few weeks of pregnancy both in humans and in NHP [30,31]. Currently, it still remains unknown at which fetal stage MNR-induced cardiac mitochondrial-related alterations first occur. Thus, this study aimed to determine whether a 30% global MNR induces detectable in utero adaptations on fetal baboon left cardiac ventricular mitochondrial transcripts and protein content at the mid-gestation period (0.5 gestation, 0.5 G) and whether these are sex-specific. We hypothesized that maternal malnutrition during pregnancy impairs in utero fetal cardiac mitochondrial regulation at an early stage during fetal development, imprinting cardiac adaptations during the prenatal period that may impact postnatal mitochondrial cardiac function, contributing to offspring’s increased risk of CVD later in life.

2. Results

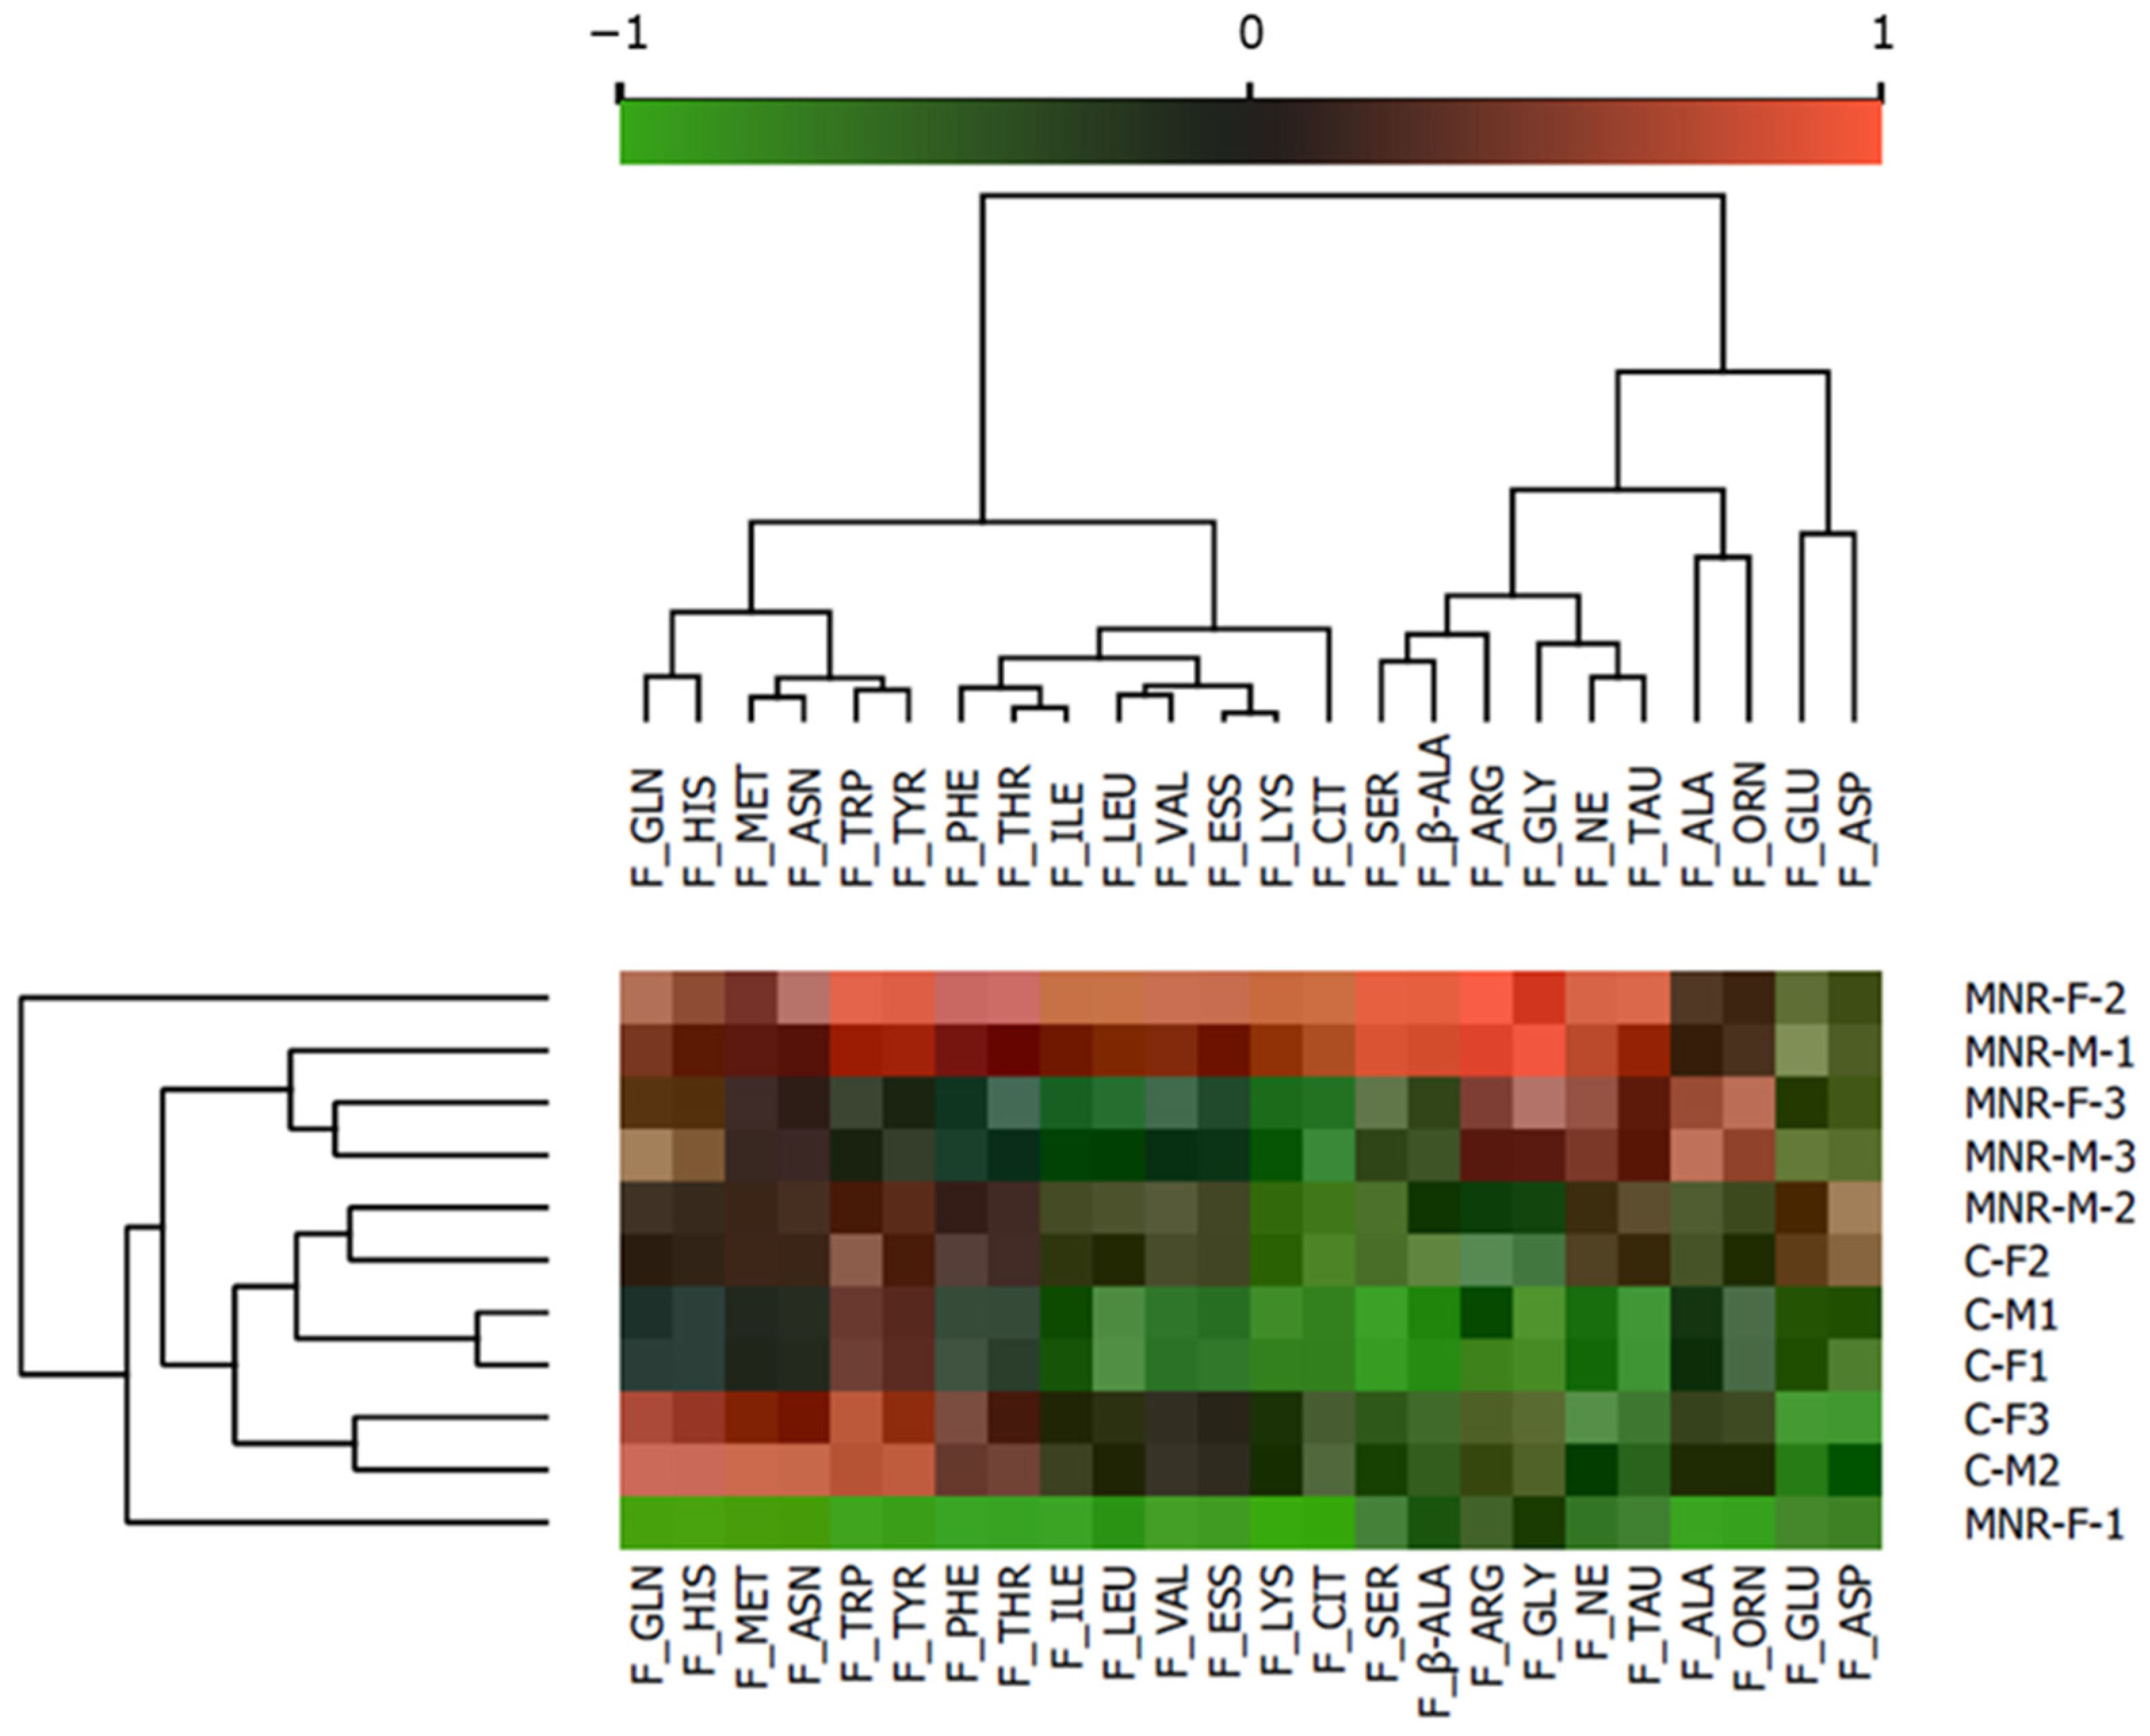
2.1. MNR-Induced Maternal and Fetal Morphometrics Alterations Accompained by Fetal Blood Biochemistry Changes

Non-pregnant outbred female baboons (Papio spp.) with similar morphometrics, including pre-pregnancy body weight (13.9 ± 0.5 vs. 14.26 ± 0.6), were randomly assigned to the Control (C) or MNR group. After diet treatment, maternal weight variation differed between groups, being increased for MNR mothers vs. C mothers (−0.11 ± 0.12 vs. −0.72 ± 0.15 kg; p = 0.008) (Table 1).
As for fetal morphometrics (Table 1) and blood parameters (Table 2), fetal weight did not vary between groups at 0.5 G (101.1 ± 3.2 vs. 101.2 ± 3.0 g). The heart weight to body weight (HW/BW) ratio was increased for C-Females (F) in comparison with C-M (11.1 ± 3.7 vs. 5.5 ± 0.6; p = 0.047). For the same group, C-F fetal body mass index was decreased vs. C-M (3.1 ± 0.1 vs. 3.6 ± 0.2; p = 0.045). Fetal blood biochemical analysis revealed that fetal glucose circulating levels were decreased for MNR-F vs. C-F (34.7 ± 2.7 vs. 52.2 ± 3.4; p = 0.036). This was not observed for maternal blood glucose concentration. Interestingly, fetal blood urea nitrogen (BUN) was decreased for MNR vs. C (8.0 ± 0.5 vs. 11.0 ± 0.6; p = 0.004), being more evident for MNR-F vs. C-F (8.7 ± 0.7 vs. 11.6 ± 0.6; p = 0.016), and for C-F vs. C-M (11.6 ± 0.6 vs. 9.5 ± 0.5; p = 0.033). Fetal BUN/creatinine ratio was decreased for MNR vs. C (10.0 ± 1.0 vs. 14.0 ± 1.0; p = 0.035) (Table 2).
The cluster heatmap analysis identified a reasonable separation between the experimental groups’ amino acid blood levels, resulting in well-formed clusters as seen in the heatmap (Figure 1). In general, MNR amino acid blood levels were increased in comparison with the C group. The differences between both groups were more pronounced in alanine, glycine, and taurine, all of which were increased in MNR vs. C, in agreement with published data for this model [6].

2.2. No Alterations Were Detected in Cardiac Mitochondrial DNA Copy Number

To evaluate MNR-induced effects on mitochondrial biology, mtDNA copy number was determined via qRT-PCR, which was calculated by the ratio between the absolute amount of mitochondrial gene ND1 versus the absolute amount of the B2M nuclear gene for each sample. No statistically significant differences were detected for LV cardiac mtDNA copy number at 0.5 G between C and MNR offspring (Figure S1).

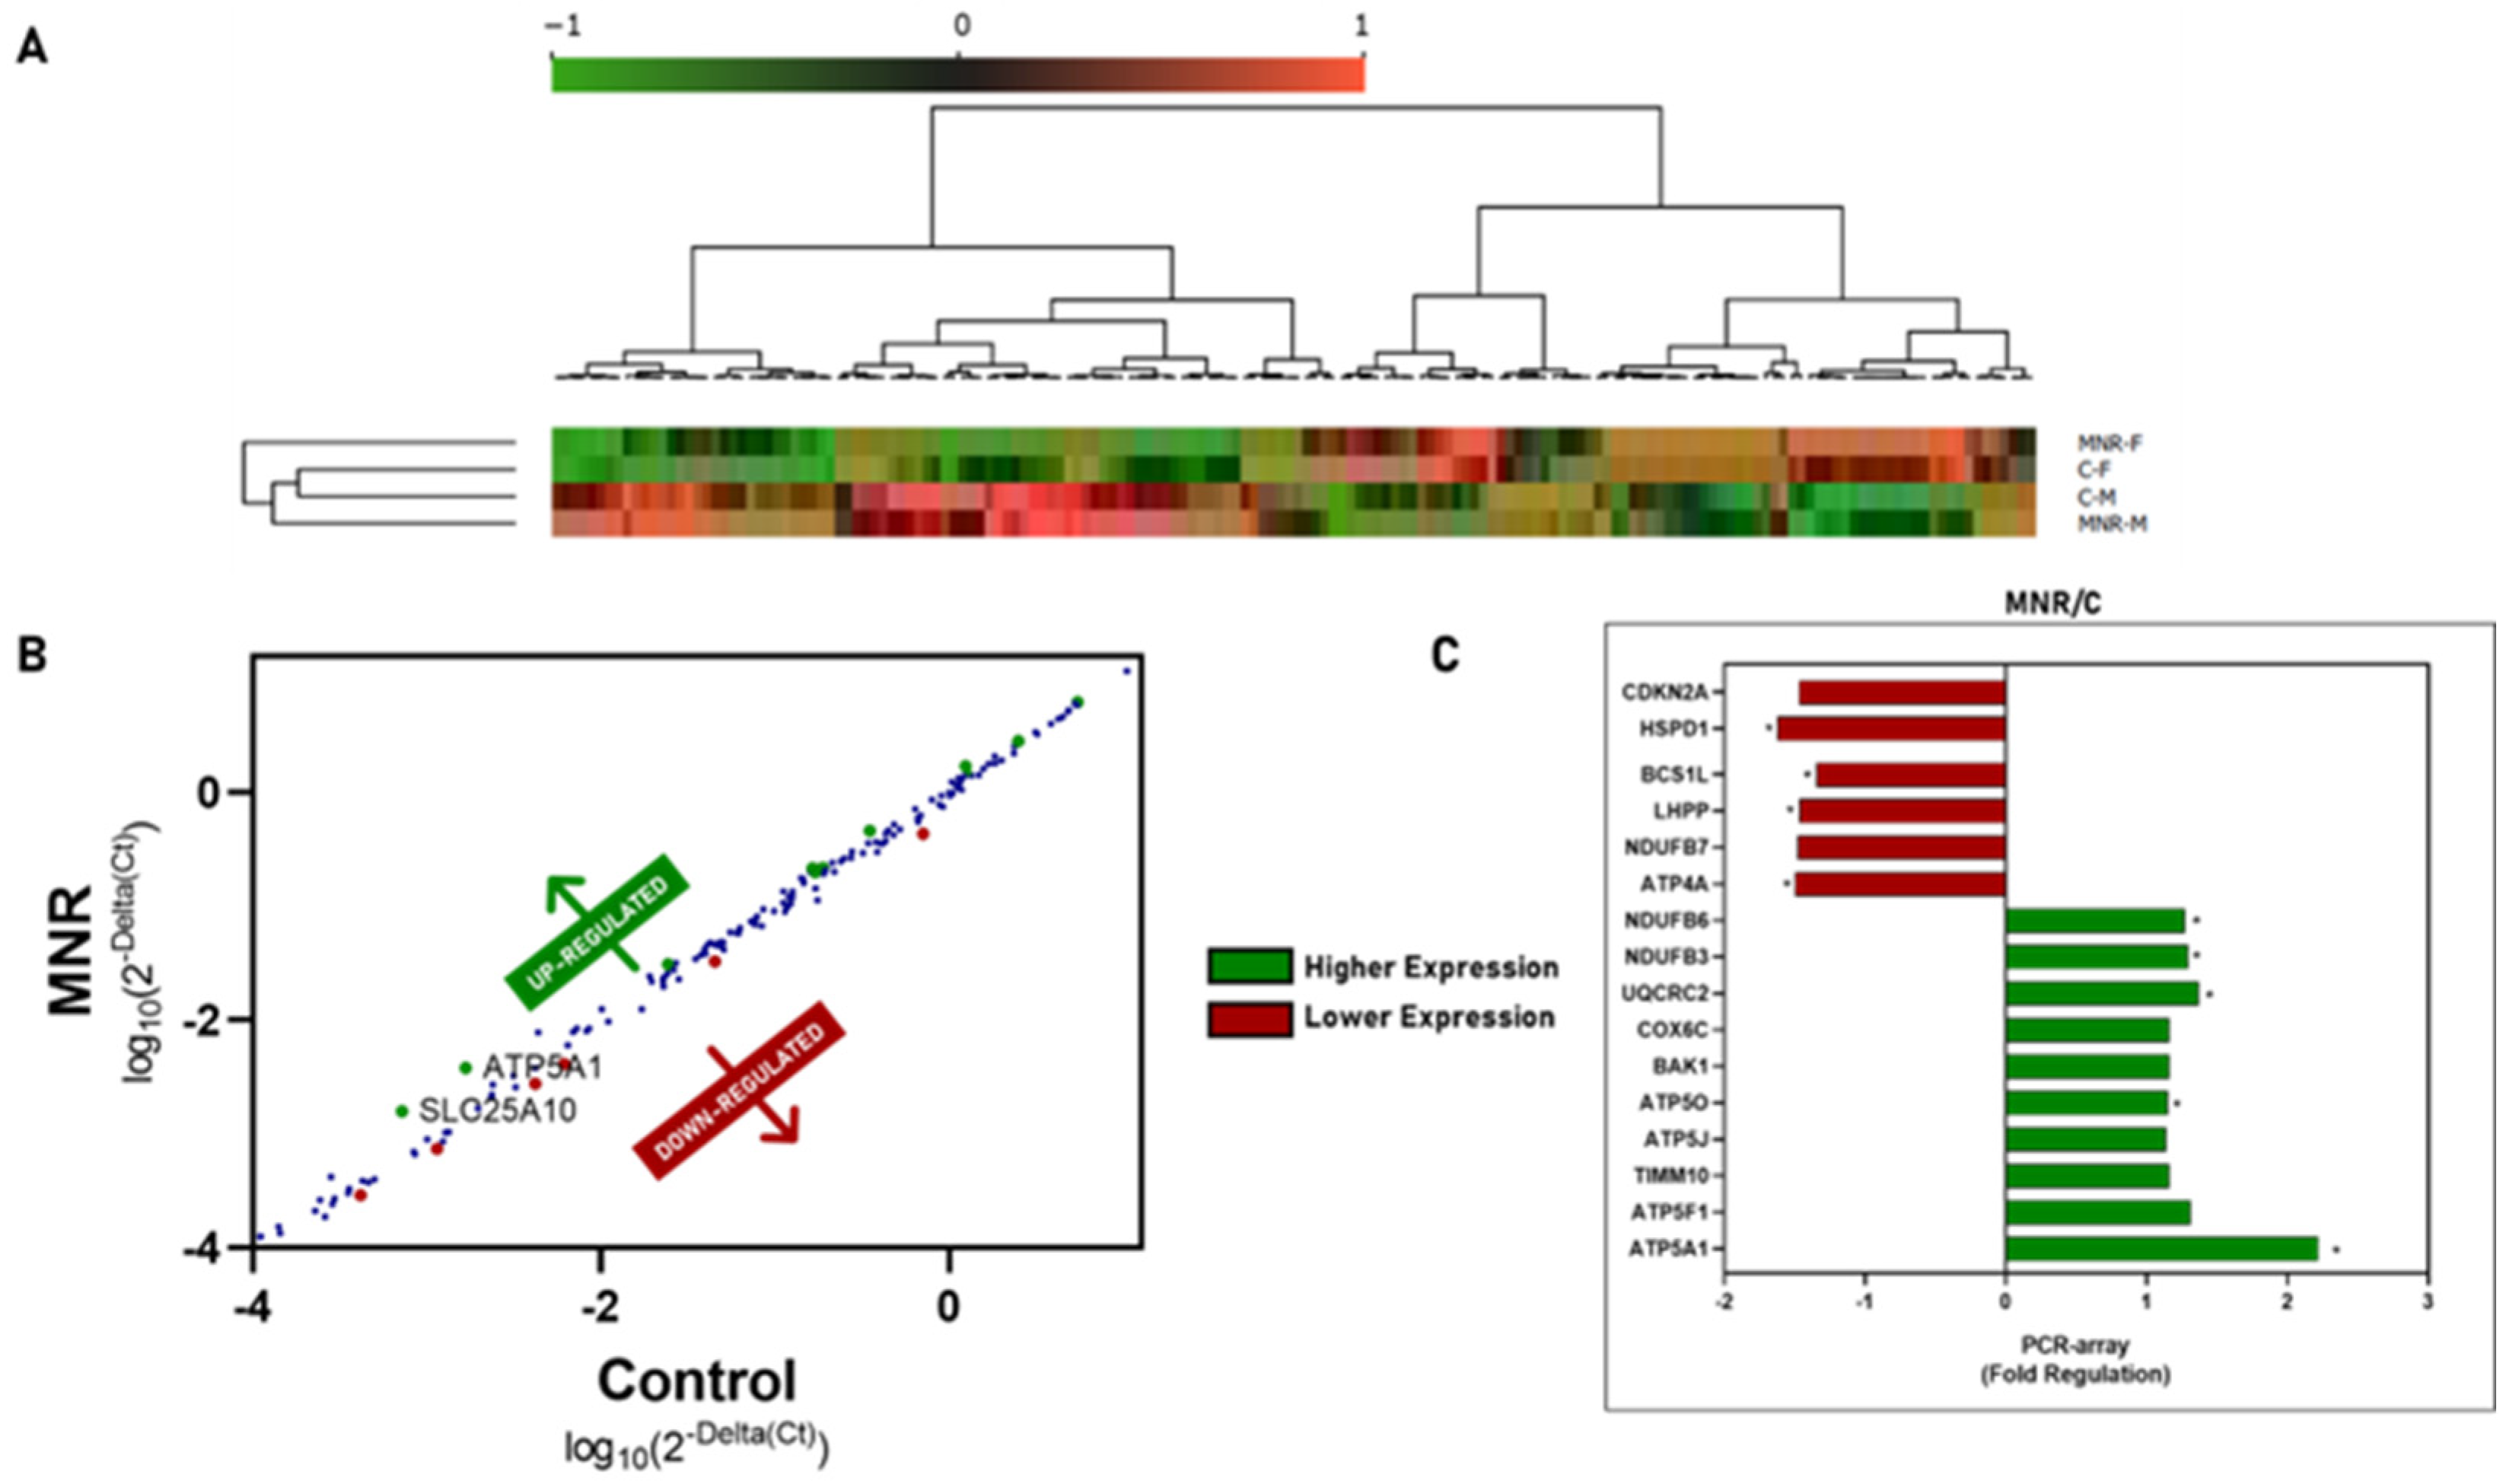
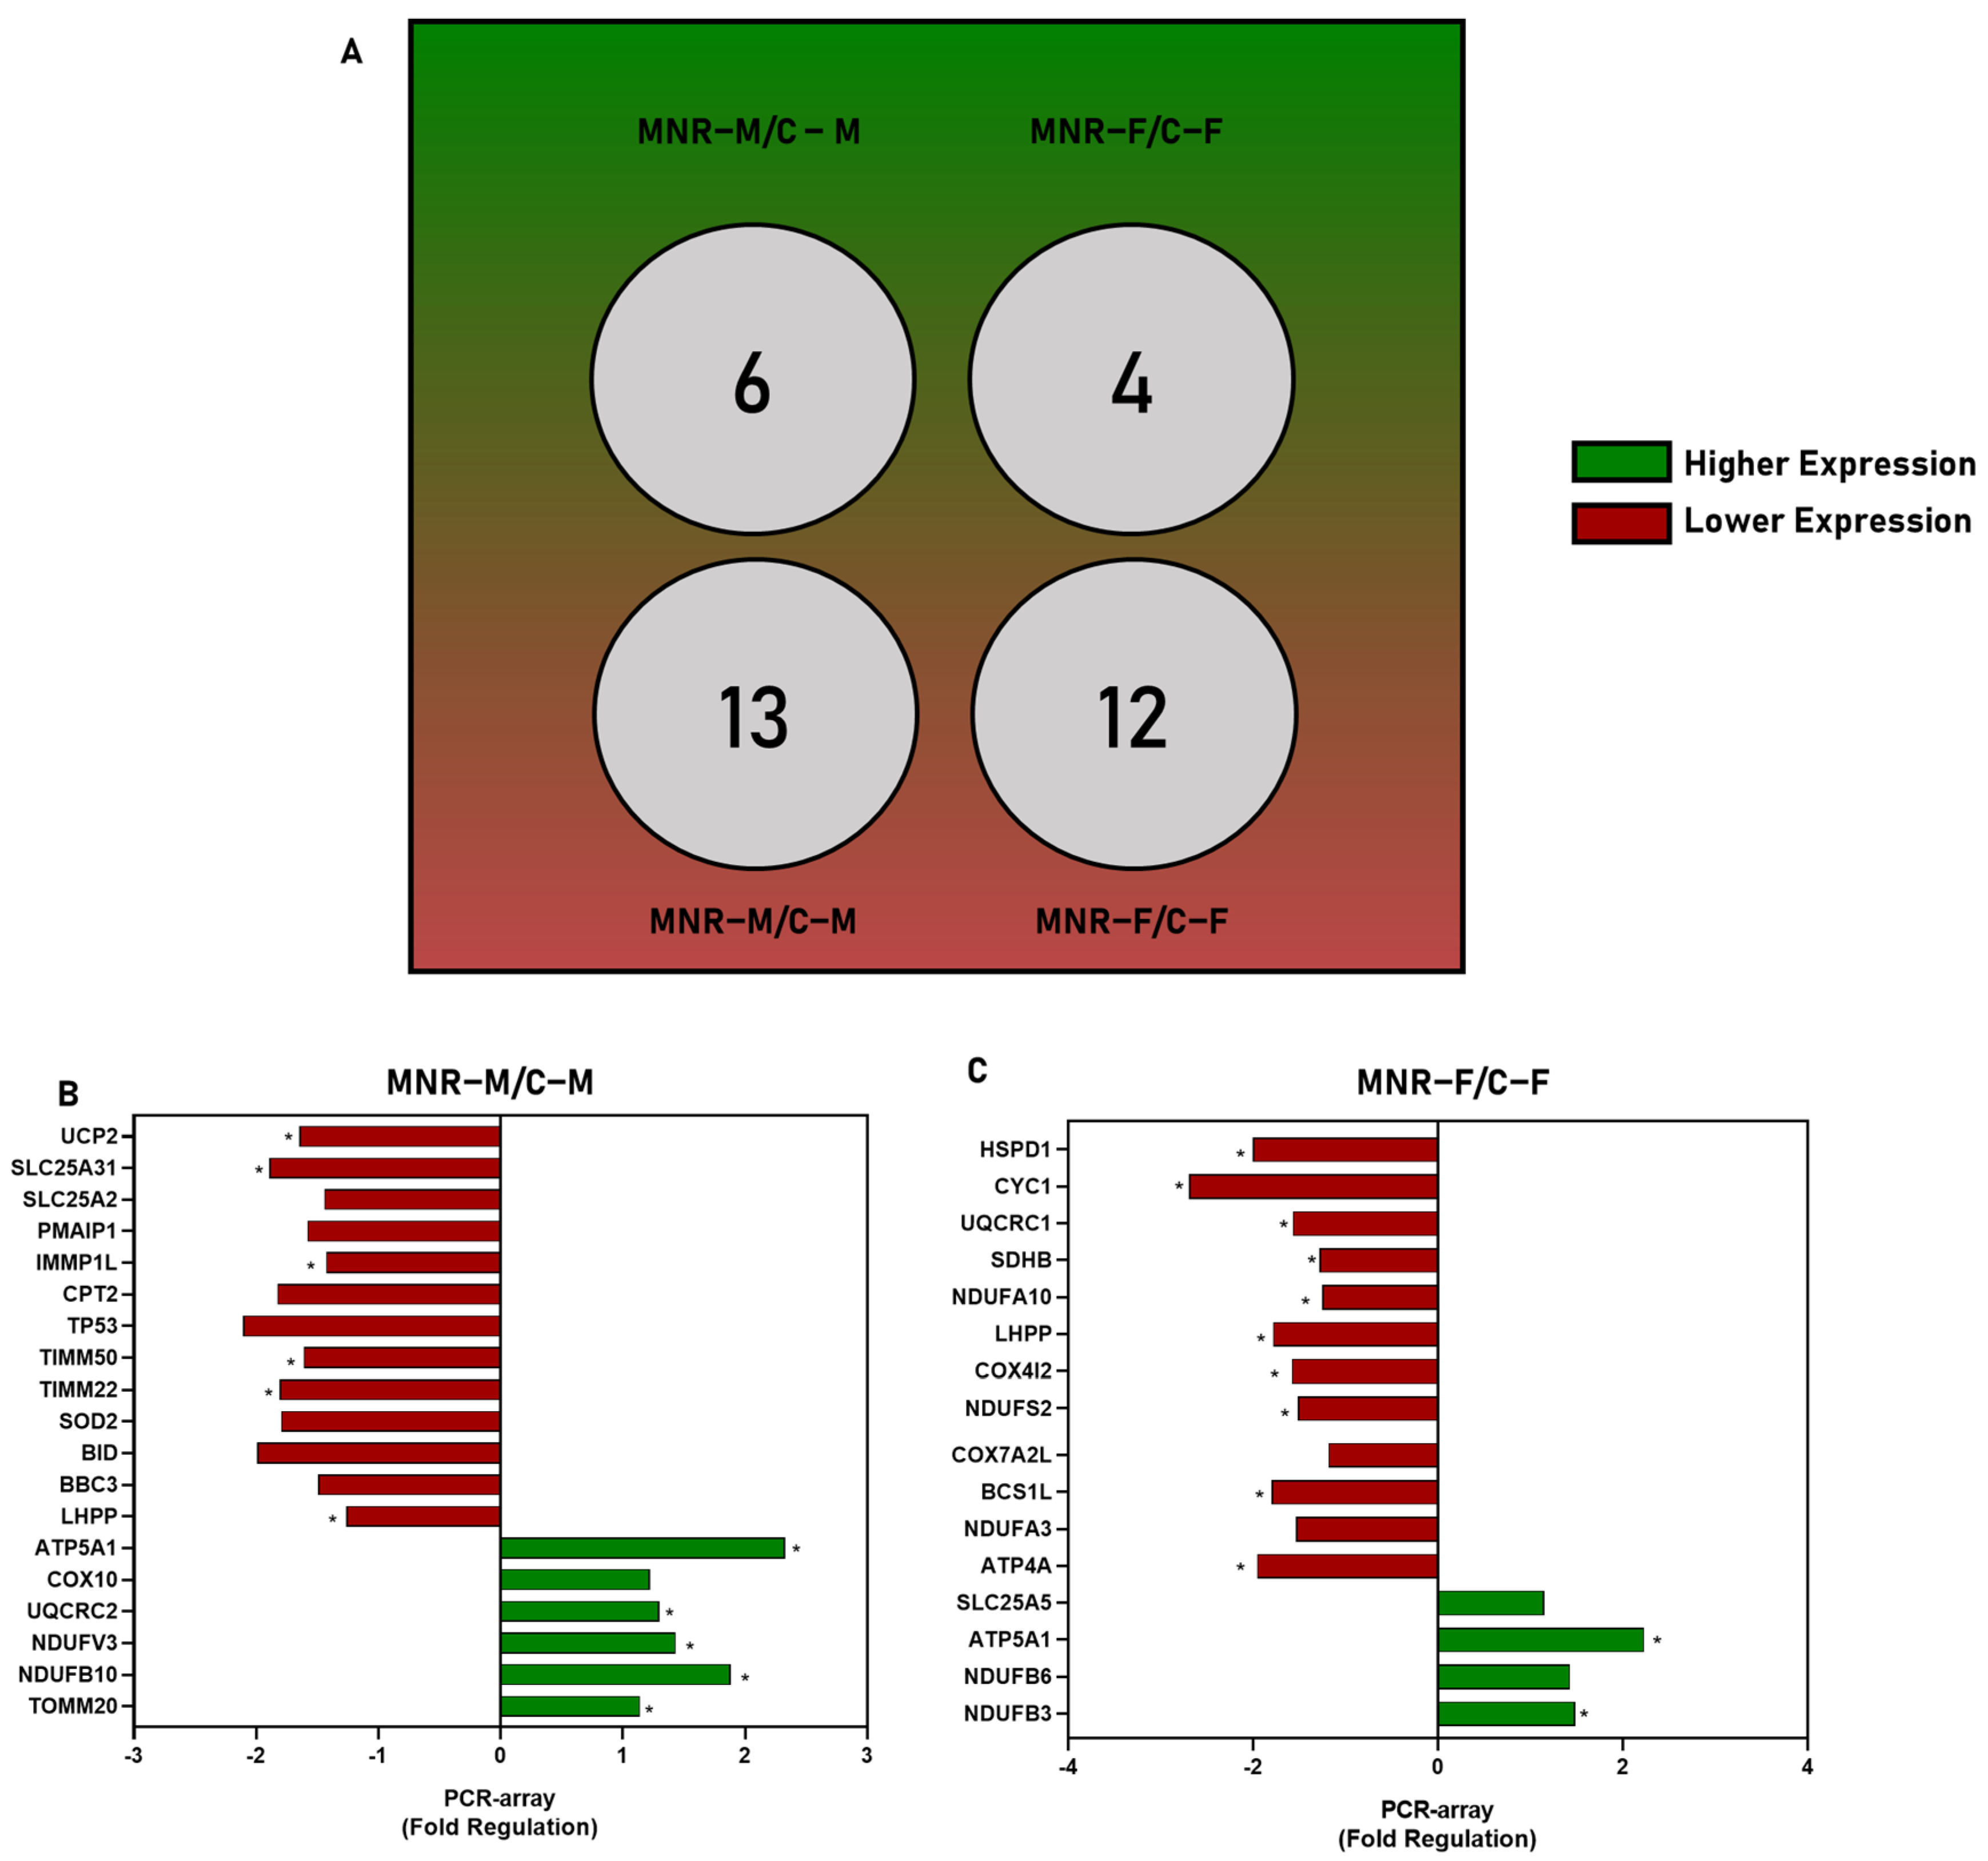
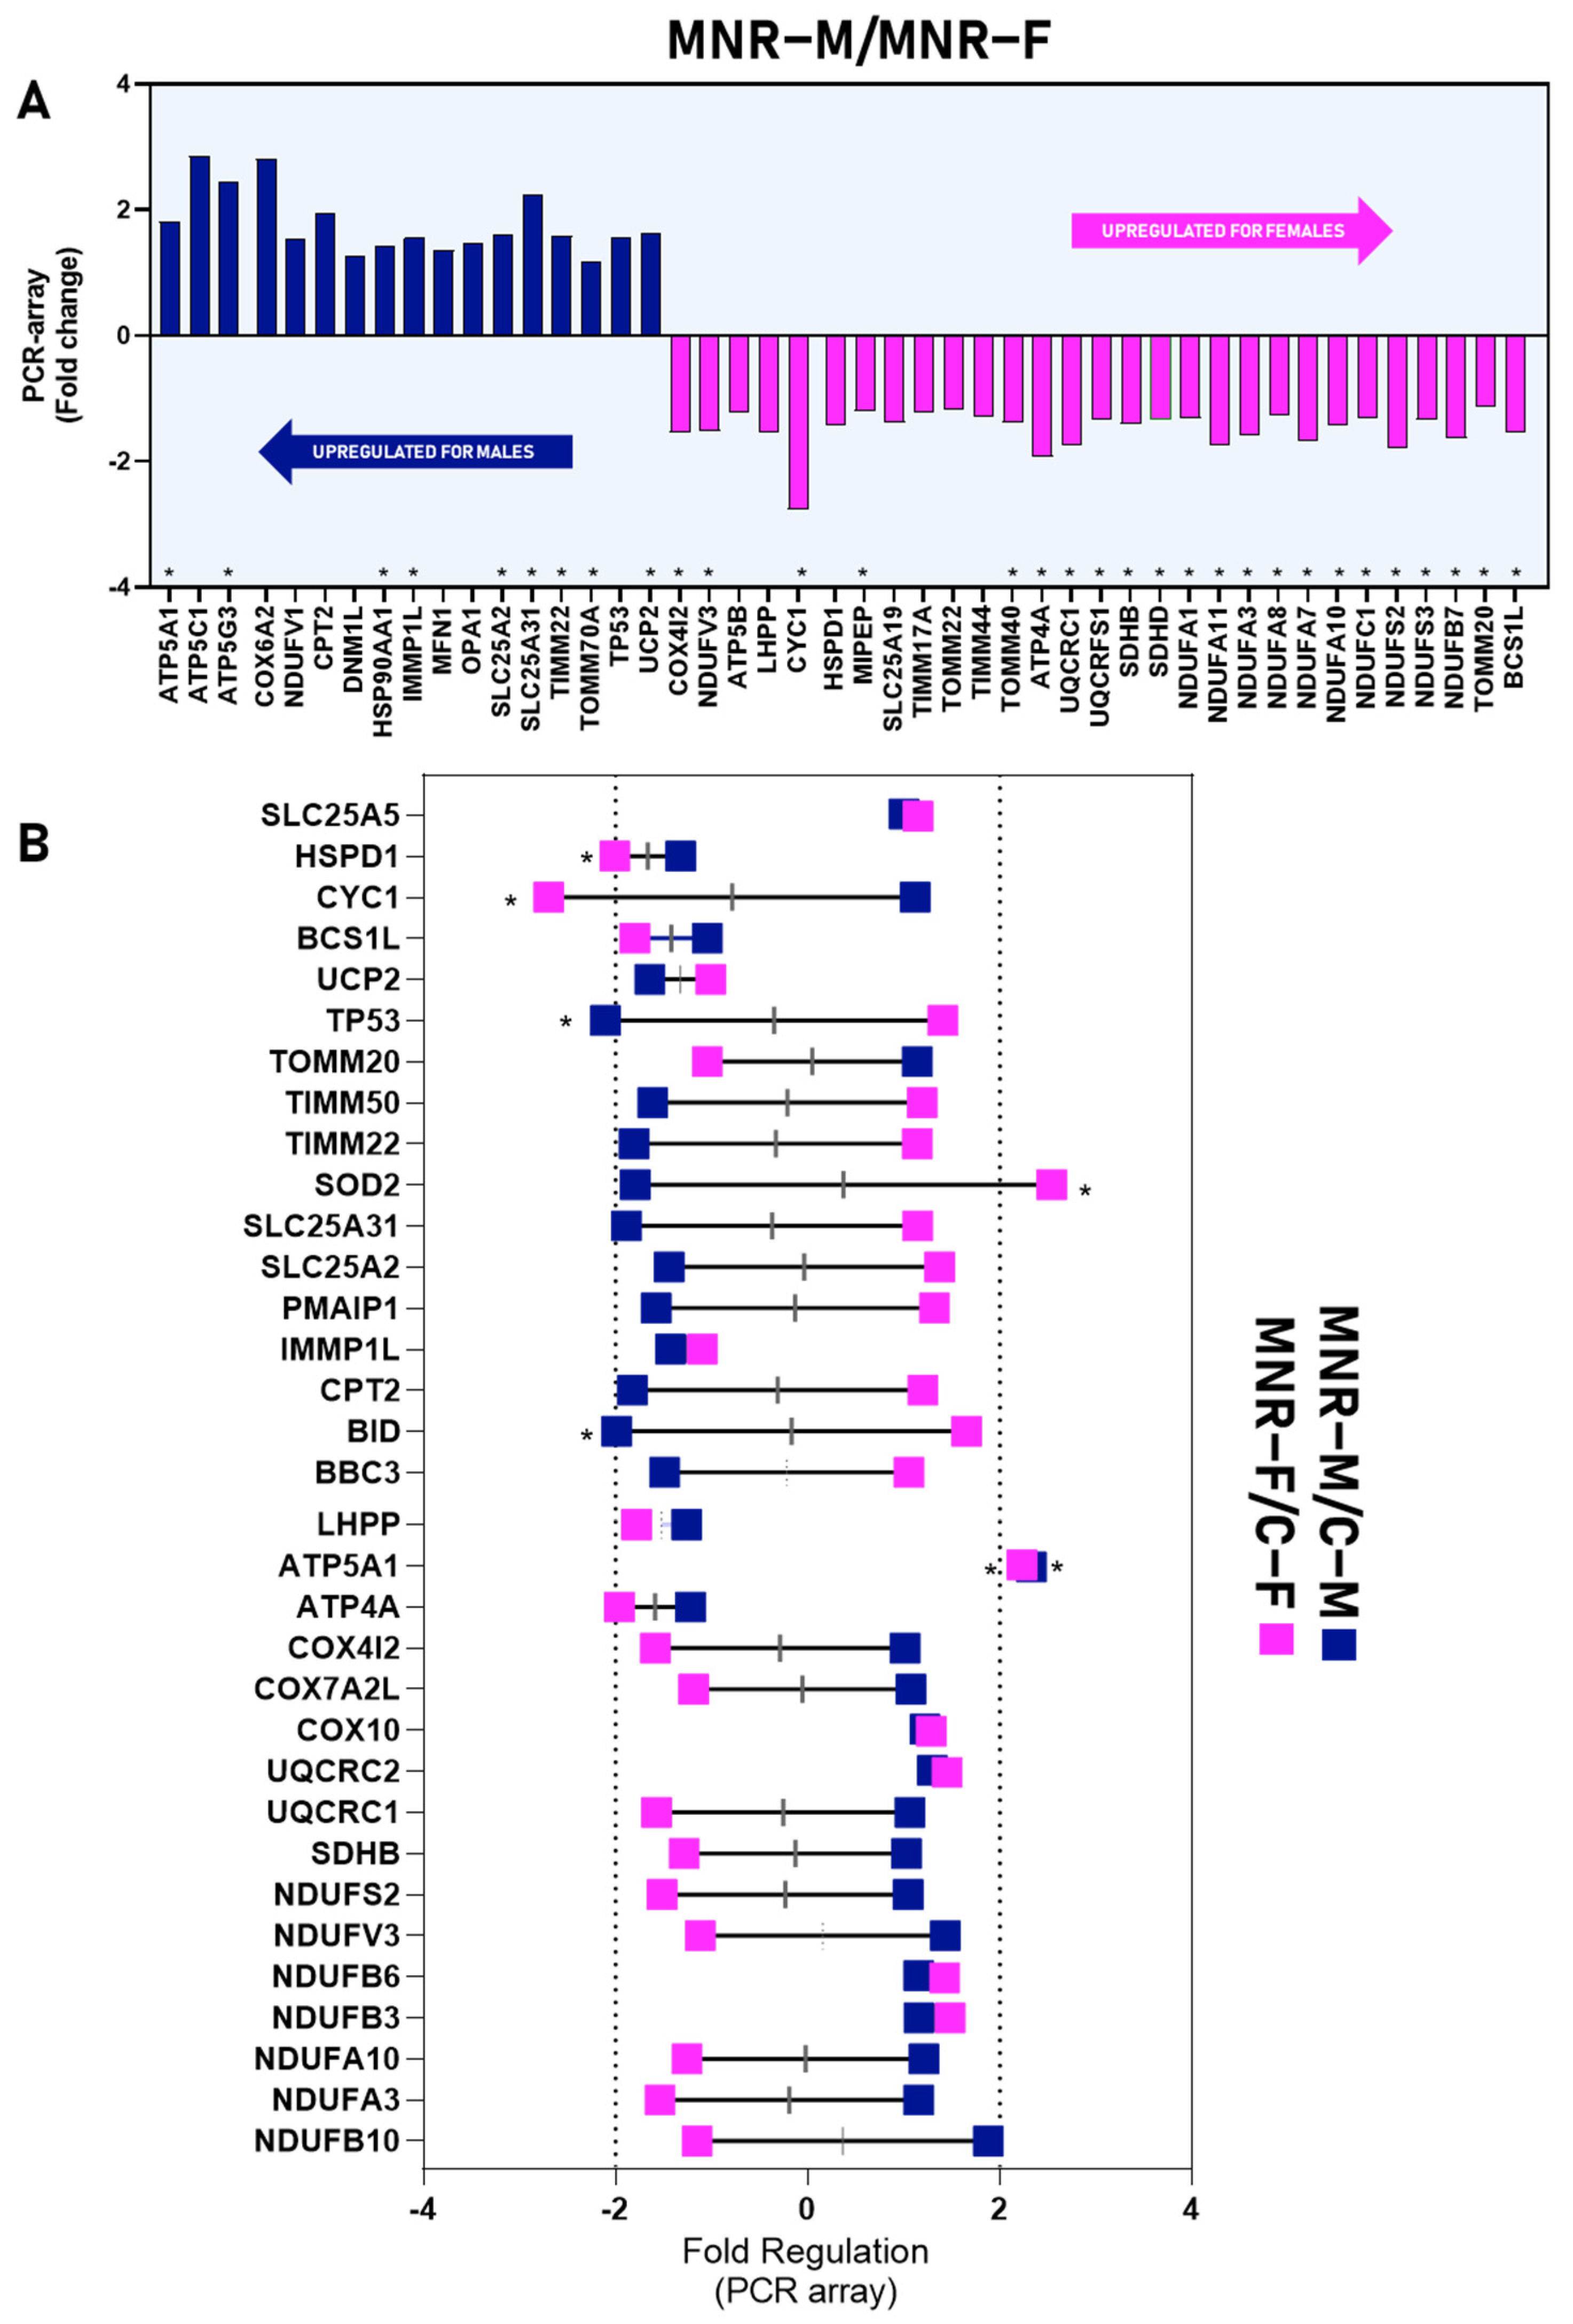
2.3. MNR-Induced Mitochondrial Transcriptional Alteration in the Fetal Cardiac Left Ventricle at 0.5 Gestation

Human Mitochondrial Energy Metabolism and the Human Mitochondria Pathway Arrays were used to evaluate MNR-induced in utero fetal cardiac RNA transcriptional changes at 0.5 G. The expression levels of all of the evaluated genes are summarized in the heatmap and the scatter plot in Figure 2A and Table 3. The clustering analysis shows a clear separation between MNR and C groups. The fold-regulation between MNR and Control gene expression levels (Figure 2A–C, and Table 3) showed that transcripts for HSPD1 (fold-regulation: −1.6229, p = 0.0097), BCS1L (fold-regulation: −1.3446, p = 0.0089, LHPP (fold-regulation: −1.4705, p = 0.0026, ATP4A (fold-regulation: −1.5006, p = 0.0199) were downregulated, whereas the genes NDUFB6 (fold-regulation: 1.2714, p = 0.0474), NDUFB3 (fold-regulation: 1.2952, p = 0.0125), UQCRC2 (fold-regulation: 1.3692, p = 0.0274), ATP5O (fold-regulation: 1.1510, p = 0.0373), and ATP5A1 (fold-regulation: 2.2; p = 0.0089) were upregulated. Moreover, two genes had a tendency to be downregulated (CDKN2A, fold-regulation: p = 0.0558; NDUFB7 (p = 0.0587)), and five genes had a tendency to be upregulated (COX6C (p = 0.0714), BAK1 (p = 0.0856), ATP5J (p = 0.0588), TIMM10 (p = 0.0762), ATP5F1 (p = 0.0595)).
Gene expression variations are sex-specific (Figure 3 and Table 3). In common, ATP5A1 was upregulated and LHPP was downregulated in both MNR-M (fold-regulation: 2.3, p = 0.0004; fold-regulation: −1.2608; p = 0.0369) and MNR-F (fold-regulation: 2.2; p = 0.0419; fold-regulation: −1.7836; p = 0.0142) in comparison with the control of the respective sex. For MNR-M (Figure 3B and Table 3), along with ATP5A1, four more transcripts were upregulated in this group: UQCRC2 (fold-regulation: 1.2991, p = 0.0298), NDUFV3 (fold-regulation: 1.4313; p = 0.0382), NDUFB10 (fold-regulation: 1.8811; p = 0.0035, TOMM20 (fold-regulation: 1.1394; p = 0.0481), and COX10 was tendentially upregulated (p = 0.0827). For the same group, along with LHPP, the transcripts for UCP2 (fold-regulation: −1.6445, p = 0.0155), SLC25A31 (fold-regulation: −1.8892; p = 0.0416), IMMP1L (fold-regulation: −1.4269; p = 0.0070), TIMM50 (fold-regulation: −1.6130; p = 0.0319), and TIMM22 (fold-regulation: −1.8063; p = 0.0223) were downregulated in comparison with C-M, and another seven transcripts were tendentially downregulated, SLC25A2 (p = 0.0677), PMAIP1 (p = 0.0770), CPT2 (p = 0.0958), TP53 (p = 0.0577), SOD2 (p = 0.0620), BID (p = 0.0759), and BBC3 (p = 0.0848).
In comparison with C-F (Figure 3C and Table 3), only 1 transcript besides ATP5A1 was upregulated for MNR-F: NDUFB3 (fold-regulation: 1.4818, p = 0.0207). For the same group, 10 genes were downregulated along with LHPP: HSPD1 (fold-regulation: −2.0; p = 0.0108), CYC1 (fold-regulation: −2.7; p = 0.0039), UQCRC1 (fold-regulation: 1.5758, p = 0.0089), SDHB (fold-regulation: −1.2856, p = 0.0066), NDUFA10 (fold-regulation: −1.2561, p = 0.0236), COX4I2 (fold-regulation: −1.5859, p = 0.0211), NDUFS2 (fold-regulation: −1.5158, p = 0.0022), BCS1L (fold-regulation: −1.7991, p = 0.0015), ATP4A (fold-regulation: −1.9599, p = 0.0182), along with other four tendentially downregulated transcripts, COX7A2L (p = 0.0671), NDUFA3 (p = 0.0942), and two tendentially upregulated, SLC25A5 (p = 0.0868), NDUFB6 (p = 0.0974).
When comparing the fold-regulation of gene expression in MNR-M vs. MNR-F, Figure 4A and Table 3 (section MNR-M vs. MNR-F) show that the upregulated transcripts for MNR-M were ATP5A1, ATP5G3, HSPD90AA1, IMMP1L, SLC25A2, SLC25A31, TIMM22, TOMM70A, and UCP2, with ATP5C1, COX6A2, NDUFV1, CPT2, DNM1L, MFN1, OPA1, and TP53, being tendentially upregulated, and for MNR-F, the upregulated genes were COX4I2, NDUFV3, CYC1, MIPEP, TOMM40, ATP4A, UQCRC1, UQCRFS1, SDHB, SDHD, NDUFA11, NDUFC1, NDUFS2, NDUFS3, TOMM20, BCS1L, NDUFA1, NDUFA10, COX412 with ATP5B, LHPP, HSPD1, SLC25A19, TIMM17A, TIMM44, and TOMM22, being tendentially upregulated.
Overall, fold-regulation patterns are patented in Figure 4B displaying the sex-specific regulation patterns dictated by MNR in the cardiac LV tissue. When comparing with same-sex control, MNR-induced transcripts fold-regulation is distinct for most analyzed genes, with several genes presenting tendential opposite patterns of expression depending on the sex of the offspring. For example, transcripts that tended to be upregulated in MNR-M vs. C-M were NDUFB10, NDUFA3, NDUFV3, NDUFS2, SDHB, UQCRC1, COX7A2L, COX4I2, and CYC1 for MNR-F vs. C-F; these transcripts tended to be downregulated. On the contrary, the group of transcripts that tended to be downregulated for MNR-M vs. C-M was as follows: BBC3, BID, CPT2, PMAIP1, SLC25A2, SLC25A31, SOD2, TIMM22, TIMM50, and TP53; these were upregulated for MNR-F vs. C-F. Nevertheless, a few genes show similar expression behaviors for both sexes (NDUFB3, NDUFB6, UQCRC2, COX10, ATP4A, ATP5A1, LHPP, UCP2, BCS1L, HSPD1, SLC25A5).

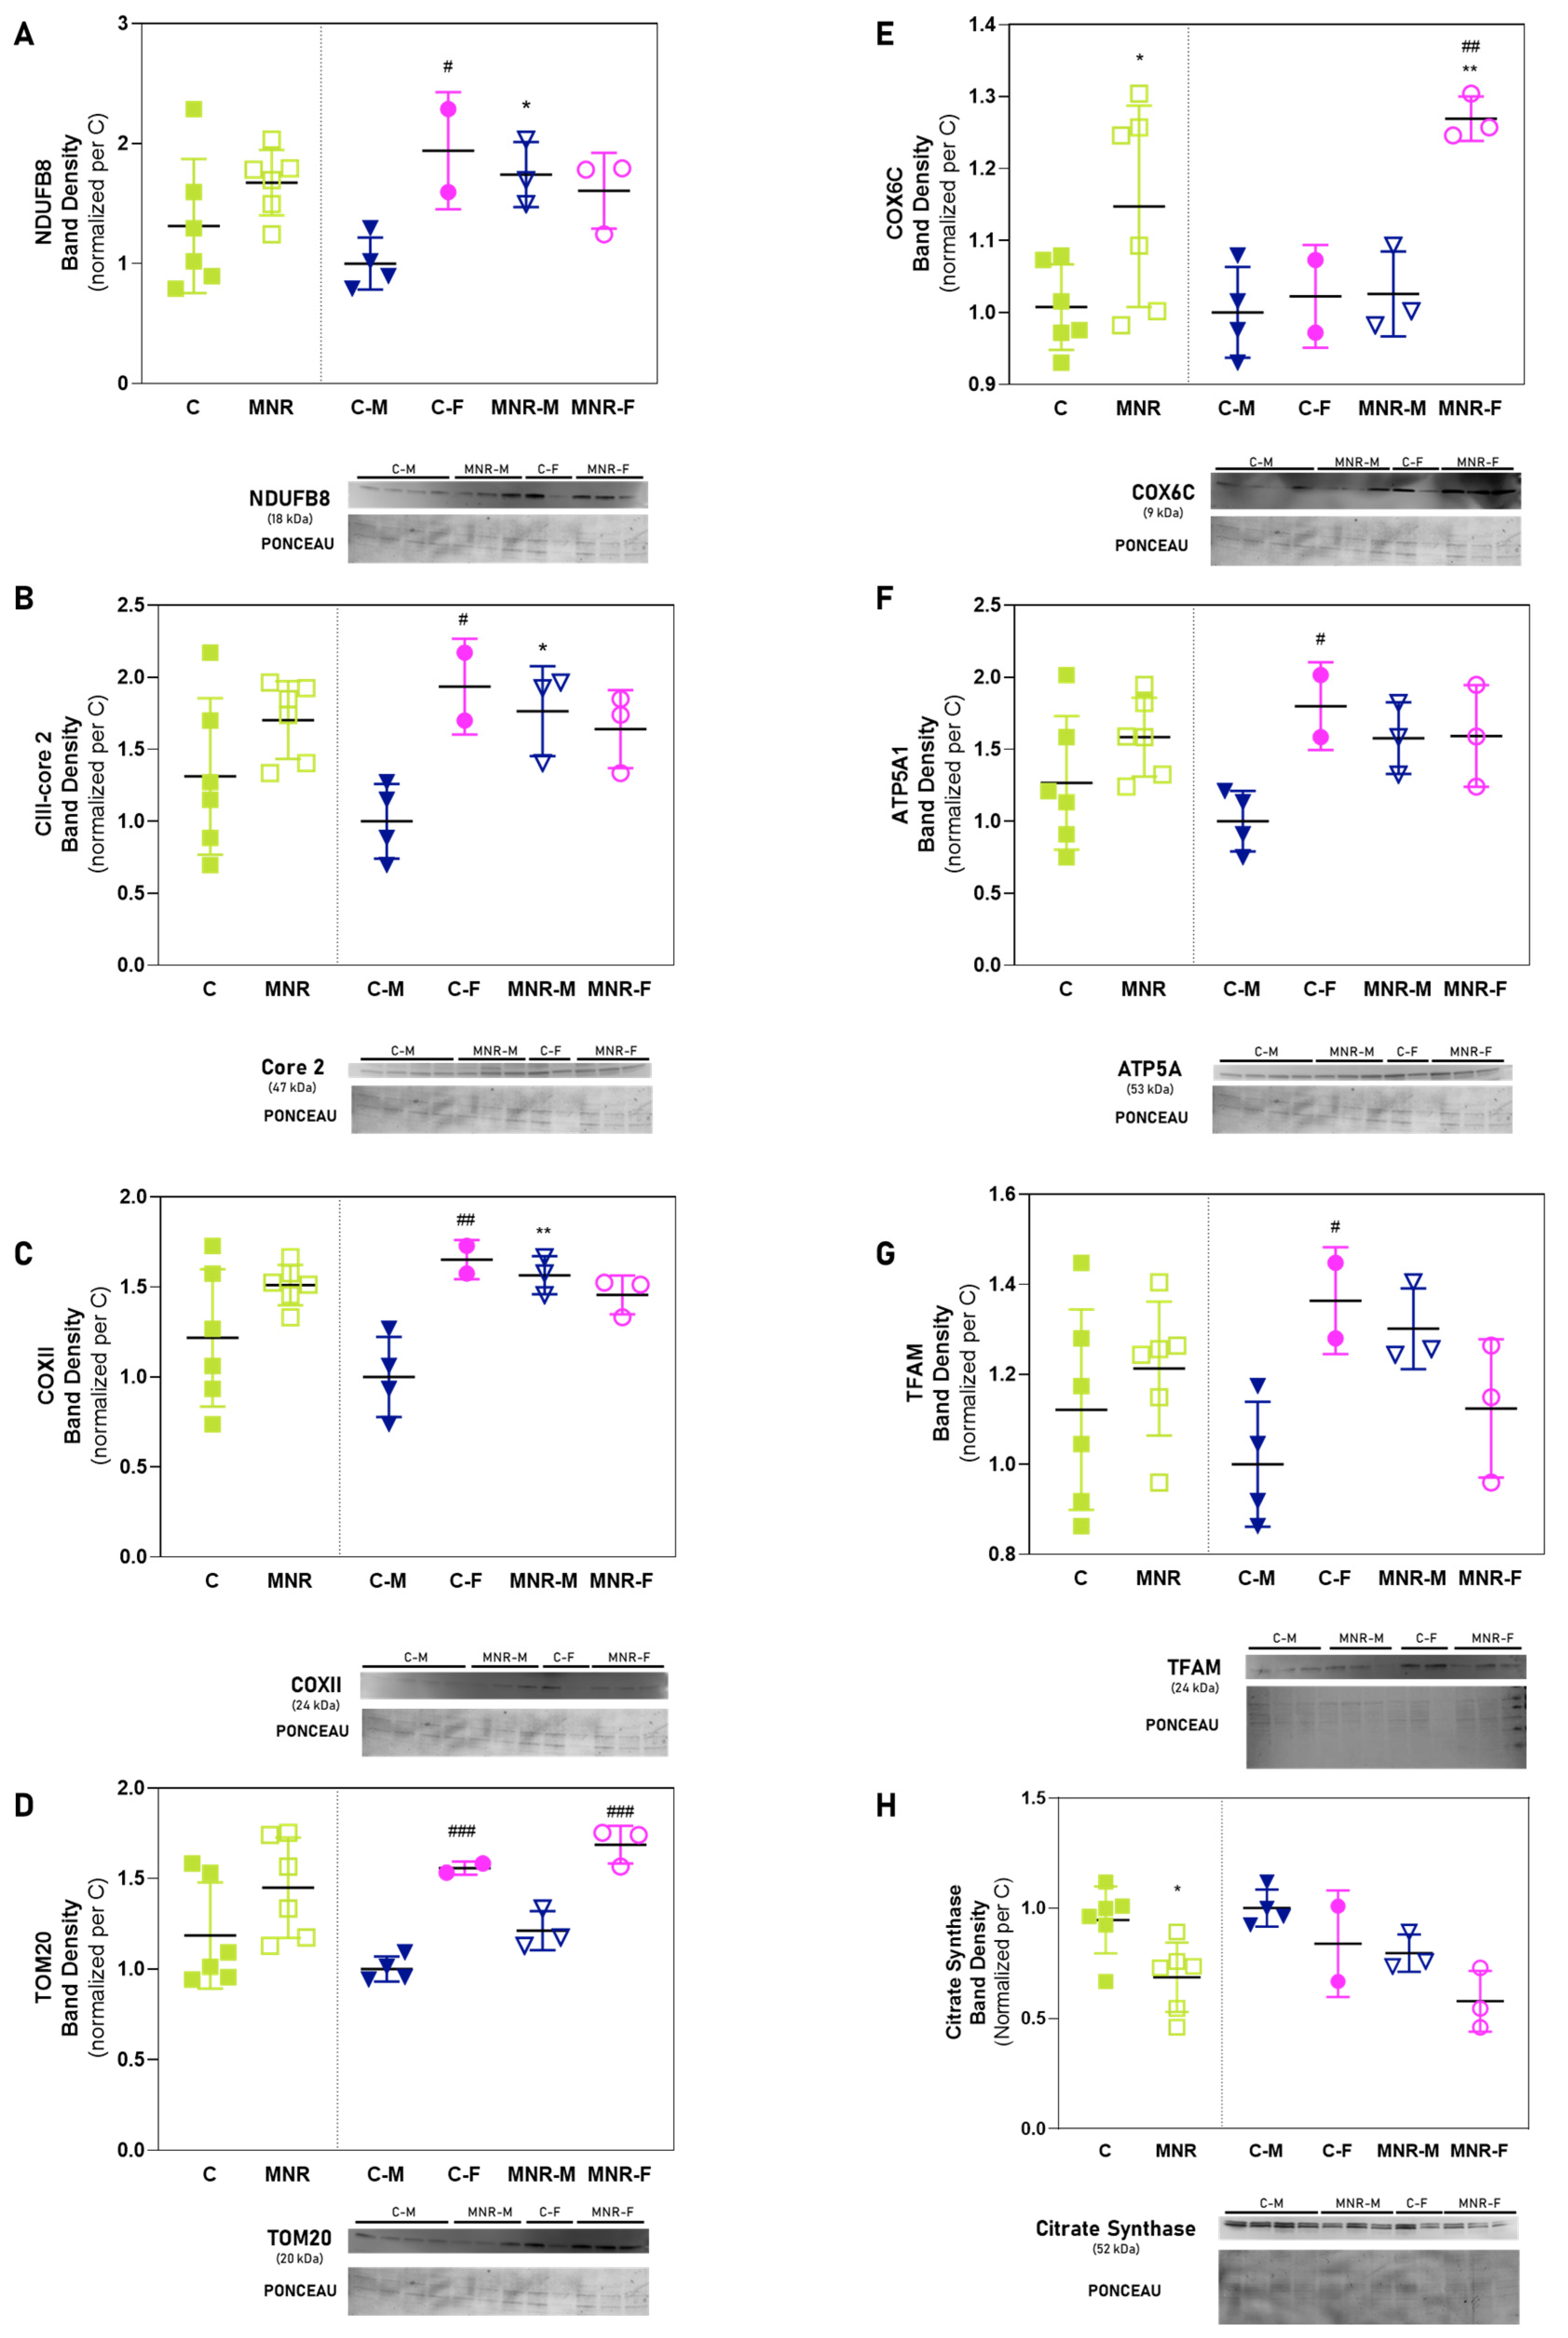
2.4. MNR-Induced Mitochondrial Protein Modulation in the Fetal Cardiac Left Ventricle at 0.5 Gestation

The transcriptional changes were complemented with protein content analysis performed via Western blot (WB). Protein indicators of mitochondrial mass, dynamics, oxidative stress, and OXPHOS subunit proteins were semi-quantified (Figure 5). Protein amounts for citrate synthase were decreased for MNR vs. C (0.69 ± 0.16 vs. 0.9 ± 0.15) and protein amounts for complex IV subunit COX6C were increased for MNR vs. C (1.15 ± 0.14 vs. 1.0 ± 0.1). In the hearts of male fetuses significant alterations were identified in the protein amounts for OXPHOS subunits complex I NDUFB8 (1.7 ± 0.27 vs. 1.0 ± 0.22; p = 0.0485), complex III UQCRC2 (1.8 ± 0.3 vs. 1.0 ± 0.26, p = 0.0330), and complex IV COXII (1.6 ± 0.11 vs. 1.0 ± 0.22; p = 0.0245) subunits, in which OXPHOS protein content overall increased for MNR-M vs. C-M. Additionally, in MNR-F fetuses there was an increase in LV protein content for the complex IV COX6C subunit protein (MNR-F vs. C-F, 1.3 ± 0.03 vs. 1.0 ± 0.07, p = 0.0063) (Figure 5).
Cardiac mitochondrial sexual dimorphism was well evidenced in the protein levels between the control groups (Figure 5, C-F vs. C-M) for the protein NDUFB8 (1.9 ± 0.49 vs. 1.0 ± 0.22, p = 0.0285), complex III UQCRC2 (1.9 ± 0.33 vs. 1.0 ± 0.26, p = 0.0225), complex IV COXII (1.7 ± 0.1 vs. 1.0 ± 0.2; p = 0.0068), and ATP synthase ATP5A1 subunit (1.8 ± 0.3 vs. 1.0 ± 0.20; p = 0.0393). Mitochondrial biogenesis and mass regulator mitochondrial transcription factor A (TFAM) (Figure 5G; 1.4 ± 0.12 vs. 1.0 ± 0.14, p = 0.05), as well as the translocase of the outer mitochondrial membrane 20 (TOM20) (Figure 5D; 1.6 ± 0.04 vs. 1.0 ± 0.07, p = 0.0004), respectively, were also increased for C-F vs. C-M. Comparing both MNR groups, the sexual dimorphism regarding mitochondrial protein amount was attenuated with only OXPHOS complex IV COX6C subunit (1.3 ± 0.03 vs. 1.0 ± 0.06, p = 0.0034) and TOM20 (1.7 ± 0.10 vs. 1.2 ± 0.11; p = 0.0007) being increased for MNR-F vs. MNR-M.

3. Discussion

During pregnancy, the mother’s nutritional intake plays a vital role in supporting fetal growth and development [32,33,34]. Inadequate maternal nutrition, such as limiting the availability of essential fetal building blocks, can have detrimental effects on fetal growth [35,36] leading to IUGR and the development of SGA. SGA refers to infants who have a birth weight below the 10th percentile for their gestational age [37,38]. MNR is a recognized risk factor for IUGR and SGA [39,40]. However, it is not the sole cause, as other factors, such as maternal health conditions (e.g., hypertension, diabetes), smoking, drug use, and genetic factors, can also contribute to these conditions [41,42].
IUGR is a major obstetric condition that prompts the fetus and, later on, the offspring, for increased CVD risk [43]. We have previously reported that a 30% MNR has an adverse impact on cardiac left ventricle (LV) mitochondria in a sex-dependent way in term NHP fetuses (0.9 of gestation) [12]. Given the crucial role of mitochondria for cardiac differentiation and contraction in the first trimester of gestation [44], the objective of this study was to investigate whether the in utero programming of fetal cardiac mitochondria could be discernible during the early stage of pregnancy in the NHP animal model (90 days of gestation, 0.5 G). We aimed to assess the effects of a 30% maternal nutrient restriction (MNR) on the mitochondrial biology of the fetal heart during mid-gestation, using the same NHP animal model. In this study, the analysis of the cardiac LV of fetuses at 0.5 G showed that MNR already induced cardiac mitochondrial biology alterations during fetal development detectable at this time point. Thus, we here provide significant clues about MNR-induced early modulation of cardiac LV mitochondrial biology, allowing a time-dependent characterization and comprehension of cardiac metabolic adaptations in MNR fetuses that programs for increased CVD risk [16].
In humans, SGA fetuses are usually hypoglycemic [45]. Our study corroborates these findings with 0.5 NHP MNR fetuses showing decreased levels of glucose in comparison with C fetuses. Hypoglycemia during fetal development adversely impacts cardiogenesis [46,47], the process of cardiomyocyte differentiation and maturation, since it mainly relies on glycolysis and lactate production until the postnatal period [48]. In the postnatal stage, fuel for cardiac metabolism shifts to primarily fatty-acid oxidation which is dependent on cardiac mitochondria [49]. This metabolic shift is necessary to induce cardiomyocyte proliferation [50]. Despite not being the primary source of energy in the cardiomyocytes during fetal development, mitochondria play an essential role in fetal cardiac development [51]. Mitochondria are important organelles for ventricular morphogenesis [51], through the regulation of apoptotic mechanisms [52], as well as in the regulation of cardiac differentiation markers, through mitochondrial fusion [53], and by the production of ROS that can act as signaling molecules [51]. Hence, impaired mitochondrial function during the early stages of development may lead to detrimental adaptations in the developing heart, giving rise to a variety of anomalies in cardiac growth and development. We here show, for the first time, that 30% MNR induces mitochondrial-related transcriptional and protein abundance levels alterations as early as the mid-gestation period (0.5 G) in NHP fetuses cardiac LV, which may become relevant to understanding the mechanisms by which MNR affects cardiac function postnatally.
Cardiac gene expression analysis of mitochondria-related genes revealed that MNR-induced gene downregulation involves genes that encode for a phosphatase enzyme (LHPP) and proteins involved in macromolecular assembly (HSPD1 and BCS1L). It is worth mentioning that BCS1L plays an important role in MRC-complex III assembly [54]. Interestingly, the downregulation of BCS1L and OXPHOS impairment has been proposed as a mechanistic link in prostate cancer-related fatigue development; however, more studies are needed to fully understand if this link between BCS1L gene expression and complexes activities is verified for other conditions. Nevertheless, transcripts for UQCRC2, a gene encoding for complex-III subunit, was upregulated for MNR fetuses, along with other OXPHOS complex subunits: complex-I (NDUFB6, NDUFB3), -IV (COX6C), and ATP synthase (ATP5A1, ATP5F1, ATP5J, ATP5O). This represents more than half of the measured genes whose expression was altered by MNR in the cardiac LV. In addition, and highlighting MNR-induced mitochondrial alterations, the protein amount of citrate synthase, a mitochondrial matrix enzyme commonly used as a mitochondrial marker [55], was decreased for MNR mid-gestation fetuses, suggesting a decreased mitochondrial number. Most transcripts for OXPHOS subunit genes were upregulated, and the same was observed in our previous study for cardiac tissue from term fetuses (0.9 G) [12]. In both mid-gestation and term fetuses, transcripts for complex I subunits NDUFB6, and ATP synthase ATP5A1 were upregulated. These transcript alterations did not result in many protein content alterations for the same subunits, in both fetal time points (with the exception of COX6C for MNR mid-gestation fetuses), possibly due to the dynamic processes between the genome and the protein levels, which include transcription, splicing, and translation [12]. In spite of this, in term fetuses, MRC complex-I, -II/III, and -IV activities were altered [12]. This was also observed in a diet-induced animal model of IUGR in adult mice offspring (14 weeks old). Protein content for OXPHOS subunits was unaltered by IUGR; however, mitochondrial respiration was decreased in IUGR-offspring cardiac LV muscle [56]. Therefore, to comprehensively assess the true impact of MNR on OXPHOS and its subsequent effects on cardiac mitochondria, it is essential to measure either respiratory rates or the activity of OXPHOS. However, conducting such studies can be challenging and often impractical due to limited sample availability and the significant amount of biological material required. The impact of fetal sex on mitochondrial metabolism-related gene expression and protein content was evident. The fold-regulation of MNR-M vs. MNR-F reveals a sex-specific pattern of gene expression induced by MNR. For MNR-F, the majority of upregulated transcripts in comparison with the respective C include those encoding for OXPHOS subunits, while for MNR-M, this was more evident for transcripts for other mitochondrial proteins that are involved in ornithine transport (SLC25A2), mitochondrial ADP/ATP exchange (SLC25A31), uncoupling of mitochondrial oxidative phosphorylation (UCP2), molecular folding (HSP90AA1), removal of the mitochondrial targeting pre-sequence of nuclear-encoded proteins (IMMP1L), and protein translocation (TIMM22, TOMM70A). Interestingly, both complex III-core 2 subunit gene expression (UQCRC2) and protein content were increased for MNR-M vs. C-M. Moreover, complex-I (NDUFB8) and -IV (COXII) subunit protein contents were increased for MNR-M vs. C-M, whereas no differences were detected in MNR-F. Thus, MNR seems to impact more severely male fetuses’ OXPHOS protein content, whereas for female offspring, these alterations may become more pronounced at a later developmental stage or even at a postnatal stage, since we did not detect differences in these subunits’ protein content for term female fetuses in our previous study [12]. These sex-specific differences may be explained by, e.g., epigenetic regulation, or by the action of sex-steroid hormones, given that estrogen plays an active role in protein modification, gene regulation, and cellular process modulation [57]. Nevertheless, further studies are needed to understand how sex influences in utero cardiac programming and adult offspring disease risk.
Another implication of the in utero MNR-induced OXPHOS alterations may be the impact in the production of ROS [4]. Our results showed that during mid-gestation, oxidative stress markers’ protein content was not altered, whereas we detected MNR-induced increased levels of MDA in term-fetuses [12], indicating that oxidative damage may only become evident during the second half of pregnancy in this NHP MNR model. This can relate to the unaltered mtDNA copy number, suggesting that perhaps mitochondrial mass and biogenesis are still preserved since lack of significant oxidative damage occurring at this fetal stage. Indeed, in a rabbit animal model of IUGR, in the LVs of 30-day-old fetuses (corresponding to late gestation period), increased expression of genes that modulate OXPHOS, including cardiac mitochondrial respiratory chain complex I, NADH dehydrogenase activity was detected [58]. These alterations were accompanied by decreased cardiac enzymatic activities of complex-II, -IV, and -II + III [59]. Nevertheless, these mitochondrial respiratory chain adaptations did not produce alterations in cardiac cellular ATP levels, nor in the antioxidant enzyme SOD2, nor in mitochondrial copy number [58], in accordance with our findings. Guitart-Mampel et al. suggest that the preservation of ATP levels and SOD2 protein expression levels and activity can be attributable to increased levels of Sirtuin 3 [59], acting as a compensatory mechanism, due to its action on promoting mitochondrial energy production, on the inhibition of oxidative stress, and on autophagy regulation [60]. We recognize the possibility of Sirtuin 3 acting as a compensatory mechanism in the hearts of our animal model as well, however, it must be taken into consideration that in Guitart et. al.’s study, IUGR was achieved surgically and the animal models are very distinct from each other (i.e., gestation period, diet, litter size). Highlighting this, in our animal model, term fetuses display signs of oxidative damage [12]. To our knowledge, no other study has explored Sirtuin-3 levels in the context of IUGR fetal programming of CVD, and thus, no major conclusions can be drawn.
Cardiomyocyte proliferation in the neonatal period depends mainly on oxidative metabolism [51,61]. Even though we show here that some MNR-induced alterations begin to be detectable at mid-gestation in cardiac mitochondria, these become more pronounced at late gestation, e.g., increased mtDNA content and oxidative stress in comparison with C [12]. We must consider that at 0.5 G, mitochondria are smaller and less mature [50]. Thus, it is possible that MNR-induced adaptations in fetal cardiac mitochondrial function become significant enough to impair cardiac function only at a stage where cardiomyocytes mainly rely on mitochondrial respiration as a fuel source. However, we cannot underestimate the impact of mitochondrial dysfunction and signaling dysregulation in driving proper cardiomyocyte maturation, cardiac differentiation, and heart organogenesis that may only be perceivable in advanced postnatal life stages [49,62,63]. To our knowledge, our study is the only one reporting IUGR-induced mitochondrial-related genes’ expression alterations in fetal hearts at this stage in development, and thus, we can only raise hypotheses. It has been suggested that maternal nutrient reduction leads to a hypoxic environment in fetal organs [64,65]. The literature has suggested that hypoxia alters the expression of transcription factors involved in the replication of mtDNA-encoded genes [66], which include genes from the subunits of the mitochondrial respiratory chain complexes. On top of that, it is widely accepted that hypoxia activates an oxygen-sensing transcription factor, the hypoxia-inducible factor 1α (HIF-1α) [67], which is responsible for modulating the expression of microRNAs that regulate MRC complex subunits’ assembly proteins’ expression [67], highlighting the potential role of epigenetic remodeling. In addition, because oxygen is the final electron acceptor of the mitochondrial electron transport chain (ETC), a lack of oxygen availability affects ETC function, resulting in an imbalance between oxygen and electron flow, leading to an overproduction of ROS [67], which can affect the expression of genes that encode for ETC complex subunits [68]. This is less likely to occur in an early fetal stage because, in this study, we did not find any significant alterations related to markers of oxidative stress, but this can occur in later stages since these alterations were verified in the hearts of 165-day-old fetuses [12].The initial changes that we here report, sustained throughout an individual’s lifetime, can potentially lead to a progressive disruption of cardiac metabolic functions. In spite of that, the sex-specific response is already clear at this stage, and the different patterns of gene expression according to fetal sex are significant, highlighting the need to explore CVD programming according to fetal offspring sex, highlighting the need for effective sex-specific treatment in disease management and mitigation.

4. Materials and Methods

4.1. Animal Care and In Vivo Procedures

4.1.1. Animal Care and Maintenance

The Animal Care and Use Committees of the Texas Biomedical Research Institute and the University of Texas Health Science Center at San Antonio, TX (no. 1134PC) approved all animal procedures, including pain relief. These were conducted in the Association for Assessment and Accreditation of Laboratory Animal Care-approved facilities and NIH Guide for the Care and Use of Laboratory Animals.
As previously described [69], maternal morphometrics were determined pre-pregnancy to guarantee weight consistency and general morphometrics in the animals used in the present study. Non-pregnant outbred female baboons (Papio spp.) of a similar morphometric phenotype were selected for the study. Animals were housed at the Southwest National Primate Research Center at the Texas Biomedical Research Institute (TBRI) in the Association for Assessment and Accreditation of Laboratory Animal Care (AAALAC)-approved facilities. Housing conditions and animal caging were performed as previously described [12].
Each baboon’s weight was obtained while crossing an electronic scale (GSE 665; GSE Scale Systems, Milwaukee, WI, USA), and as described elsewhere [12].

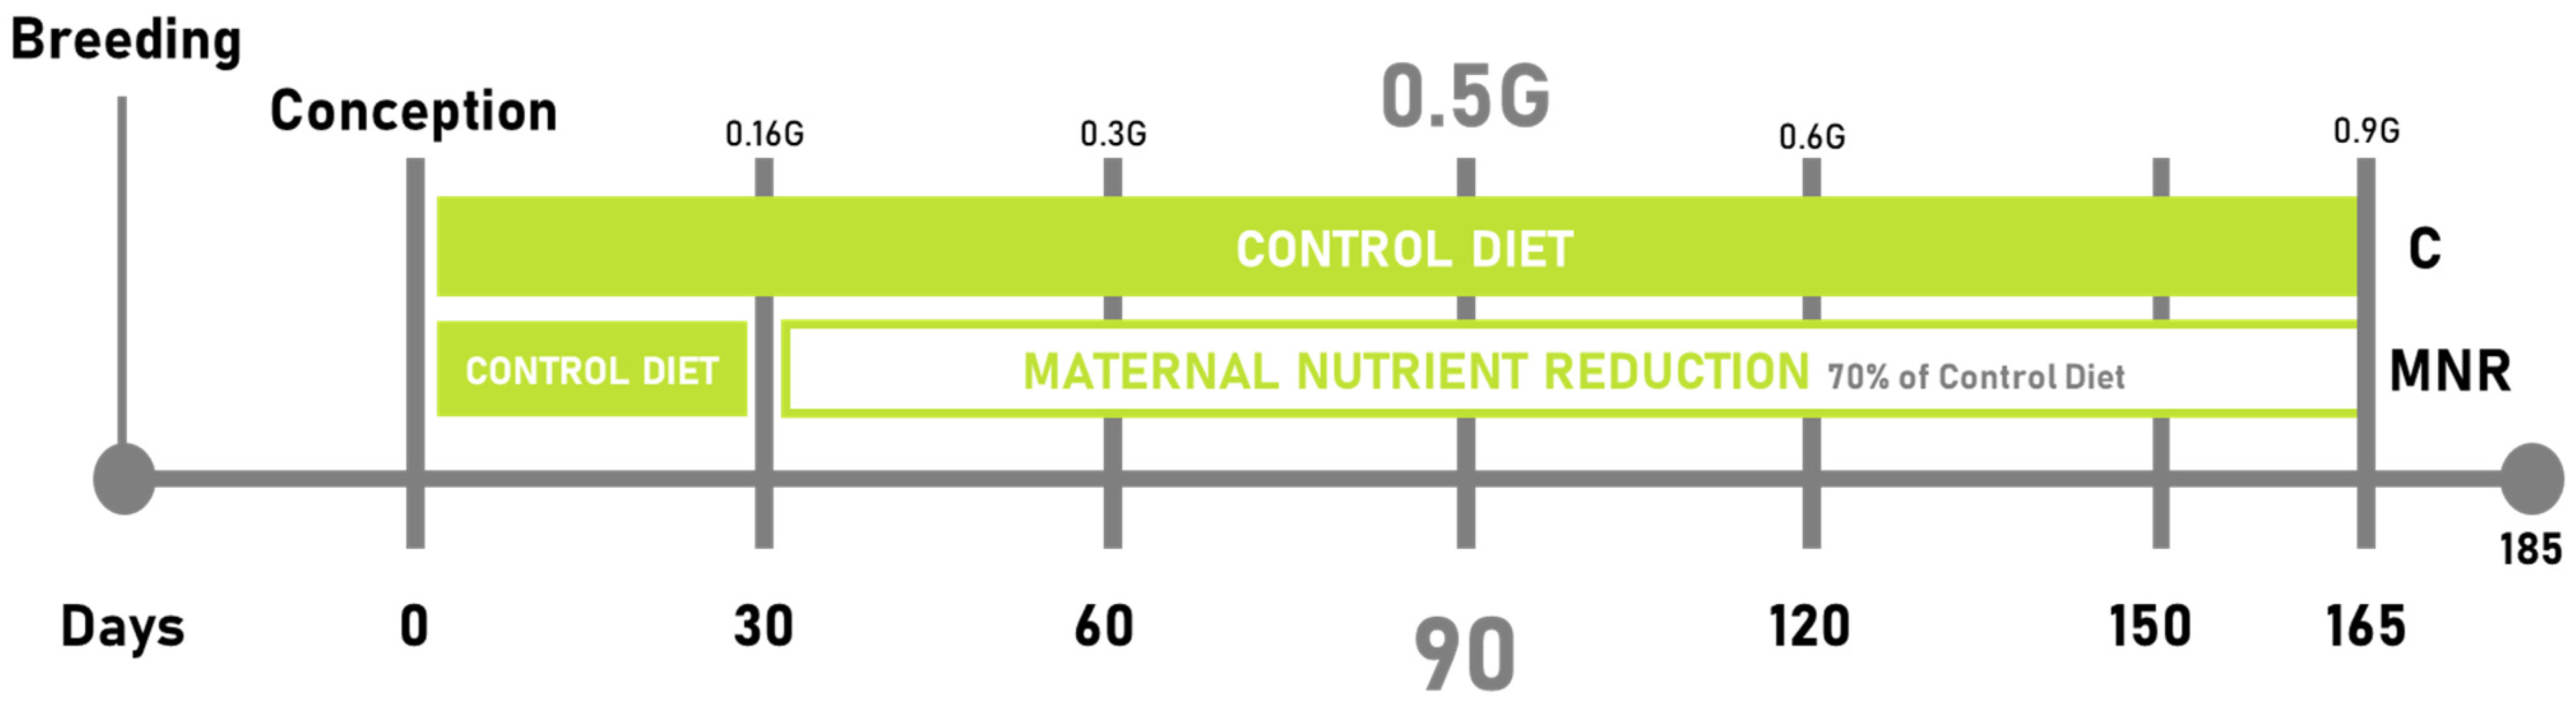
4.1.2. Experimental Design

Normally cycling female baboons from 8 to 15 years old were observed twice a day for well-being and three times a week for turgescence (genital organ’s skin swelling) and signs of vaginal bleeding to assess their reproductive cycle and enable determining the timing of pregnancy [69]. After a 30-day adaptation to the feeding system, a fertile male was introduced into each breeding cage. On day 30 of pregnancy, which was determined by following the changes in the swelling of the sex skin and by ultrasonography, twenty-four female baboons were randomly assigned to eat standard primate chow ad libitum (control diet) or to receive 70% of the average daily amount of food eaten by the female control baboons (MNR group) on a body weight-adjusted basis at same gestational age. Cesarean section was performed at 90 days gestation (0.5 G) (Figure 6). Each fetus from a singleton pregnant female baboon is considered an experimental unit; in some cases, the pregnant female baboon was also assumed as the experimental unit when maternal data are presented (12 baboons/dietary group; 6 male control fetuses—C-M; 6 female control fetuses—C-F; 6 MNR male fetuses—MNR-M; and 6 MNR female fetuses—MNR-F).
Purina Monkey Diet 5038, standard biscuits were provided once a day. The biscuit is described as a “complete life-cycle diet for all Old-World Primates” and contains stabilized vitamin C as well as all other required vitamins. The basic composition includes crude protein (≥15%), crude fat (≥5%), crude fiber (≤6%), ash (≤5%), and added minerals (≤3%) [69].
After the confirmation of pregnancy, food intake was recorded in 8 female baboons fed ad libitum and was calculated as 50.61 ± 3.61 kcal/kg of body weight per day. Before the start of the controlled diet, baboons were fed the same diet without a biscuit limit. Water was continuously available in the feeding cages via individual waterers (Lixit, Napa, CA, USA) and at several locations in the group housing. Animal food consumption, weights, and health status were recorded daily. More details regarding housing and environmental enrichment have been previously published [69].

4.1.3. Cesarean Section, Fetal and Maternal Morphometry, and Blood Sampling

Mothers were fasted from their last feeding time the day before, until the cesarean section [69]. A fully certified M.D. or D.V.M. performed surgical procedures, and postsurgical care was prescribed and monitored by an accredited veterinarian. Cesarean section and fetal necropsy were performed under isoflurane anesthesia (2%, 2 L/min oxygen, tracheal intubation), followed by tranquilization with ketamine hydrochloride (10 mg/kg intramuscularly injection) at 90 days of gestation (0.5 G) using standard sterile techniques as previously described [69]. Following hysterotomy, fetal exsanguination was performed with maternal and fetal baboons under general anesthesia as approved by the American Veterinary Medical Association Panel on Euthanasia [69]. Fetal hearts were collected. Cardiac samples were taken from the free wall of the left cardiac ventricle that was cut transversely. Some pieces were flash-frozen and stored at −80 °C until analysis. Postoperatively, mothers were placed in individual cages and observed until they were upright under their power and returned to their group cage. More details regarding maternal post-partum handling have been previously described [12].

4.2. Analysis of mtDNA Copy Number via Quantitative Real-Time PCR

DNA extraction was performed as previously described [12]. RT-PCR was performed using the SsoFast Eva Green Supermix (Bio-Rad, Hercules, CA, USA), in a CFX96 real-time PCR system (Bio-Rad), with the primers for ND1 (accession code NC_001992.1; sense sequence CCTATGAATCCGAGCAGCGT; antisense sequence GCTGGAGATTGCGATGGGTA) and for B2M (accession code NC_018158.1, sense sequence CAGGGCCCAGGACAGTTAAG; antisense sequence GGGATGGGACTCATTCAGGG) at 500 nM each. The amplification of 25 ng DNA was performed with an initial cycle of 2 min at 98 °C, followed by 40 cycles of 5 s at 98 °C plus 5 s at 60 °C. At the end of each cycle, Eva Green fluorescence was recorded to allow Ct determination. For quality control, the melting temperature of the PCR products was determined after amplification by performing melting curves, and no template controls were run.
For absolute quantification and amplification efficiency, standards at known copy numbers were produced by purifying PCR products. After optimizing the annealing temperature, products were amplified for each primer pair using the HotstarTaq Master Mix Kit (#203445 Qiagen, Hilden, Germany). Briefly, 1 μL of a DNA sample was added to a PCR tube containing the HotStar Taq Master Mix and the specific primers and placed in a CFX96 real-time PCR system. The amplification protocol started with an initial activation step of 15 min at 95 °C degrees, followed by 35 cycles of 1 min at 94 °C (denaturation) plus 1 min at 60 °C (annealing), plus 1 min at 72 °C (extension), and a final extension step of 10 min at 72 °C. After amplification, the products were purified using the MiniElute PCR purification kit (#280006 Qiagen) following the manufacturer’s instructions. Eluted DNA was quantified in a Nanodrop 2000 device, the copy numbers were adjusted to 5 × 10⁹ copies/μL, and tenfold serial dilutions were prepared. mtDNA copy number was determined by the ratio between the absolute amounts of mitochondrial gene ND1 versus the absolute amount of the B2M nuclear gene in each sample, using the CFX96 Manager software (v. 3.0; Bio-Rad).

4.3. Gene Expression Analysis by PCR Array

RNA extraction was performed following the protocol previously described by Cox et al. [70]. RNA was quantified spectrophotometrically using Thermo Scientific NanoDrop 2000 spectrophotometer (ThermoFisher Scientific, Waltham, MA, USA) and stored at −80 °C. The RNA purity and quality were checked by Ultraviolet spectrophotometry as described elsewhere [12]. After RNA preparation, the samples were treated as previously described [12]. The RT2 Profiler polymerase chain reaction (PCR) Array System (SuperArray Bioscience (Frederick, MD, USA), SA Biosciences (Frederick, MD, USA), Qiagen (Hilden, Germany)), was used to evaluate the different cardiac mitochondrial transcripts between control and MNR fetuses as previously described [12]. Each PCR array contained 84 transcripts of the corresponding signaling pathway, a set of five reference genes as internal controls, and additional controls for efficiency of reverse transcription, PCR, and the absence of contaminating genomic DNA. Data were normalized with three endogenous controls that did not differ between groups hypoxanthine phosphoribosyltransferase 1 (HPRT1), ribosomal protein L13a (RPL13A), and Beta-actin (ACTB) and analyzed with the ΔΔCt method (where Ct is threshold cycle) using the PCR Array Data Analysis Web Portal (SA Biosciences). The transcripts used in this study are listed in Table 4 and Table 5.

4.4. Protein Analyses via Western Blotting

Protein analyses via Western blotting were performed following standard protocols [71]. Sample preparation and protein extraction were performed according to previously described protocols [12]. Extracted proteins were solubilized to achieve a concentration of 1 mg/mL or 2 mg/mL of protein with Laemmli buffer (62.5 mM Tris pH 6.8 (HCl), 50% glycerol, 2% SDS, 0.005% bromophenol blue, supplemented with 5% β-mercaptoethanol) and boiled for 5 min in a water bath and then centrifuged at 14,000× g for 5 min. Equivalent amounts of total protein (10 μg per lane) were loaded in a 10–20% gradient Tris-HCl polyacrylamide gel as well as two different standards for molecular weight estimation and for monitoring electrophoresis progress, the Precision Plus Protein Dual Color Standards (Bio-Rad) and the SeeBlue Plus2 Pre-Stained Standard (ThermoFisher Scientific (Waltham, MA, USA), Invitrogen (Waltham, MA, USA)). Electrophoresis was carried out at room temperature in a Criterion system (Bio-Rad) using 150 V until the sample buffer (blue) reaches the bottom of the gel (≈90 min). After separation by SDS-PAGE, proteins were electrophoretically transferred in a TransBlot Cell system (Bio-Rad) to a polyvinylidene difluoride (PVDF) membrane previously activated, a constant amperage (0.5 A) for 2 h at 4 °C using a CAPS transfer buffer (10 mM 3-(Cyclohexylamino)-1-propanesulfonic acid pH 11 (NaOH), 10% methanol). The quality of the electrophoretic transfer was evaluated by the complete transfer of pre-stained molecular weight markers below 100 kDa and via Ponceau staining. Ponceau results were also used to confirm an equal amount of protein loading and to normalize band density. After Ponceau removal, the membranes were blocked in 5% non-fat milk/PBS overnight at 4 °C with agitation. Before incubation with primary antibodies, the membrane was washed for 10 min in PBS 0.05% Tween-20 (PBS-T). Primary antibodies were prepared in 1% non-fat milk/PBS to a final volume of 5 mL and incubated overnight at 4 °C. After incubation with primary antibodies, membranes were washed with PBS-T solution three times, 5 min each, and incubated with the correspondent alkaline phosphatase-conjugated secondary antibodies for 2 h at room temperature with stirring. For immunodetection, membranes were washed three times for 5 min each with PBS-T, rinsed in PBS to remove any Tween-20, which can be inhibitory to the detection method, dried, and incubated with an enhanced chemifluorescence (ECF) system (#RPN5785, GE Healthcare, Little Chalfont, Buckinghamshire, UK) during a maximum of 5 min. Density analysis of bands was carried out with VisionWorks LS Image Acquisition and Analysis Software (UVP). The resulting images were analyzed and densities were normalized to Ponceau. The average value of the C-Males (M) group was assumed as one unit, and the values of each sample were determined proportionally. All of the primary antibodies used in this experiment were purchased from abcam: NDUFB8 (1:500, ab110242), UQCRC2 (1:500, ab14745), MT-CO2 (1:500, ab110258), COX6C (1:1000, ab150422), ATP5A (1:500, ab110273), TOMM20 (1:500, sc11415), TFAM (1:00, sc23588), and citrate synthase (1:1000, ab129088). All of the secondary antibodies were purchased from Santa Cruz and were used in a 1:5000 dilution: rabbit (sc-2007), mouse (sc-2008), goat (sc-2771).

4.5. Data Analysis and Statistics

The software GraphPad Prism version 8.0 (GraphPad Software, San Diego, CA, USA) was used for data analysis. Each pregnant baboon and the corresponding fetus were considered an experimental unit. Outbred pregnant female baboons were randomly assigned to control or MNR groups. Data are expressed as mean or as mean ± SD. Normality was assessed via the Kolmogorov–Smirnov or Shapiro–Wilk tests. To assess the effect of MNR on fetal cardiac mitochondrial parameters, the following comparisons were made: (1) only to evaluate diet-induced alterations, independently of fetal sex: between Control (C) vs. MNR; (2) to simultaneously assess the impact of diet and sex: between male control (C-M) vs. female control (C-F), male MNR (MNR-M) vs. C-M, female MNR (MNR-F) vs. C-F, and MNR-M vs. MNR-F. The orange software (version 3.32.0) was used for the computational data analysis and visualization. Clustering (opt ordering) was applied to both columns and rows. Data were normalized for value ranges between −1 and 1.

5. Conclusions

In this study, 30% MNR led to sex-specific alterations on the NHP fetal cardiac left-ventricle mitochondrial-related gene expression at 90 days old (0.5 G), some of which persisted until near term (0.9 G). More than half of the MNR-induced gene expression alterations encode for OXPHOS complex subunits. Given that the OXPHOS system is primarily responsible for energy production in the mitochondria, early IUGR-induced mitochondrial adaptations could play a role in IUGR offspring’s increased predisposition to CVD. The fact that we here showed that MNR can induce fetal cardiac mitochondrial function alterations as early as the mid-gestation period highlights the need to better understand the early origins of CVD, which can provide new targets for disease prevention and mitigation.

Supplementary Materials

The supporting information can be downloaded at: https://www.mdpi.com/article/10.3390/ijms242015192/s1.

Author Contributions

Conceptualization, S.P.P., M.J.N. and P.W.N.; Methodology, S.P.P., T.C.-O., C.L. and M.J.N.; Software, S.P.P.; Validation, L.C.T.; Formal analysis, S.P.P. and M.S.D.; Investigation, S.P.P., T.C.-O.; Data curation, S.P.P. and M.S.D.; Writing—original draft, M.S.D.; Writing—review and editing, S.P.P., T.C.-O. and L.A.C.; Visualization, S.P.P. and M.S.D.; Supervision, S.P.P., M.J.N., P.W.N. and P.J.O.; Project administration, C.L., L.A.C., M.J.N., P.W.N. and P.J.O.; Funding acquisition, L.A.C., M.J.N., P.W.N. and P.J.O. All authors have read and agreed to the published version of the manuscript.

Funding

This research was funded by ERDF funds through the Operational Programme for Competitiveness (COMPETE 2020) and national funds by Foundation for Science and Technology under FCT Post-doctoral Fellowship (SPP, SFRH/BPD/116061/2016), FCT doctoral Fellowship (MSD, SFRH/BD/11934/2022), project grant PTDC/DTP-DES/1082/2014 (POCI-01-0145-FEDER-016657), CENTRO-01-0246-FEDER-000010 (Multidisciplinary Institute of Ageing in Coimbra), and strategic projects UIDB/04539/2020, UIDP/04539/2020, LA/P/0058/2020. Program Project Grant (P01) from the National Institutes of Health, USA [PO1-HD21350 to P.W.N., C.L. and M.J.N.] and R24 RR021367. Resources and facilities were also supported by the Southwest National Primate Research Center, San Antonio, TX, USA grant [P51-RR013986] from the National Center for Research Resources, NIH, currently supported by the Office of Research Infrastructure Programs through [P51-OD011133] and [C06-RR013556]. It was also funded by the European Union (HORIZON-HLTH-2022-STAYHLTH-101080329). Views and opinions expressed are, however, those of the author(s) only and do not necessary reflect those of the European Union or the Health and Digital Executive Agency. Neither the European Union nor the granting authority can be held responsible for them. The funding agencies had no role in study design, data collection and analysis, decision to publish, or preparation of this document.

Institutional Review Board Statement

All animal procedures, including pain relief, were approved by the Animal Care and Use Committees of the Texas Biomedical Research Institute and the University of Texas Health Science Center at San Antonio, TX (no. 1134PC). These procedures were carried out in facilities approved by the Association for Assessment and Accreditation of Laboratory Animal Care and in accordance with the NIH Guide for the Care and Use of Laboratory Animals.

Informed Consent Statement

Not applicable.

Data Availability Statement

The data presented in this study are available on request from the corresponding author.

Acknowledgments

The authors dedicate the present paper to the late Thomas J. McDonald from University of Texas Health Science Center at San Antonio. The authors acknowledge the contributions by Paulina Quezada, Greg Langone, Michelle Zavala, Ana Maria Silva, Leslie Myatt, Nagarjun Kasaraneni, Chunming Guo, Balasubashini Muralimanoharan, James Mele, Karen Moore and Susan Jenkins.

Conflicts of Interest

The author states there are no conflict of interest.

References

  1. Andersson, C.; Vasan, R.S. Epidemiology of Cardiovascular Disease in Young Individuals. Nat. Rev. Cardiol. 2018, 15, 230–240. [Google Scholar] [CrossRef] [PubMed]
  2. Flora, G.D.; Nayak, M.K. A Brief Review of Cardiovascular Diseases, Associated Risk Factors and Current Treatment Regimes. Curr. Pharm. Des. 2019, 25, 4063–4084. [Google Scholar] [CrossRef] [PubMed]
  3. Gerdts, E.; Regitz-Zagrosek, V. Sex Differences in Cardiometabolic Disorders. Nat. Med. 2019, 25, 1657–1666. [Google Scholar] [CrossRef]
  4. Grilo, L.F.; Tocantins, C.; Diniz, M.S.; Gomes, R.M.; Oliveira, P.J.; Matafome, P.; Pereira, S.P. Metabolic Disease Programming: From Mitochondria to Epigenetics, Glucocorticoid Signalling and Beyond. Eur. J. Clin. Invest. 2021, 51. [Google Scholar] [CrossRef]
  5. Diniz, M.S.; Grilo, L.F.; Tocantins, C.; Falcão-Pires, I.; Pereira, S.P. Made in the Womb: Maternal Programming of Offspring Cardiovascular Function by an Obesogenic Womb. Metabolites 2023, 13, 845. [Google Scholar] [CrossRef]
  6. McDonald, T.J.; Wu, G.; Nijland, M.J.; Jenkins, S.L.; Nathanielsz, P.W.; Jansson, T. Effect of 30% Nutrient Restriction in the First Half of Gestation on Maternal and Fetal Baboon Serum Amino Acid Concentrations. Br. J. Nutr. 2013, 109, 1382–1388. [Google Scholar] [CrossRef]
  7. Kesavan, K.; Devaskar, S.U. Intrauterine Growth Restriction: Postnatal Monitoring and Outcomes. Pediatr. Clin. N. Am. 2019, 66, 403–423. [Google Scholar] [CrossRef] [PubMed]
  8. Deter, R.L.; Lee, W.; Dicker, P.; Tully, E.C.; Cody, F.; Malone, F.D.; Flood, K.M. Growth patterns and cardiovascular abnormalities in small for gestational age fetuses: 1. Pattern characteristics. J. Matern. Neonatal Med. 2019, 34, 3029–3038. [Google Scholar] [CrossRef] [PubMed]
  9. Cohen, E.; Wong, F.Y.; Horne, R.S.C.; Yiallourou, S.R. Intrauterine Growth Restriction: Impact on Cardiovascular Development and Function throughout Infancy. Pediatr. Res. 2016, 79, 821–830. [Google Scholar] [CrossRef]
  10. Jonker, S.S.; Kamna, D.; LoTurco, D.; Kailey, J.; Brown, L.D. IUGR Impairs Cardiomyocyte Growth and Maturation in Fetal Sheep. J. Endocrinol. 2018, 239, 253–265. [Google Scholar] [CrossRef]
  11. Zogopoulos, G.; Nathanielsz, P.; Hendy, G.; Goodyer, C. The Baboon: A Model for the Study of Primate Growth Hormone Receptor Gene Expression during Development. J. Mol. Endocrinol. 1999, 23, 67–75. [Google Scholar] [CrossRef] [PubMed]
  12. Pereira, S.P.; Tavares, L.C.; Duarte, A.I.; Baldeiras, I.; Cunha-Oliveira, T.; Martins, J.D.; Santos, M.S.; Maloyan, A.; Moreno, A.J.; Cox, L.A.; et al. Sex-Dependent Vulnerability of Fetal Nonhuman Primate Cardiac Mitochondria to Moderate Maternal Nutrient Reduction. Clin Sci (Lond) 2021, 135, 1103–1126. [Google Scholar] [CrossRef] [PubMed]
  13. Singh, A.; Kukreti, R.; Saso, L.; Kukreti, S. Oxidative Stress: A Key Modulator in Neurodegenerative Diseases. Molecules 2019, 24, 1583. [Google Scholar] [CrossRef] [PubMed]
  14. Pizzino, G.; Irrera, N.; Cucinotta, M.; Pallio, G.; Mannino, F.; Arcoraci, V.; Squadrito, F.; Altavilla, D.; Bitto, A. Oxidative Stress: Harms and Benefits for Human Health. Oxid. Med. Cell. Longev. 2017, 2017, 8416763. [Google Scholar] [CrossRef] [PubMed]
  15. Li, C.; McDonald, T.J.; Wu, G.; Nijland, M.J.; Nathanielsz, P.W. Intrauterine Growth Restriction Alters Term Fetal Baboon Hypothalamic Appetitive Peptide Balance. J. Endocrinol. 2013, 217, 275–282. [Google Scholar] [CrossRef]
  16. Kuo, A.H.; Li, C.; Li, J.; Huber, H.F.; Nathanielsz, P.W.; Clarke, G.D. Cardiac Remodelling in a Baboon Model of Intrauterine Growth Restriction Mimics Accelerated Ageing. J. Physiol. 2017, 595, 1093–1110. [Google Scholar] [CrossRef] [PubMed]
  17. Bravo-San Pedro, J.M.; Kroemer, G.; Galluzzi, L. Autophagy and Mitophagy in Cardiovascular Disease. Circ. Res. 2017, 120, 1812–1824. [Google Scholar] [CrossRef]
  18. Kroemer, G.; Galluzzi, L.; Brenner, C. Mitochondrial Membrane Permeabilization in Cell Death. Physiol. Rev. 2007, 87, 99–163. [Google Scholar] [CrossRef]
  19. Vringer, E.; Tait, S.W.G. Mitochondria and cell death-associated inflammation. Cell Death Differ. 2022, 30, 304–312. [Google Scholar] [CrossRef]
  20. Zhang, X.; Wu, X.; Hu, Q.; Wu, J.; Wang, G.; Hong, Z.; Ren, J. Mitochondrial DNA in liver inflammation and oxidative stress. Life Sci. 2019, 236, 116464. [Google Scholar] [CrossRef]
  21. Riley, J.S.; Quarato, G.; Cloix, C.; Lopez, J.; O’Prey, J.; Pearson, M.; Chapman, J.; Sesaki, H.; Carlin, L.M.; Passos, J.F.; et al. Mitochondrial inner membrane permeabilisation enables mt DNA release during apoptosis. EMBO J. 2018, 37, e99238. [Google Scholar] [CrossRef] [PubMed]
  22. Tocantins, C.; Diniz, M.S.; Grilo, L.F.; Pereira, S.P. The Birth of Cardiac Disease: Mechanisms Linking Gestational Diabetes Mellitus and Early Onset of Cardiovascular Disease in Offspring. WIREs Mech. Dis. 2022, 14. [Google Scholar] [CrossRef] [PubMed]
  23. A Mohamed, T.M.; Abouleisa, R.; Hill, B.G. Metabolic Determinants of Cardiomyocyte Proliferation. Stem Cells 2022, 40, 458–467. [Google Scholar] [CrossRef]
  24. Torres-Cuevas, I.; Parra-Llorca, A.; Sánchez-Illana, Á.; Nuñez-Ramiro, A.; Kuligowski, J.; Cháfer-Pericás, C.; Cernada, M.; Escobar, J.; Vento, M. Oxygen and oxidative stress in the perinatal period. Redox Biol. 2017, 12, 674–681. [Google Scholar] [CrossRef] [PubMed]
  25. Sánchez-Díaz, M.; Nicolás-Ávila, J.Á.; Cordero, M.D.; Hidalgo, A. Mitochondrial Adaptations in the Growing Heart. Trends in Endocrinology & Metabolism 2020, 31, 308–319. [Google Scholar] [CrossRef]
  26. May-Panloup, P.; Boguenet, M.; Hachem, H.; Bouet, P.-E.; Reynier, P. Embryo and Its Mitochondria. Antioxidants 2021, 10, 139. [Google Scholar] [CrossRef]
  27. Pohjoismäki, J.L.; Goffart, S. The role of mitochondria in cardiac development and protection. Free. Radic. Biol. Med. 2017, 106, 345–354. [Google Scholar] [CrossRef]
  28. Piquereau, J.; Ventura-Clapier, R. Maturation of Cardiac Energy Metabolism During Perinatal Development. Front. Physiol. 2018, 9. [Google Scholar] [CrossRef]
  29. Chung, S.; Dzeja, P.P.; Faustino, R.S.; Perez-Terzic, C.; Behfar, A.; Terzic, A. Mitochondrial Oxidative Metabolism Is Required for the Cardiac Differentiation of Stem Cells. Nat. Clin. Pract. Cardiovasc. Med. 2007, 4, S60–S67. [Google Scholar] [CrossRef]
  30. Sahara, M.; Santoro, F.; Sohlmér, J.; Zhou, C.; Witman, N.; Leung, C.Y.; Mononen, M.; Bylund, K.; Gruber, P.; Chien, K.R. Population and Single-Cell Analysis of Human Cardiogenesis Reveals Unique LGR5 Ventricular Progenitors in Embryonic Outflow Tract. Dev. Cell 2019, 48, 475–490.e7. [Google Scholar] [CrossRef]
  31. Männer, J. When Does the Human Embryonic Heart Start Beating? A Review of Contemporary and Historical Sources of Knowledge about the Onset of Blood Circulation in Man. J. Cardiovasc. Dev. Dis. 2022, 9, 187. [Google Scholar] [CrossRef] [PubMed]
  32. Wu, G.; Bazer, F.W.; Cudd, T.A.; Meininger, C.J.; Spencer, T.E. Maternal Nutrition and Fetal Development. J. Nutr. 2004, 134, 2169–2172. [Google Scholar] [CrossRef]
  33. Jain, S.; Maheshwari, A.; Jain, S.K. Maternal Nutrition and Fetal/Infant Development. Clin. Perinatol. 2022, 49, 313–330. [Google Scholar] [CrossRef]
  34. Lindsay, K.L.; Buss, C.; Wadhwa, P.D.; Entringer, S. The Interplay Between Nutrition and Stress in Pregnancy: Implications for Fetal Programming of Brain Development. Biol. Psychiatry 2018, 85, 135–149. [Google Scholar] [CrossRef]
  35. Ghaly, A.; Maki, Y.; Nygard, K.; Hammond, R.; Hardy, D.B.; Richardson, B.S. Maternal nutrient restriction in guinea pigs leads to fetal growth restriction with increased brain apoptosis. Pediatr. Res. 2018, 85, 105–112. [Google Scholar] [CrossRef]
  36. Heasman, L.; Clarke, L.; Stephenson, T.J.; Symonds, M.E. The influence of maternal nutrient restriction in early to mid-pregnancy on placental and fetal development in sheep. Proc. Nutr. Soc. 1999, 58, 283–288. [Google Scholar] [CrossRef] [PubMed]
  37. Kovalskys, I.; Mazza, C.S. 3.17 Infants Born Small for Gestational Age at Term. In Pediatric Nutrition in Practice; Karger: Basel, Switzerland, 2022; pp. 338–344. [Google Scholar] [CrossRef]
  38. Wilcox, A.J.; Cortese, M.; McConnaughey, D.R.; Moster, D.; Basso, O. The limits of small-for-gestational-age as a high-risk category. Eur. J. Epidemiol. 2021, 36, 985–991. [Google Scholar] [CrossRef] [PubMed]
  39. Christian, P. Fetal Growth Restriction and Preterm as Determinants of Child Growth in the First Two Years and Potential Interventions. In International Nutrition: Achieving Millennium Goals and Beyond; Karger: Basel, Switzerland, 2014; pp. 81–91. [Google Scholar] [CrossRef]
  40. Sandoval, C.; Wu, G.; Smith, S.B.; Dunlap, K.A.; Satterfield, M.C. Maternal Nutrient Restriction and Skeletal Muscle Development: Consequences for Postnatal Health. In Amino Acids in Nutrition and Health; Springer: Cham, Switzerland, 2020; pp. 153–165. [Google Scholar] [CrossRef]
  41. Albu, A.; Anca, A.; Horhoianu, V.; Horhoianu, I. Predictive factors for intrauterine growth restriction. J. Med. Life 2014, 7, 165–171. [Google Scholar]
  42. Dapkekar, P.; Bhalerao, A.; Kawathalkar, A.; Vijay, N. Risk Factors Associated With Intrauterine Growth Restriction: A Case-Control Study. Cureus 2023, 15, e40178. [Google Scholar] [CrossRef]
  43. Menendez-Castro, C.; Rascher, W.; Hartner, A. Intrauterine Growth Restriction—Impact on Cardiovascular Diseases Later in Life. Mol. Cell Pediatr. 2018, 5. [Google Scholar] [CrossRef]
  44. Dorn, G.W.; Vega, R.B.; Kelly, D.P. Mitochondrial biogenesis and dynamics in the developing and diseased heart. Minerva Anestesiol. 2015, 29, 1981–1991. [Google Scholar] [CrossRef] [PubMed]
  45. Economides, D.L.; Nicolaides, K.H. Blood Glucose and Oxygen Tension Levels in Small-for-Gestational-Age Fetuses. Am. J. Obstet. Gynecol. 1989, 160, 385–389. [Google Scholar] [CrossRef]
  46. Smoak, I.W. Hypoglycemia and embryonic heart development. Front. Biosci. 2002, 7, d307–d318. [Google Scholar] [CrossRef] [PubMed]
  47. Smoak, I.W.; Branch, S. Glut-1 expression and its response to hypoglycemia in the embryonic mouse heart. Anat. Embryol. 2000, 201, 327–333. [Google Scholar] [CrossRef]
  48. Tan, C.M.J.; Lewandowski, A.J. The Transitional Heart: From Early Embryonic and Fetal Development to Neonatal Life. Fetal Diagn. Ther. 2020, 47, 373–386. [Google Scholar] [CrossRef]
  49. Garbern, J.C.; Lee, R.T. Mitochondria and Metabolic Transitions in Cardiomyocytes: Lessons from Development for Stem Cell-Derived Cardiomyocytes. Stem Cell Res. Ther. 2021, 12, 1–25. [Google Scholar] [CrossRef] [PubMed]
  50. Brown, S.M.; Larsen, N.K.; Thankam, F.G.; Agrawal, D.K. Fetal Cardiomyocyte Phenotype, Ketone Body Metabolism, and Mitochondrial Dysfunction in the Pathology of Atrial Fibrillation. Mol. Cell Biochem. 2021, 476, 1165. [Google Scholar] [CrossRef]
  51. Zhao, Q.; Sun, Q.; Zhou, L.; Liu, K.; Jiao, K. Complex Regulation of Mitochondrial Function during Cardiac Development. J. Am. Heart Assoc. 2019, 8. [Google Scholar] [CrossRef]
  52. Watanabe, M.; Jafri, A.; Fisher, S.A. Apoptosis Is Required for the Proper Formation of the Ventriculo-Arterial Connections. Dev. Biol. 2001, 240, 274–288. [Google Scholar] [CrossRef]
  53. Kasahara, A.; Cipolat, S.; Chen, Y.; Dorn, G.W.; Scorrano, L. Mitochondrial Fusion Directs Cardiomyocyte Differentiation via Calcineurin and Notch Signaling. Science 2013, 342, 734–737. [Google Scholar] [CrossRef]
  54. Hsiao, C.P.; Chen, M.K.; Veigl, M.L.; Ellis, R.; Cooney, M.; Daly, B.; Hoppel, C. Relationships between Expression of BCS1L, Mitochondrial Bioenergetics, and Fatigue among Patients with Prostate Cancer. Cancer Manag. Res. 2019, 11, 6703–6717. [Google Scholar] [CrossRef]
  55. Beeckmans, S. Some structural and regulatory aspects of citrate synthase. Int. J. Biochem. 1984, 16, 341–351. [Google Scholar] [CrossRef] [PubMed]
  56. Beauchamp, B.; Thrush, A.B.; Quizi, J.; Antoun, G.; McIntosh, N.; Al-Dirbashi, O.Y.; Patti, M.E.; Harper, M.E. Undernutrition during Pregnancy in Mice Leads to Dysfunctional Cardiac Muscle Respiration in Adult Offspring. Biosci. Rep. 2015, 35, 1–10. [Google Scholar] [CrossRef]
  57. TL, L.; CR, T.; CL, Y.; YP, W.; SH, K. Estrogen Receptor-β in Mitochondria: Implications for Mitochondrial Bioenergetics and Tumorigenesis. Ann. N. Y Acad. Sci. 2015, 1350, 52–60. [Google Scholar] [CrossRef]
  58. Gonzalez-Tendero, A.; Torre, I.; Garcia-Canadilla, P.; Crispi, F.; García-García, F.; Dopazo, J.; Bijnens, B.; Gratacós, E. Intrauterine Growth Restriction Is Associated with Cardiac Ultrastructural and Gene Expression Changes Related to the Energetic Metabolism in a Rabbit Model. Am. J. Physiol. Heart Circ. Physiol. 2013, 305. [Google Scholar] [CrossRef]
  59. Guitart-Mampel, M.; Gonzalez-Tendero, A.; Niñerola, S.; Morén, C.; Catalán-Garcia, M.; González-Casacuberta, I.; Juárez-Flores, D.L.; Ugarteburu, O.; Matalonga, L.; Cascajo, M.V.; et al. Cardiac and Placental Mitochondrial Characterization in a Rabbit Model of Intrauterine Growth Restriction. Biochim. Biophys. Acta Gen. Subj. 2018, 1862, 1157–1167. [Google Scholar] [CrossRef]
  60. Zhang, J.; Xiang, H.; Liu, J.; Chen, Y.; He, R.R.; Liu, B. Mitochondrial Sirtuin 3: New Emerging Biological Function and Therapeutic Target. Theranostics 2020, 10, 8315–8342. [Google Scholar] [CrossRef] [PubMed]
  61. De Carvalho, A.E.T.S.; Bassaneze, V.; Forni, M.F.; Keusseyan, A.A.; Kowaltowski, A.J.; Krieger, J.E. Early Postnatal Cardiomyocyte Proliferation Requires High Oxidative Energy Metabolism. Sci. Rep. 2017, 7. [Google Scholar] [CrossRef]
  62. Bisaccia, G.; Ricci, F.; Gallina, S.; Di Baldassarre, A.; Ghinassi, B. Mitochondrial Dysfunction and Heart Disease: Critical Appraisal of an Overlooked Association. Int. J. Mol. Sci. 2021, 22, 614. [Google Scholar] [CrossRef] [PubMed]
  63. Stamerra, C.A.; Di Giosia, P.; Giorgini, P.; Ferri, C.; Sukhorukov, V.N.; Sahebkar, A. Mitochondrial Dysfunction and Cardiovascular Disease: Pathophysiology and Emerging Therapies. Oxid. Med. Cell. Longev. 2022, 2022, 9530007. [Google Scholar] [CrossRef]
  64. Elias, A.A.; Maki, Y.; Matushewski, B.; Nygard, K.; Regnault, T.R.H.; Richardson, B.S. Maternal Nutrient Restriction in Guinea Pigs Leads to Fetal Growth Restriction with Evidence for Chronic Hypoxia. Pediatr. Res. 2017, 82, 141–147. [Google Scholar] [CrossRef]
  65. Radford, B.N.; Han, V.K.M. Evidence of Increased Hypoxia Signaling in Fetal Liver from Maternal Nutrient Restriction in Mice. Pediatr. Res. 2020, 87, 450–455. [Google Scholar] [CrossRef]
  66. Natarajan, B.; Arige, V.; Khan, A.A.; Reddy, S.S.; Barthwal, M.K.; Mahapatra, N.R. Hypoxia-Mediated Regulation of Mitochondrial Transcription Factors in Renal Epithelial Cells: Implications for Hypertensive Renal Physiology. Hypertens. Res. 2021, 44, 154–167. [Google Scholar] [CrossRef] [PubMed]
  67. Li, H.-S.; Zhou, Y.-N.; Li, L.; Li, S.-F.; Long, D.; Chen, X.-L.; Zhang, J.-B.; Feng, L.; Li, Y.-P. HIF-1α Protects against Oxidative Stress by Directly Targeting Mitochondria. Redox Biol. 2019, 25, 101109. [Google Scholar] [CrossRef]
  68. Nissanka, N.; Moraes, C.T. Mitochondrial DNA Damage and Reactive Oxygen Species in Neurodegenerative Disease. FEBS Lett. 2018, 592, 728–742. [Google Scholar] [CrossRef] [PubMed]
  69. Schlabritz-Loutsevitch, N.E.; Howell, K.; Rice, K.; Glover, E.J.; Nevill, C.H.; Jenkins, S.L.; Cummins, L.B.; Frost, P.A.; McDonald, T.J.; Nathanielsz, P.W. Development of a System for Individual Feeding of Baboons Maintained in an Outdoor Group Social Environment. J. Med. Primatol. 2004, 33, 117–126. [Google Scholar] [CrossRef]
  70. Cox, L.A.; Nijland, M.J.; Gilbert, J.S.; Schlabritz-Loutsevitch, N.E.; Hubbard, G.B.; McDonald, T.J.; Shade, R.E.; Nathanielsz, P.W. Effect of 30 per Cent Maternal Nutrient Restriction from 0.16 to 0.5 Gestation on Fetal Baboon Kidney Gene Expression. J. Physiol. 2006, 572, 67–85. [Google Scholar] [CrossRef]
  71. Machado, N.G.; Baldeiras, I.; Pereira, G.C.; Pereira, S.P.; Oliveira, P.J. Sub-Chronic Administration of Doxorubicin to Wistar Rats Results in Oxidative Stress and Unaltered Apoptotic Signaling in the Lung. Chem. Biol. Interact. 2010, 188, 478–486. [Google Scholar] [CrossRef] [PubMed]
Figure 1. Plasma amino acid profile in 90-day-old control (C) fetuses and fetuses born from maternal nutrient reduction (MNR) conditions. Heatmap representation of plasmatic amino acid variation: in Control (C): fetuses born from mothers fed a control diet; in MNR: fetuses born from mothers fed a 30% nutrient reduction diet. Orange software (version 3.32.0) was used for the computational data analysis and visualization. Clustering (opt ordering) was applied to both columns and rows. Data were normalized for value ranges between −1 and 1. F_GLN—Glutamine; F_HIS—Histidine; F_MET—Methionine; F_ASN—Asparagine; F_TRP—Tryptophane; F_TYR—Tyrosine; F_PHE—Phenylalanine; F_THR—Threonine; F_ILE—Isoleucine; F_LEU—Leucine; F_VAL—Valine; F_ESS—Total essential; F_LYS—Lysine; F_CIT—Citrulline; F_SER—Serine; F_β-ALA—β-Alanine; F_ARG—Arginine; F_GLY—Glycine; F_NE—Non-essential; F_TAU—Taurine; F_ALA—Alanine; F_ORN—Ornithine; F_GLU—Glutamate; F_ASP—Aspartame.
Ijms 24 15192 g001
Figure 2. Cardiac left ventricle (LV) tissue gene expression of 90-day-old control (C) fetuses and fetuses born from maternal nutrient reduction (MNR) conditions. (A) Gene expression heatmap view of Control fetuses born from mothers fed a control diet and MNR fetuses born from mothers fed a 30% nutrient-reduced diet; (B) differences in gene expression of fetal cardiac left ventricle (LV) tissue of fetuses in MNR conditions relative to the Control group, dots represent the plot between log10(2−Delta(Ct)) for the control group and MNR for each gene represented in Table 3, in blue—unaltered gene expression, in red—lower gene expression, in green—higher gene expression; (C) variation in fold-regulation of gene expression in fetal cardiac left ventricle tissue of fetuses in MNR conditions relative to the Control group. PCR arrays were used to evaluate mRNA abundance of mitochondrial transcripts. Values were normalized to endogenous controls (hypoxanthine phosphoribosyltransferase 1 (HPRT1), ribosomal protein L13a (RPL13A), and Beta-actin (ACTB)) and are expressed relative to their normalized values. The mean of gene expression for each group is represented (n ≥ 3 per group). Orange software package (version 3.32.0) was used for the computational data analysis and visualization. Clustering (opt ordering) was applied to both columns and rows. Data were normalized for value ranges between −1 and 1. The clustering and heatmap analysis highlight the transcriptional changes. The fold-regulation was calculated between the normalized gene expression of MNR samples and the normalized gene expression of control samples. All of the shown transcripts have a p-value < 0.1 vs. the control group. Comparison between groups was evaluated using a non-parametric Mann–Whitney test. The mean of gene expression is represented (n ≥ 3 per group). A p-value ≤ 0.05 was considered statistically significant (*), and gene expression was considered altered (upregulated or downregulated when comparing C vs. MNR).
Ijms 24 15192 g002
Figure 3. Fold-regulation of 90-day-old fetal cardiac left ventricle (LV) tissues in fetuses in maternal nutrient reduction (MNR) conditions relative to the Control (C) group of the respective sex. Control (C): fetuses born from mothers fed a control diet; MNR: fetuses born from mothers fed a 30% nutrient-restricted diet; C-M/C-F: male/female fetuses born from mothers fed a control diet; MNR-M/F: fetuses born from mothers fed a 30% nutrient-restricted diet. (A) Diagram representing the number of genes from LV of MNR fetuses that were upregulated and downregulated relative to the C group of the same sex; (B,C) Fold-regulation of gene expression analysis of fetal cardiac LV tissue from MNR conditions relative to the C group of the respective sex. PCR arrays were used to evaluate mRNA abundance of mitochondrial transcripts. Values were normalized to endogenous controls (hypoxanthine phosphoribosyltransferase 1 (HPRT1), ribosomal protein L13a (RPL13A), and Beta-actin (ACTB)) and are expressed relative to their normalized values. The fold-regulation was calculated between the normalized gene expression of MNR samples and the normalized gene expression of control samples, according to sex ((B) MNR-M vs. C-M; (C) MNR-F vs. C-F)). All of the present transcripts have a p-value < 0.1 vs. the control group. Comparison between groups was evaluated using a non-parametric Mann–Whitney test (n ≥ 3 per group)). The mean of gene expression is represented. A p-value ≤ 0.05 was considered statistically significant (*), and gene expression was considered altered (upregulated or downregulated).
Ijms 24 15192 g003
Figure 4. Sex-specific differences in gene expression fold-regulation of 90-day-old fetal cardiac left ventricle (LV) tissue. Control (C): fetuses born from mothers fed a control diet; MNR: fetuses born from mothers fed a 30% nutrient-restricted diet; C-M/C-F: male/female fetuses born from mothers fed a control diet; MNR-M/F: fetuses born from mothers fed a 30% nutrient-restricted diet. Fold-regulation of gene expression analysis of fetal cardiac LV tissue from control and MNR groups, according to fetal sex. PCR arrays were used to evaluate mRNA abundance of mitochondrial transcripts. Values were normalized to endogenous controls (hypoxanthine phosphoribosyltransferase 1 (HPRT1), ribosomal protein L13a (RPL13A), and Beta-actin (ACTB)) and are expressed relative to their normalized values. (A) The fold-regulation was calculated between the normalized gene expression of MNR-M samples and the normalized gene expression of MNR-F samples; (B) The fold-regulation was calculated between the normalized gene expression of MNR-M samples and the normalized gene expression of C-M samples (represented in blue) or between the normalized gene expression of MNR-F samples and the normalized gene expression of C-F samples (represented in pink). Comparison between groups was evaluated using a non-parametric Mann–Whitney test. The mean of gene expression is represented (n ≥ 3 per group). A p-value ≤ 0.05 was considered statistically significant (*), and gene expression was considered altered (upregulated or downregulated).
Ijms 24 15192 g004
Figure 5. Cardiac relative band density of mitochondrial function-associated proteins in the left ventricles of 90-day-old fetuses. Control (C): fetuses born from mothers fed a control diet; MNR: fetuses born from mothers fed a 30% nutrient-restricted diet; C-M/C-F: male/female fetuses born from mothers fed a control diet (filled symbols); MNR-M/MNR-F: fetuses born from mothers fed a 30% nutrient-restricted diet (open symbols). (A) Complex I (NADH dehydrogenase) subunit NDUFB8; (B) complex III (cytochrome c reductase) subunit UQCRC2; (C) complex IV subunit COXII; (D) translocase of outer mitochondrial membrane 20 (TOMM20); (E) complex IV (cytochrome c oxidase) subunit 6C (COX6C); (F) ATP synthase subunit ATP5A; (G) mitochondrial transcription factor A (TFAM); (H) citrate synthase. Data are expressed as mean ± SD. Data were normalized with Ponceau S staining and the protein expression represented relative to the mean of the Control group (male). The comparison between groups was performed using a two-way ANOVA (n ≥ 2 per group). Normality was evaluated via Shapiro–Wilk test. Normality was evaluated via Shapiro-Wilk test. *,# p ≤ 0.05; **,## p ≤ 0.01; ### p ≤ 0.001; * vs. Control of the same sex; # vs. same experimental group of the opposite sex. Light green squares represent the experimental groups C and MNR with both sexes combined. Dark blue inverted triangles represent male data, and pink circles represent female data. Filled symbols correspond to the control group, while open symbols correspond to the MNR groups.
Ijms 24 15192 g005
Figure 6. Timeline of maternal nutrition during fetal development. Control group—C; maternal nutrient reduction—MNR.
Ijms 24 15192 g006
Table 1. Summary of gestational parameters. Maternal and fetal morphological parameters at 0.5 gestation in control pregnancies and in maternal nutrient reduction (MNR) conditions via a 30% reduction of the food eaten by control mothers on a weight-adjusted basis.
Maternal and Fetal Morphological Parameters at 0.5 Gestation
Maternal
CombinationMothers of Male FetusesMothers of Female FetusesMann–Whitney U Test
CMNRCMNRCMNRDietMale
C vs. MNR
Female
C vs. MNR
C
M vs. F
MNR
M vs. F
(n = 11)(n = 11)(n = 6)(n = 6)(n = 5)(n = 5)
MeanSEMMeanSEMMeanSEMMeanSEMMeanSEMMeanSEMp−Valuep-Valuep-Valuep-Valuep-Value
Body mass at pre-conception (kg)13.900.4614.260.6113.450.7114.791.0014.340.5913.610.60
Body mass at Cs (kg)13.790.4613.540.6513.410.7514.071.0714.180.5512.900.65
Body mass variation (kg)−0.110.12−0.720.15−0.050.20−0.720.20−0.160.15−0.710.240.0080.047
Age (year)10.790.949.860.8211.271.839.841.4510.300.729.880.74
Fetal
Combined SexMaleFemaleMann–Whitney U Test
CMNRCMNRCMNRDietMale
C vs. MNR
Female
C vs. MNR
C
M vs. F
MNR
M vs. F
(n = 11)(n = 11)(n = 6)(n = 6)(n = 5)(n = 5)
MeanSEMMeanSEMMeanSEMMeanSEMMeanSEMMeanSEMp-Valuep-Valuep-Valuep-Valuep-Value
Body mass (g)101.143.25101.192.96103.325.55103.674.6998.522.9898.223.35
Heart mass (g)0.850.210.810.190.590.070.930.341.120.410.660.05
HW/BW (×1000)8.312.017.841.595.490.618.822.9611.143.726.660.330.047
Body length (cm)17.410.3117.520.2717.000.4117.500.2917.900.4317.540.52
BMI (kg/m2)3.350.123.310.133.580.153.400.223.090.133.200.120.045
Chest circ (cm)58.7711.9252.3212.3935.2516.6448.7517.7787.001.2256.6019.04
Waist circ (cm)49.7710.0244.9510.7930.4214.1042.5015.3573.002.5547.9016.82
Hip circ (cm)64.318.3168.331.6750.6721.8870.002.8972.502.2466.671.67
Femur (cm)3.470.093.200.113.280.103.330.173.700.093.040.130.0140.021
Table 2. Maternal and fetal blood biochemical parameters at 50% gestation in control pregnancies and in the presence of 30% maternal nutrient restriction (MNR) of the food eaten by control mothers on a weight-adjusted basis.
Comparison of Maternal and Fetal Blood Biochemical Parameters at 0.5 G
Maternal
CombinationMothers of Male FetusesMothers of Female FetusesMann–Whitney U Test
CMNRCMNRCMNRDietMale
C vs. MNR
Female
C vs. MNR
C
M vs. F
MNR
M vs. F
(n = 8)(n = 6)(n = 3)(n = 3)(n = 5)(n = 3)
MeanSEMMeanSEMMeanSEMMeanSEMMeanSEMMeanSEMp-Valuep-Valuep-Valuep-Valuep-Value
Hemoglobin (g/dL)12.610.3412.900.4412.730.4613.270.1512.540.5112.530.90
Glucose74.389.6385.8310.6355.672.9197.6713.2285.6013.1574.0015.820.05 0.04
BUN10.250.677.500.438.670.677.330.6711.200.737.670.670.010.020.04
BUN/CREAT Ratio11.591.408.370.6112.303.867.130.4311.160.959.600.400.04
Cholesterol51.635.6442.171.7044.339.2640.002.0056.007.1144.332.40
Total Protein6.700.196.680.166.730.306.730.336.680.276.630.15
Sodium140.000.98142.831.01138.671.86143.671.76140.801.11142.001.150.05
Potassium3.590.103.920.213.370.194.030.183.720.093.800.420.05
Triglycerides28.883.3630.006.1226.674.6333.6711.6730.204.9026.336.12
Fetal
Combined SexMaleFemaleMann–Whitney U Test
CMNRCMNRCMNRDietMale
C vs. MNR
Female
C vs. MNR
C
M vs. F
MNR
M vs. F
(n = 8)(n = 6)(n = 3)(n = 3)(n = 5)(n = 3)
MeanSEMMeanSEMMeanSEMMeanSEMMeanSEMMeanSEMp-ValueP-Valuep-Valuep-Valuep-Value
Hemoglobin (g/dL)11.080.2111.770.1511.370.09..10.650.3511.770.150.04
Glucose47.144.3539.007.4434.507.5043.3315.8452.203.4334.672.730.04
BUN11.000.588.000.529.500.507.330.6711.600.608.670.670.000.020.03
BUN/CREAT Ratio13.970.969.970.9813.353.358.500.7614.220.8811.431.430.04
Cholesterol65.574.0658.503.4365.003.0058.004.9365.805.8059.005.86
Total Protein2.600.062.650.042.600.002.670.032.600.092.630.09
Sodium137.711.66141.400.40134.506.50141.000.00139.000.32141.670.670.010.02
Potassium4.030.284.360.403.500.204.200.904.240.354.470.50
Triglycerides36.434.9428.835.5337.008.0025.004.0436.206.6932.6711.05
Table 3. Fold-regulation of gene expression analysis of 90-day-old fetal cardiac left ventricle (LV) tissue. Control (C): fetuses born from mothers fed a control diet; MNR: fetuses born from mothers fed a 30% nutrient-reduced diet; C-M/C-F: male/female fetuses born from mothers fed a control diet; MNR-M/F: fetuses born from mothers fed a 30% nutrient-reduced diet. PCR arrays were used to evaluate mRNA abundance of mitochondrial transcripts. Values were normalized to endogenous controls (hypoxanthine phosphoribosyltransferase 1 (HPRT1), ribosomal protein L13a (RPL13A), and Beta-actin (ACTB)) and are expressed relative to their normalized values. In the first group, the fold-regulation was calculated between the normalized gene expression of MNR samples and the normalized gene expression of control samples. In the second and third group of analysis, the fold-regulation was calculated between the normalized gene expression of MNR samples and the normalized gene expression of control samples of the respective sex (MNR-M vs. C-M and MNR-F vs. C-F). In the fourth group, the fold-regulation was calculated between the normalized gene expression of MNR-M samples and the normalized gene expression of MNR-F samples. Comparison between groups was evaluated using a non-parametric Mann–Whitney test (n ≥ 2). The mean of gene expression is represented. A p-value ≤ 0.05 was considered statistically significant, and gene expression was considered altered (upregulated or downregulated).
Gene Expression Fold Regulation and p-Value
GroupGeneFold Regulationp-Value
MNR vs. CCDKN2A0.0558
HSPD1−1.62290.0097
BCS1L−1.34460.0089
LHPP−1.47050.0026
NDUFB70.0587
ATP4A−1.50060.0199
NDUFB61.27140.0474
NDUFB31.29520.0125
UQCRC21.36920.0274
COX6C0.0714
BAK10.0856
ATP5O1.1510.0373
ATP5J0.0588
TIMM100.0762
ATP5F10.0595
ATP5A12.20.0089
MNR-M vs. C-MUCP2−1.64450.0155
SLC25A31−1.88920.0416
SLC25A20.0677
PMAIP10.0770
IMMP1L−1.42690.0070
CPT20.0958
TP530.0577
TIMM50−1.61300.0319
TIMM22−1.80630.0223
SOD20.0620
BID0.0759
BBC30.0848
LHPP−1.26080.0369
ATP5A12.30.0004
COX100.0827
UQCRC21.29910.0298
NDUFV31.43130.0382
NDUFB101.88110.0035
TOMM201.13940.0481
MNR-F vs. C-FHSPD1−2.00.0108
CYC1−2.70.0039
UQCRC11.57580.0089
SDHB−1.28560.0066
NDUFA10−1.25610.0236
LHPP−1.78360.0142
COX4I2−1.58590.0211
NDUFS2−1.51580.0022
COX7A2L0.0671
BCS1L−1.79910.0015
NDUFA30.0942
ATP4A−1.95990.0182
SLC25A50.0868
ATP5A12.20.0419
NDUFB60.0974
NDUFB31.48180.0207
MNR-M vs. MNR-FATP5A11.80970.0446
ATP5C10.0996
ATP5G32.43230.0173
COX6A20.0668
NDUFV10.0624
CPT20.0539
DNM1L0.0999
HSPD90AA11.43620.0029
IMMP1L1.54930.0042
MFN10.0924
OPA10.0655
SLC25A21.59270.0175
SLC25A312.23230.0154
TIMM221.57820.0229
TOMM70A1.16830.0102
TP530.0850
UCP21.61870.0465
COX4I2−1.53880.0368
NDUFV3−1.51100.0201
ATP5B0.0588
LHPP−1.53960.0255
CYC1−2.76500.0036
HSPD10.0591
MIPEP−1.19970.0007
SLC25A190.0997
TIMM17A0.0961
TOMM220.0823
TIMM440.0885
TOMM40−1.38420.0427
ATP4A−1.92410.0034
UQCRC1−1.73580.0011
UQCRFS1−1.33000.0213
SDHB−1.40210.0053
SDHD−1.33930.0046
NDUFA1−1.31180.0246
NDUFA11−1.73370.0439
NDUFA3−1.59650.0239
NDUFA8−1.25920.0271
NDUFA7−1.68620.004
NDUFA10−1.41860.0113
NDUFC1−1.30320.0121
NDUFS2−1.78280.0039
NDUFS3−1.33260.0118
NDUFB7−1.62990.0388
TOMM20−1.12200.0320
BCS1L−1.55160.0052
Table 4. Panel of gene expression analyzed using the Human Mitochondrial Energy Metabolism RT2 Profiler PCR Array. This array profiled the expression of 84 key genes involved in mitochondrial energy metabolism, including genes encoding components of the electron transport chain and oxidative phosphorylation complexes. Position indicates the location in the 96-well plate where the transcripts were assessed, Symbol denotes the gene identification, RefSeq denotes the Reference Sequence from the National Center for Biotechnology Information collection, and Description gives summary information about the gene identification and/or function.
PositionSymbolRefseqDescription
A01ATP12ANM_001676ATPase, H+/K+ transporting, nongastric, alpha polypeptide
A02ATP4ANM_000704ATPase, H+/K+ exchanging, alpha polypeptide
A03ATP4BNM_000705ATPase, H+/K+ exchanging, beta polypeptide
A04ATP5A1NM_004046ATP synthase, H+ transporting, mitochondrial F1 complex, alpha subunit 1
A05ATP5BNM_001686ATP synthase, H+ transporting, mitochondrial F1 complex, beta polypeptide
A06ATP5C1NM_005174ATP synthase, H+ transporting, mitochondrial F1 complex, gamma polypeptide 1
A07ATP5F1NM_001688ATP synthase, H+ transporting, mitochondrial Fo complex, subunit B1
A08ATP5G1NM_005175ATP synthase, H+ transporting, mitochondrial Fo complex, subunit C1
A09ATP5G2NM_001002031ATP synthase, H+ transporting, mitochondrial Fo complex, subunit C2
A10ATP5G3NM_001689ATP synthase, H+ transporting, mitochondrial Fo complex, subunit C3
A11ATP5HNM_006356ATP synthase, H+ transporting, mitochondrial Fo complex, subunit d
A12ATP5INM_007100ATP synthase, H+ transporting, mitochondrial Fo complex, subunit E
B01ATP5JNM_001685ATP synthase, H+ transporting, mitochondrial Fo complex, subunit F6
B02ATP5J2NM_004889ATP synthase, H+ transporting, mitochondrial Fo complex, subunit F2
B03ATP5LNM_006476ATP synthase, H+ transporting, mitochondrial Fo complex, subunit G
B04ATP5ONM_001697ATP synthase, H+ transporting, mitochondrial F1 complex, O subunit
B05ATP6V0A2NM_012463ATPase, H+ transporting, lysosomal V0 subunit a2
B06ATP6V0D2NM_152565ATPase, H+ transporting, lysosomal 38 kDa, V0 subunit d2
B07ATP6V1C2NM_144583ATPase, H+ transporting, lysosomal 42 kDa, V1 subunit C2
B08ATP6V1E2NM_080653ATPase, H+ transporting, lysosomal 31 kDa, V1 subunit E2
B09ATP6V1G3NM_133262ATPase, H+ transporting, lysosomal 13 kDa, V1 subunit G3
B10BCS1LNM_004328BCS1-like (S. cerevisiae)
B11COX4I1NM_001861Cytochrome c oxidase subunit IV isoform 1
B12COX4I2NM_032609Cytochrome c oxidase subunit IV isoform 2
C01COX5ANM_004255Cytochrome c oxidase subunit Va
C02COX5BNM_001862Cytochrome c oxidase subunit Vb
C03COX6A1NM_004373Cytochrome c oxidase subunit VIa polypeptide 1
C04COX6A2NM_005205Cytochrome c oxidase subunit VIa polypeptide 2
C05COX6B1NM_001863Cytochrome c oxidase subunit Vib polypeptide 1
C06COX6B2NM_144613Cytochrome c oxidase subunit VIb polypeptide 2
C07COX6CNM_004374Cytochrome c oxidase subunit Vic
C08COX7A2NM_001865Cytochrome c oxidase subunit VIIa polypeptide 2
C09COX7A2LNM_004718Cytochrome c oxidase subunit VIIa polypeptide 2 like
C10COX7BNM_001866Cytochrome c oxidase subunit VIIb
C11COX8ANM_004074Cytochrome c oxidase subunit VIIIA
C12COX8CNM_182971Cytochrome c oxidase subunit VIIIC
D01CYC1NM_001916Cytochrome c-1
D02LHPPNM_022126Phospholysine phosphohistidine inorganic pyrophosphate phosphatase
D03NDUFA1NM_004541NADH dehydrogenase (ubiquinone) 1 alpha subcomplex, 1
D04NDUFA10NM_004544NADH dehydrogenase (ubiquinone) 1 alpha subcomplex, 10
D05NDUFA11NM_175614NADH dehydrogenase (ubiquinone) 1 alpha subcomplex, 11
D06NDUFA2NM_002488NADH dehydrogenase (ubiquinone) 1 alpha subcomplex, 2
D07NDUFA3NM_004542NADH dehydrogenase (ubiquinone) 1 alpha subcomplex, 3
D08NDUFA4NM_002489NADH dehydrogenase (ubiquinone) 1 alpha subcomplex, 4
D09NDUFA5NM_005000NADH dehydrogenase (ubiquinone) 1 alpha subcomplex, 5
D10NDUFA6NM_002490NADH dehydrogenase (ubiquinone) 1 alpha subcomplex, 6
D11NDUFA7NM_005001NADH dehydrogenase (ubiquinone) 1 alpha subcomplex, 7
D12NDUFA8NM_014222NADH dehydrogenase (ubiquinone) 1 alpha subcomplex, 8
E01NDUFAB1NM_005003NADH dehydrogenase (ubiquinone) 1, alpha/beta subcomplex, 1
E02NDUFB10NM_004548NADH dehydrogenase (ubiquinone) 1 beta subcomplex, 10
E03NDUFB2NM_004546NADH dehydrogenase (ubiquinone) 1 beta subcomplex, 2
E04NDUFB3NM_002491NADH dehydrogenase (ubiquinone) 1 beta subcomplex, 3
E05NDUFB4NM_004547NADH dehydrogenase (ubiquinone) 1 beta subcomplex, 4
E06NDUFB5NM_002492NADH dehydrogenase (ubiquinone) 1 beta subcomplex, 5
E07NDUFB6NM_182739NADH dehydrogenase (ubiquinone) 1 beta subcomplex, 6
E08NDUFB7NM_004146NADH dehydrogenase (ubiquinone) 1 beta subcomplex, 7
E09NDUFB8NM_005004NADH dehydrogenase (ubiquinone) 1 beta subcomplex, 8
E10NDUFB9NM_005005NADH dehydrogenase (ubiquinone) 1 beta subcomplex, 9
E11NDUFC1NM_002494NADH dehydrogenase (ubiquinone) 1, subcomplex unknown, 1
E12NDUFC2NM_004549NADH dehydrogenase (ubiquinone) 1, subcomplex unknown, 2
F01NDUFS1NM_005006NADH dehydrogenase (ubiquinone) Fe-S protein 1
F02NDUFS2NM_004550NADH dehydrogenase (ubiquinone) Fe-S protein 2
F03NDUFS3NM_004551NADH dehydrogenase (ubiquinone) Fe-S protein 3
F04NDUFS4NM_002495NADH dehydrogenase (ubiquinone) Fe-S protein 4
F05NDUFS5NM_004552NADH dehydrogenase (ubiquinone) Fe-S protein 5
F06NDUFS6NM_004553NADH dehydrogenase (ubiquinone) Fe-S protein 6
F07NDUFS7NM_024407NADH dehydrogenase (ubiquinone) Fe-S protein 7
F08NDUFS8NM_002496NADH dehydrogenase (ubiquinone) Fe-S protein 8
F09NDUFV1NM_007103NADH dehydrogenase (ubiquinone) flavoprotein 1
F10NDUFV2NM_021074NADH dehydrogenase (ubiquinone) flavoprotein 2
F11NDUFV3NM_021075NADH dehydrogenase (ubiquinone) flavoprotein 3
F12OXA1LNM_005015Oxidase (cytochrome c) assembly 1-like
G01PPA1NM_021129Pyrophosphatase (inorganic) 1
G02PPA2NM_176869Pyrophosphatase (inorganic) 2
G03SDHANM_004168Succinate dehydrogenase complex, subunit A, flavoprotein (Fp)
G04SDHBNM_003000Succinate dehydrogenase complex, subunit B, iron sulfur (Ip)
G05SDHCNM_003001Succinate dehydrogenase complex, subunit C, integral membrane protein
G06SDHDNM_003002Succinate dehydrogenase complex, subunit D, integral membrane protein
G07UQCR11NM_006830Ubiquinol-cytochrome c reductase, complex III subunit XI
G08UQCRC1NM_003365Ubiquinol-cytochrome c reductase core protein I
G09UQCRC2NM_003366Ubiquinol-cytochrome c reductase core protein II
G10UQCRFS1NM_006003Ubiquinol-cytochrome c reductase, Rieske iron-sulfur polypeptide 1
G11UQCRHNM_006004Ubiquinol-cytochrome c reductase hinge protein
G12UQCRQNM_014402Ubiquinol-cytochrome c reductase, complex III subunit VII, 9.5 kDa
H01B2MNM_004048Beta-2-microglobulin
H02HPRT1NM_000194Hypoxanthine phosphoribosyltransferase 1
H03RPL13ANM_012423Ribosomal protein L13a
H04GAPDHNM_002046Glyceraldehyde-3-phosphate dehydrogenase
H05ACTBNM_001101Actin, beta
H06HGDCSA_00105Human Genomic DNA Contamination
H07RTCSA_00104Reverse Transcription Control
H08RTCSA_00104Reverse Transcription Control
H09RTCSA_00104Reverse Transcription Control
H10PPCSA_00103Positive PCR Control
H11PPCSA_00103Positive PCR Control
H12PPCSA_00103Positive PCR Control
Table 5. Panel of gene expression analyzed using the Human Mitochondria RT2 Profiler PCR Array. This array profiled the expression of 84 genes involved in diverse mitochondrial function. The transcripts monitored by this array encoded proteins which are regulators of mitochondrial biogenesis, regulators and mediators of mitochondrial molecular transport, and genes involved in apoptosis. Position indicates the location in the 96-well plate where the gene was assessed, Symbol denotes the gene identification, RefSeq denotes the Reference Sequence from the National Center for Biotechnology Information collection, and Description gives summary information about the gene identification and/or function.
PositionSymbolRefseqDescription
A01AIFM2NM_032797Apoptosis-inducing factor, mitochondrion-associated, 2
A02AIPNM_003977Aryl hydrocarbon receptor-interacting protein
A03BAK1NM_001188BCL2-antagonist/killer 1
A04BBC3NM_014417BCL2 binding component 3
A05BCL2NM_000633B-cell CLL/lymphoma 2, apoptosis regulator
A06BCL2L1NM_138578BCL2-like 1, apoptosis regulator BCLX
A07BIDNM_001196BH3-interacting domain death agonist
A08BNIP3NM_004052BCL2/adenovirus E1B 19kDa-interacting protein 3, pro-apoptotic factor
A09CDKN2ANM_000077Cyclin-dependent kinase inhibitor 2A, inhibits CDK4
A10COX10NM_001303COX10 cytochrome c oxidase assembly protein homolog
A11COX18NM_173827COX18 cytochrome c oxidase assembly homolog
A12CPT1BNM_004377Carnitine palmitoyltransferase 1B
B01CPT2NM_000098Carnitine palmitoyltransferase 2
B02DNAJC19NM_145261DnaJ (Hsp40) homolog, subfamily C, member 19, TIMM14
B03DNM1LNM_005690Dynamin 1-like, mitochondrial and peroxisomal division
B04FIS1NM_016068Mitochondrial fission 1 protein homolog
B05TIMM10BNM_012192Translocase of inner mitochondrial membrane 10 homolog B
B06GRPEL1NM_025196GrpE-like 1, mitochondrial protein import
B07HSP90AA1NM_001017963Heat shock protein 90kDa alpha, class A member 1, folding of target proteins
B08HSPD1NM_002156Heat shock 60kDa protein 1, chaperonin family, folding and assembly of proteins
B09IMMP1LNM_144981Mitochondrial inner membrane protease subunit 1-like
B10IMMP2LNM_032549Mitochondrial inner membrane protease Subunit 2-like
B11LRPPRCNM_133259Leucine-rich PPR-motif containing, cytoskeletal organization and vesicular transport
B12MFN1NM_033540Mitofusin 1, mediator of mitochondrial fusion
C01MFN2NM_014874Mitofusin 2, mediator of mitochondrial fusion
C02MIPEPNM_005932Mitochondrial intermediate peptidase, maturation of OXPHOS-related proteins
C03MSTO1NM_018116Misato homolog 1, mitochondrial distribution and morphology regulator
C04MTX2NM_006554Metaxin 2, mitochondrial outer membrane import complex protein 2
C05NEFLNM_006158Neurofilament, light polypeptide, protein phosphatase 1
C06OPA1NM_130837Optic atrophy 1, mitochondrial dynamin-like GTPase, related to mitochondrial network
C07PMAIP1NM_021127Phorbol-12-myristate-13-acetate-induced protein 1, related to activation of caspases and apoptosis
C08RHOT1NM_018307Ras homolog gene family, member T1, mitochondrial GTPase involved in mitochondrial trafficking
C09RHOT2NM_138769Ras homolog gene family, member T2, mitochondrial GTPase involved in mitochondrial trafficking
C10SFNNM_006142Stratifin
C11SH3GLB1NM_016009SH3-domain GRB2-like endophilin B1, Bax-interacting Factor 1, apoptotic signaling pathway
C12SLC25A1NM_005984Solute carrier family 25 (mitochondrial carrier; citrate transporter), member 1
D01SLC25A10NM_012140Solute carrier family 25 (mitochondrial carrier; dicarboxylate transporter), member 10
D02SLC25A12NM_003705Solute carrier Family 25 (aspartate/glutamate carrier), member 12, calcium carrier
D03SLC25A13NM_014251Solute carrier Family 25 (aspartate/glutamate carrier), member 13
D04SLC25A14NM_003951Solute carrier family 25 (mitochondrial carrier), member 14, UCP5
D05SLC25A15NM_014252Solute carrier family 25 (mitochondrial carrier; ornithine transporter) member 15
D06SLC25A16NM_152707Solute carrier family 25 (mitochondrial carrier), member 16
D07SLC25A17NM_006358Solute carrier family 25 (mitochondrial carrier; peroxisomal membrane protein), member 17
D08SLC25A19NM_021734Solute carrier family 25 (mitochondrial thiamine pyrophosphate carrier), member 19
D09SLC25A2NM_031947Solute carrier family 25 (mitochondrial carrier; ornithine transporter) member 2, ORNT2
D10SLC25A20NM_000387Solute carrier family 25 (carnitine/acylcarnitine translocase), member 20
D11SLC25A21NM_030631Solute carrier family 25 (mitochondrial oxodicarboxylate carrier), member 21
D12SLC25A22NM_024698Solute carrier family 25 (mitochondrial carrier: glutamate), member 22
E01SLC25A23NM_024103Solute carrier family 25 (mitochondrial carrier; phosphate carrier), member 23
E02SLC25A24NM_013386Solute carrier family 25 (mitochondrial carrier; phosphate carrier), member 24
E03SLC25A25NM_052901Solute carrier family 25 (mitochondrial carrier; phosphate carrier), member 25
E04SLC25A27NM_004277Solute carrier family 25, member 27, UCP4
E05SLC25A3NM_002635Solute carrier family 25 (mitochondrial carrier; phosphate carrier), member 3
E06SLC25A30NM_001010875Solute carrier family 25, member 30
E07SLC25A31NM_031291Solute carrier family 25 (mitochondrial carrier; adenine nucleotide translocator), member 31, ANT4
E08SLC25A37NM_016612Solute carrier family 25, (mitochondrial iron transporter), member 37
E09SLC25A4NM_001151Solute carrier family 25 (mitochondrial carrier; adenine nucleotide translocator), member 4, ANT1
E10SLC25A5NM_001152Solute carrier family 25 (mitochondrial carrier; adenine nucleotide translocator), member 5, ANT2
E11SOD1NM_000454Superoxide dismutase 1, soluble, Cu/Zn superoxide dismutase
E12SOD2NM_000636Superoxide dismutase 2, mitochondrial, Fe/Mn superoxide dismutase
F01STARD3NM_006804StAR-related lipid transfer (START) domain containing 3, lipid trafficking protein
F02TAZNM_000116Tafazzin
F03TIMM10NM_012456Translocase of inner mitochondrial membrane 10 homolog (yeast)
F04TIMM17ANM_006335Translocase of inner mitochondrial membrane 17 homolog A (yeast)
F05TIMM17BNM_005834Translocase of inner mitochondrial membrane 17 homolog B (yeast)
F06TIMM22NM_013337Translocase of inner mitochondrial membrane 22 homolog (yeast)
F07TIMM23NM_006327Translocase of inner mitochondrial membrane 23 homolog (yeast)
F08TIMM44NM_006351Translocase of inner mitochondrial membrane 44 homolog (yeast)
F09TIMM50NM_001001563Translocase of inner mitochondrial membrane 50 homolog (S. cerevisiae)
F10TIMM8ANM_004085Translocase of inner mitochondrial membrane 8 homolog A (yeast)
F11TIMM8BNM_012459Translocase of inner mitochondrial membrane 8 homolog B (yeast)
F12TIMM9NM_012460Translocase of inner mitochondrial membrane 9 homolog (yeast)
G01TOMM20NM_014765Translocase of outer mitochondrial membrane 20 homolog (yeast)
G02TOMM22NM_020243Translocase of outer mitochondrial membrane 22 homolog (yeast)
G03TOMM34NM_006809Translocase of outer mitochondrial membrane 34
G04TOMM40NM_006114Translocase of outer mitochondrial membrane 40 homolog (yeast)
G05TOMM40LNM_032174Translocase of outer mitochondrial membrane 40 homolog (yeast)-like
G06TOMM70ANM_014820Translocase of outer mitochondrial membrane 70 homolog A (S. cerevisiae)
G07TP53NM_000546Tumor protein p53, P53 tumor suppressor
G08TSPONM_000714Translocator protein (18kDa), transport of cholesterol
G09UCP1NM_021833Uncoupling protein 1 (mitochondrial, proton carrier), SLC25A7, proton leak
G10UCP2NM_003355Uncoupling protein 2 (mitochondrial, proton carrier), SLC25A8, proton leak
G11UCP3NM_003356Uncoupling protein 3 (mitochondrial, proton carrier), SLC25A9, proton leak
G12UXTNM_004182Ubiquitously expressed transcript
H01B2MNM_004048Beta-2-microglobulin
H02HPRT1NM_000194Hypoxanthine phosphoribosyltransferase 1
H03RPL13ANM_012423Ribosomal protein L13a
H04GAPDHNM_002046Glyceraldehyde-3-phosphate dehydrogenase
H05ACTBNM_001101Actin, beta
H06HGDCSA_00105Human Genomic DNA Contamination
H07RTCSA_00104Reverse Transcription Control
H08RTCSA_00104Reverse Transcription Control
H09RTCSA_00104Reverse Transcription Control
H10PPCSA_00103Positive PCR Control
H11PPCSA_00103Positive PCR Control
H12PPCSA_00103Positive PCR Control
Disclaimer/Publisher’s Note: The statements, opinions and data contained in all publications are solely those of the individual author(s) and contributor(s) and not of MDPI and/or the editor(s). MDPI and/or the editor(s) disclaim responsibility for any injury to people or property resulting from any ideas, methods, instructions or products referred to in the content.

