

Effects of Treadmill Running at Different Light Cycles in Mice with Metabolic Disorders


 and
and
Abstract
:1. Introduction
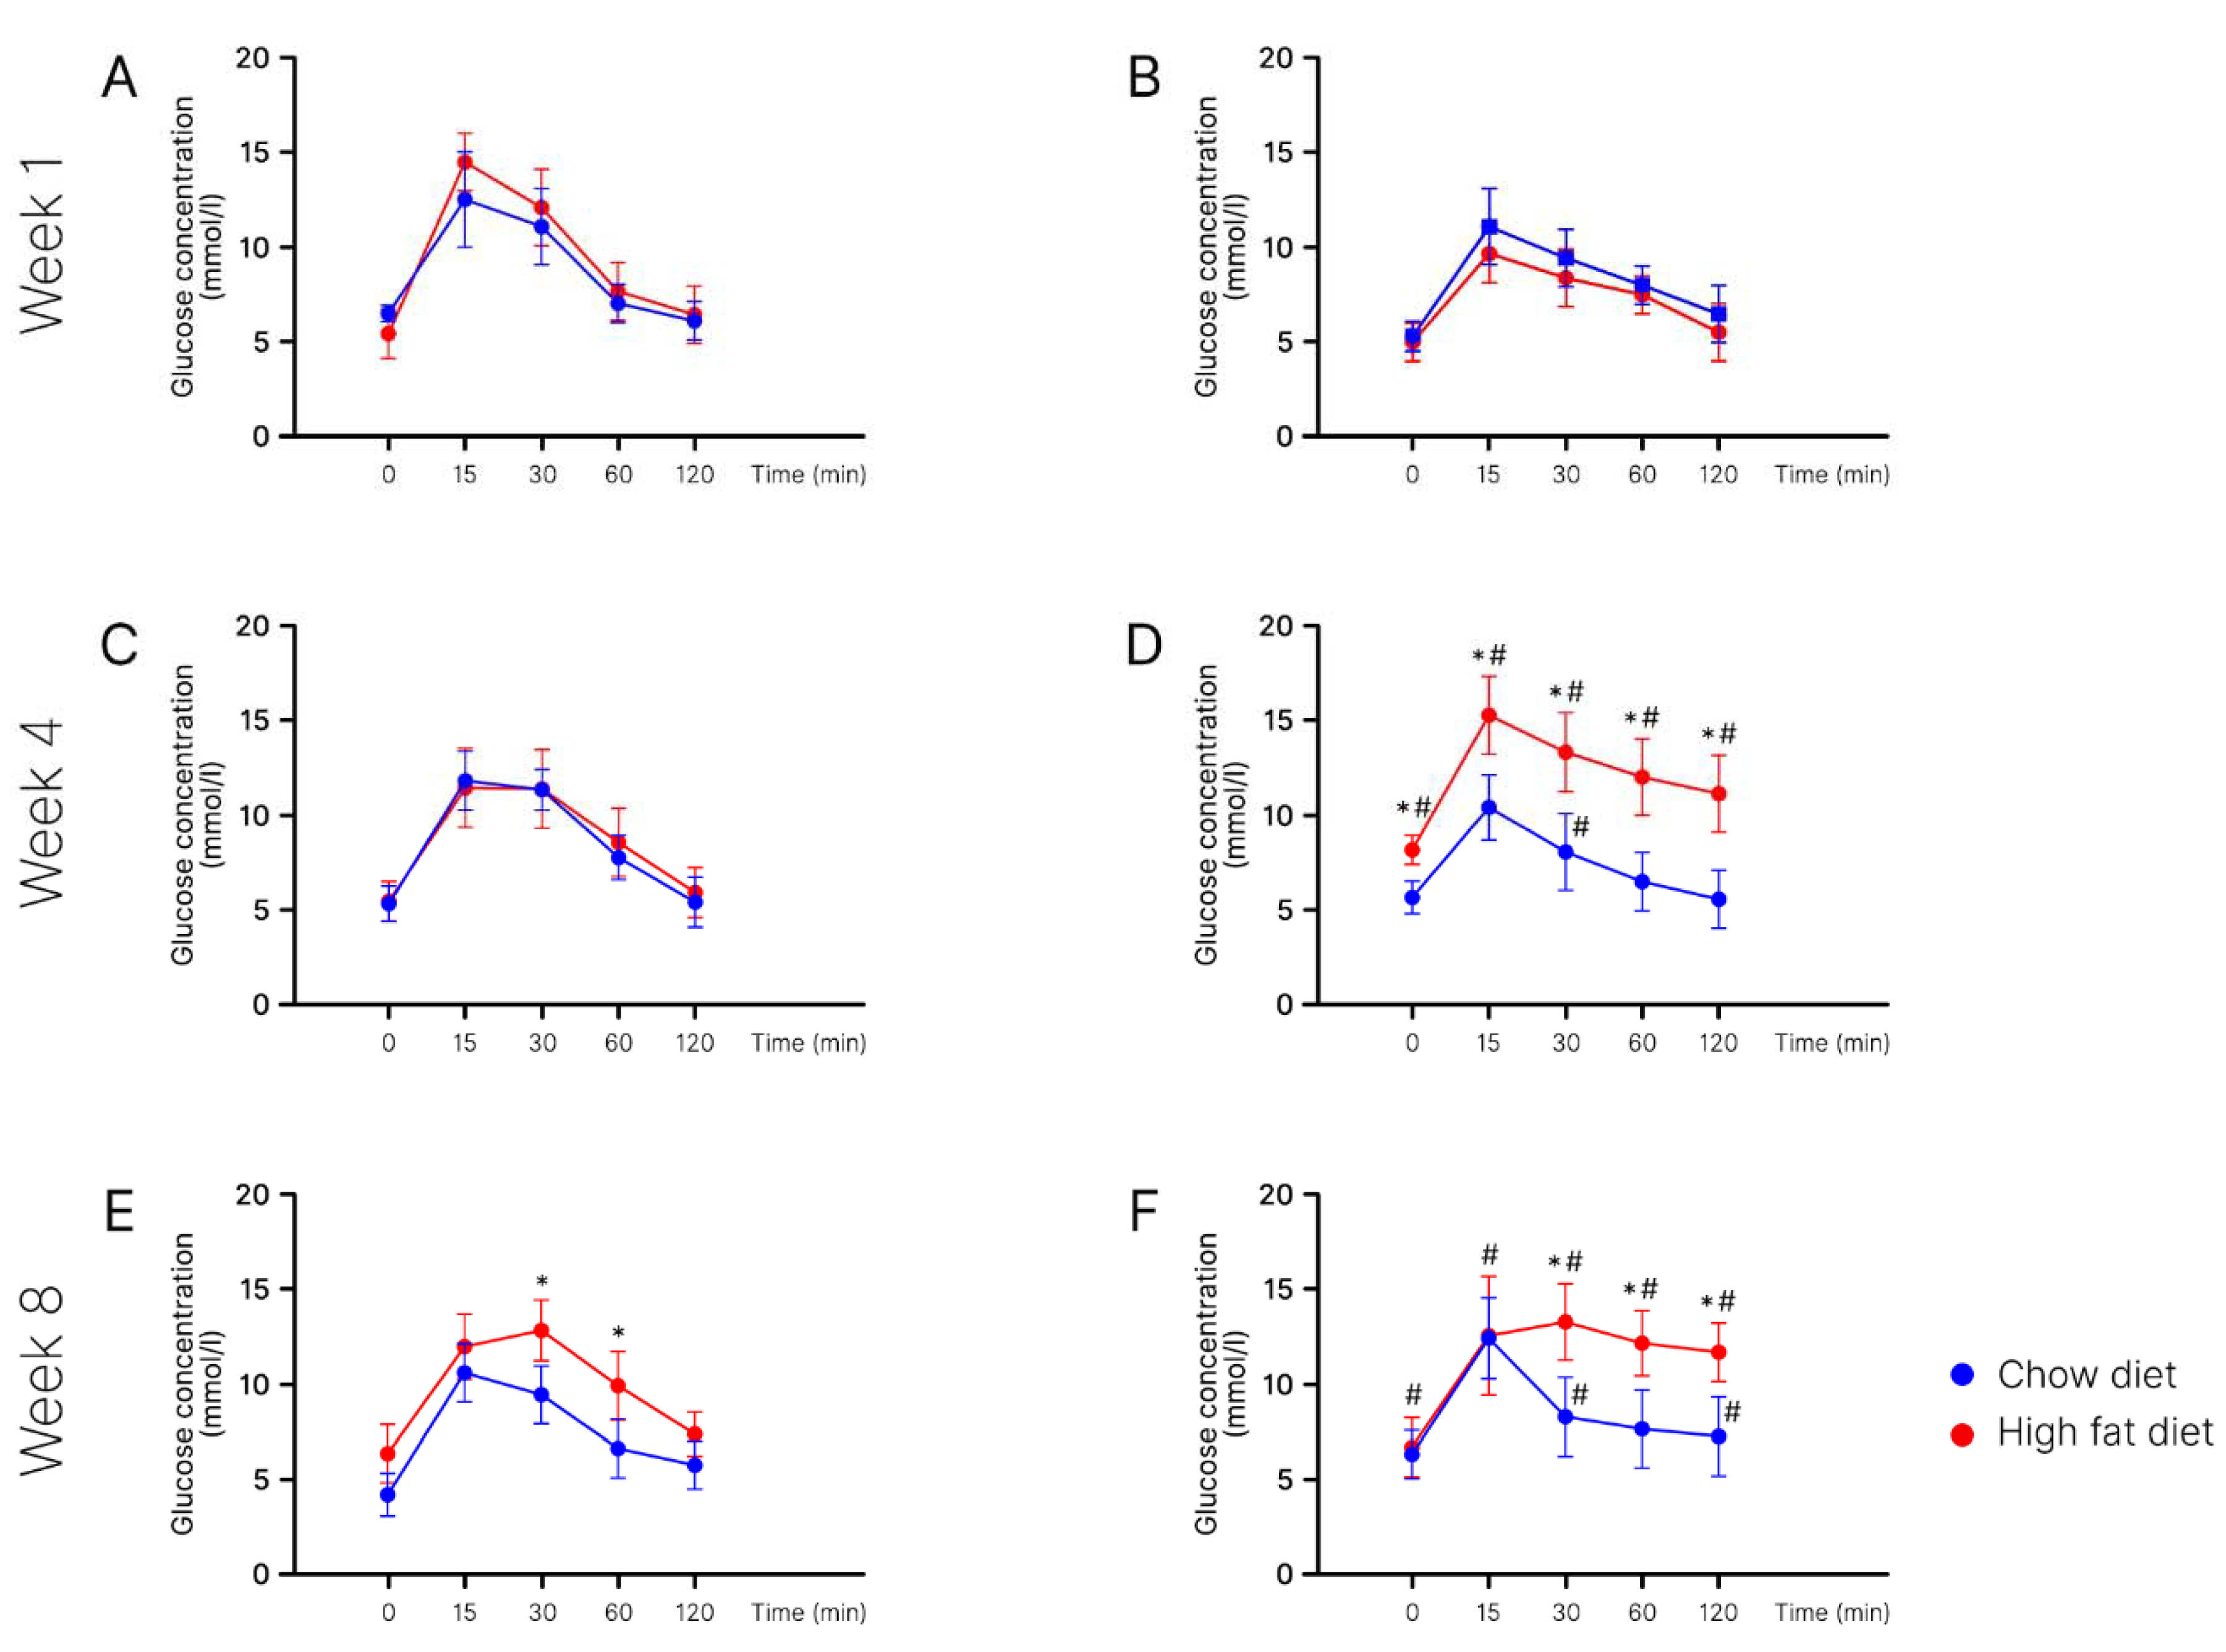
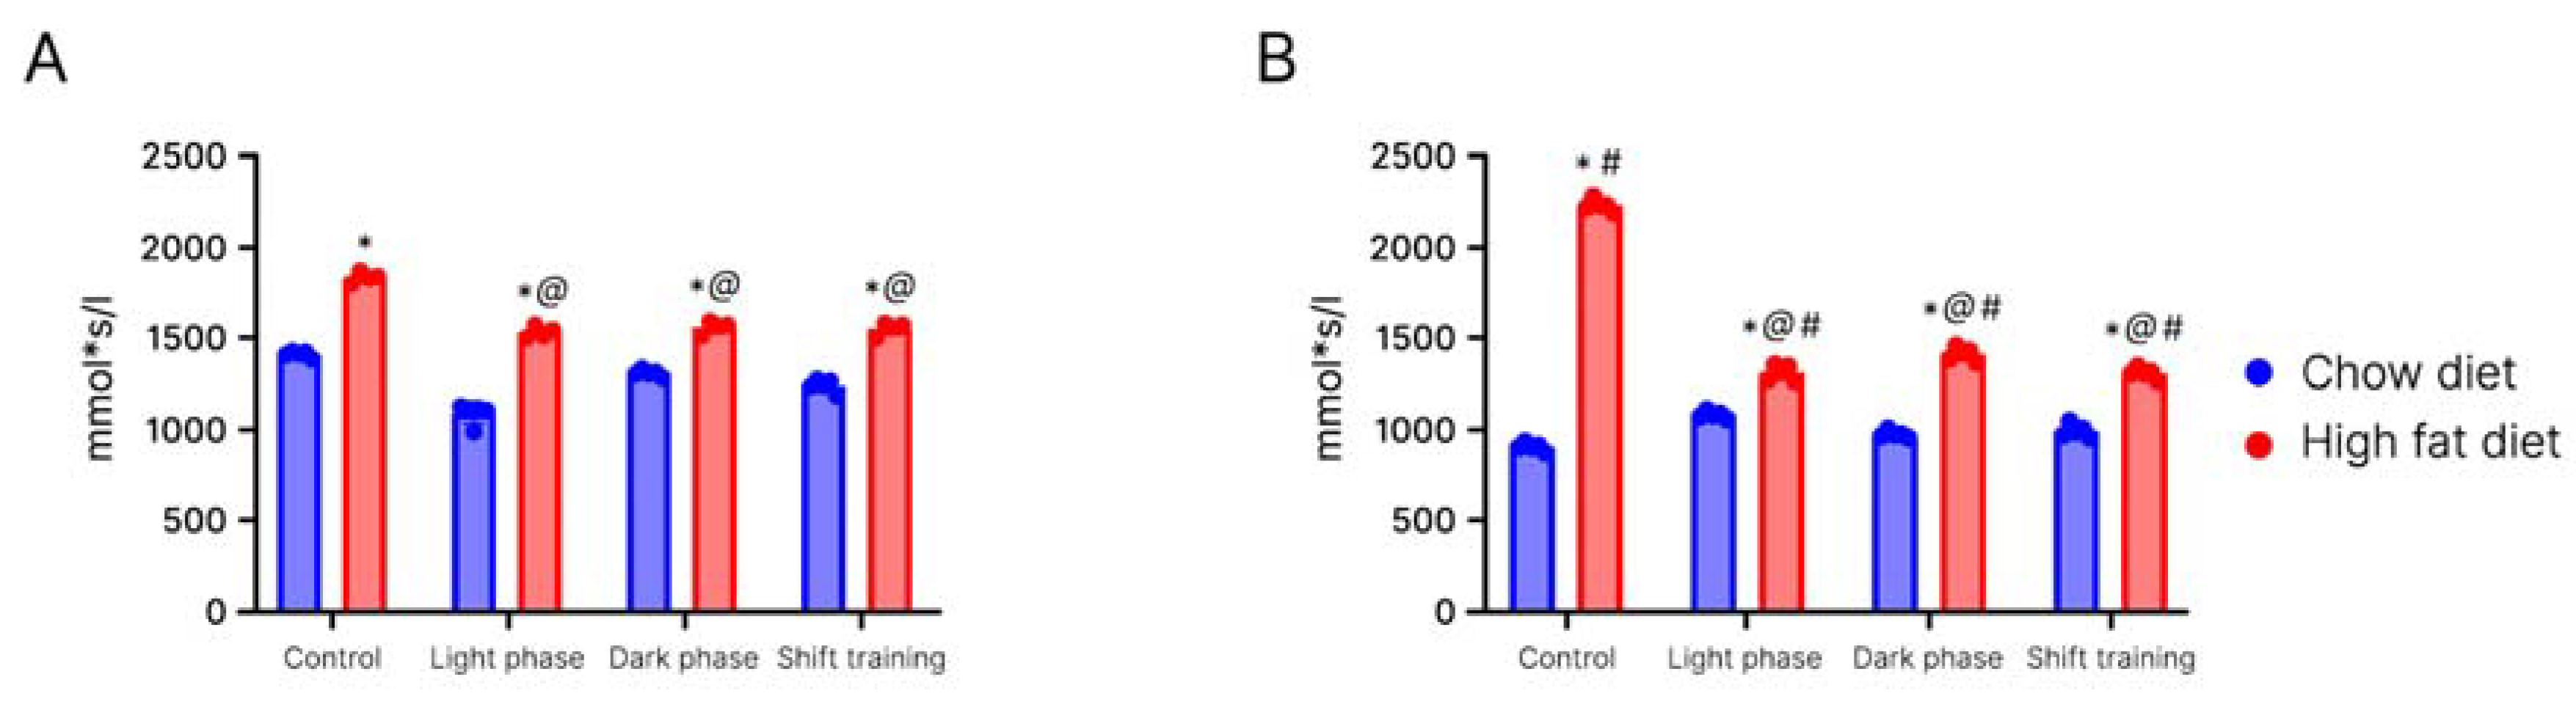
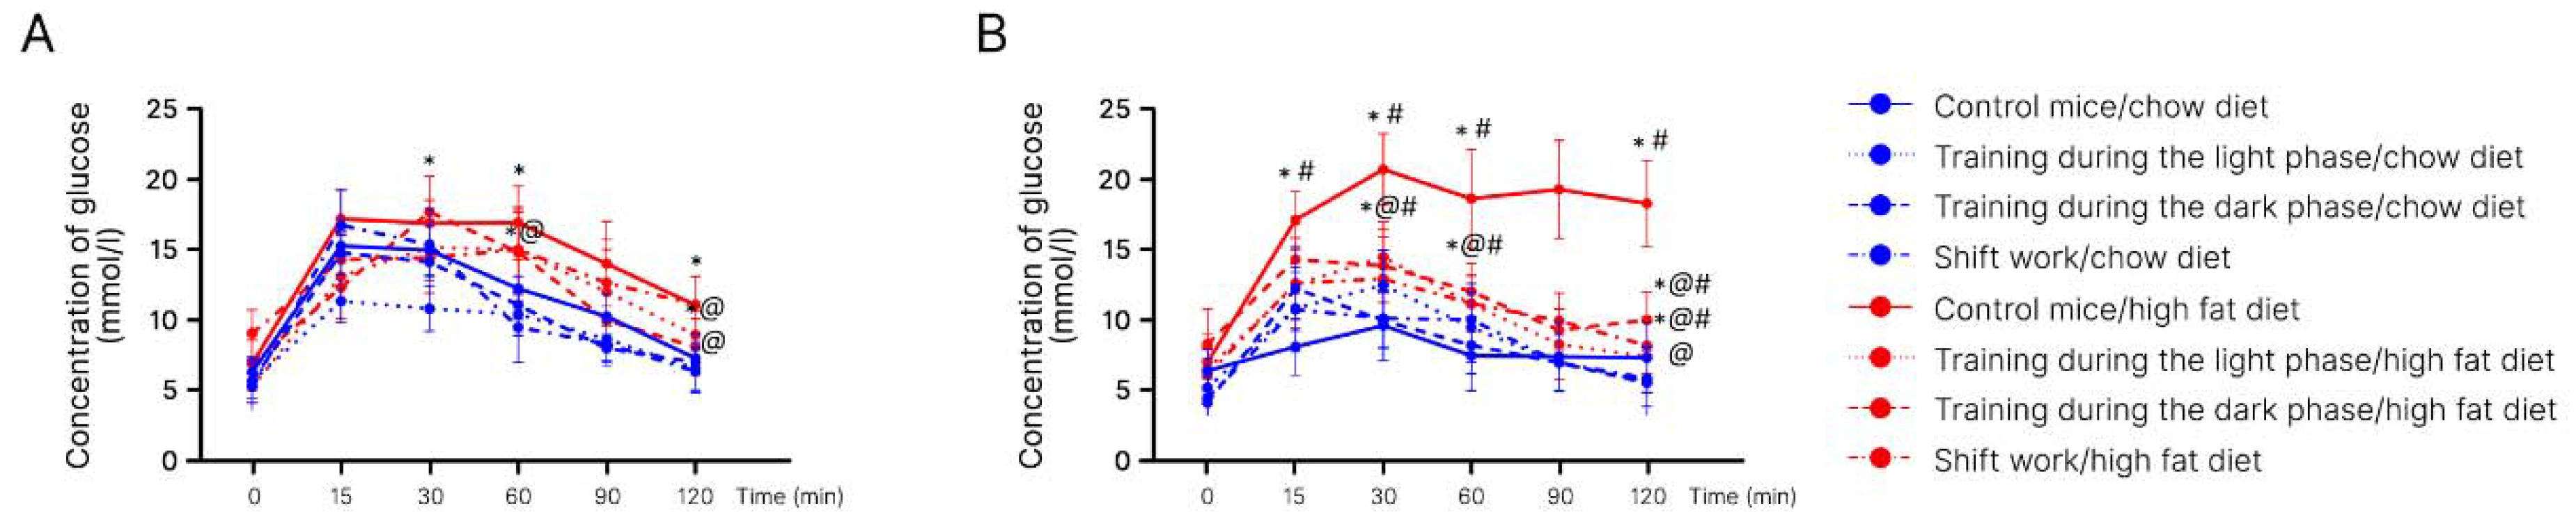
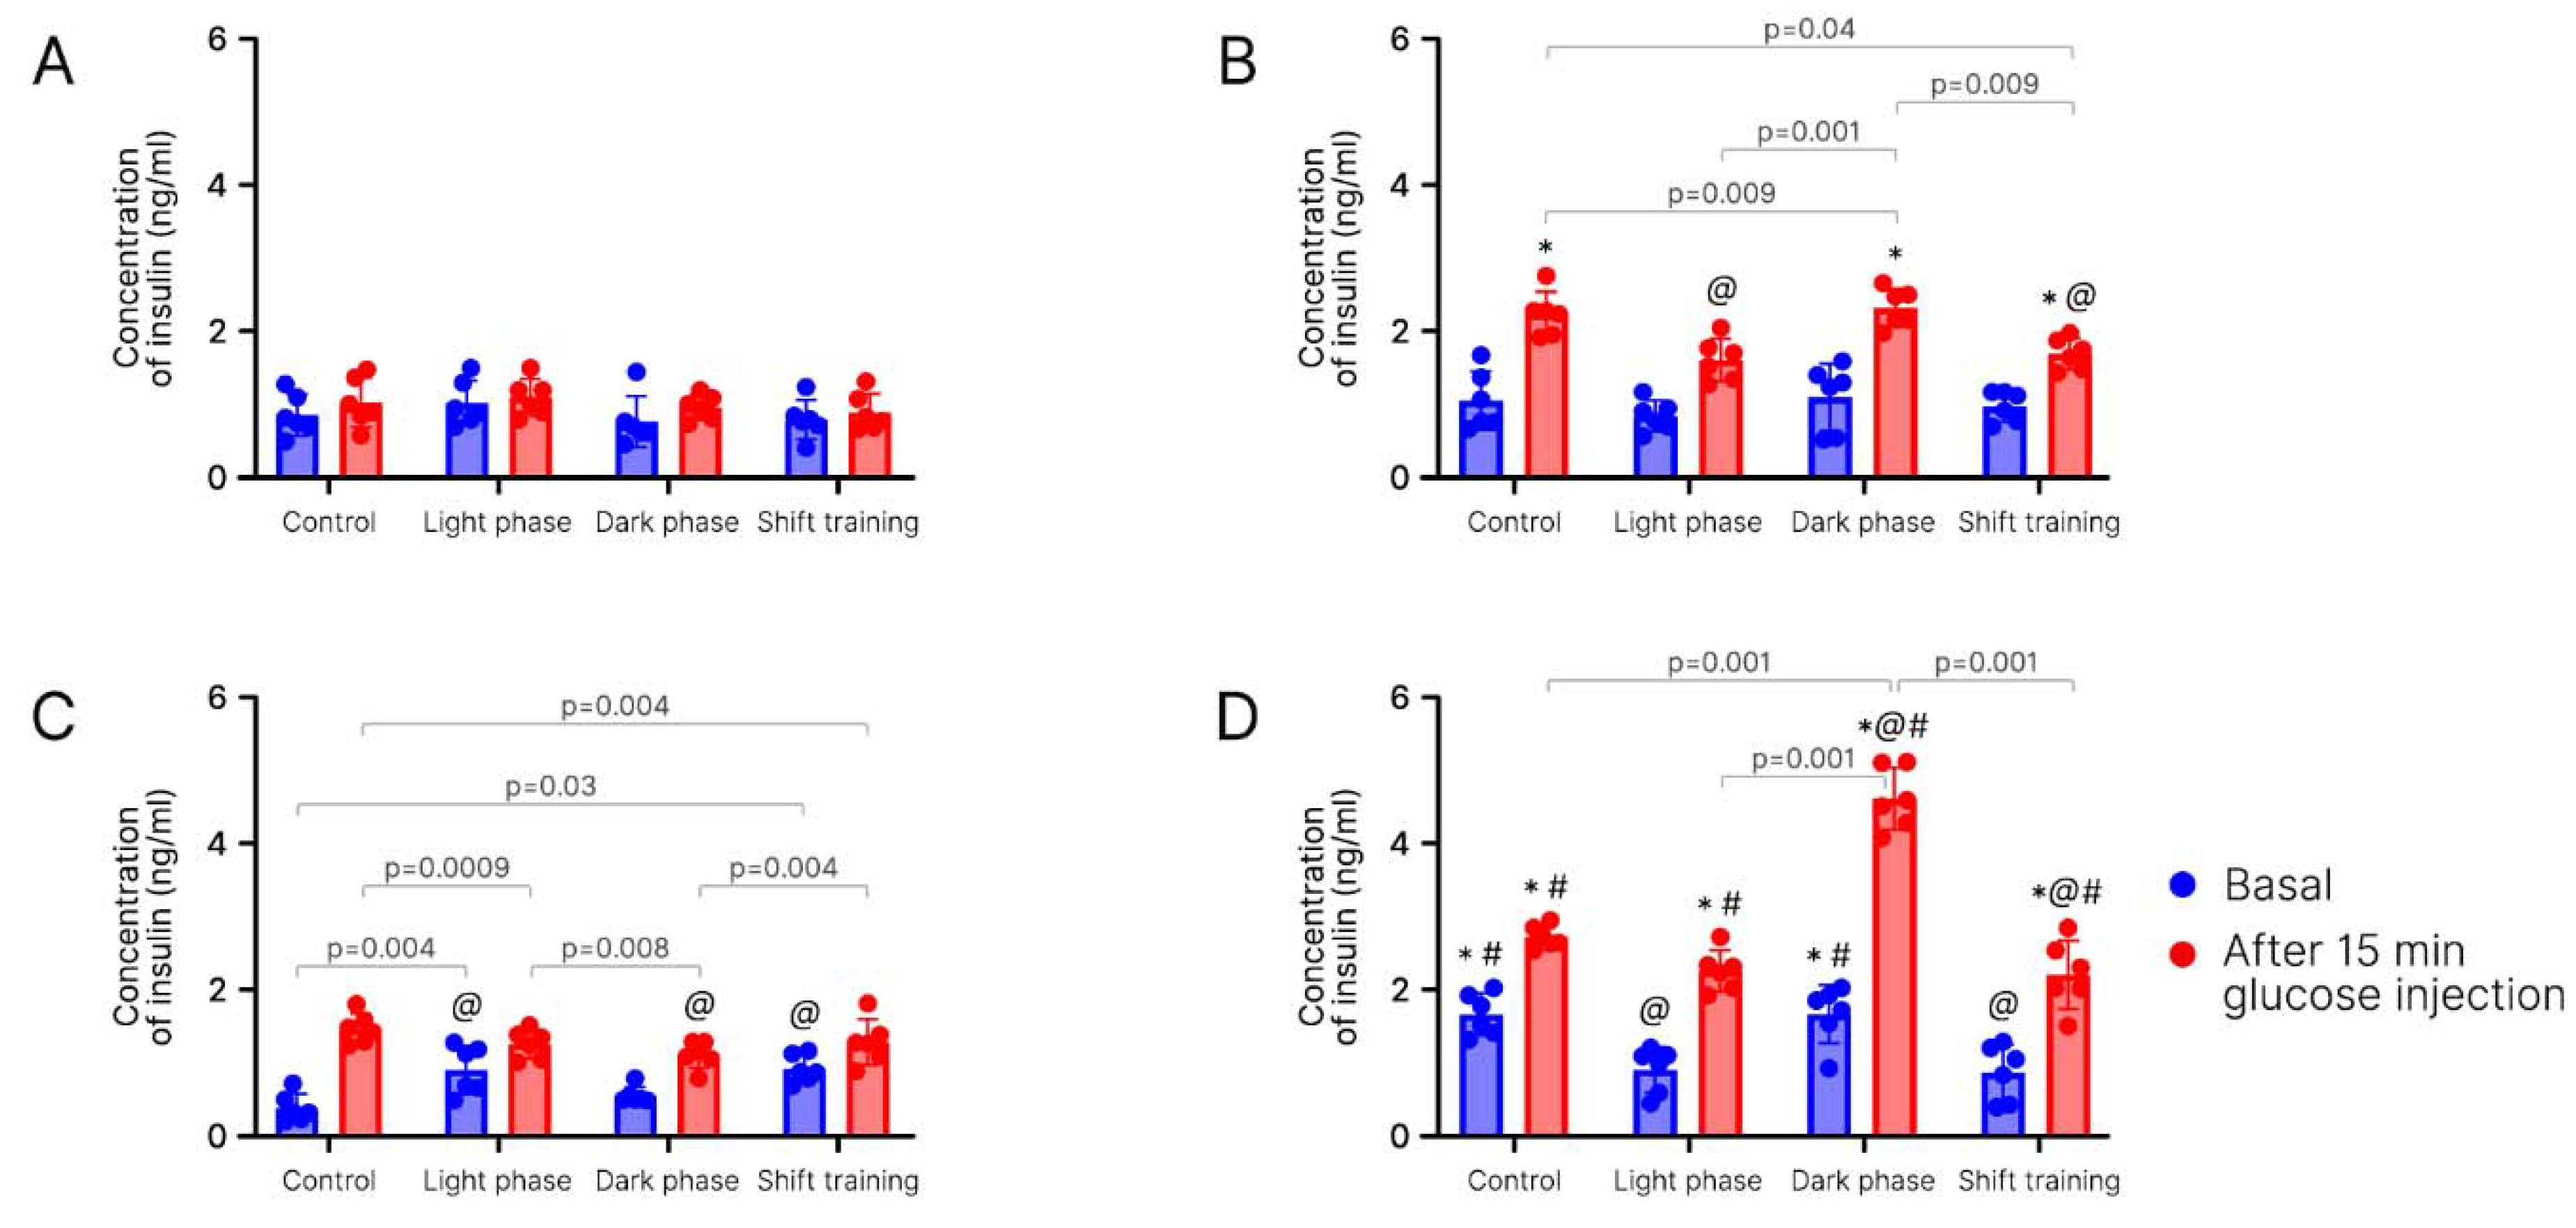
2. Results
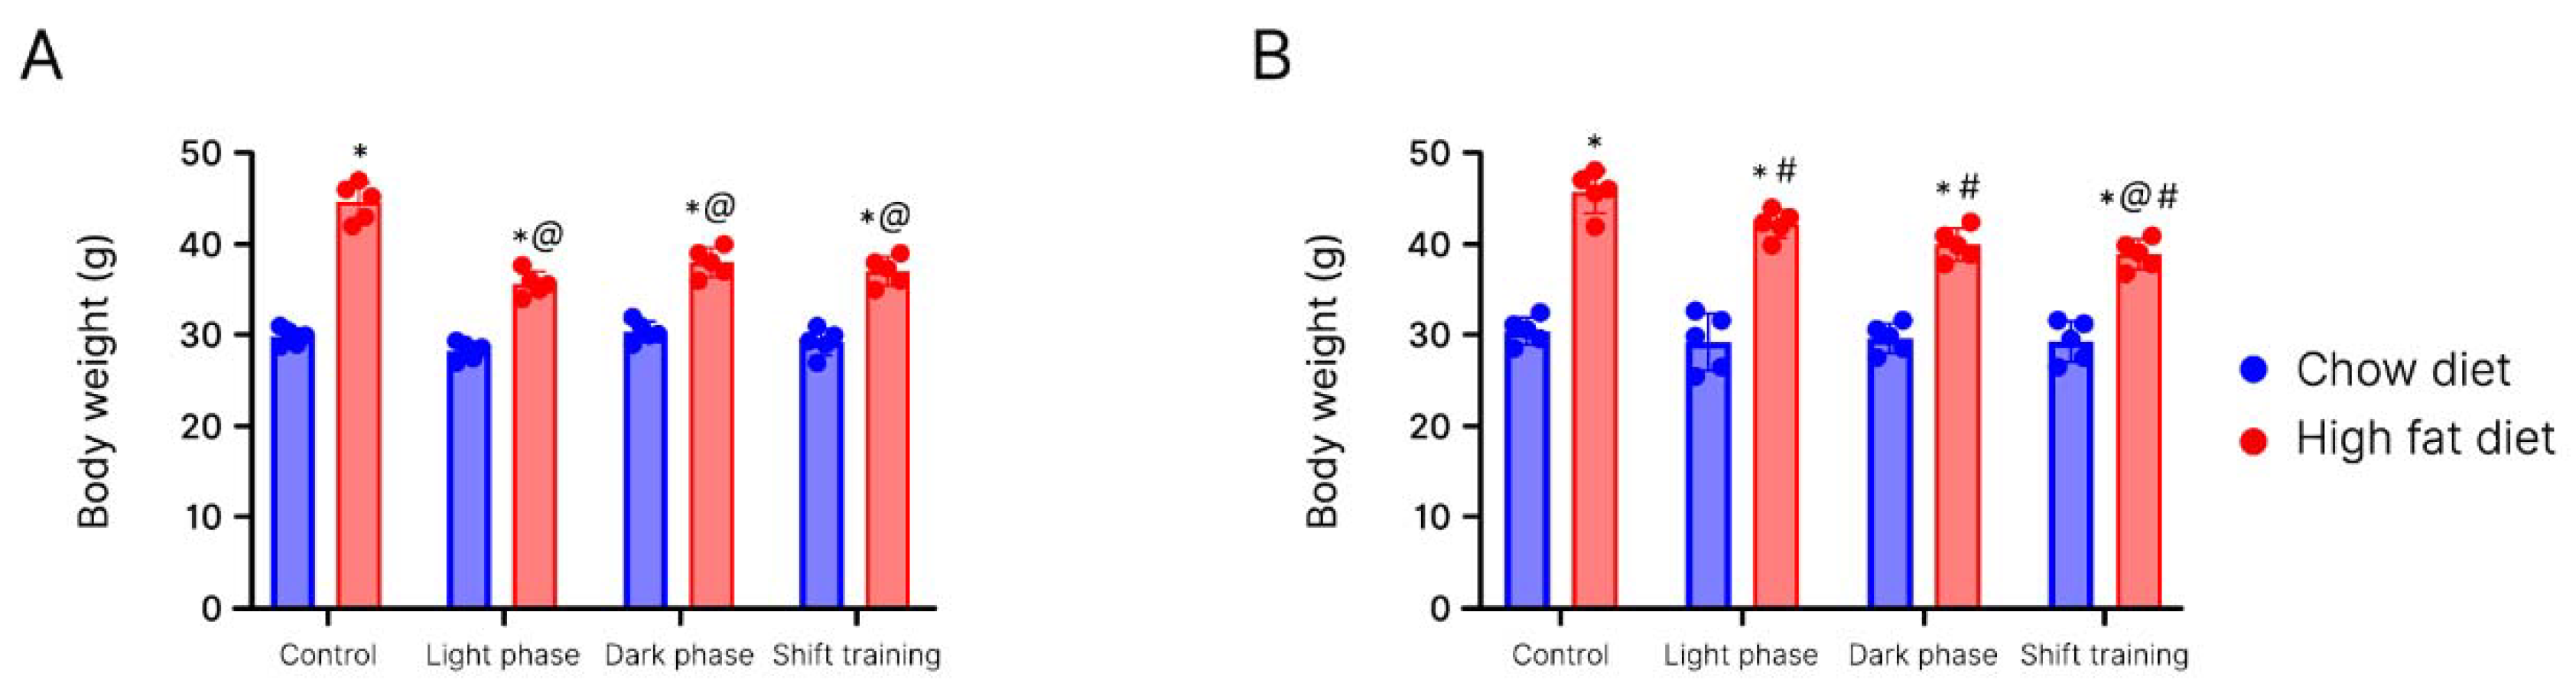
Body Weight in Young Mice
3. Discussion
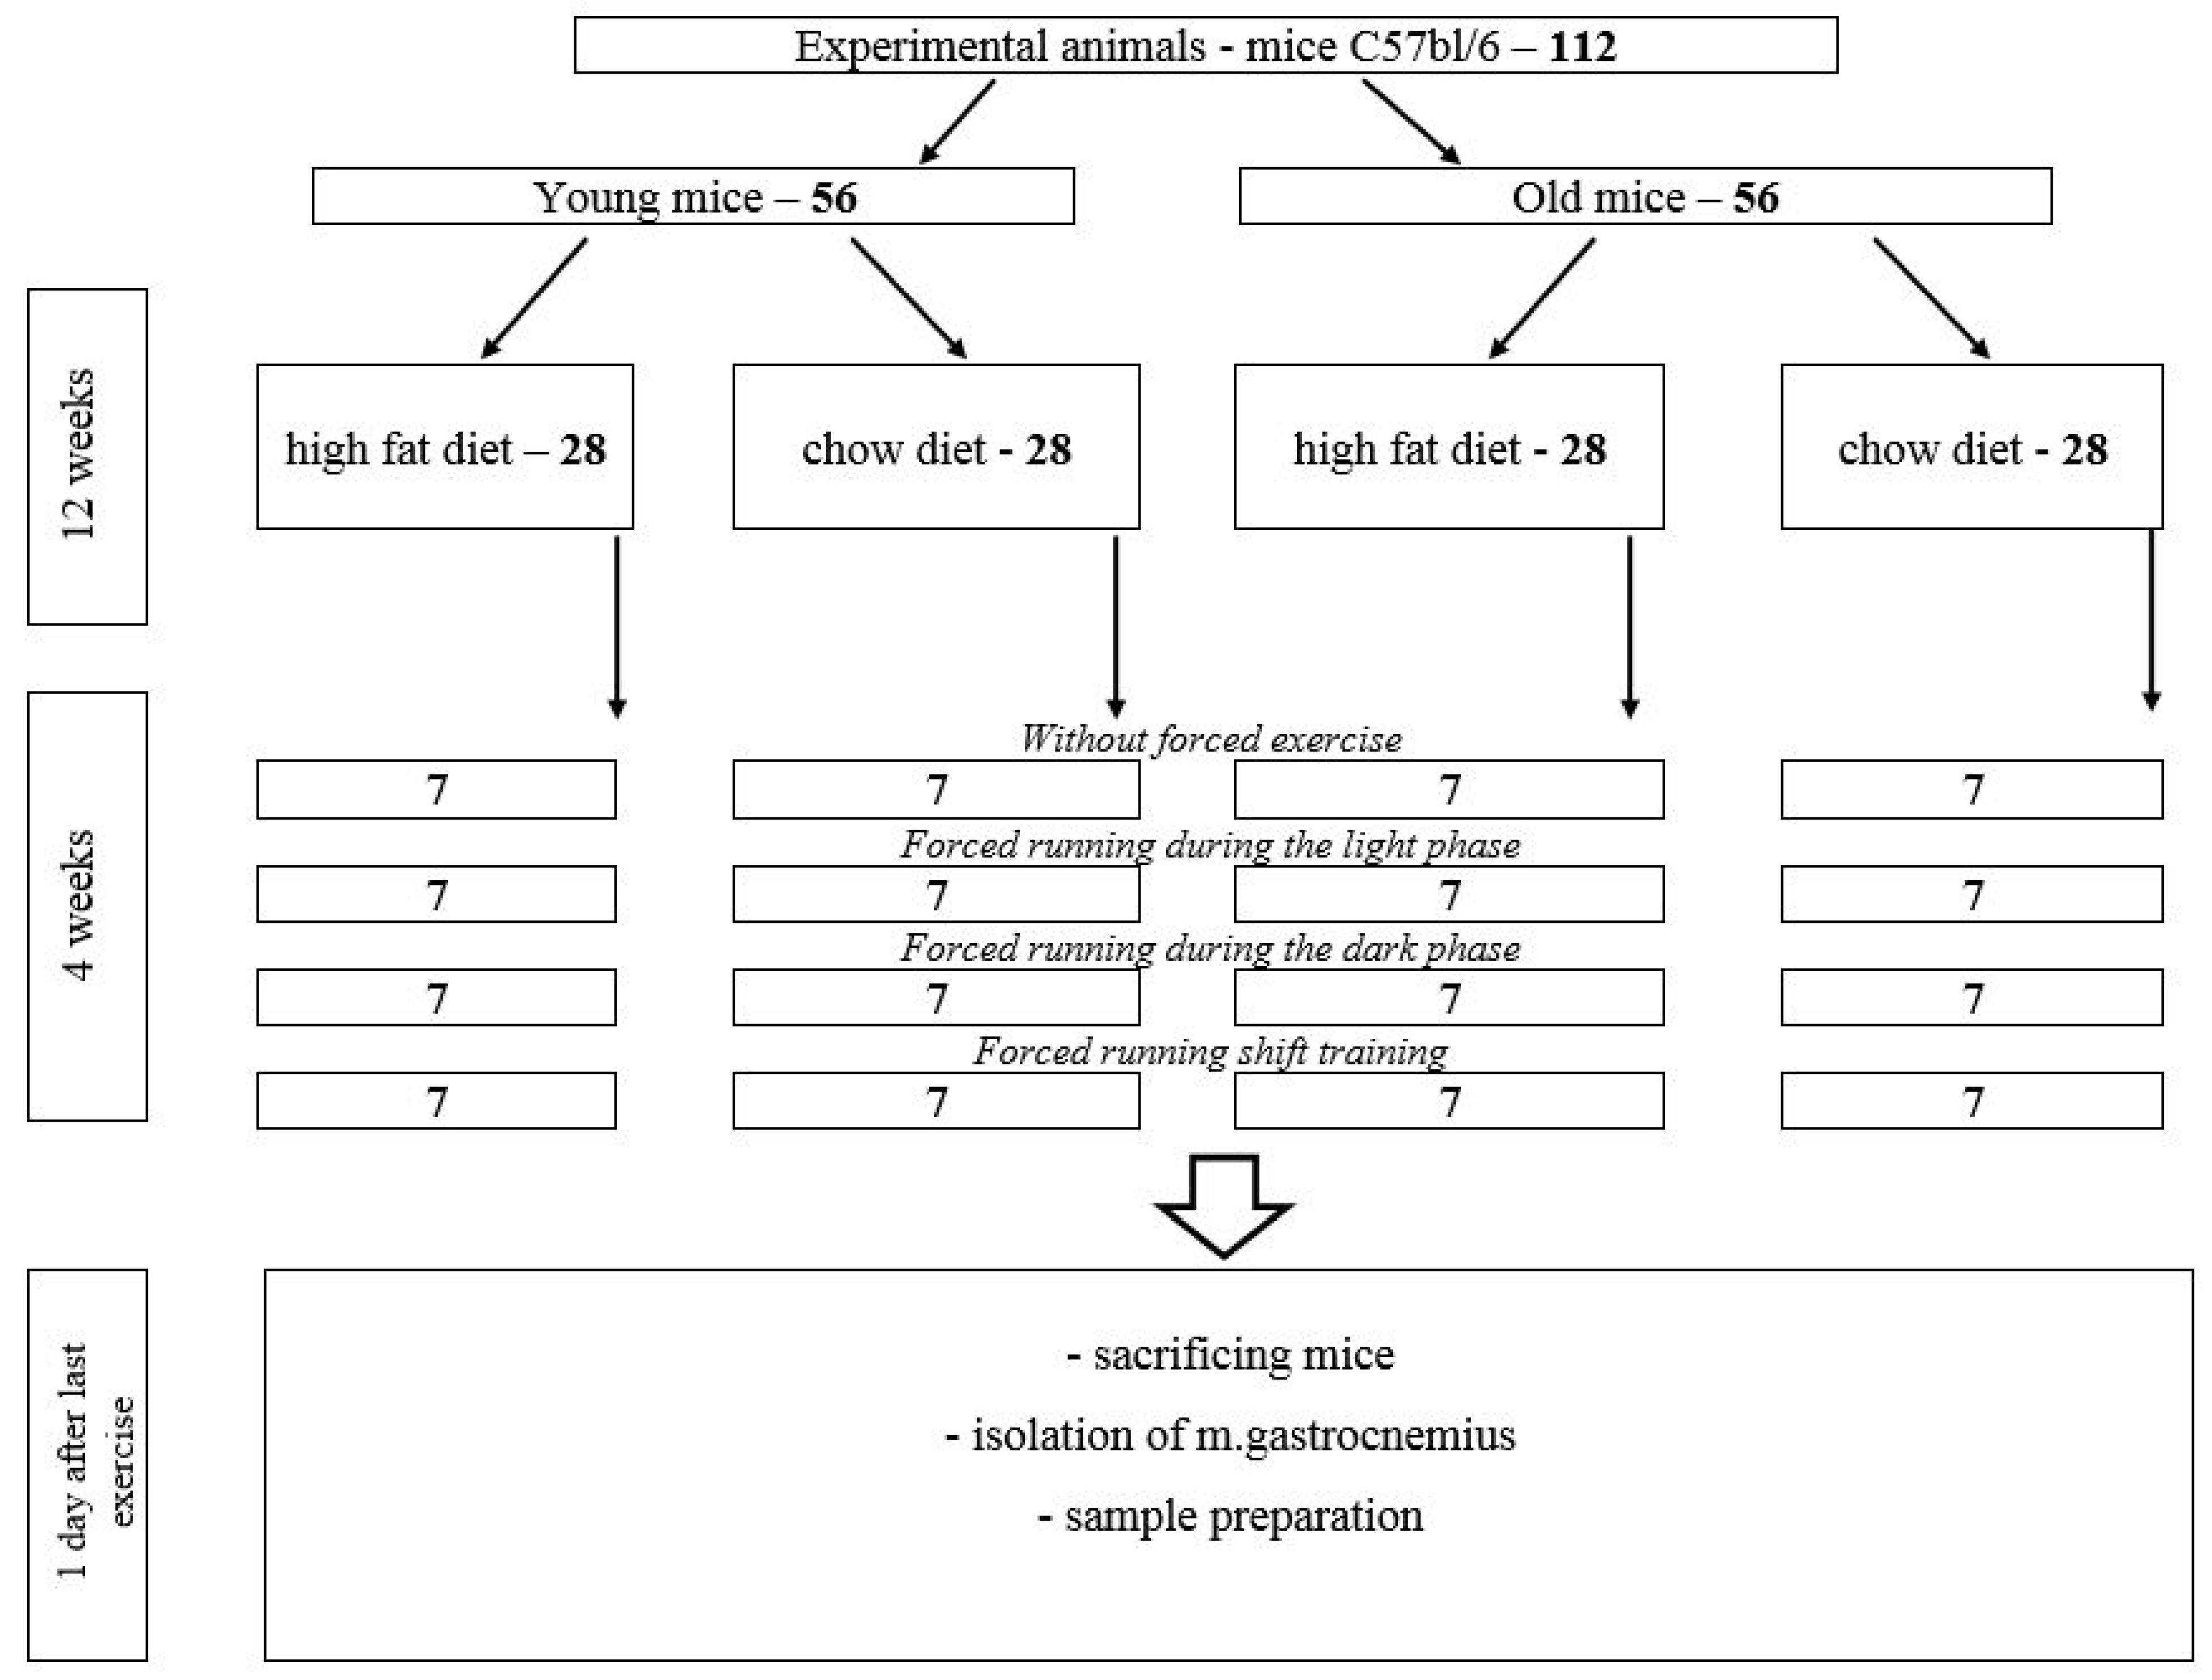
4. Materials and Methods
- -
- Animals on a high-fat diet (HFD)—28 mice (experimental group).
- -
- Animals on a chow diet—28 mice (control group).
4.1. Research Methods
4.1.1. Glucose Tolerance Test
4.1.2. Measurement of Insulin Concentration in Blood Plasma
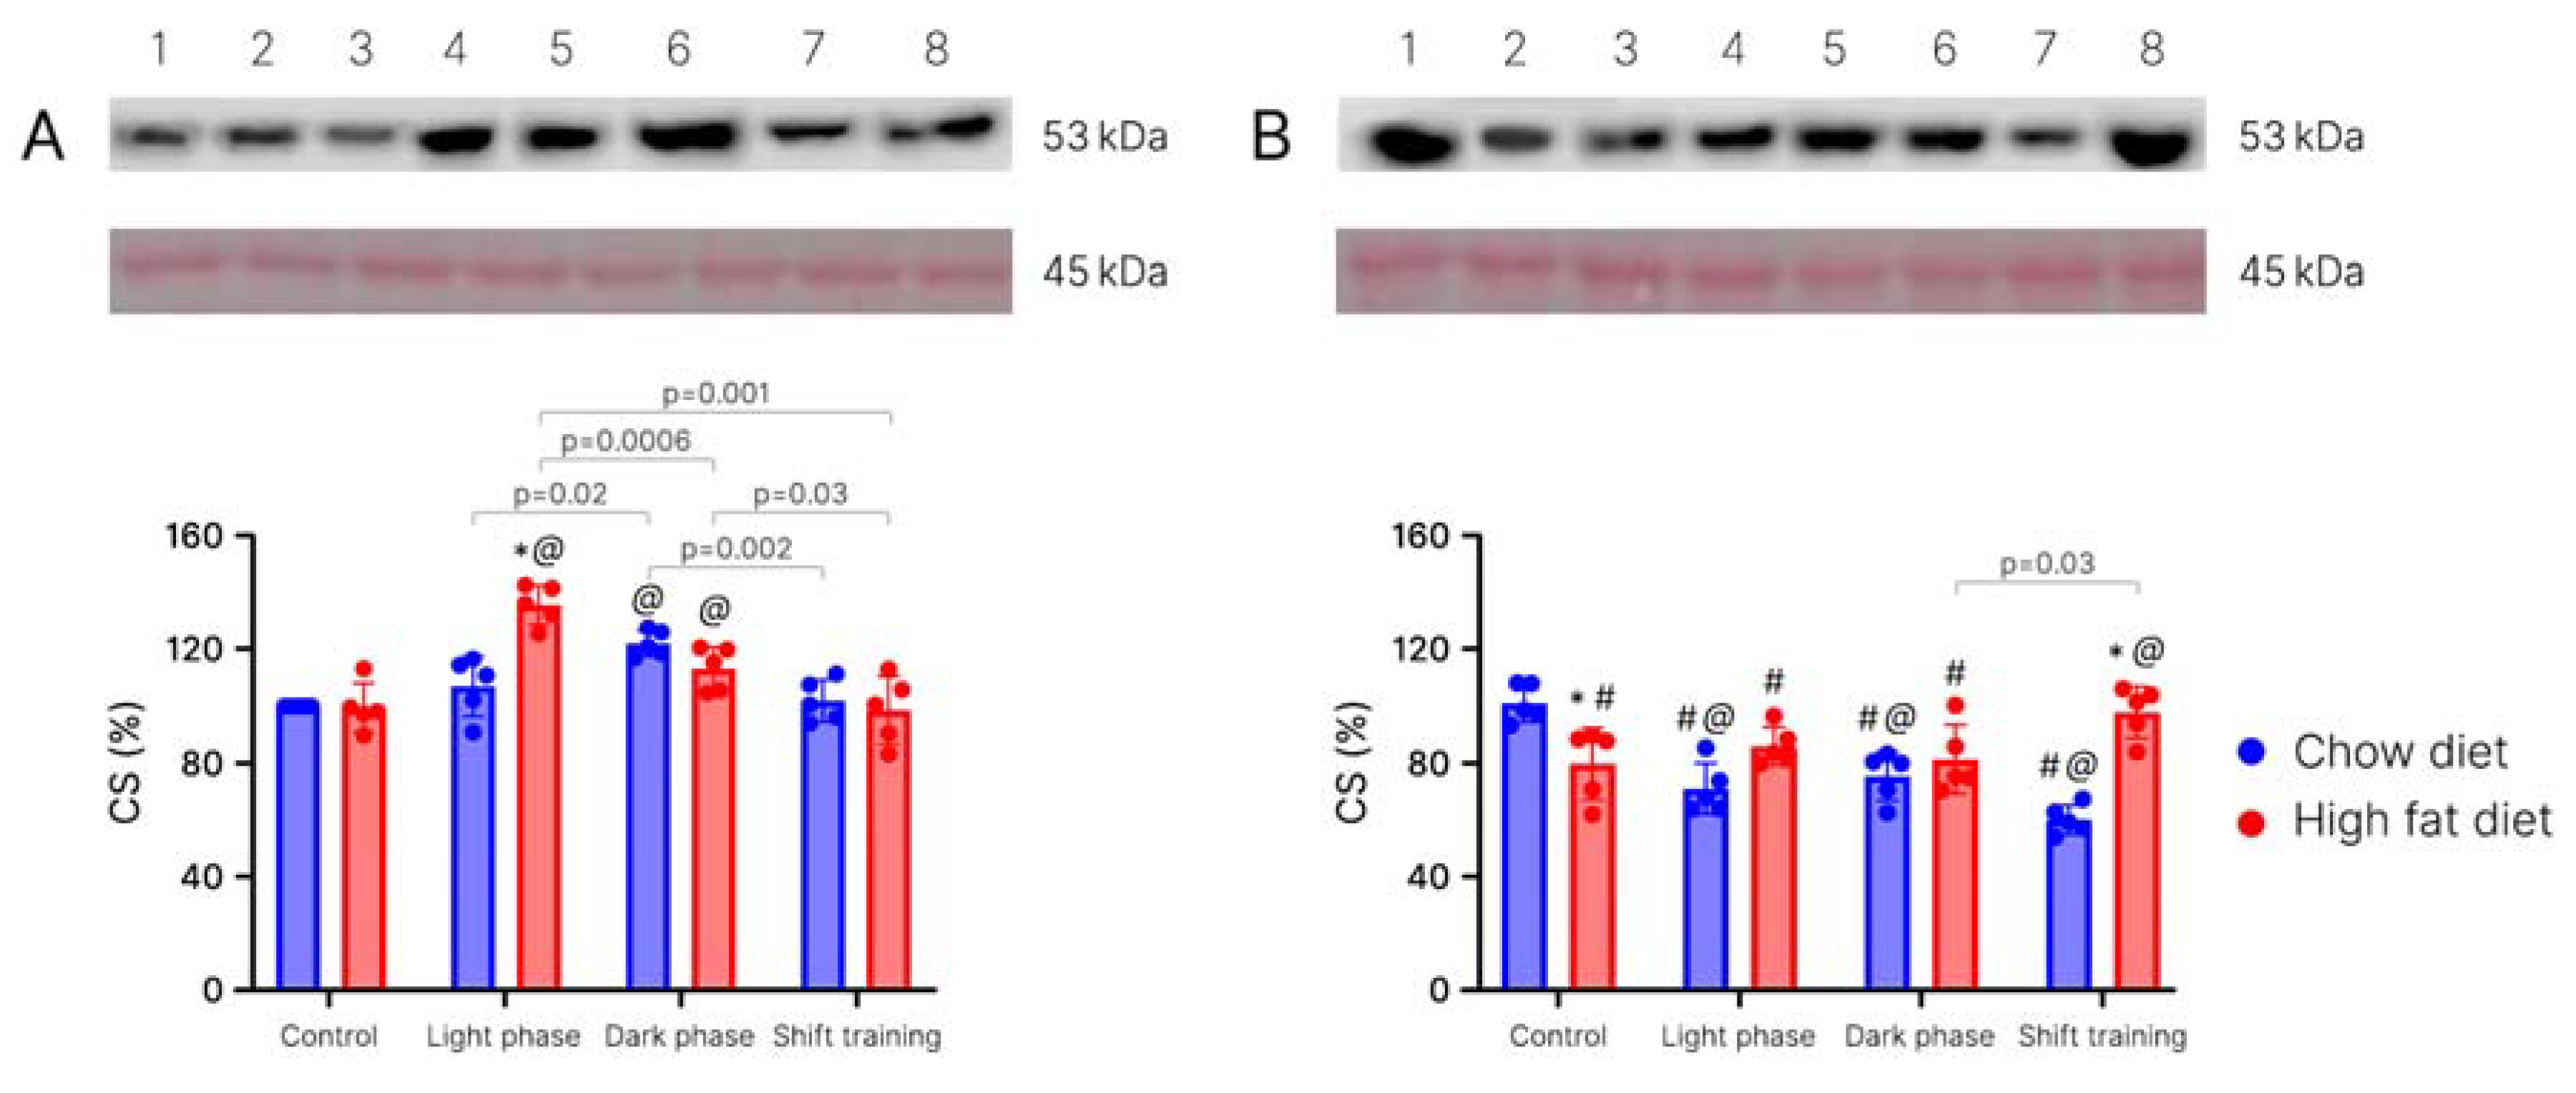
4.1.3. Determination of the Citrate Synthase in Muscle Tissue
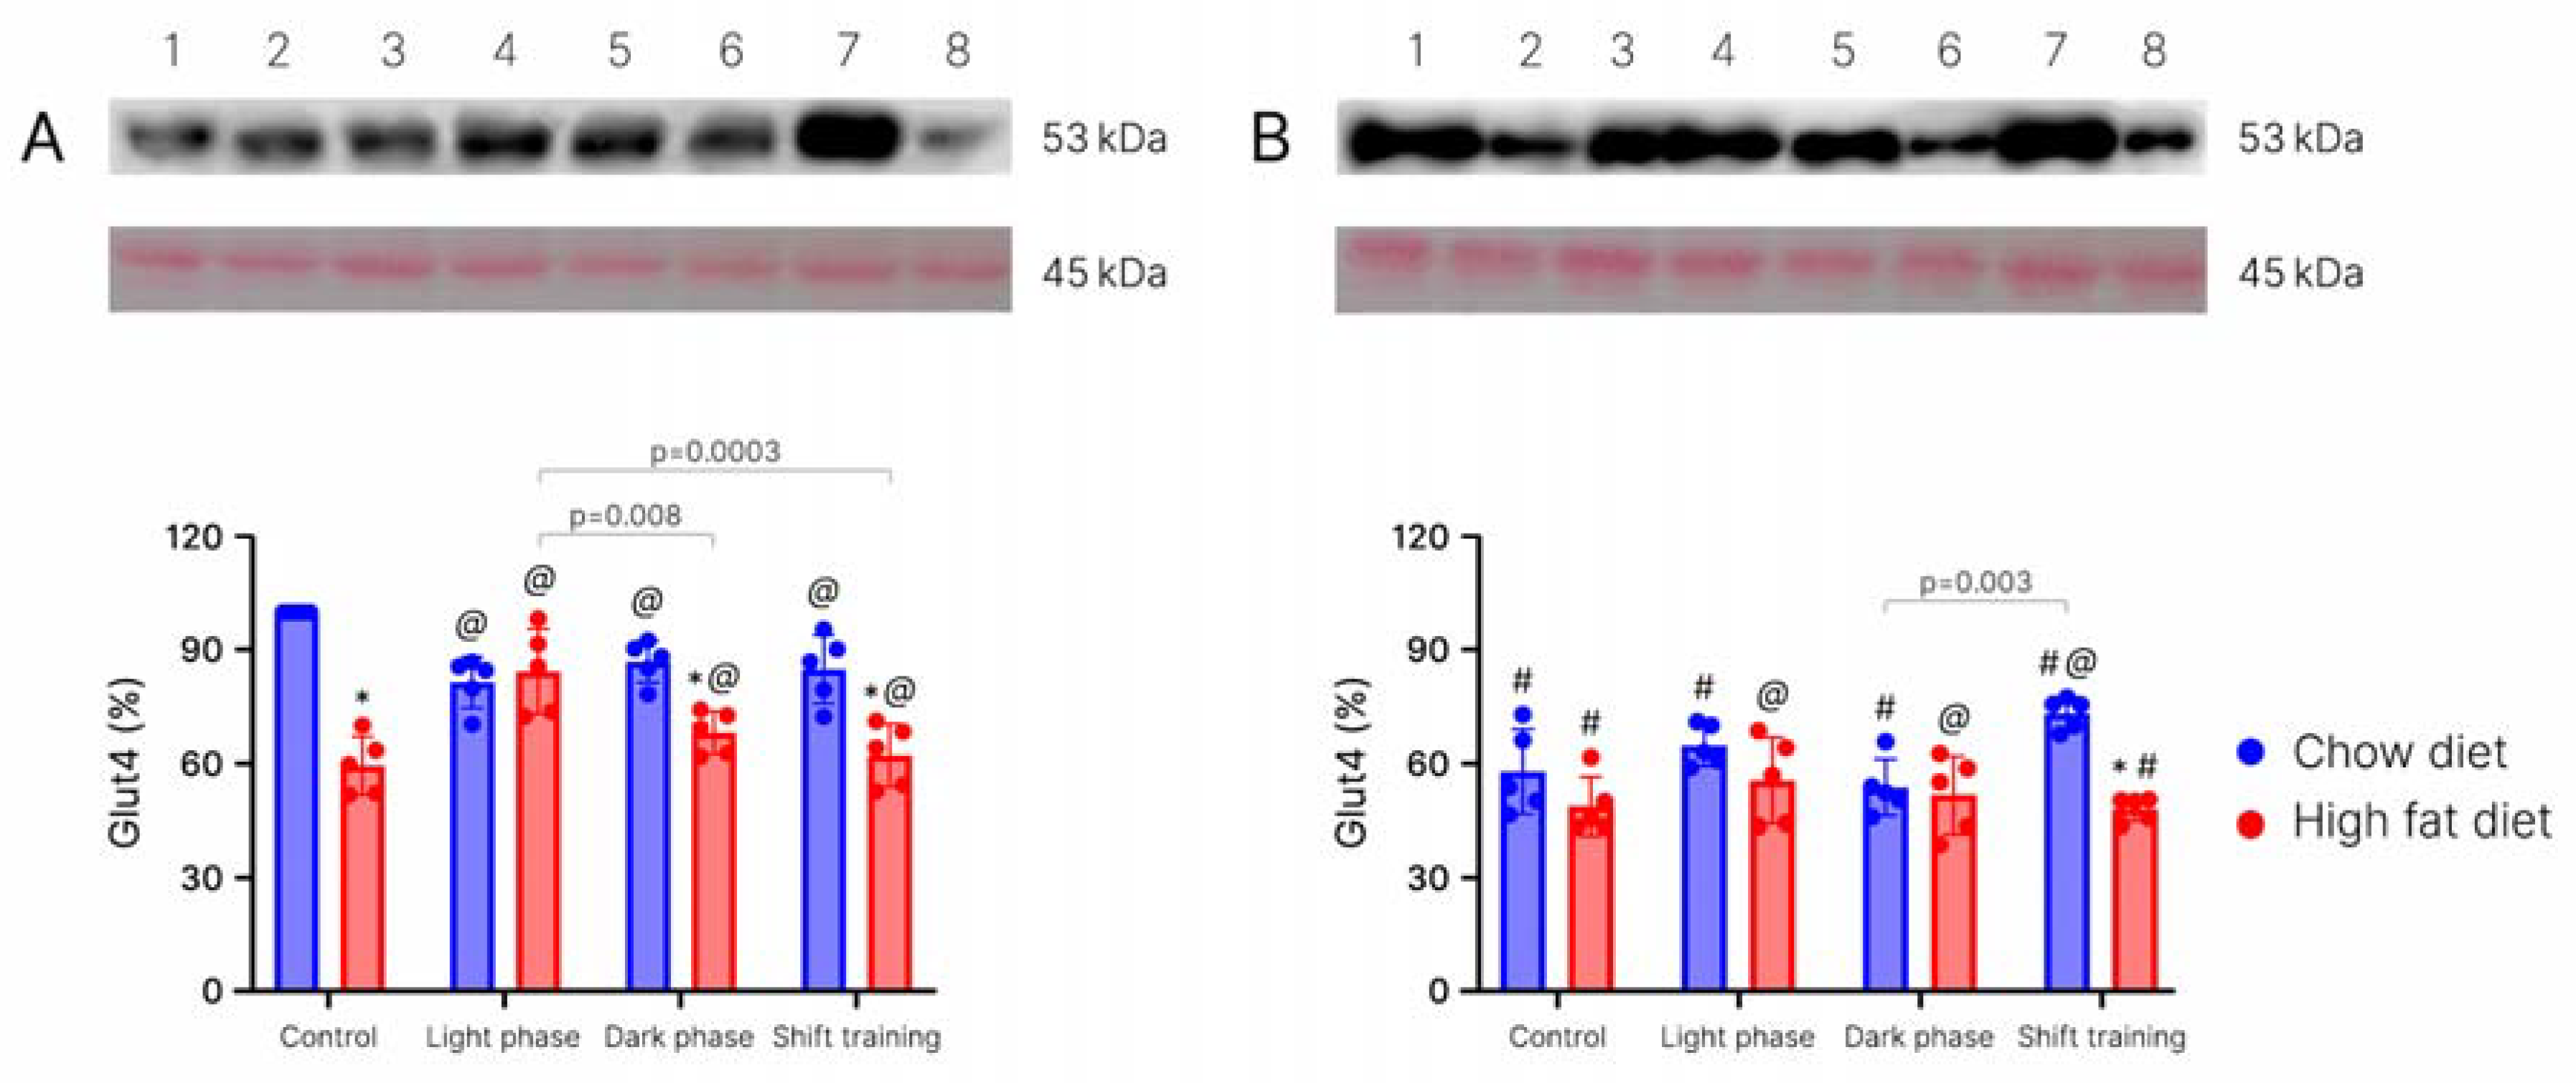
4.1.4. Determination of the Glut-4 in Muscle Tissue
4.1.5. Statistical Analysis
5. Conclusions
Limitations
Author Contributions
Funding
Institutional Review Board Statement
Data Availability Statement
Conflicts of Interest
References
- Groop, L.C.; Eriksson, J.G. The etiology and pathogenesis of non-insulin-dependent diabetes. Ann. Med. 1992, 24, 483–489. [Google Scholar] [CrossRef]
- Fujimaki, S.; Kuwabara, T. Diabetes-induced dysfunction of mitochondria and stem cells in skeletal muscle and the nervous system. Int. J. Mol. Sci. 2017, 18, 2147–2171. [Google Scholar] [CrossRef]
- Højlund, K. Metabolism and insulin signaling in common metabolic disorders and inherited insulin resistance. Dan. Med. J. 2014, 61, B4890–B4930. [Google Scholar]
- Nagy, C.; Einwallner, E. Study of In vivo glucose metabolism in high-fat diet-fed mice using oral glucose tolerance test (OGTT) and insulin tolerance test (ITT). J. Vis. Exp. 2018, 7, e56672. [Google Scholar]
- Huh, J.Y. The role of exercise-induced myokines in regulating metabolism. Arch. Pharm. Res. 2018, 41, 14–29. [Google Scholar] [CrossRef] [PubMed]
- Winzell, M.S.; Ahren, B. The high-fat diet-fed mouse: A model for studying mechanisms and treatment of impaired glucose tolerance and type 2 diabetes. Diabetes 2004, 53, S215–S219. [Google Scholar] [CrossRef]
- Coffey, V.G.; Hawley, J.A. The molecular bases of training adaptation. Sports Med. 2007, 37, 737–763. [Google Scholar] [CrossRef] [PubMed]
- Karstoft, K.; Pedersen, B.K. Exercise and type 2 diabetes: Focus on metabolism and inflammation. Immunol. Cell Biol. 2016, 94, 146–150. [Google Scholar] [CrossRef]
- Pedersen, B.K.; Saltin, B. Exercise as medicine—Evidence for prescribing exercise as therapy in 26 different chronic diseases. Scand. J. Med. Sci. Sports 2015, 25, 1–72. [Google Scholar]
- Stanford, K.I.; Rasmussen, M.; Baer, L.A.; Lehnig, A.C.; Rowland, L.A.; White, J.D.; So, K.; De Sousa-Coehlo, A.L.; Hirshman, M.F.; Patti, M.E.; et al. Paternal Exercise Improves Glucose Metabolism in Adult Offspring. Diabetes 2018, 67, 2530–2540. [Google Scholar] [CrossRef]
- Al-awar, A.; Kupai, K.; Veszelka, M.; Szűcs, G.; Attieh, Z.; Murlasits, Z.; Varga, C. Experimental Diabetes Mellitus in Different Animal Models. J. Diabetes Res. 2016, 2016, 9051426. [Google Scholar] [CrossRef]
- Heydemann, A. An Overview of Murine High Fat Diet as a Model for Type 2 Diabetes Mellitus. J. Diabetes Res. 2016, 2016, 2902351. [Google Scholar] [CrossRef]
- Brito-Casillas, Y.; Melián, C.; Wägner, A.M. Study of the pathogenesis and treatment of diabetes mellitus through animal models. Endocrinol. Nutr. 2016, 63, 345–353. [Google Scholar] [CrossRef]
- Furman, B.L. Streptozotocin-Induced Diabetic Models in Mice and Rats. Curr. Protoc. Pharmacol. 2015, 70, 5.47.1–5.47.20. [Google Scholar] [CrossRef]
- Gusdon, A.M.; Callio, J.; Distefano, G.; O’Doherty, R.M.; Goodpaster, B.H.; Coen, P.M.; Chu, C.T. Exercise increases mitochondrial complex I activity and DRP1 expression in the brains of aged mice. Exp. Gerontol. 2017, 90, 1–13. [Google Scholar] [CrossRef]
- Muñoz, V.R.; Gaspar, R.C.; Mancini, M.C.S.; de Lima, R.D.; Vieira, R.F.L.; Crisol, B.M.; Antunes, G.C.; Trombeta, J.C.S.; P Bonfante, I.L.; Simabuco, F.M.; et al. Short-term physical exercise controls age-related hyperinsulinemia and improves hepatic metabolism in aged rodents. J. Endocrinol. Invest. 2022, 46, 815–827. [Google Scholar] [CrossRef]
- Sircar, M.; Bhatia, A.; Munshi, M. Review of Hypoglycemia in the Older Adult: Clinical Implications and Management. Can. J. Diabetes 2017, 40, 66–72. [Google Scholar] [CrossRef]
- Tanamas, S.K.; Wong, E.; Backholer, K.; Abdullah, A.; Wolfe, R.; Barendregt, J.; Peeters, A. Age of onset of obesity and risk of type 2 diabetes. Aust. N. Z. J. Public. Health 2016, 40, 579–581. [Google Scholar] [CrossRef] [PubMed]
- Huang, L.; Wu, P.; Zhang, Y.; Lin, Y.; Shen, X.; Zhao, F.; Yan, S. Relationship between onset age of type 2 diabetes mellitus and vascular complications based on propensity score matching analysis. J. Diabetes Investig. 2022, 13, 1062–1072. [Google Scholar] [CrossRef]
- Zadow, E.K.; Kitic, C.M.; Wu, S.S.X.; Fell, J.W.; Adams, M.J. Time of day and short-duration high-intensity exercise influences on coagulation and fibrinolysis. Eur. J. Sport. Sci. 2016, 18, 367–375. [Google Scholar] [CrossRef]
- Boukelia, B.; Gomes, E.C.; Florida-James, G.D. Diurnal Variation in Physiological and Immune Responses to Endurance Sport in Highly Trained Runners in a Hot and Humid Environment. Oxid. Med. Cell Longev. 2018, 9, 3402143. [Google Scholar] [CrossRef] [PubMed]
- Brito, L.C.; Rezende, R.A.; Mendes, C.; Silva-Junior, N.D.; Tinucci, T.; Cipolla-Neto, J.; de Moraes Forjaz, C.L. Separate after effects of morning and evening exercise on ambulatory blood pressure in prehypertensive men. J. Sports Med. Phys. Fit. 2018, 58, 157–163. [Google Scholar]
- Hutchison, A.T.; Wittert, G.A.; Heilbronn, L.K. Matching Meals to Body Clocks-Impact on Weight and Glucose Metabolism. Nutrients 2017, 9, 222. [Google Scholar] [CrossRef] [PubMed]
- Basse, A.L.; Dalbram, E.; Larsson, L.; Gerhart-Hines, Z.; Zierath, J.R.; Treebak, J.T. Skeletal Muscle Insulin Sensitivity Show Circadian Rhythmicity Which Is Independent of Exercise Training Status. Front. Physiol. 2018, 9, 1198. [Google Scholar] [CrossRef] [PubMed]
- Sato, S.; Basse, A.L.; Schönke, M.; Chen, S.; Samad, M.; Altıntaş, A.; Laker, R.C.; Dalbram, E.; Barrès, R.; Baldi, P. Time of exercise specifies the impact on muscle metabolic pathways and systemic energy homeostasis. Cell Metab. 2019, 30, 92–110.e4. [Google Scholar] [CrossRef]
- Smith, J.A.B.; Murach, K.A.; Dyar, K.A.; Zierath, J.R. Exercise metabolism and adaptation in skeletal muscle. Nat. Rev. Mol. Cell Biol. 2023, 24, 607–632. [Google Scholar]
- Lundell, L.S.; Parr, E.B.; Devlin, B.L.; Ingerslev, L.R.; Altıntaş, A.; Sato, S.; Sassone-Corsi, P.; Barrès, R.; Zierath, J.R.; Hawley, J.A. Time-restricted feeding alters lipid and amino acid metabolite rhythmicity without perturbing clock gene expression. Nat. Commun. 2020, 11, 4643. [Google Scholar] [CrossRef]
- Guan, D.; Lazar, M.A. Interconnections between circadian clocks and metabolism. J. Clin. Investig. 2021, 131, e148278. [Google Scholar] [CrossRef]
- Dohm, G.L. Exercise Effects on Muscle Insulin Signaling and Action Invited Review: Regulation of skeletal muscle GLUT-4 expression by exercise. J. Appl. Physiol. 2002, 93, 782–787. [Google Scholar] [CrossRef]
- Lee, J.S.; Bruce, C.R.; Tunstall, R.J.; Cameron-Smith, D.; Hügel, H.; Hawley, J.A. Interaction of exercise and diet on Glut-4 protein and gene expression in Type I and Type II rat skeletal muscle. Acta Physiol. Scand. 2002, 175, 37–44. [Google Scholar] [CrossRef]
- Venojärvi, M.; Lindström, J.; Aunola, S.; Nuutila, P.; Atalay, M. Improved Aerobic Capacity and Adipokine Profile Together with Weight Loss Improve Glycemic Control without Changes in Skeletal Muscle Glut-4 Gene Expression in Middle-Aged Subjects with Impaired Glucose Tolerance. Int. J. Environ. Res. Public Health 2022, 19, 8327. [Google Scholar] [CrossRef]
- Bajpeyi, S.; Apaflo, J.N.; Rosas, V.; Sepulveda-Rivera, K.; Varela-Ramirez, A.; Covington, J.D.; Galgani, J.E.; Ravussin, E. Effect of an acute long-duration exercise bout on skeletal muscle lipid droplet morphology, GLUT 4 protein, and perilipin protein expression. Eur. J. Appl. Physiol. 2023, 1–9. [Google Scholar] [CrossRef]
- Savikj, M.; Gabriel, B.M.; Alm, P.S.; Smith, J.; Caidahl, K.; Björnholm, M.; Wallberg-Henriksson, H. Afternoon exercise is more efficacious than morning exercise at improving blood glucose levels in individuals with type 2 diabetes: A randomised crossover trial. Diabetologia 2019, 62, 233–237. [Google Scholar] [CrossRef]
- Hawley, J.A.; Hargreaves, M.; Joyner, M.J.; Zierath, J.R. Integrative biology of exercise. Cell 2014, 159, 738–749. [Google Scholar] [CrossRef] [PubMed]
- Dollet, L.; Zierath, J.R. Interplay between diet, exercise and the molecular circadian clock in orchestrating metabolic adaptations of adipose tissue. J. Physiol. 2019, 597, 1439–1450. [Google Scholar] [CrossRef] [PubMed]
- Meneilly, G.S. Pathophysiology of diabetes in the elderly. In Diabetes in Old Age, 2nd ed.; Sinclair, A.J., Finucane, P., Eds.; John Wiley & Sons, Ltd.: Chihester, UK; New York, NY, USA; Weinheim, Germany; Brisbane, Australia; Singapore; Toronto, ON, Canada, 2001; pp. 155–164. [Google Scholar]
- Li, J.; Wu, H.; Liu, Y.; Yang, L. High fat diet induced obesity model using four strains of mice: Kunming, C57BL/6, BALB/c and ICR. Exp. Anim. 2020, 69, 326–335. [Google Scholar] [CrossRef] [PubMed]
- Jayaprakasam, B.; Olson, L.K.; Schutzki, R.E.; Tai, M.H.; Nair, M.G. Amelioration of obesity and glucose intolerance in high-fat-fed C57BL/6 mice by anthocyanins and ursolic acid in Cornelian cherry (Cornus mas). J. Agric. Food Chem. 2006, 54, 243–248. [Google Scholar] [CrossRef] [PubMed]
- Li, X.; Yu, X.; Sun, D.; Li, J.; Wang, Y.; Cao, P.; Liu, Y. Effects of polar compounds generated from the deep -frying process of palm oil on lipid metabolism and glucose tolerance in Kunming mice. J. Agric. Food Chem. 2017, 65, 208–215. [Google Scholar] [CrossRef]
- Czech, M.P. Insulin action and resistance in obesity and type 2 diabetes. Nat. Med. 2017, 23, 804–814. [Google Scholar]
- Nishikawa, S.; Yasoshima, A.; Doi, K.; Nakayama, H.; Uetsuka, K. Involvement of sex, strain and age factors in high fat diet-induced obesity in C57BL/6J and BALB/cA mice. Exp. Anim. 2007, 56, 263–272. [Google Scholar] [CrossRef]
- Wang, D.; Zhang, X.; Li, Y.; Jia, L.; Zhai, L.; Wei, W.; Zhang, L.; Jiang, H.; Bai, Y. Exercise-Induced Browning of White Adipose Tissue and Improving Skeletal Muscle Insulin Sensitivity in Obese/Non-obese Growing Mice: Do Not Neglect Exosomal miR-27a. Front. Nutr. 2022, 9, 940673. [Google Scholar] [CrossRef] [PubMed]
- Mann, S.; Beedie, C.; Balducci, S.; Zanuso, S.; Allgrove, J.; Bertiato, F.; Jimenez, A. Changes in insulin sensitivity in response to different modalities of exercise: A review of the evidence: Insulin sensitivity and exercise modality. Diabetes Metab. Res. Rev. 2014, 30, 257–268. [Google Scholar] [CrossRef]
- Medscape: Diabetes Mellitus and Exercise. Available online: https://www.medscape.com/viewarticle/717051 (accessed on 30 July 2020).
- Bird, S.R.; Hawley, J.A. Update on the effects of physical activity on insulin sensitivity in humans. BMJ Open Sport. Exerc. Med. 2017, 2, e000143. [Google Scholar] [CrossRef]
- Pedersen, B.K.; Febbraio, M.A. Muscle as an endocrine organ: Focus on muscle-derived interleukin-6. Physiol. Rev. 2008, 88, 1379–1406. [Google Scholar] [CrossRef] [PubMed]
- Iizuka, K.; Machida, T.; Hirafuji, M. Skeletal muscle is an endocrine organ. J. Pharmacol. Sci. 2014, 125, 125–131. [Google Scholar] [CrossRef]
- Pedersen, B.K.; Febbraio, M.A. Muscles, exercise and obesity: Skeletal muscle as a secretory organ. Nat. Rev. Endocrinol. 2012, 8, 457–465. [Google Scholar] [CrossRef]
- Hansen, J.S.; Zhao, X.; Irmler, M.; Liu, X.; Hoene, M.; Scheler, M.; Li, Y.; Beckers, J.; Hrabĕ de Angelis, M.; Häring, H.U.; et al. Type 2 diabetes alters metabolic and transcriptional signatures of glucose and amino acid metabolism during exercise and recovery. Diabetologia 2015, 58, 1845–1854. [Google Scholar] [CrossRef]
- Raue, U.; Trappe, T.A.; Estrem, S.T.; Qian, H.-R.; Helvering, L.M.; Smith, R.C.; Trappe, S. Transcriptomic signature of resistance exercise adaptations: Mixed muscle and fiber type specific profiles in young and old adults. J. Appl. Physiol. 2012, 112, 1625–1636. [Google Scholar] [CrossRef]
- Gundersen, K. Excitation-transcription coupling in skeletal muscle: The molecular pathways of exercise. Biol. Rev. 2011, 86, 564–600. [Google Scholar]
- Ma, H.; Groth, R.D.; Wheeler, D.G.; Barrett, C.F.; Tsien, R.W. Excitation-transcription coupling in sympathetic neurons and the molecular mechanism of its initiation. Neurosci. Res. 2011, 70, 2–8. [Google Scholar] [CrossRef]
- Brandt, C.; Pedersen, B.K. The role of exercise-induced myokines in muscle homeostasis and the defense against chronic diseases. J. Biomed. Biotechnol. 2010, 2010, 520258. [Google Scholar] [CrossRef]
- Kapilevich, L.; Zakharova, A.; Kabachkova, A.; Kironenko, T.; Milovanova, K.; Orlov, S. Different impact of physical activity on plasma myokines content in athletes and untrained volunteers. FEBS J. 2017, 284, 373. [Google Scholar]
- Kapilevich, L.V.; Zakharova, A.N.; Kabachkova, A.V.; Kironenko, T.A.; Orlov, S.N. Dynamic and static exercises differentially affect plasma cytokine content in elite endurance- and strength-trained athletes and untrained volunteers. Front. Physiol. 2017, 8, 35–45. [Google Scholar] [CrossRef]
- Kapilevich, L.V.; Kironenko, T.A.; Zaharova, A.N.; Kotelevtsev, Y.V.; Dulin, N.O.; Orlov, S.N. Skeletal muscle as an endicrine organ: Role of [Na+]i/[K+]i-mediated excitation-transcription coupling. Gen. Diseas. 2015, 2, 328–336. [Google Scholar] [CrossRef]
- Zakharova, A.N.; Kironenko, T.A.; Milovanova, K.G.; Orlova, A.A.; Dyakova, E.Y.; Kalinnikova Yu, G.; Kabachkova, A.V.; Chibalin, A.V.; Kapilevich, L.V. Treadmill training effect on the myokins content in skeletal muscles of mice with a metabolic disorder model. Front. Psychol. 2021, 12, 709039. [Google Scholar]
- de Melo Madureira, Á.N.; de Oliveira, J.R.S.; de Menezes Lima, V.L. The Role of IL-6 Released During Exercise to Insulin Sensitivity and Muscle Hypertrophy. Mini Rev. Med. Chem. 2022, 22, 2419–2428. [Google Scholar]
- Günaşti, Ö.; Özdemir, Ç.; Özgünen, K.T.; Yilmaz, M.B.; Öksüz, H.; Zorludemir, S.; Kurdak, S.S. The effects of exercise on skeletal and heart muscle citrate synthase and carnitine palmitoyltransferase mRNA expressions in high-calorie fed rats. Gen. Physiol. Biophys. 2021, 40, 341–350. [Google Scholar] [CrossRef]
- Edwards, S.J.; Shad, B.J.; Marshall, R.N.; Morgan, P.T.; Wallis, G.A.; Breen, L. Short-term step reduction reduces citrate synthase activity without altering skeletal muscle markers of oxidative metabolism or insulin-mediated signaling in young males. J. Appl. Physiol. 2021, 131, 1653–1662. [Google Scholar] [CrossRef]
- MacInnis, M.J.; Skelly, L.E.; Godkin, F.E.; Martin, B.J.; Tripp, T.R.; Tarnopolsky, M.A.; Gibala, M.J. Effect of short-term, high-intensity exercise training on human skeletal muscle citrate synthase maximal activity: Single versus multiple bouts per session. Appl. Physiol. Nutr. Metab. 2019, 44, 1391–1394. [Google Scholar] [CrossRef]
- Latham, C.M.; Owen, R.N.; Dickson, E.C.; Guy, C.P.; White-Springer, S.H. Skeletal Muscle Adaptations to Exercise Training in Young and Aged Horses. Front. Aging 2021, 27, 54. [Google Scholar] [CrossRef]
- Kapilevich, L.V.; Zakharova, A.N.; Dyakova, E.Y.; Kalinnikova, J.G.; Chibalin, A.V. Mice experimental model of diabetes mellitus type ii based on high fat diet. Bull. Siberian Med. 2019, 18, 53–61. [Google Scholar] [CrossRef]
- Zakharova, A.N.; Kalinnikova, Y.; Negodenko, E.S.; Orlova, A.A.; Kapilevich, L.V. Experimental simulation of cyclic training loads. Teor. Prakt. Fizich Kult. 2020, 10, 26–27. [Google Scholar]


| Characteristics | High Fat Diet | Chow Diet |
|---|---|---|
| Caloric content, kcal/kg | 5100 | 3000 |
| Including % of calories from fat | 59% | 2.5% |
| Composition | ||
| Fats | 33.3% | 6% |
| Including animal fats | 25% | - |
| Carbohydrates | 17% | 3.6% |
| Protein | 13% | 23.9% |
| Lysine | 0.8% | 1.5% |
| Methionine + Cysteine | 0.5% | 0.9% |
| Macronutrients | ||
| Calcium | 0.9% | 1% |
| Phosphorus | 0.7% | 0.8% |
| Sodium chloride | 0.24% | 0.34% |
| Vitamins and minerals | + | + |
| Antioxidant, amino acids | + | + |
Disclaimer/Publisher’s Note: The statements, opinions and data contained in all publications are solely those of the individual author(s) and contributor(s) and not of MDPI and/or the editor(s). MDPI and/or the editor(s) disclaim responsibility for any injury to people or property resulting from any ideas, methods, instructions or products referred to in the content. |
© 2023 by the authors. Licensee MDPI, Basel, Switzerland. This article is an open access article distributed under the terms and conditions of the Creative Commons Attribution (CC BY) license (https://creativecommons.org/licenses/by/4.0/).
Share and Cite
Zakharova, A.N.; Milovanova, K.G.; Orlova, A.A.; Dyakova, E.Y.; Kalinnikova, J.G.; Kollantay, O.V.; Shuvalov, I.Y.; Chibalin, A.V.; Kapilevich, L.V. Effects of Treadmill Running at Different Light Cycles in Mice with Metabolic Disorders. Int. J. Mol. Sci. 2023, 24, 15132. https://doi.org/10.3390/ijms242015132
Zakharova AN, Milovanova KG, Orlova AA, Dyakova EY, Kalinnikova JG, Kollantay OV, Shuvalov IY, Chibalin AV, Kapilevich LV. Effects of Treadmill Running at Different Light Cycles in Mice with Metabolic Disorders. International Journal of Molecular Sciences. 2023; 24(20):15132. https://doi.org/10.3390/ijms242015132
Chicago/Turabian StyleZakharova, Anna Nikolaevna, Kseniya Gennadievna Milovanova, Anna Alekseevna Orlova, Elena Yuryevna Dyakova, Julia Gennadievna Kalinnikova, Olesya Vadimovna Kollantay, Igor Yurievich Shuvalov, Alexander Valerievich Chibalin, and Leonid Vladimirovich Kapilevich. 2023. "Effects of Treadmill Running at Different Light Cycles in Mice with Metabolic Disorders" International Journal of Molecular Sciences 24, no. 20: 15132. https://doi.org/10.3390/ijms242015132
APA StyleZakharova, A. N., Milovanova, K. G., Orlova, A. A., Dyakova, E. Y., Kalinnikova, J. G., Kollantay, O. V., Shuvalov, I. Y., Chibalin, A. V., & Kapilevich, L. V. (2023). Effects of Treadmill Running at Different Light Cycles in Mice with Metabolic Disorders. International Journal of Molecular Sciences, 24(20), 15132. https://doi.org/10.3390/ijms242015132