Article

Similar Pro- and Antiangiogenic Profiles Close to Delivery in Different Clinical Presentations of Two Pregnancy Syndromes: Preeclampsia and Fetal Growth Restriction

by
Weronika Dymara-Konopka
1,*,
Marzena Laskowska
1,*,
Ewelina Grywalska
2,
Anna Hymos
2,
Anna Błażewicz
3 and
Bożena Leszczyńska-Gorzelak
1
1
Department of Obstetrics and Perinatology, Medical University of Lublin, 8 Jaczewskiego Street, 20-095 Lublin, Poland
2
Department of Experimental Immunology, Medical University of Lublin, 4a Chodźki Street, 20-093 Lublin, Poland
3
Department of Pathobiochemistry and Interdisciplinary Applications of Ion Chromatography, Biomedical Sciences, Medical University of Lublin, 1 Chodźki Street, 20-093 Lublin, Poland
*
Authors to whom correspondence should be addressed.
Int. J. Mol. Sci. 2023, 24(2), 972; https://doi.org/10.3390/ijms24020972
Submission received: 3 November 2022 / Revised: 29 December 2022 / Accepted: 30 December 2022 / Published: 4 January 2023
(This article belongs to the Special Issue Pathogenesis of Pregnancy-Related Complication)

Abstract

:
The purpose of this study was to evaluate serum levels of anti- and pro-angiogenic substances measured using enzyme-linked immunosorbent assays and their ratios in pregnancies complicated by different clinical subsets of placental ischemic syndrome: preeclampsia and/or fetal growth restriction. A prospective case-control study was performed consisting of 77 singleton pregnancies complicated by preeclampsia, preeclampsia with concurrent fetal growth restriction (FGR), and isolated normotensive FGR pairwise matched by gestational age with healthy pregnancies. The entire study cohort was analyzed with respect to adverse pregnancy outcomes that occurred. In all investigated subgroups, placental growth factor (PlGF) was lower and soluble endoglin (sEng), the soluble fms-like tyrosine kinase-1—sFlt-1/PlGF and sFlt-1*sEng/PlGF ratios were higher than in the control group. The differences were most strongly pronounced in the PE with concurrent FGR group and in the sFlt-1/PlGF ratio. The highest sFlt-1 values in preeclamptic patients suggest that this substance may be responsible for reaching the threshold needed for PE to develop as a maternal manifestation of ischemic placental disease. The FGR is characterized by an elevated maternal sFlt-1/PlGF ratio, which boosts at the moment of indicated delivery due to fetal risk. We concluded that angiogenic imbalance is reflective of placental disease regardless of its clinical manifestation in the mother, and may be used as support for the diagnosis and prognosis of FGR.

1. Introduction

Preeclampsia and fetal growth restriction are considered major pregnancy syndromes that significantly contribute to perinatal morbidity and mortality [1,2,3,4,5]. In many cases, FGR occurs together with PE. They share the challenge that currently there is no effective treatment to stop the progress of clinical deterioration, and it is still delivery that definitely eliminates the direct threat for the mother and fetus during pregnancy, resulting in prematurity-associated consequences for the newborn.
Preeclampsia affects 3–6% of pregnant women worldwide, whereas fetal growth restriction (FGR) is a condition affecting approximately 8% of all pregnancies and contributing to 30% of stillbirths [1,2]. There is a significant overlap in the incidence of PE and FGR, but the association is particularly strong in early-onset disease, diagnosed before 34 weeks, with evidence suggesting that up to 75% of preeclamptic pregnancies will be further complicated by the presence of fetal growth restriction. In contrast, FGR presents simultaneously with late-onset PE in only 10% of preeclamptic cases [3,4,5]. However, concurrent FGR in the course of PE does not lead to a more severe maternal disease phenotype [5,6]. The maternal symptoms of PE do not show any differences between women, regardless of the growth percentiles of the fetus.
Mothers of babies with impaired growth are at increased risk of developing PE [7,8]. However, it has been shown that only approximately 15% of women with FGR will be diagnosed with superimposed preeclampsia later in pregnancy [9]. The management of FGR with concurrent PE should be combined with preeclamptic women’s surveillance, which also takes into consideration the maternal condition and the possibility of rapid fetal deterioration in this disease [10].
In PE, an antiangiogenic state has been implicated as a mechanism of disease. Elevated levels of sFlt-1 and sEng and a lower level of PlGF are features of PE and have already established a significant role in the pathogenesis of the condition. They are also associated with maternal endothelium dysfunction and impaired nitric oxide production. The current knowledge in the area of angiogenic balance and dynamics implicates its possible use in clinical practice. Additionally, recent studies have reported similarities in the mechanisms that underlie the development of PE and FGR. They are both defined by some level of placental insufficiency and thus are considered placenta-originating disorders that share many pathological features [11]. Further, similar changes in maternal levels of angiogenic biomarkers are supposed to be found among them [11,12,13,14]. Disordered angiogenesis is one of the processes that is inherently connected with the development of placental insufficiency. The alterations in sFlt-1, PlGF, and sEng levels taken together are believed to describe placental insufficiency better than each marker separately.
In addition, it is now the subject of research to determine whether the significance of angiogenic factors in PE may be extrapolated to FGR as a part of the clinical picture of placental ischemic disease [15,16]. Although their role has been widely studied in the context of the prediction [17,18,19,20,21,22,23,24,25,26,27,28,29,30] and diagnosis [31,32,33,34,35,36,37] of PE, there is growing evidence that the angiogenic profile is reflective of placental disease and can also be observed in FGR [17,18,38,39,40,41,42,43,44,45,46], especially in patients with abnormal Doppler studies in uterine and umbilical arteries [43]. In PE, maternal and fetal conditions should be kept under surveillance. Tight control of blood pressure in PE results mostly in benefits for the mother [47]. At the same time, it does not improve the rate of adverse perinatal outcomes but may lead to a negative effect on fetal growth without increasing illness or death in the infant. As of yet, in FGR, there is no therapy that improves fetal growth in utero, and current management is to deliver the fetus before intrauterine death or irreversible organ damage occurs [48]. This is particularly challenging in early-onset FGR, where delivery entails additional risks to the baby from extremely preterm birth, with its own attendant short- and long-term complications [49,50,51]. In recent years, better monitoring of PE and FGR has been a subject of growing interest, and the range of diagnostic tools at our disposal involving angiogenic markers is expanding. The evaluation of adverse outcome risk in FGR and PE patients is of particular interest.
Further, a comparison between FGR alone and FGR associated with PE as well as isolated PE regarding levels of maternal sFlt-1, sEng, and PlGF and their ratios could provide valuable information for understanding these different manifestations of placental syndrome. In the definitions of small for gestational age (SGA) as fetal growth below the 10th percentile, which may comprise both small but normally grown babies and intrauterine/fetal growth restriction (IUGR, FGR) with placenta-mediated restricted growth, the terms are often confused, and limited studies in this area have led to inconsistent results. The ongoing advances in terms of the definitions of these two entities—FGR and PE—enable us to precisely select a study group of patients who meet the newest, very strict criteria for both, which were recently formed by international experts and societies to explain differences and similarities in these great obstetrical syndromes [52].
In this study, we hypothesized that FGR and PE demonstrate the same profile in the most widely analyzed pro- and antiangiogenic substances: PlGF, sEng, and sFlt-1, with possible differences in the degree of severity of imbalances. In putting our work into a clinical, practical perspective, the most widely analyzed values of the sFlt-1 were compared to the PlGF ratio in investigated subgroups according to gestational age with preliminary cutoffs and current evidence of the clinical application for the diagnosis, prognosis, and assessment of PE. Finally, we also investigated angiogenic imbalance in the context of adverse outcomes that occured across the entire study population.

2. Results

2.1. Patient Demographic Data and Clinical Characteristics

There were no statistically significant differences with regard to gravidity and parity, maternal age, weight, or height in patient profiles between groups. In the PE with FGR group, the mean gestational age at delivery was significantly lower than in the PE alone group (median value, 32 vs. 35 weeks), but there were no significant differences in gestational age between other subgroups or any of the subgroups and the control group. The systolic blood pressure (SBP) and mean arterial blood pressure (MAP) values were significantly higher in all investigated subgroups in comparison with control groups, and diastolic blood pressure (BDP) was higher than controls in the two PE groups (PE + FGR and iPE). Aspartate and alanine transferases (AST and ALT), uric acid (UA), and urea values were higher in preeclamptic patients in both groups (PE + FGR and iPE) than in healthy controls.
The patient demographic data and clinical characteristics of pregnant women in all investigated groups are shown in Table 1 and Table 2. Sonographic parameters with Doppler flow evaluation are presented in Table 3.
In our study, 83% (30/36) of patients with FGR had abnormal Doppler study results (UtA or UA above 95 pc or MCA or CPR under 5 pc), and the remaining 17% (6/36) had exclusively EFW under 3 pc. The doppler study analysis revealed a statistically higher uterine artery mean pulsatility index in both FGR groups and a higher umbilical artery pulsatility index in all investigated subgroups compared to controls. It was observed that a positive correlation existed between the sFlt-1/PlGF ratio values and uterine artery PI (R = 0.8, p < 0.00005), umbilical artery PI (R = 0.52, p < 0.00005), and RI (R = 0.47, p < 0.00005) in the entire study population using Spearman’s correlation analysis. These correlations were also observed separately for iFGR and both PE groups together (including iPE with PE + FGR).
Furthermore, with respect to perinatal results, neonatal birth weight was lower than controls in the PE + FGR, iPE, and iFGR groups, which is mostly due to lower gestational age at delivery as all the control patients delivered at term, but birth weight percentiles were significantly lower only in the FGR groups: iFGR and PE + FGR. The patients in the PE + FGR and iPE groups had significantly lower APGAR scores than controls. Additionally, the detailed perinatal outcomes are presented in Table 4.

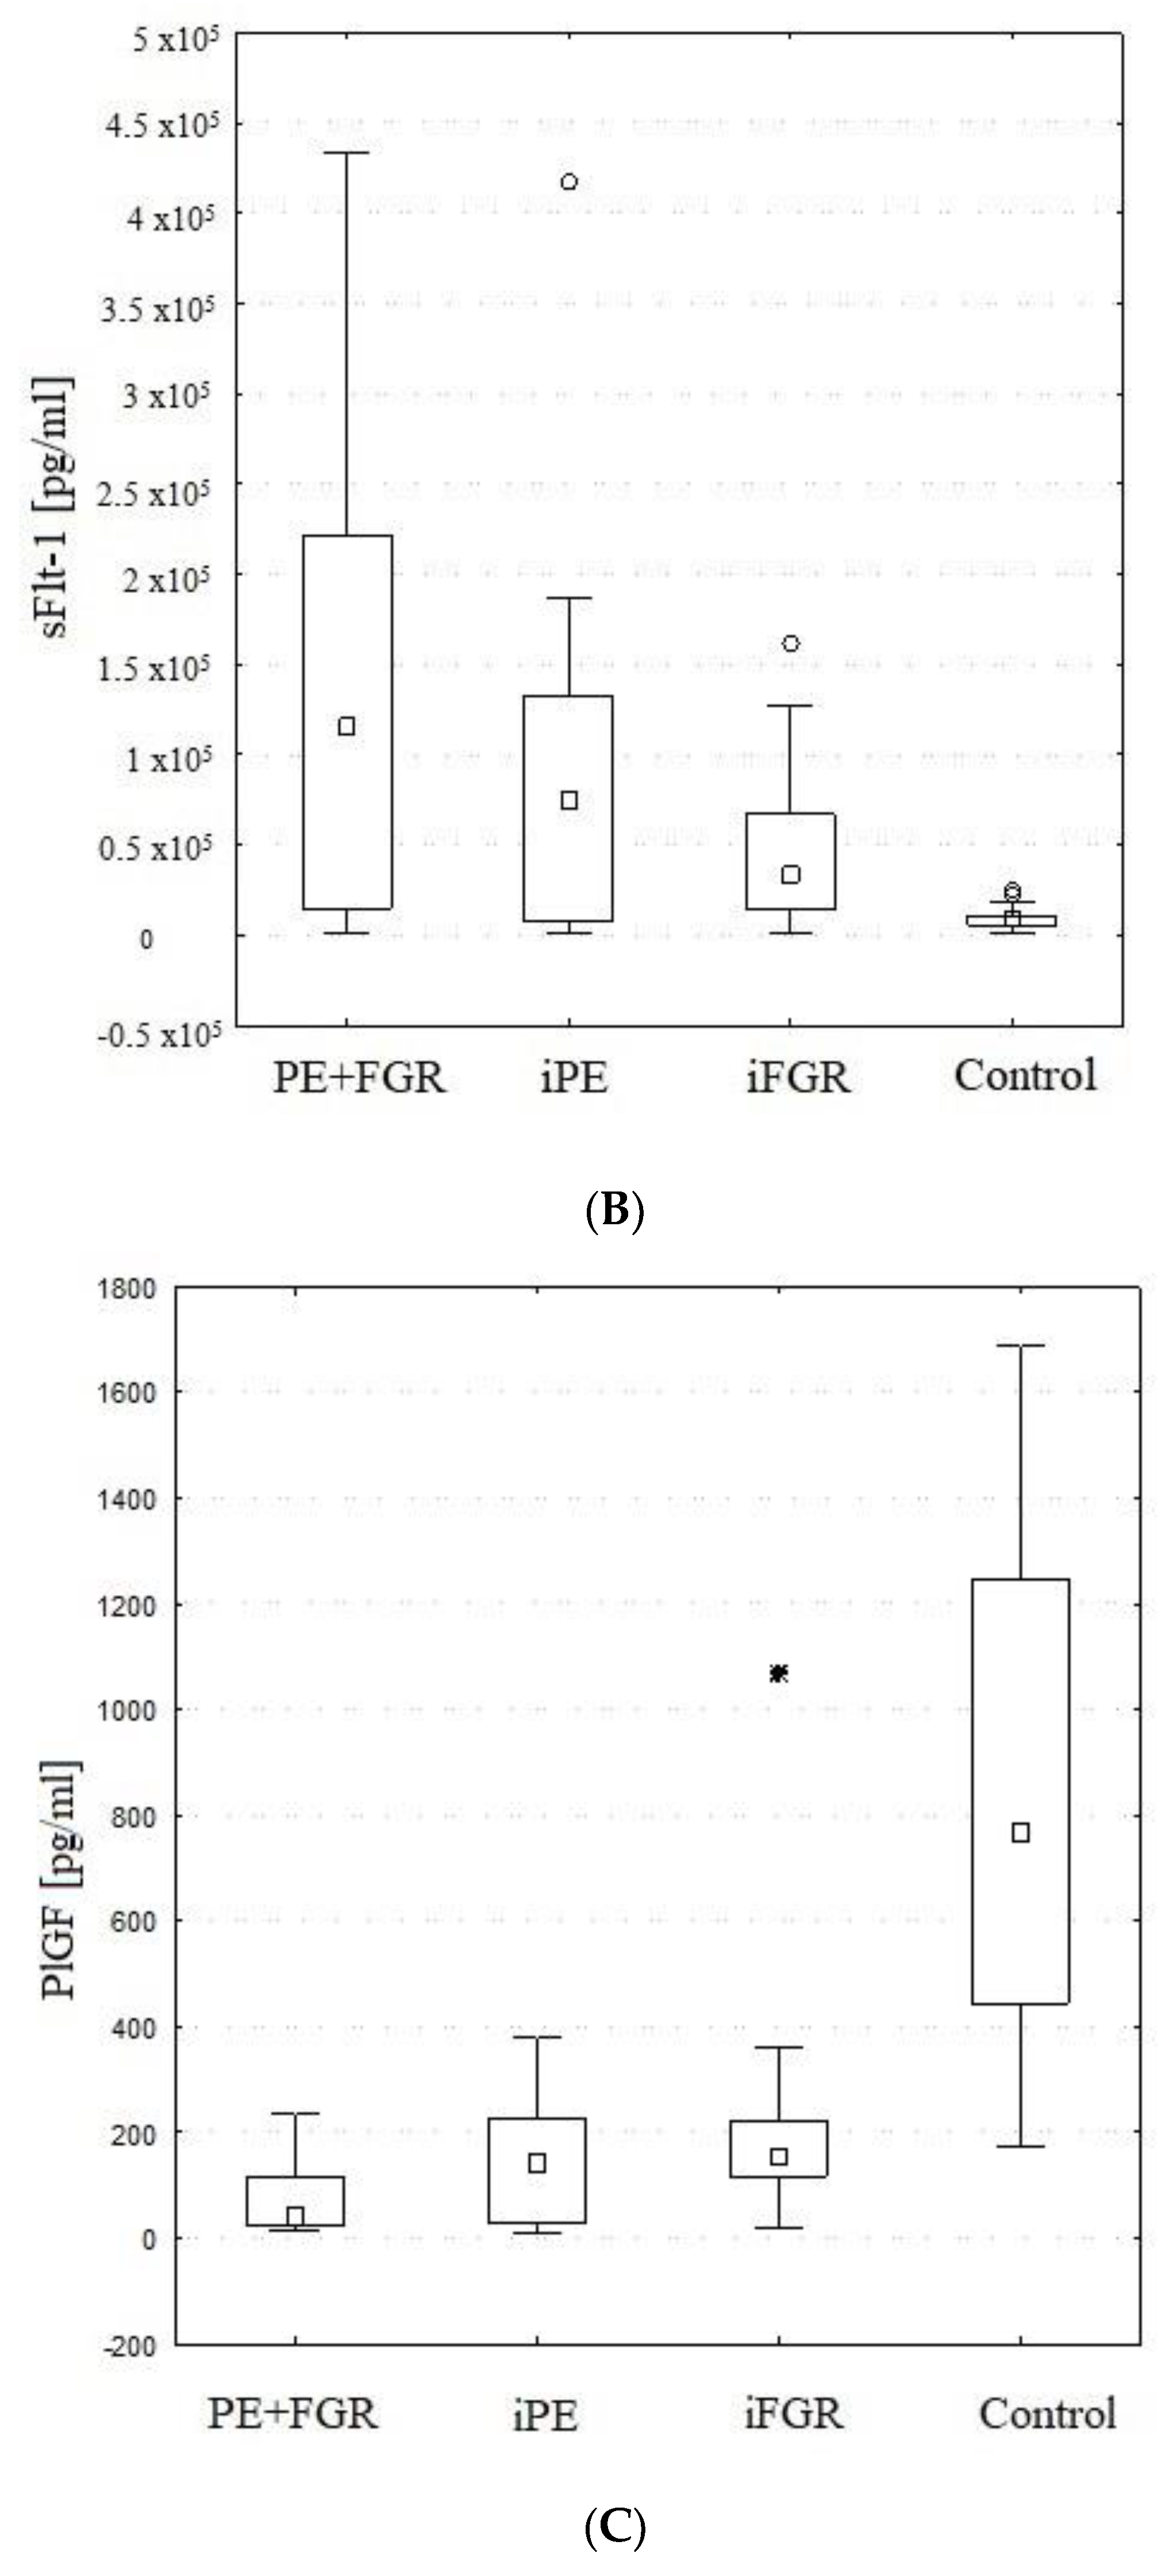
2.2. Maternal Serum PlGF

The entire study group had significantly lower PlGF values (p < 0.001) than the control group. The PlGF serum levels were significantly lower in the iFGR (median 154 pg/mL, quartile range 117–221, p < 0.002), iPE (median 142 pg/mL, quartile range 27–227, p < 0.001) and PE + FGR groups (median 42 pg/mL, quartile range 22–113, p < 0.001) than in the normal pregnancy group (median 769 pg/mL, quartile range 444–1248). The differences between subgroups were not significantly different.
The maternal serum PlGF levels were significantly higher in healthy pregnant control patients at <34 weeks of gestational age (median 1247 pg/mL, quartile range 1078–1480) than in healthy pregnant women at more advanced gestation (median 500 pg/mL, quartile range 338–769, p < 0.005).

2.3. Maternal Serum sFlt-1

The entire study group had significantly higher sFlt-1 values (p < 0.001) than the control group. The sFlt-1 serum levels were significantly higher only in the preeclamptic subgroups: iPE (median 76,345 pg/mL, quartile range 8614–133,888 pg/mL, p < 0.05) and PE + FGR group (median 115,702 pg/mL, quartile range 14,981–221,278 pg/mL, p < 0.001) when compared to normal pregnancies (median 8878 pg/mL, quartile range 5574–10,809 pg/mL). The iFGR group presented clearly higher sFlt-1 concentrations than the control group, but the differences were not statistically significant (median 33,590 pg/mL, quartile range 13,871–66,994 pg/mL). The differences between all subgroups were not statistically significant.
The maternal serum sFlt-1 levels were significantly lower in healthy pregnant control patients at <34 weeks of gestational age (median 6567 pg/mL, quartile range 2647–9105 pg/mL) than in healthy pregnant women at more advanced gestation (median 10,170 pg/mL, quartile range 9501–11,407 pg/mL, p < 0.05).

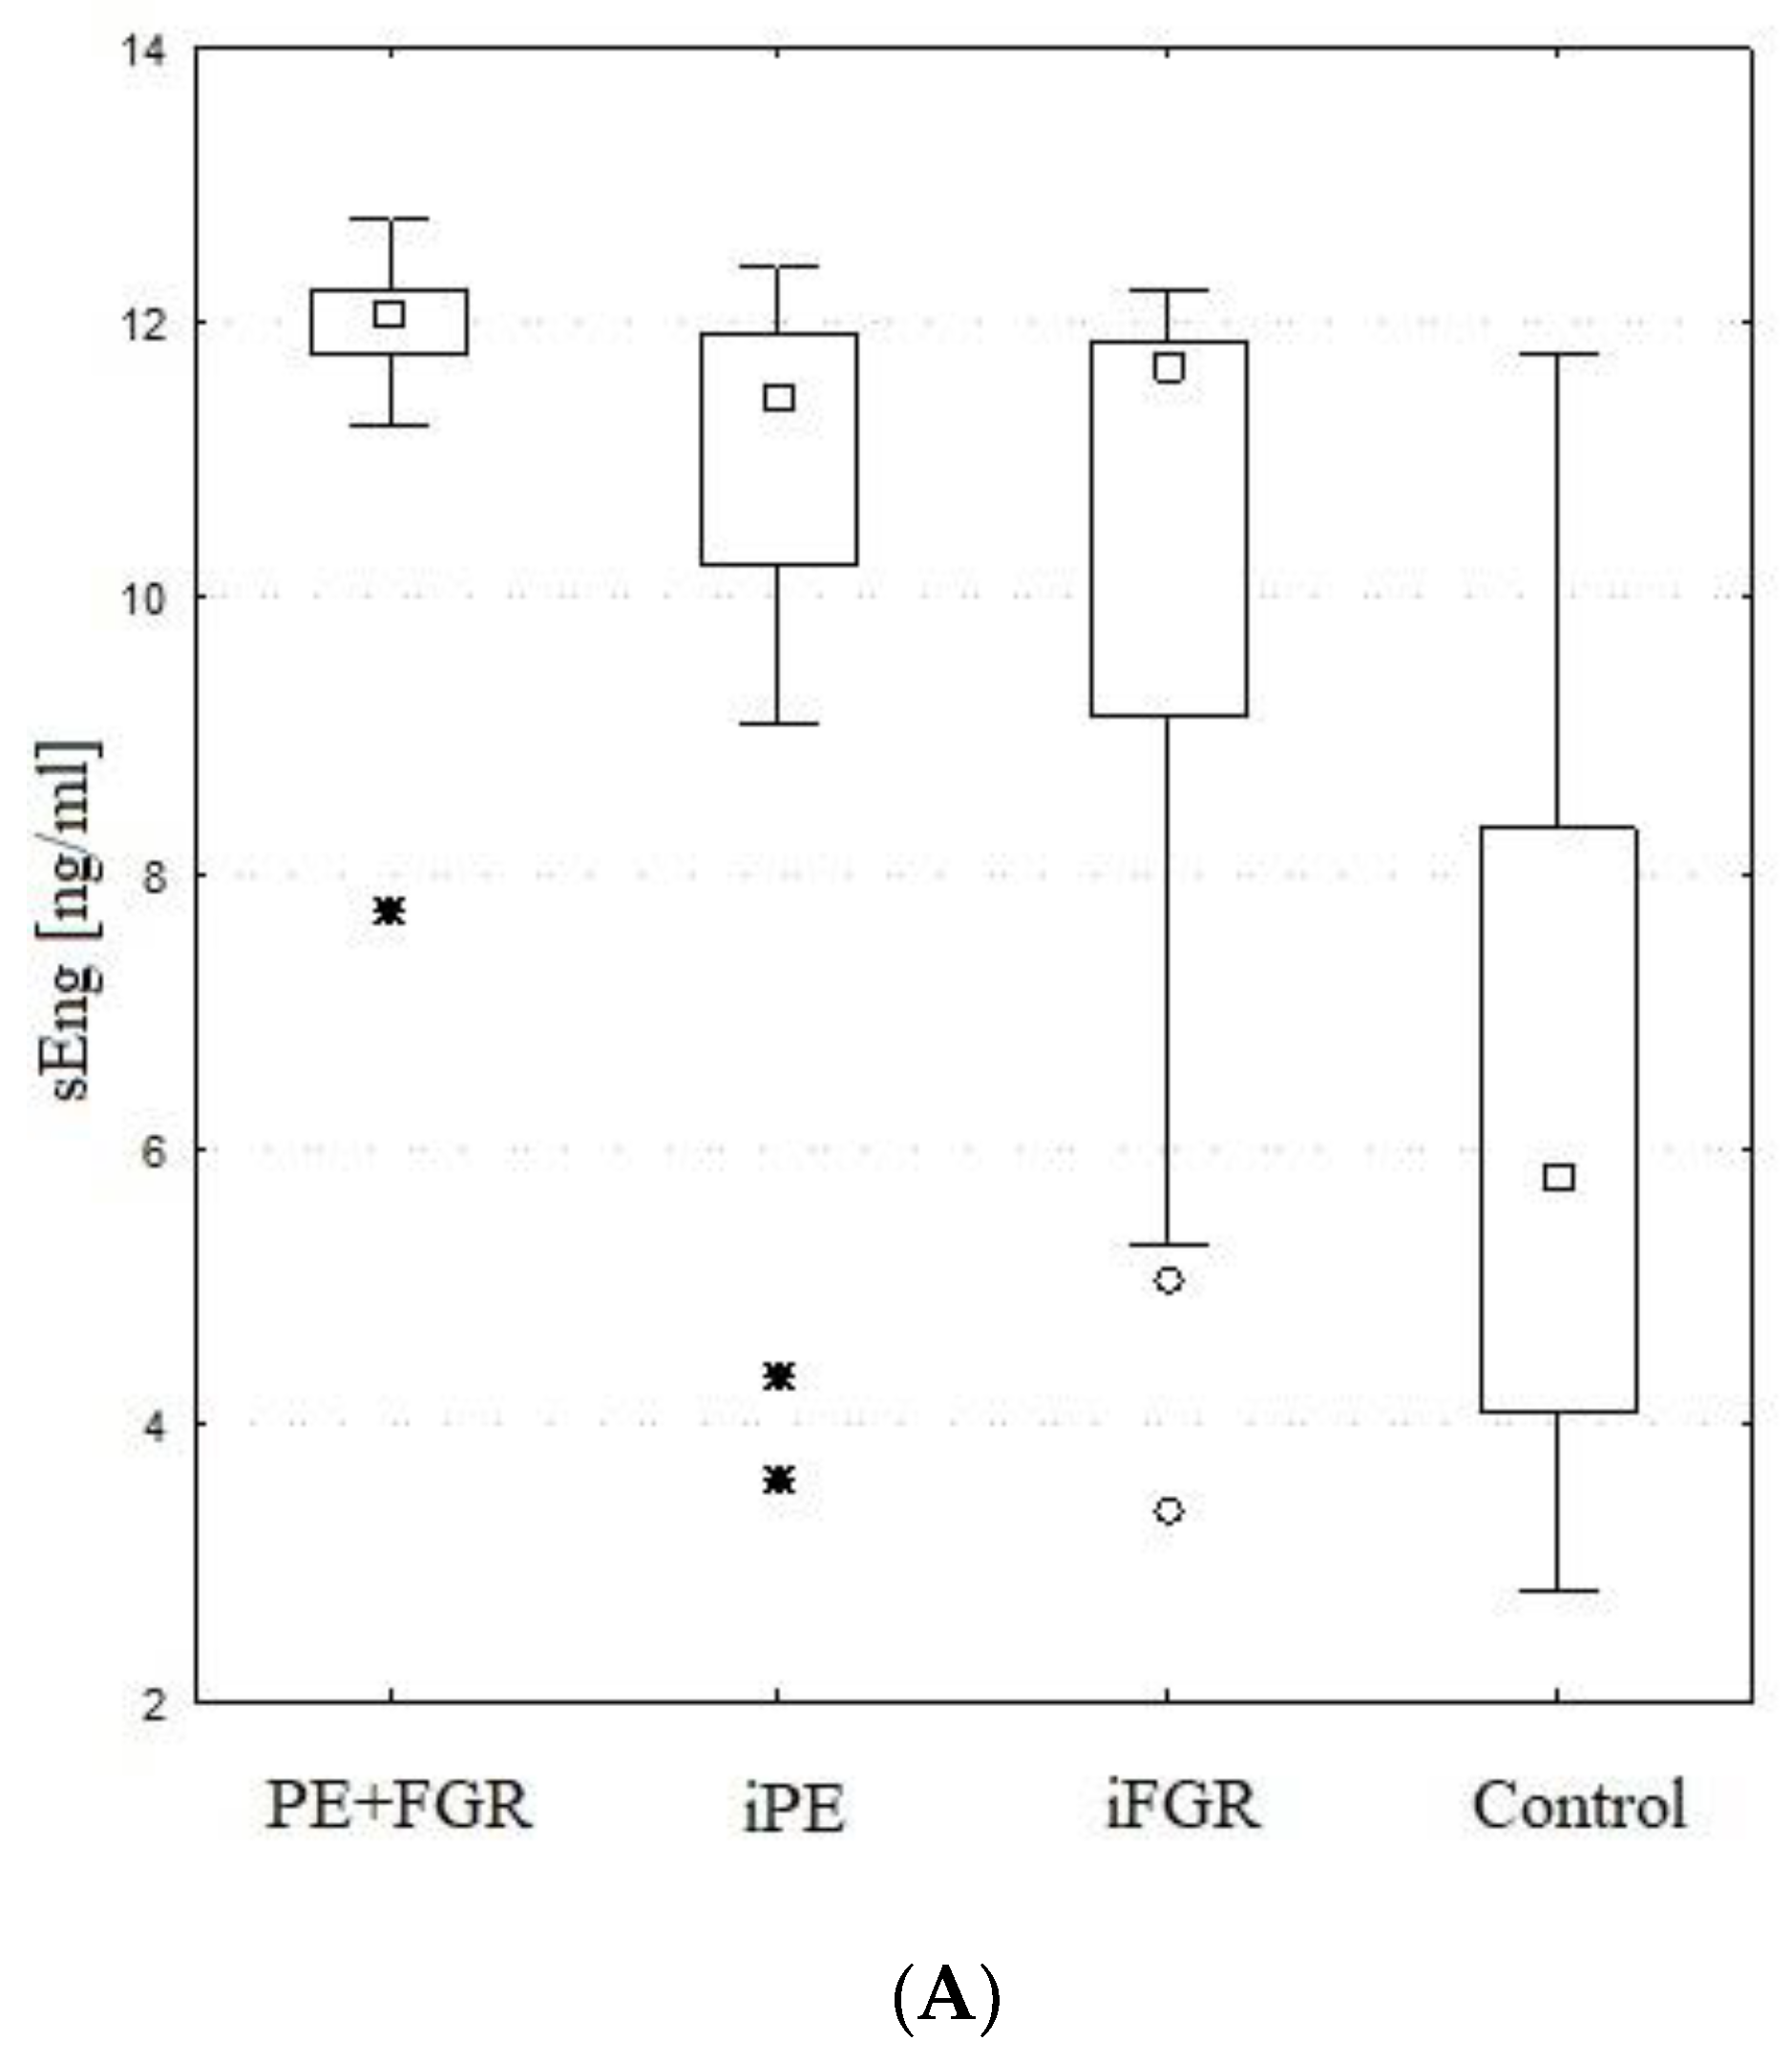
2.4. Maternal Serum sEng

The entire study group had significantly higher sEng values (p < 0.001) than the control group. The sEng serum levels were significantly higher in the iFGR (median 11.7 ng/mL, quartile range 9.1–11.9 ng/mL, p < 0.05), iPE (median 11.5 ng/mL, quartile range 10.2–11.9 ng/mL, p < 0.003) and PE + FGR groups (median 12.0 ng/mL, quartile range 11.8–12.2 ng/mL, p < 0.001) when compared to normal pregnancy group (median 5.8 ng/mL, quartile range 4–8.3 ng/mL). The differences between the studied subgroups of patients with pregnancy complicated by PE and/or FGR were not significantly different.
There was a strong positive correlation between sEng and sFlt-1 levels in the entire study population (R = 0.69, p < 0.001).
The maternal serum sEng levels were significantly lower in healthy pregnant control patients at <34 weeks of gestational age (median 4.1 ng/mL, quartile range 3.4–6.0 ng/mL) than in healthy pregnant women at more advanced gestation (median 7.4 ng/mL, quartile range 6.0–9.9 ng/mL, p < 0.05).

2.5. sFlt-1/PlGF and sFlt-1*sEng/PlGF Ratios

The entire study group had significantly higher ratios (p < 0.001) than the control group. All of the investigated subgroups had significantly higher values of both ratios than the control group (p < 0.005). The sFlt-1/PlGF ratio was the highest and most pronounced in the iPE and PE with concurrent FGR groups (median values 30 and 100 times higher than controls, respectively). In all three investigated subsets the ratio was significantly higher than that in control subjects. None of the subgroups differed significantly from any other subgroup. At delivery, elevation of the sFlt-1 to PLGF ratio in iFGR, iPE and PE + FGR patients reached extreme, very high values exceeding the preliminary cutoff of 655 in most women (64%, 65% and 70% respectively), with similar occurrence in all investigated subgroups. The distributions of the values of sFlt-1, sEng, PlGF and the sFlt-1/PlGF and sFlt-1*sEng/PlGF ratios in women with isolated PE, isolated FGR, combined PE and FGR and pairwise gestational age-matched healthy controls are represented in Table 5 and Figure 1.
Forty-eight hours before delivery, elevation of the sFlt-1 to PlGF ratio in iFGR, iPE and PE + FGR patients reached extreme values exceeding the cutoff of 655/201 in most women (64%, 65% and 70% respectively) with similar occurrence in all investigated subgroups. The results are presented in Table 6.

2.6. Adverse Pregnancy Outcomes

Finally, the angiogenic disturbances were checked in the group with adverse (N = 23) and no adverse outcomes (N = 34) were observed among the study cohort. There were 41 adverse events in total, which occurred in 23 patients from the entire study group (40%, 23/57). Most of the events occurred in PE + FGR subgroup (59%, 24/41) which is also the group with the statistically lowest gestational age. A detailed list of adverse outcomes and their occurrence in each study subgroup as well as their relation to the proposed cutoff value of 655 for adverse outcomes increased risk are listed in Table 7. At the moment of prompt delivery, there were no significant differences in terms of angiogenic factor levels or their ratios between the adverse and no-adverse groups.
Table 7. Adverse outcomes, their occurrence in the PE + FGR, iPE and iFGR groups and relation to the sFlt/PlGF ratio cutoff values.
Adverse Outcome (AO)TotalPE + FGRiPEiFGR
PATIENTS WITH AO23/5710/2211/212/14
Ratio > 655 in the AO group10/236/103/11½
% with the ratio > 655 in AO group44%60%27%50%
sFlT-1/PlGF median value in AO group476840446537
sFlT-1 /PlGF mean value in AO group261037761926537
ANY ADVERSE EVENT41 (100%)24 (59%)15 (37%)2 (4%)
Maternal
1HELLP syndrome8530
2Placental abruption3201
3Blood product transfusion5320
4Neurological symptoms (eclamptic fits, visual disturbances, intense headache)9360
5Renal oliguria or AKI3120
6Intravenous antihypertensive therapy with 3rd drug9720
Fetal
5Not viable fetus/ IUD4301
HELLP—hemolysis, elevated liver enzymes, low platelet syndrome; AKI—acute kidney injury; IUD—intrauterine demise. The results of sEng, PlGF, and sFlt-1 measurements and corresponding ratios in the adverse and non-adverse group are displayed in Table 8.

3. Discussion

The pathophysiologic processes underlying preeclampsia and fetal growth restriction are complicated, multifactorial, and still unclear. In addition, the PE and FGR point to a common placental disorder and a common antiangiogenic state, but the development of maternal syndrome may require interaction with other factors to explain the disease in preeclampsia or perhaps the existence of some kind of protective agent against its appearance [11,12,13,14]. In reality, the balance between placental and maternal causations most likely varies among individuals across the spectrum of gestational age at clinical presentation. To date, it has not been sufficiently explained why the ischemic placenta in one disorder leads to growth restriction of the fetus and in the other to a maladaptation of systemic vasculature and inflammatory state, which constitute PE in the mother [15,16]. It was postulated that maternal PE arises from soluble factors released into the systemic circulation from the stressed placenta. Fetoplacental hypoxia is one of the consequences of placental impairment, which is a threat to the survival of the fetus.
The important findings of our study are that pregnancies with normotensive fetal growth restriction, isolated preeclampsia and preeclampsia with concurrent fetal growth restriction (iFGR, iPE and PE + FGR) share similar angiogenic profiles expressed in decreased PlGF and increased sFlt-1 and sEng maternal serum concentrations. However, differences between controls and investigated groups were most strongly pronounced in the PE with concurrent FGR group and by the ratio sFlt-1/PlGF (its median values in iPE and PE + FGR groups were 30 and 100 times higher than controls, respectively). The absolute highest values of the sFlt-1/PlGF ratio in preeclamptic cases with concurrent growth restriction of the fetus suggest accumulation of pathological changes reflected in extreme angiogenic disturbances in this group. These results support the hypothesis that although FGR and PE differ in their association with maternal disease, they share similar placental pathology responsible for changes in the angiogenic profile and thus, they share a common pathogenesis. Despite the heterogeneity in the phenotypic classification, disordered function of the maternal-fetal unit circulation is its hallmark feature, leading to the idea of considering PE and FGR as a single pathology named “ischemic placental syndrome” [15,16].
Placental ischemia is a key to their pathogenesis, but in preeclampsia it is the maternal systemic vasculature that is predominantly affected, while in FGR the major defect is limited to the placental and uterine vasculature presenting at risk fetal development and well-being.
Nanjo et al. showed results consistent with our work, where in the PE complicated by FGR group, similar changes in sEng, sFlt-1 and PlGF serum levels were more markedly shown compared with PE alone [57]. Additionally, significant differences were observed between iFGR and controls with respect to sFlt-1 serum concentrations. sFlt-1 was the only substance analyzed that reached significantly higher values in both PE groups of patients, irrespective of concurrent FGR, when compared to healthy pregnant patients but did not differ between the iFGR group and controls.
Shibata et al. however found PlGF levels to be decreased in both PE and SGA, but sFlt-1 was increased only in the PE group [58]. However, authors included in the study isolated SGA, not precisely FGR patients.
This study is partially consistent with Alahakoon et al. who demonstrated similar, decreased PlGF profile in PE, PE + IUGR and isolated IUGR [59]. In their study sFlt-1 presented a significantly increased profile in all of these subgroups when compared to healthy controls.
Furthermore, significantly higher sEng serum values were observed compared to controls were identified in all investigated subgroups—iFGR, iPE and PE with simultaneous FGR. However, again (as in the case of PlGF and sFlt-1), the differences in sEng concentrations between the investigated subgroups were not significant. In addition, similar findings in pregnancies complicated by PE and SGA were presented by Levine et al. from the Karumanchi group, who demonstrated increased maternal levels of soluble endoglin in SGA patients from the second half of pregnancy onwards when compared to healthy controls, resulting in concentrations of this protein in the SGA group being as high as in term PE [26]. This study, however, did not involve the precise, updated definition of FGR based on placental insufficiency manifestations in Doppler studies but only fetuses with birth weight below the 10th percentile, which constitutes the definition of SGA. It was observed that sEng increased as sFlt-1 did in all investigated subgroups with either PE or FGR (p < 0.005, R = 0.57, 0.77 and 0.54 for the iFGR, iPE and PE + FGR groups, respectively), but there was no correlation between sFlt-1 and sEng in the control group. The sFlt-1*sEng/PlGF ratio was suggested to be predictive of PE [59,60]. There was a strong positive correlation in our study between sEng and sFlt-1 levels in the entire population (R = 0.69, p < 0.001).
It was suggested that both entities, PE and FGR, share a common biological pathway, but they differ in the sequence of symptoms with attenuated sEng activity in isolated IUGR [60,61]. Thus, the maternal reaction in IUGR is supposed to be delayed. In this study, sEng did not present significant differences between groups, but we measured its concentration at the moment of prompt delivery when clinical decompensation of the mother or fetus was overt. However, the trend of sEng being elevated in normotensive FGR to a lesser extent than in PE, similar to sFlt-1, was visible (Figure 1A,B), and the PE with FGR group reached the highest levels of sEng, which is consistent with our previous work (mean values for PE + FGR, iPE and iFGR were 11.9, 10.5 and 9.9 ng/mL, respectively) [62].
It was found that pregnancies with fetal growth restriction, preeclampsia or HELLP, and preeclampsia or HELLP and fetal growth restriction showed significantly lower values of PlGF and a higher sFlt-1/PlGF ratio than control pregnancies in both groups with different gestational age: before and after 34 weeks (Table 9 and Table 10). The iFGR group presented clearly higher sFlt-1 concentrations than the control group, but the differences were not statistically significant (median values 33,590 vs. 8878 pg/mL, respectively).
Crispi et al. found that in patients with early-onset PE and FGR, maternal PlGF levels were significantly lower and sFlt-1 levels were higher in all cases compared with healthy control subjects of similar gestational age and that all changes were more pronounced in PE than in FGR, but in the late-onset group, these differences were only seen in PE but not in the FGR group [39].
In our study, both PE groups with or without concomitant FGR presented significantly higher sFlt-1 in comparison to healthy controls. The median sFlt-1 values in isolated FGR were definitely lower than in iPE and PE + FGR, but higher than controls. The increased sFlt-1 values were more pronounced not only in PE with concomitant FGR, but also in early PE compared to the late form. Our interpretation is that it is sFlt-1 that is clearly directly linked to maternal disease and, considering generally lower values of sFlt-1 in late-onset disease when compared to early-onset, may be the factor responsible for never reaching the barrier needed to be crossed to trigger maternal response for the antiangiogenic state in iFGR patients. This is in line with previous studies by Levine, Chaiworapongsa and Koga that claimed that circulating sFlt-1 concentrations are increased in women with an established diagnosis of PE and may begin to increase weeks before the onset of clinical symptoms [23,24,34]. Thus, sFlt-1 appears to be the central mediator of preeclampsia, but it is not is not indifferent to the development of FGR.
Although sFlt-1 plays an important role in the pathogenesis of PE, it is unlikely that sFlt-1 alone governs disease onset. In our comparison, sFlt-1 or any of its ratios did not differ significantly between iFGR and PE pregnancies with or without concurrent FGR. This led us to conclude that other circumstances and multiple factor interactions are necessary to progress from angiogenic imbalance caused by increased sFlt-1 to maternal disease.
It has been hypothesized that the development of maternal endothelial dysfunction in preeclampsia occurs after a certain threshold of imbalance is reached. Further, the women with predisposing conditions may develop PE earlier, with milder angiogenic imbalance. The cardiovascular predisposition of some pregnant women to PE is a currently investigated hypothesis on its etiology [63]. The hypothesis assumes that any placental dysfunction during pregnancy is secondary to underlying subclinical defects in women’s cardiovascular system [64]. It is becoming increasingly evident that pregnancy presents a significant strain on the maternal cardiovascular system and metabolism, and in women with evidence of significant maladaptation, preeclampsia is the clinical phenotype. For this reason, pregnancy has been described as a ‘stress test’ that unmasks women who have poor cardiovascular reserve or dysfunction [65]. Individual women with prepregnancy risk of developing cardiovascular syndromes, such as obesity, under this pregnancy stress test will develop PE. FGR develops in the absence of maternal constitutional predisposition, whereas PE develops when mediators of placental stress, such as sFlt-1, provoke sufficiently severe and prolonged endothelial insult and interact with chronic hypertension, renal disease, thrombophilia, insulin resistance/diabetes and obesity [66]. In women with long-term cardiovascular risk factors, even physiological changes at the end of pregnancy and especially late-onset placental disease, which is more commonly associated with less or no placental damage, may induce endothelial dysfunction leading to PE [56,67].
Thus, in some women the degree of placental dysfunction may be high, but with low predisposition to maternal inflammation the final result is FGR without maternal complications. Some women may also have a resistant-type of vasculature that may therefore take longer to develop clinical signs and symptoms in response to placental-shed inflammatory factors. Clinically, these pregnancies can be rescued by iatrogenic delivery when severe FGR is detected on time, before they develop the overt stage of PE. The removal of dysfunctional placenta protects them from symptomatic PE. In these women the threshold needed to develop maternal disease is never reached.
Therefore, it is possible that very high maternal soluble Flt-1 levels are required for preeclampsia to develop. The highest sFlt-1 values in both PE groups, with or without FGR, suggest that this substance is of essential significance for the development of PE. It may be one of the key substances needed for reaching the threshold for PE to develop as a maternal manifestation of ischemic placental disease. Nevertheless, sFlt-1 serum values overlap in many cases in PE and FGR, which Figure 1C illustrates very well. The threshold to be crossed in mothers might be wide range, as women developing PE are a heterogeneous group with different health backgrounds, predispositions and tolerance to physiological and pathological changes taking place in their organisms during pregnancy.
Herraiz et al. proposed a very interesting term of “antiangiogenic continuum” as a proxy of deteriorating placental function, which reflects an observed tendency of the sFlt-1/PlGF ratio to increase from iFGR, toward iPE and finally PE with FGR [14]. This gradual, significant growth is also visible in our study. It is mostly discernible for median concentration of sFlt-1 in each subgroup: starts with the lowest values in iFGR, reaches median results in iPE and finishes with the highest median value in PE + FGR, which is visualized on previous Figure 1B. It seems that this might be interpreted as a more severe placental involvement during FGR in the course of PE as well as at early-onset disease, as these two mechanisms are synergistic: these two entities, FGR and PE converge more frequently in pregnancies at younger gestational age which is attributed to our PE + FGR subgroup.
The division of our relatively small group of patients with iFGR into the early and late subgroups showed significant differences in the level of PlGF concentration, as well as sFlt-1, and thus also their ratio. There was no significant difference in sEng concentration between the early and late FGR groups. For early and late PE, we noted significant differences only in terms of serum concentration of PlGF (data presented in Table 9 and Table 10).
The change in the equilibrium in serum between pro- (PlGF) and antiangiogenic (sFlt-1) factors as well as the level of the resulting sFlt-1/PlGF ratio seems to play a role not only in the diagnosis of PE but also as a predictor of adverse outcomes and gestational time remaining until delivery. Strongly elevated sFlt-1/PlGF ratios in early and late-onset PE have been observed to be correlated with the necessity of delivering the fetus within 48 h and the need for immediate and careful fetal monitoring. The ratio could be helpful in decision-making when inpatient monitoring and fetal lung maturation are being considered.
FGR is also an obstetric complication that presents huge challenges in terms of carrying out diagnostic tests and monitoring the fetus. The complexity of diagnostic criteria is a representative of how complicated the syndrome is. The ultrasound is of primary usefulness here, where apart from assessing the fetal weight, it is used to measure Doppler flows in the uterine, umbilical and middle cerebral arteries [68]. However, the results of Doppler studies may be somewhat delayed in relation to the onset of insufficiency, as some studies have shown quite severe ischemic placental lesions despite the diagnosis of normal UA flows [69]. It seems that combined with ultrasound (fetal biometry, feto-maternal Doppler studies), the sFlt-1/PlGF ratio appears to be useful as a supplementary criterion not only for the detection of FGR but also for the prediction of the time-to-delivery interval and associated adverse outcomes in isolated FGR cases [70,71,72]. In our research, we observed a positive correlation between sFlt-1/PlGF ratio values and uterine artery PI (R = 0.8, p < 0.00005), umbilical artery PI (R = 0.52, p < 0.00005) and RI (R = 0.47, p < 0.00005) in the entire study population using Spearman’s correlation analysis. These correlations were also observed separately for iFGR and both PE groups together (including iPE with PE + FGR).
In putting our work into a clinical, practical perspective, we compared the most widely analyzed ratio of sFlt-1 to PlGF in investigated subgroups according to gestational age with preliminary cutoffs with suggested clinical application in PE syndrome. These preestablished cutoffs of ratio values were: 38, 85, 110, 201 and 655 and their recommended interpretation and clinical application in PE diagnosis and prognosis are shown in Table 11 [55,56].
In the control group, the median and mean values of the sFlt-1/PlGF ratio were 10 and 18, respectively, and the vast majority of patients (17/20, 85%) belonged to the low ratio group. This is quite expected, as these patients were totally healthy during the entire pregnancy, with no underlying medical conditions. Currently, the cutoff level of ≤38 is widely accepted for ruling out PE in patients with suspicion of the disease, and has already been implemented in some European countries (such as Spain, Italy, the UK, France and Germany) [56,73]. There was a small representative of the control group (3/20, 15%) in the intermediate ratio group but none of these patients exceeded the gestational-wide threshold of 85 for PE diagnosis [74]. Notably, all of these patients were at advanced gestational age (mean ratio value is 50 and mean gestational age is 37.3 weeks). The explanation for the finding that all patients from the control group that crossed the threshold of 38 are at term is the fact that advanced, close to term but eventually normal pregnancy exhibit changes in biomarkers sFlt-1 and PlGF similar to those in PE—the ratio increases. In early healthy pregnancy, proangiogenic substances prevail, whereas PE is considered to be an antiangiogenic state. However, the trend that aims to reach this antiangiogenic state can be observed in advancing physiological pregnancies as well. In our study we noted higher concentrations of sFlt-1 and sEng, and lower PlGF values in patients > 34 weeks in the control group in comparison to those at lower gestational age, <34 weeks (p < 0.005 for PlGF and <0.05 for sEng and sFlt-1). As the syncytiotrophoblast (STB) is the main placental source of soluble fms-like tyrosine kinase 1, PlGF and sEng and secretes these factors predominantly into the maternal circulation where they impact maternal vascular adaptation to pregnancy, we can interpret the increasing sFlt-1/PlGF ratio at term as an indicator of accumulating STB stress, expanding with advancing gestation [31,75]. STB pathology, at or after term (for example focal STB necrosis or syncytial knots) demonstrates this stress with or without the occurrence of PE [76], which is supported in our study although the number of women is very low. It should be emphasized that that postterm pregnancies are also complicated by increased rates of PE and more strikingly, eclampsia [77]. It also implies that all pregnant women may be somehow destined to suffer from PE, but spontaneous or induced delivery averts this outcome in most instances [78].
In each study cohort, 87%, 79% and 64% for PE + FGR, iPE and iFGR respectively, met the PE diagnostic threshold of 85. Furthermore, most of the patients from study subgroups reach extremely high, defined above 655 or 201 cutoffs for early and late onset PE [74,77]. These patients in our study delivered within the following 48 h. When the preliminary cutoff value of 85 [75] for PE diagnosis for gestation-wide was applied, all investigated subgroups—iFGR, iPE, PE + FGR had a mean sFlt-1/PlGF ratio above that cutoff meeting the diagnostic criteria of PE even with isolated FGR and no overt maternal disease. The mean/median values for the PE + FGR, iPE, and iFGR groups were 2577/1072, 1181/314, and 408/218, respectively. These patients in our study delivered within the following 48 h. At delivery, most patients with isolated FGR without maternal disease reach the diagnostic criteria for PE of a ratio of more than or equal to 85. In our cohort, all patients in this high-ratio group had only early-onset PE.
It was observed that a sFlt-1/PlGF ratio > 655 at diagnosis was associated with a 5-fold increased risk of delivery in ≤48 h [79]. In our study, all of the patients delivered within the next 48 h, and 67% of the entire study group was allocated to the very high sFlt-1/PlGF ratio cohort.
The blood samples were collected within the last 48 h prior to delivery, when disturbances in angiogenic substances are maximized at the most critical point of pregnancy, when aggravating the fetal state in utero is no longer acceptable and evacuation is necessary, disturbances in the angiogenic profile reach levels as high as those in most serious PE cases. It was expected that the angiogenic and antiangiogenic factors would be dysregulated at this point, but to a less dramatic extent.
In both preeclampsia and fetal growth restriction, placental dysfunction with fetoplacental hypoxia has been suggested as a common underlying condition that may provide an explanation for their strong associations: therefore, the sFlt-1/PlGF ratio may be useful for predicting adverse outcomes not only in PE, but also in women with FGR [80,81].
Table 7 lists the occurrence of adverse outcomes by mortality and morbidity events that occurred in our patient group. In our study, most events occurred in the PE + FGR group of patients, which was also the group with the statistically lowest gestational age. In the FGR group, one preterm abruptio placentae and one intrauterine death occurred.
It was discovered that the combination of both entities, fetal growth restriction age and preeclampsia are exceptionally strongly associated with the elevated sFlt-1 to PlGF ratio.
Additionally, these findings and data from literature seem support both entities e.g FGR and preeclampsia should be considered as different manifestations of the same placental disease. It may be also suggested that an extreme angiogenic imbalance reflects a status of severe placental disease, in which there is a high risk of developing a broad spectrum of maternal and fetal complications that must be assessed comprehensively, regardless of whether a reliable diagnosis of preeclampsia has been reached.

4. Materials and Methods

4.1. Patients

A prospective cross-sectional case control study was conducted on 77 patients aged 20–41 years, between 24 and 41 weeks of gestation. Eligible cases were live singleton pregnancies with a diagnosis of new-onset PE and/or FGR hospitalized in a Polish tertiary referral hospital. In the entire study group, 75% (43/57) were PE patients (with or without concurrent FGR) and 25% (14/57) were isolated FGR cases. The patients were recruited into three subgroups: PE with concurrent FGR (n = 22), isolated PE (n = 21), and isolated normotensive FGR (n = 14). The entire study group was pairwise matched by gestational age with healthy control pregnancies (n = 20). The angiogenic disturbances were also checked in the group of adverse (n = 23) and no adverse outcomes (n = 34) among the entire cohort levels were observed at the most critical moment of pregnancy, right before delivery. The samples were collected immediately before delivery due to maternal or fetal clinical aggravation where the differences in terms of angiogenic imbalance are maximized.
Additionally, very precise inclusion criteria were used for the study groups, according to the newest, updated definitions for the diagnosis of both entities formed by ISSHP for PE in 2018 [82] and by FIGO (based on a Delphi consensus by Gordijn, reached in 2016) for FGR in 2021 [83,84]. The aim was to assess whether disordered angiogenesis markers and their ratios differed between the study groups and the control group, and among study subgroups (isolated PE, isolated FGR, and PE with simultaneous FGR) at the moment of indicated prompt delivery due to maternal or fetal aggravation.
The PE was defined according to the criteria applied in 2018 by the International Society for the Study of Hypertension in Pregnancy (ISSHP) [82] Group: the new onset of hypertension (BP ≥ 140 mm Hg systolic or ≥90 mm Hg diastolic) on two or more consecutive occasions accompanied by new-onset proteinuria (>0.3 g/24-h in 24-h urine collection) or, in the absence of proteinuria, another maternal organ or uteroplacental dysfunction. The detailed signs and symptoms required for PE diagnosis by ISSHP are listed in Table 9. All the PE patients in our study met the diagnostic criteria independently of developing uteroplacental dysfunction manifested by growth restriction, i.e., apart from gestational hypertension they presented signs of maternal organ dysfunction or proteinuria, despite the concurrent FGR in the PE plus FGR group. We included only preeclampsia patients diagnosed after 20 weeks of gestation and excluded patients with multiple gestations, chronic hypertension, nephrotic syndrome diagnosed postpartum, diabetes, other metabolic disorders, or autoimmune disease. The absence of fetal structural or chromosome abnormalities was also required.
Fetal growth restriction was diagnosed according to the Delphi consensus-based definition for placenta-mediated FGR published by Gordijn et al. in 2016 [83], recognized recently in 2021 by the FIGO initiative on fetal growth, which uses a combination of measures of fetal size percentile and Doppler abnormalities for early and late FGR. Data presented in Table 12. According to the consensus definition of FGR, we defined FGR as an estimated fetal weight (EFW) < 3rd percentile or EFW < 10th percentile in combination with at least one of the following Doppler abnormalities: umbilical artery (UA) pulsatility index(PI) > 95th percentile, middle cerebral artery (MCA) PI < 5th percentile, cerebroplacental ratio (CPR) < 5th percentile and/or a mean uterine artery (mUtA) PI > 95th percentile. The cases with a birth weight exceeding the 10th percentile for gestational age, and those with placental or umbilical cord abnormalities, anatomical malformations or suspicion of any genetic defect were excluded from the FGR group.
The healthy normal pregnancies were recruited in our outpatient department to gestationally match the pathologic cases. Inclusion criteria were noncomplicated singleton pregnancy with absence of labor at the time of venipuncture. The patients were verified postdelivery, and the control group included only women with delivery of a term (>37 weeks) infant whose birth weight was between the 10th and 90th percentile for gestational age and no medical, obstetrical nor surgical complications during the entire gestation.
Additionally, in giving this work clinical relevance, the sFlt-1 to PlGF ratio at delivery was then classified according to current recommendations for its practical use in risk stratification in suspected or diagnosed PE. These preestablished cutoffs of ratio values were: 38, 85, 110, 201 and 655 and their recommended interpretation and clinical application in PE diagnosis and prognosis are shown in Table 11. The values of the sFlt-1 to PlGF ratio in each cohort were then allocated to low, intermediate, high or very high-risk groups according to up-to-date expert opinion on the practical use of angiogenic markers.
Finally, there was a comparison between angiogenic biomarker concentrations and the adverse and non-adverse pregnancy outcome groups. The maternal and fetal adverse outcomes were based on the CHIPS (Control of Hypertension in Pregnancy Study), PIERS (Preeclampsia Integrated Estimate of RiSk) and PREP studies, where components of the outcome were derived through an iterative Delphi consensus process [85,86,87]. An independent panel of experts ranked the outcomes for their importance to clinical practice [88]. Data presented in Table 13.
The table is based on work of: Herraiz I, Llurba E, Verlohren S, Galindo A. Spanish Group for the study of angiogenic markers in preeclampsia. The update on the diagnosis and prognosis of preeclampsia with the aid of the sFlt-1/PlGF ratio in singleton pregnancies. FetalDiagnTher 2018;43:81–89 [56] and Stepan H, Herraiz I, Schlembach D, Verlohren S, Brennecke S, Chantraine F, Klein E, Lapaire O, Llurba E, Ramoni A, Vatish M, Wertaschnigg D, Galindo A: Implementation of the sFlt-1/PlGF ratio for prediction and diagnosis of preeclampsia in singleton pregnancy: implications for clinical practice. Ultrasound Obstet Gynecol 2015;45:241–246 [55].

4.2. Methods

The patients who had been referred to the tertiary-level academic unit for further treatment because of preeclampsia and/or fetal growth restriction without any signs of labor were offered participation in this study.
In all pathologic pregnancies, samples were collected at the moment of clinical detrioration and indication for prompt delivery due to maternal or fetal clinical decompensation, when the differences in terms of angiogenic imbalance were expected to be maximized. As a result, all the samples were collected within the last 48 h of pregnancy duration. The angiogenic substance levels were not known at this point, and they were not included as part of patient management.
The serum samples were collected according to a common standard operating procedure at our center. Further, the venous blood was drawn by venipuncture in tubes without anticoagulant directly from the patient. In the case of immediate cesarean section, blood was collected for routine blood tests and the remaining serum samples were obtained from the hospital laboratory. Once collected, the blood samples were centrifuged at 2000× g, and the serum was separated, aliquoted and stored at −80 °C for later analysis. The levels of PlGF, sEng and sFlt-1 in maternal serum were measured by the corresponding sandwich enzyme immunoassay technique kits (R&D Systems Europe Ltd., Abingdon, UK) according to the manufacturer’s instructions. The sEng, sFlt-1 and PIGF concentrations of each sample were determined in parallel.
The fetal measurements and Doppler studies were performed at the Clinical Department of Obstetrics and Perinatology using curvilinear transabdominal probe and a Voluson E10 device (GE Medical Systems). The ultrasound was carried out by senior obstetricians upon routine conditions and guidelines. Biometry was performed by measuring the abdominal circumference (AC), biparietal diameter (BPD), head circumference (HC) and femur length (FL). The fetal weight and the weight percentile were calculated using the Hadlock curves [53]. The following Doppler parameters were measured: PI of the uterine arteries (UtA), PI of the umbilical artery (UA), PI of the middle cerebral artery (MCA), PI and the cerebroplacental ratio (CPR) as the ratio between MCA PI and UA PI and calculations were performed according to up-to-date reference ranges [89,90].
The clinical data were ascertained prospectively and included age, height, weight, verified gestational age, past medical and obstetrical history, as well as clinical information including blood pressure, medication, and laboratory test values.
All data were entered into a database in a real time.
Early perinatal outcomes including birthweight and Apgar score were recorded. A total of 77 pregnant women out of initially involved 88 fulfilled the criteria for their inclusion in the study.
The study protocol was approved by the Medical University of Lublin Ethics Committee (KE-0254/258/2016). Written consent was obtained from all participants in the study.

4.3. Statistical Analysis

The statistical comparisons between healthy control participants and the entire study group as well as comparisons between study subgroups: PE + FGR, iPE, iFGR were performed using Statistica 13.1 by StatSoft. The analysis was conducted with Kruskal-Wallis test with Bonferroni’s adjustment and analysis of variance ANOVA with post hoc RIR Tukey test when possible. Box plots were generated to represent the values of analytes and their ratios in different subgroups. The previously described gestational phase-specific cutoff values of the sFlt-1/PlGF ratio for PE diagnosis and short-term outcome prediction were applied for different outcome groups [55,56]. The criterion for statistical significance was p < 0.05.

5. Conclusions

A strong subsequent antiangiogenic activity may be interpreted as a response to hypoxia, and high levels of soluble Flt-1 and soluble endoglin may be markers of this activity. In addition, a positive correlation between sFlt-1 and sEng suggests that antiangiogenic pattern in VEGFs and TGF-beta pathways provides a coordinated reaction to fetoplacental hypoxia.
The fact that PlGF, sFlt-1 and sEng concentrations at delivery as well as their ratios overlap in different manifestations of placental ischemia—FGR and PE, and in their early and late forms constitute proof that mechanisms behind their development finally lead to similar placental responses and cannot be separated. Further, multiple factors must interact and this additive mechanism needs time to give manifestation sooner or later. The complex interactions described above highlight, that molecules such as PlGF, sFlt-1 and sEng cannot be considered in isolation but in combination with different substances that reflect maternal systemic vasculature function. The potential application of biomarkers of angiogenesis in both FGR and PE to detect or predict patients at risk of adverse outcomes would be of value to improve risk stratification strategies to avoid serious complications of ischemic placental disease.
Additionally, from a practical point of view, the fact that at the end of pathological pregnancy complicated by FGR and PE, disturbances in angiogenic profile in maternal blood reach similar levels, points to their possible use in FGR as they ultimately start to be applicable in PE management.
Finally, this work supports the hypothesis that the determination of the sFlt-1/PlGF ratio in patients with FGR might also have value for counseling, clinical supervision, and risk anticipation as it has just started to be applied in PE management. This necessitates further research and a better integration of biomarkers in the diagnostic work-up.

6. Strengths and Limitations

The cohort was constructed with a very precise, up-to-date criteria for PE and FGR. The FGR diagnosis was confirmed for each newborn after delivery and patients not meeting the criteria were excluded. In an attempt to decrease the likelihood of false-positive and false-negative diagnosis of FGR, the consensus definition was based on a combination of measures of fetal size (fetal weight estimation and abdominal circumference) and abnormal Doppler findings in the umbilical, uterine, and middle cerebral arteries, as described in Table 10. In our study blood samples were collected directly before the delivery, which was performed within the next 48 h from the moment of venipuncture, due to maternal or fetal clinical decompensation, when the differences in terms of angiogenic imbalance are maximized, while many studies concentrate on prediction or moment of diagnosis in suspected PE cases, when changes in angiogenic profile are less pronounced in late- onset disease. It was only found in one work that was focused on angiogenic factor levels within one week prior to delivery in similar cohorts—iPE, iFGR and those entities combined together by Nanjo et al. The results regarding concentrations of PlGF, sFlt-1 and sEng in investigated subgroups were exactly the same as those presented by Japanese authors. This study has certain limitations. It was done in a single center and it is of relatively small size. This is why we did not separate early-onset from late-onset patients in study cohorts for deeper analysis. Although there was an interested in all preeclampsia-related adverse outcomes, rare but meaningful adverse outcomes such as pulmonary edema, DIC or maternal death, were not observed in the patients.

Author Contributions

Conceptualization, W.D.-K. and M.L.; methodology, W.D.-K. and M.L.; software, W.D.-K.; validation, W.D.-K. and M.L.; formal analysis, W.D.-K. and A.H.; investigation, W.D.-K.; resources, W.D.-K.; data curation, W.D.-K. and M.L.; writing—original draft preparation, W.D.-K.; writing—review and editing, M.L.; visualization, W.D.-K.; supervision, M.L., E.G., A.B., and B.L.-G.; project administration, W.D.-K. and M.L.; funding acquisition, M.L. All authors have read and agreed to the published version of the manuscript.

Funding

This research was supported by research Grant No. DS334/2019-21 and DS640 of the Medical University of Lublin.

Institutional Review Board Statement

The study was conducted in accordance with the Declaration of Helsinki, and approved by the Medical University of Lublin Ethics Committee (protocol code KE-0254/51/2010) for studies involving humans. Written consent was obtained from all participants in the study.

Informed Consent Statement

Informed consent for peripheral blood sampling was obtained from all subjects involved in the study.

Data Availability Statement

Data available on request due to restrictions e.g., privacy or ethical. The data presented in this study are available on request from the corresponding author.

Conflicts of Interest

The authors declare no conflict of interest. The funders had no role in the design of the study; in the collection, analyses, or interpretation of data; in the writing of the manuscript; or in the decision to publish the results.

References

  1. Abalos, E.; Cuesta, C.; Grosso, A.L.; Chou, D.; Say, L. Global and regional estimates of preeclampsia and eclampsia: A systematic review. Eur. J. Obstet. Gynecol. Reprod. Biol. 2013, 170, 1–7. [Google Scholar] [CrossRef]
  2. Lawn, J.E.; Blencowe, H.; Pattinson, R.; Cousens, S.; Kumar, R.; Ibiebele, I.; Gardosi, J.; Day, L.T.; Stanton, C. Stillbirths: Where? When? Why? How to make the data count? Lancet 2011, 377, 1448–1463. [Google Scholar] [CrossRef] [Green Version]
  3. Crovetto, F.; Crispi, F.; Scazzocchio, E.; Mercade, I.; Meler, E.; Figueras, F.; Gratacos, E. First-trimester screening for early and late small-for-gestational-age neonates using maternal serum biochemistry, blood pressure and uterine artery Doppler. Ultrasound Obstet. Gynecol. 2013, 43, 34–40. [Google Scholar] [CrossRef] [Green Version]
  4. Lees, C.C.; Marlow, N.; van Wassenaer-Leemhuis, A.; Arabin, B.; Bilardo, C.M.; Brezinka, C.; Calvert, S.; Derks, J.B.; Diemert, A.; Duvekot, J.J.; et al. 2 year neurodevelopmental and intermediate perinatal outcomes in infants with very preterm fetal growth restriction (TRUFFLE): A randomised trial. Lancet 2015, 385, 2162–2172. [Google Scholar] [CrossRef]
  5. Shear, R.M.; Rinfret, D.; Leduc, L. Should we offer expectant management in cases of severe preterm preeclampsia with fetal growth restriction? Am. J. Obstet. Gynecol. 2005, 192, 1119–1125. [Google Scholar] [CrossRef]
  6. Weiler, J.; Tong, S.; Palmer, K.R. Is Fetal Growth Restriction Associated with a More Severe Maternal Phenotype in the Setting of Early Onset Pre-Eclampsia? A Retrospective Study. PLoS ONE 2011, 6, e26937. [Google Scholar] [CrossRef] [Green Version]
  7. Churchill, D.; Perry, I.J.; Beevers, D. Ambulatory blood pressure in pregnancy and fetal growth. Lancet 1997, 349, 7–10. [Google Scholar] [CrossRef]
  8. McCowan, L.M.; North, R.A.; Harding, J.E. Abnormal uterine artery Doppler in small-for-gestational-age pregnancies is asso-ciated with later hypertension. Aust. N. Z. J. Obstet. Gynaecol. 2001, 41, 56–60. [Google Scholar] [CrossRef]
  9. Mitani, M.; Matsuda, Y.; Makino, Y.; Akizawa, Y.; Ohta, H. Clinical features of fetal growth restriction complicated later by preeclampsia. J. Obstet. Gynaecol. Res. 2009, 35, 882–887. [Google Scholar] [CrossRef]
  10. Figueras, F.; Gratacos, E. An integrated approach to fetal growth restriction. Best Pract. Res. Clin. Obstet. Gynaecol. 2017, 38, 48–58. [Google Scholar] [CrossRef]
  11. Kwiatkowski, S.; Dołęgowska, B.; Kwiatkowska, E.; Rzepka, R.; Torbè, A.; Bednarek-Jędrzejek, M. A Common Profile of Dis-ordered Angiogenic Factor Production and the Exacerbation of Inflammation in Early Preeclampsia, Late Preeclampsia, and Intrauterine Growth Restriction. PLoS ONE 2016, 11, e0165060. [Google Scholar] [CrossRef]
  12. Chaiworapongsa, T.; Romero, R.; Whitten, A.E.; Korzeniewski, S.J.; Chaemsaithong, P.; Hernandez-Andrade, E.; Yeo, L.; Hassan, S.S. The use of angiogenic biomarkers in maternal blood to identify which SGA fetuses will require a preterm delivery and mothers who will develop pre-eclampsia. J. Matern. Neonatal Med. 2015, 29, 1214–1228. [Google Scholar] [CrossRef] [Green Version]
  13. Triunfo, S.; Parra-Saavedra, M.; Rodriguez-Sureda, V.; Crovetto, F.; Dominguez, C.; Gratacós, E.; Figueras, F. Angiogenic Factors and Doppler Evaluation in Normally Growing Fetuses at Routine Third-Trimester Scan: Prediction of Subsequent Low Birth Weight. Fetal Diagn. Ther. 2015, 40, 13–20. [Google Scholar] [CrossRef]
  14. Herraiz, I.; Droge, L.; Gomez-Montes, E.; Henrich, W.; Galindo, A.; Verlohren, S. Characterization of the soluble fms-like Tyro-sine Kinase-1 to Placental Growth Factor Ratio in Pregnancies Compliated by Fetal Growth Restriction. Obstet. Gynecol. 2014, 124, 265–273. [Google Scholar] [CrossRef]
  15. Ananth, C.V. Ischemic placental disease: A unifying concept for preeclampsia, intrauterine growth restriction, and placental abruption. Semin. Perinatol. 2014, 38, 131–132. [Google Scholar] [CrossRef]
  16. Kwiatkowski, S.; Kwiatkowska, E.; Rzepka, R.; Torbe, A.; Dołęgowska, B. Ischemic placental syndrome-Prediction and new disease monitoring. J. Matern. Fetal Neonatal. Med. 2016, 29, 2033–2039. [Google Scholar] [CrossRef]
  17. Romero, R.; Nien, J.K.; Espinoza, J.; Todem, D.; Fu, W.; Chung, H.; Kusanovic, J.P.; Gotsch, F.; Erez, O.; Mazaki-Tovi, S.; et al. A longitudinal study of angiogenic (placental growth factor) and anti-angiogenic (soluble endoglin and soluble vascular endothelial growth factor receptor-1) factors in normal pregnancy and patients destined to develop preeclampsia and deliver a small for gestational age neonate. J. Matern. Neonatal Med. 2008, 21, 9–23. [Google Scholar] [CrossRef]
  18. Erez, O.; Romero, R.; Espinoza, J.; Fu, W.; Todem, D.; Kusanovic, J.P.; Gotsch, F.; Edwin, S.; Nien, J.K.; Chaiworapongsa, T.; et al. The change in concentrations of angiogenic and anti-angiogenic factors in maternal plasma between the first and second trimesters in risk assessment for the subsequent development of preeclampsia and small-for-gestational age. J. Matern. Neonatal Med. 2008, 21, 279–287. [Google Scholar] [CrossRef]
  19. Torry, D.S.; Wang, H.-S.; Wang, T.-H.; Caudle, M.R.; Torry, R.J. Preeclampsia is associated with reduced serum levels of placenta growth factor. Am. J. Obstet. Gynecol. 1998, 179, 1539–1544. [Google Scholar] [CrossRef]
  20. Reuvekamp, A.; Velsing-Aarts, F.V.; Poulina, I.E.; Capello, J.J.; Duits, A.J. Selectivedeficit of angiogenic growth factors char-acterises pregnancies complicated by pre-eclampsia. Br. J. Obstet Gynaecol. 1999, 106, 1019–1022. [Google Scholar] [CrossRef]
  21. Tidwell, S.; Ho, H.-N.; Chiu, W.-H.; Torry, R.J.; Torry, D.S. Low maternal serum levels of placenta growth factor as an antecedent of clinical preeclampsia. Am. J. Obstet. Gynecol. 2001, 184, 1267–1272. [Google Scholar] [CrossRef] [Green Version]
  22. Taylor, R.N.; Grimwood, J.; Taylor, R.S.; McMaster, M.T.; Fisher, S.J.; North, R.A. Longitudinal serum concentrations of pla-cental growth factor: Evidence for abnormal placental angiogenesis in pathologic pregnancies. Am. J. Obstet. Gynecol. 2003, 188, 177–182. [Google Scholar] [CrossRef]
  23. Levine, R.J.; Maynard, S.E.; Qian, C.; Lim, K.-H.; England, L.J.; Yu, K.F.; Schisterman, E.F.; Thadhani, R.; Sachs, B.P.; Epstein, F.H.; et al. Circulating Angiogenic Factors and the Risk of Preeclampsia. N. Engl. J. Med. 2004, 350, 672–683. [Google Scholar] [CrossRef] [Green Version]
  24. Chaiworapongsa, T.; Romero, R.; Kim, Y.M.; Kim, G.J.; Kim, M.R.; Espinoza, J.; Bujold, E.; Goncalves, L.; Gómez, R.; Edwin, S.; et al. Plasma soluble vascular endothelial growth factor receptor-1 concentration is elevated prior to the clinical diagnosis of pre-eclampsia. J. Matern. Neonatal Med. 2005, 17, 3–18. [Google Scholar] [CrossRef]
  25. Park, C.-W.; Park, J.S.; Shim, S.-S.; Jun, J.K.; Yoon, B.H.; Romero, R. An elevated maternal plasma, but not amniotic fluid, soluble fms-like tyrosine kinase-1 (sFlt-1) at the time of mid-trimester genetic amniocentesis is a risk factor for preeclampsia. Am. J. Obstet. Gynecol. 2005, 193, 984–989. [Google Scholar] [CrossRef]
  26. Levine, R.J.; Lam, C.; Qian, C.; Yu, K.F.; Maynard, S.E.; Sachs, B.P.; Sibai, B.M.; Epstein, F.H.; Romero, R.; Thadhani, R.; et al. Soluble Endoglin and Other Circulating Antiangiogenic Factors in Preeclampsia. N. Engl. J. Med. 2006, 355, 992–1005. [Google Scholar] [CrossRef]
  27. Unal, E.R.; Robinson, C.J.; Johnson, D.D.; Chang, E.Y. Second-trimester angiogenic factors as biomarkers for future-onset preeclampsia. Am. J. Obstet. Gynecol. 2007, 197, 211.e1–211.e4. [Google Scholar] [CrossRef]
  28. Kusanovic, J.P.; Romero, R.; Chaiworapongsa, T.; Erez, O.; Mittal, P.; Vaisbuch, E.; Mazaki-Tovi, S.; Gotsch, F.; Edwin, S.S.; Gomez, R.; et al. A prospective cohort study of the value of maternal plasma concentrations of angiogenic and anti-angiogenic factors in early pregnancy and midtrimester in the identification of patients destined to develop preeclampsia. J. Matern. Neonatal Med. 2009, 22, 1021–1038. [Google Scholar] [CrossRef]
  29. Chaiworapongsa, T.; Romero, R.; Tarca, A.L.; Kusanovic, J.P.; Gotsch, F.; Mittal, P.; Kim, S.K.; Vaisbuch, E.; Mazaki-Tovi, S.; Erez, O.; et al. A decrease in maternal plasma concentrations of sVEGFR-2 precedes the clinical diagnosis of preeclampsia. Am. J. Obstet. Gynecol. 2010, 202, 550.e1–550.e10. [Google Scholar] [CrossRef] [Green Version]
  30. Verlohren, S.; Stepan, H.; Dechend, R. Angiogenic growth factors in the diagnosis and prediction of pre-eclampsia. Clin. Sci. 2011, 122, 43–52. [Google Scholar] [CrossRef]
  31. Maynard, S.E.; Min, J.-Y.; Merchan, J.; Lim, K.-H.; Li, J.; Mondal, S.; Libermann, T.A.; Morgan, J.P.; Sellke, F.W.; Stillman, I.E.; et al. Excess placental soluble fms-like tyrosine kinase 1 (sFlt1) may contribute to endothelial dysfunction, hypertension, and proteinuria in preeclampsia. J. Clin. Investig. 2003, 111, 649–658. [Google Scholar] [CrossRef] [PubMed] [Green Version]
  32. Tsatsaris, V.; Goffin, F.; Munaut, C.; Brichant, J.-F.; Pignon, M.-R.; Noel, A.; Schaaps, J.-P.; Cabrol, D.; Frankenne, F.; Foidart, J.-M. Overexpression of the Soluble Vascular Endothelial Growth Factor Receptor in Preeclamptic Patients: Pathophysiological Consequences. J. Clin. Endocrinol. Metab. 2003, 88, 5555–5563. [Google Scholar] [CrossRef] [PubMed] [Green Version]
  33. Luttun, A.; Carmeliet, P. Soluble VEGF receptor Flt1: The elusive preeclampsia factor discovered? J. Clin. Investig. 2003, 111, 600–602. [Google Scholar] [CrossRef]
  34. Koga, K.; Osuga, Y.; Yoshino, O.; Hirota, Y.; Ruimeng, X.; Hirata, T.; Takeda, S.; Yano, T.; Tsutsumi, O.; Taketani, Y. Elevated Serum Soluble Vascular Endothelial Growth Factor Receptor 1 (sVEGFR-1) Levels in Women with Preeclampsia. J. Clin. Endocrinol. Metab. 2003, 88, 2348–2351. [Google Scholar] [CrossRef] [Green Version]
  35. Chaiworapongsa, T.; Romero, R.; Espinoza, J.; Bujold, E.; Kim, Y.M.; Gonçalves, L.F.; Gomez, R.; Edwin, S. Evidence supporting a role for blockade of the vascular endothelial growth factor system in the pathophysiology of preeclampsia: Young Investigator Award. Am. J. Obstet. Gynecol. 2004, 190, 1541–1547. [Google Scholar] [CrossRef]
  36. Bujold, E.; Romero, R.; Chaiworapongsa, T.; Kim, Y.M.; Kim, G.J.; Kim, M.R.; Espinoza, J.; Gonçalves, L.F.; Edwin, S.; Mazor, M. Evidence supporting that the excess of the sVEGFR-1 concentration in maternal plasma in preeclampsia has a uterine origin. J. Matern. Neonatal Med. 2005, 18, 9–16. [Google Scholar] [CrossRef]
  37. Venkatesha, S.; Toporsian, M.; Lam, C.; Hanai, J.-I.; Mammoto, T.; Kim, Y.M.; Bdolah, Y.; Lim, K.-H.; Yuan, H.-T.; Libermann, T.A.; et al. Soluble endoglin contributes to the pathogenesis of preeclampsia. Nat. Med. 2006, 12, 642–649. [Google Scholar] [CrossRef]
  38. Boutsikou, T.; Malamitsi-Puchner, A.; Economou, E.; Boutsikou, M.; Puchner, K.-P.; Hassiakos, D. Soluble vascular endothelial growth factor receptor-1 in intrauterine growth restricted fetuses and neonates. Early Hum. Dev. 2006, 82, 235–239. [Google Scholar] [CrossRef] [PubMed]
  39. Crispi, F.; Domínguez, C.; Llurba, E.; Martín-Gallán, P.; Cabero, L.; Gratacos, E. Placental angiogenic growth factors and uterine artery Doppler findings for characterization of different subsets in preeclampsia and in isolated intrauterine growth restriction. Am. J. Obstet. Gynecol. 2006, 195, 201–207. [Google Scholar] [CrossRef]
  40. Savvidou, M.D.; Yu, C.K.; Harland, L.C.; Hingorani, A.D.; Nicolaides, K.H. Maternal serum concentration of soluble fms-like tyrosine kinase 1 and vascular endothelial growth factor in women with abnormal uterine artery Doppler and in those with fetal growth restriction. Am. J. Obstet. Gynecol. 2006, 195, 1668–1673. [Google Scholar] [CrossRef]
  41. Schlembach, D.; Wallner, W.; Sengenberger, R.; Stiegler, E.; Mörtl, M.; Beckmann, M.W.; Lang, U. Angiogenic growth factor levels in maternal and fetal blood: Correlation with Doppler ultrasound parameters in pregnancies complicated by pre-eclampsia and intrauterine growth restriction. Ultrasound Obstet. Gynecol. 2007, 29, 407–413. [Google Scholar] [CrossRef]
  42. Wallner, W.; Sengenberger, R.; Strick, R.; Strissel, P.L.; Meurer, B.; Beckmann, M.W.; Schlembach, D. Angiogenic growth factors in maternal and fetal serum in pregnancies complicated by intrauterine growth restriction. Clin. Sci. 2006, 112, 51–57. [Google Scholar] [CrossRef] [Green Version]
  43. Chaiworapongsa, T.; Espinoza, J.; Gotsch, F.; Kim, Y.M.; Kim, G.J.; Goncalves, L.F.; Edwin, S.; Kusanovic, J.P.; Erez, O.; Than, N.G.; et al. The maternal plasma soluble vascular endothelial growth factor receptor-1 concentration is elevated in SGA and the magnitude of the increase relates to Doppler abnormalities in the maternal and fetal circulation. J. Matern. Neonatal Med. 2008, 21, 25–40. [Google Scholar] [CrossRef] [PubMed]
  44. Chaiworapongsa, T.; Romero, R.; Gotsch, F.; Espinoza, J.; Nien, J.K.; Goncalves, L.; Edwin, S.; Kim, Y.M.; Erez, O.; Kusanovic, J.P.; et al. Low maternal concentrations of soluble vascular endothelial growth factor receptor-2 in preeclampsia and small for gestational age. J. Matern. Neonatal Med. 2008, 21, 41–52. [Google Scholar] [CrossRef] [Green Version]
  45. Åsvold, B.O.; Vatten, L.J.; Romundstad, P.R.; Jenum, P.A.; Karumanchi, S.A.; Eskild, A. Angiogenic Factors in Maternal Circulation and the Risk of Severe Fetal Growth Restriction. Am. J. Epidemiol. 2011, 173, 630–639. [Google Scholar] [CrossRef]
  46. Sibiude, J.; Guibourdenche, J.; Dionne, M.-D.; Le Ray, C.; Anselem, O.; Serreau, R.; Goffinet, F.; Tsatsaris, V. Placental Growth Factor for the Prediction of Adverse Outcomes in Patients with Suspected Preeclampsia or Intrauterine Growth Restriction. PLoS ONE 2012, 7, e50208. [Google Scholar] [CrossRef] [Green Version]
  47. Magee, L.A.; von Dadelszen, O.; Rey, E. and the CHIPS Study Group. Less-tight versus tight control of hypertension in preg-nancy. N. Eng. J. Med. 2015, 372, 407–417. [Google Scholar] [CrossRef] [Green Version]
  48. Spencer, R.N.; Carr, D.J.; David, A.L. Treatment of poor placentation and the prevention of associated adverse outcomes—What does the future hold? Prenat Diagn. 2014, 34, 677–684. [Google Scholar] [CrossRef] [Green Version]
  49. Marlow, N.; Wolke, D.; Bracewell, M.A.; Samara, M. Neurologic and developmental disability at six years of age after ex-tremely preterm birth. N. Engl. J. Med. 2005, 352, 9–19. [Google Scholar] [CrossRef]
  50. Brodszki, J.; Morsing, E.; Malcus, P.; Thuring, A.; Ley, D.; Maršál, K. Early intervention in management of very preterm growth-restricted fetuses: 2-year outcome of infants delivered on fetal indication before 30 gestational weeks. Ultrasound Obstet. Gynecol. 2009, 34, 288–296. [Google Scholar] [CrossRef]
  51. Morsing, E.; Åsard, M.; Ley, D.; Stjernqvist, K.; Maršál, K. Cognitive Function After Intrauterine Growth Restriction and Very Preterm Birth. Pediatrics 2011, 127, e874–e882. [Google Scholar] [CrossRef] [PubMed]
  52. Brosens, I.; Pijnenborg, R.; Vercruysse, L.; Romero, R. The “Great Obstetrical Syndromes” are associated with disorders of deep placentation. Am. J. Obstet. Gynecol. 2011, 204, 193–201. [Google Scholar] [CrossRef] [Green Version]
  53. Hadlock, F.P.; Harrist, R.B.; Martinez-Poyer, J. In utero analysis of fetal growth: A sonographic weight standard. Radiology 1991, 181, 129–133. [Google Scholar] [CrossRef] [PubMed]
  54. Nicolaides, K.; Wright, D.; Syngelaki, A.; Wright, A.; Akolekar, R. Fetal Medicine Foundation fetal and neonatal population weight charts. Ultrasound Obstet. Gynecol. 2018, 52, 44–51. [Google Scholar] [CrossRef] [PubMed] [Green Version]
  55. Stepan, H.; Herraiz, I.; Schlembach, D.; Verlohren, S.; Brennecke, S.; Chantraine, F.; Klein, E.; Lapaire, O.; Llurba, E.; Ramoni, A.; et al. Implementation of the sFlt-1/PlGF ratio for prediction and diagnosis of pre-eclampsia in singleton pregnancy: Implications for clinical practice. Ultrasound Obstet. Gynecol. 2015, 45, 241–246. [Google Scholar] [CrossRef] [PubMed]
  56. Herraiz, I.; Llurba, E.; Verlohren, S.; Galindo, A.; on behalf of the Spanish Group for the Study of Angiogenic Markers in Preeclampsia. Update on the Diagnosis and Prognosis of Preeclampsia with the Aid of the sFlt-1/PlGF Ratio in Singleton Pregnancies. Fetal Diagn. Ther. 2017, 43, 81–89. [Google Scholar] [CrossRef] [Green Version]
  57. Nanjo, S.; Minami, S.; Mizoguchi, M.; Yamamoto, M.; Yahata, T.; Toujima, S.; Shiro, M.; Kobayashi, A.; Muragaki, Y.; Ino, K. Levels of serum-circulating angiogenic factors within 1 week prior to delivery are closely related to conditions of pregnant women with pre-eclampsia, gestational hypertension, and/or fetal growth restriction. J. Obstet. Gynaecol. Res. 2017, 43, 1805–1814. [Google Scholar] [CrossRef]
  58. Shibata, E.; Rajakumar, A.; Powers, R.W.; Larkin, R.W.; Gilmour, C.; Bodnar, L.M.; Crombleholme, W.R.; Ness, R.B.; Roberts, J.M.; Hubel, C.A. Soluble fms-Like Tyrosine Kinase 1 Is Increased in Preeclampsia But Not in Normotensive Pregnancies with Small-for-Gestational-Age Neonates: Relationship to Circulating Placental Growth Factor. J. Clin. Endocrinol. Metab. 2005, 90, 4895–4903. [Google Scholar] [CrossRef]
  59. Alahakoon, T.I.; Zhang, W.; Trudinger, B.J.; Lee, V.W. Discordant clinical presentations of preeclampsia and intrauterine fetal growth restriction with similar pro- and anti-angiogenic profiles. J. Matern. Neonatal Med. 2014, 27, 1854–1859. [Google Scholar] [CrossRef]
  60. Stepan, H.; Krämer, T.; Faber, R. Maternal Plasma Concentrations of Soluble Endoglin in Pregnancies with Intrauterine Growth Restriction. J. Clin. Endocrinol. Metab. 2007, 92, 2831–2834. [Google Scholar] [CrossRef]
  61. Stepan, H.; Jank, A. Angiogenic factors and their role in pathogenesis and prediction of preeclampsia. Z. Geburtshilfe Neonatol. 2009, 213, 101–105. [Google Scholar] [CrossRef] [PubMed]
  62. Laskowska, M.; Laskowska, K.; Oleszczuk, J. Endoglin in pregnancy complicated by fetal IUGR in normotensive and preeclamptic pregnant women: A comparison between preeclamptic patients with appropriate-for-gestational-age weight in-fants and healthy pregnant women. J. Matern. Fetal Neonatal. Med. 2012, 25, 806–811. [Google Scholar] [CrossRef] [PubMed]
  63. Perry, H.; Khalil, A.; Thilaganathan, B. Preeclampsia and the cardiovascular system: An update. Trends Cardiovasc. Med. 2018, 28, 505–513. [Google Scholar] [CrossRef] [PubMed]
  64. Thilaganathan, B. Pre-eclampsia and the cardiovascular-placental axis. Ultrasound Obstet. Gynecol. 2018, 51, 714–717. [Google Scholar] [CrossRef] [PubMed] [Green Version]
  65. Craici, I.; Wagner, S.; Garovic, V.D. Review: Preeclampsia and future cardiovascular risk: Formal risk factor or failed stress test? Ther. Adv. Cardiovasc. Dis. 2008, 2, 249–259. [Google Scholar] [CrossRef] [PubMed] [Green Version]
  66. Duckitt, K.; Harrington, D. Risk factors for pre-eclampsia at antenatal booking: Systematic review of controlled studies. BMJ 2005, 330, 565. [Google Scholar] [CrossRef] [Green Version]
  67. Roberts, J.M.; Catov, J.M. Preeclampsia more than 1 disease: Or is it? Hypertension 2008, 51, 989–990. [Google Scholar] [CrossRef] [Green Version]
  68. Friedman, A.M.; Cleary, K.L. Prediction and prevention of ischemic placental disease. Semin. Perinatol. 2014, 38, 177–182. [Google Scholar] [CrossRef]
  69. Figueras, F.; Gratacos, E. Stage-based approach to the management of fetal growth restriction. Prenat. Diagn. 2014, 34, 655–659. [Google Scholar] [CrossRef]
  70. Triunfo, S.; Lonmaier, S.; Parra-Saavedra, M.; Crovetto, F.; Nadal, A.; Gratscos, E.; Figureas, F. Angiogenic factors at late-onset small for gestational age and histological placental under perfusion. Placenta 2014, 35, 398e40. [Google Scholar] [CrossRef]
  71. Gaccioli, F.; Sovio, U.; Cook, E. Screening for fetal growth restriction using ultrasound and the sFLT1/PlGF ratio in nulliparous women: A prospective cohort study. Lancet Child Adolesc. Health 2018, 2, 569–581. [Google Scholar] [CrossRef] [PubMed]
  72. Quezada, M.S.; Rodríguez-Calvo, J.; Villalaín, C. sFlt-1/PlGF ratio and timing of delivery in early-onset fetal growth restriction with antegrade umbilical artery flow. Ultrasound Obstet. Gynecol. 2020, 56, 549–556. [Google Scholar] [CrossRef]
  73. Mendoza, M.; Hurtado, I.; Bonacina, E.; Garcia-Manau, P.; Serrano, B.; Tur, H.; Rodo, C.; Maiz, N.; Carreras, E. Individual risk assessment for prenatal counseling in early-onset growth-restricted and small-for-gestational-age fetuses. Acta Obstet. et Gynecol. Scand. 2020, 100, 504–512. [Google Scholar] [CrossRef] [PubMed]
  74. Di Martino, D.; Cetin, I.; Frusca, T.; Ferrazzi, E.; Fuse, F.; Gervasi, M.T.; Plerbani, M.; Todros, T. Italian advisory board: sFlt-1/ PlGF ratio and preeclampsia, state of the art and developments in diagnostic, therapeutic and clinical management. Eur. J. Obstet. Gynecol. Reprod. Biol. 2016, 206, 70–73. [Google Scholar] [CrossRef] [PubMed] [Green Version]
  75. Verlohren, S.; Galindo, A.; Schlembach, D.; Zeisler, H.; Herraiz, I.; Moertl, M.G.; Pape, J.; Dudenhausen, J.W.; Denk, B.; Stepan, H. An automated method for the determination of the sFlt-1/PIGF ratio in the assessment of preeclampsia. Am. J. Obstet. Gynecol. 2010, 202, 161. [Google Scholar] [CrossRef]
  76. Brownbill, P.; McKeeman, G.C.; Brockelsby, J.C.; Crocker, I.P.; Sibley, C.P. Vasoactive and Permeability Effects of Vascular Endothelial Growth Factor-165 in the Term in Vitro Dually Perfused Human Placental Lobule. Endocrinology 2007, 148, 4734–4744. [Google Scholar] [CrossRef] [Green Version]
  77. Jones, C.J.P.; Fox, H. Ultrastructure of the placenta in prolonged pregnancy. J. Pathol. 1978, 126, 173–179. [Google Scholar] [CrossRef]
  78. Caughey, A.B.; Stotland, N.E.; Escobar, G.J. What is the best measure of maternal complications of term pregnancy: Ongoing pregnancies or pregnancies delivered? Am. J. Obstet. Gynecol. 2003, 189, 1047e52. [Google Scholar] [CrossRef]
  79. Verlohren, S.; Herraiz, I.; Lapaire, O.; Schlembach, D.; Moertl, M.; Zeisler, H.; Calda, P.; Holzgreve, W.; Galindo, A.; Engels, T.; et al. The sFlt-1/PlGF ratio in different types of hypertensive pregnancy disorders and its prognostic potential in preeclamptic patients. Am. J. Obstet. Gynecol. 2012, 206, 58. [Google Scholar] [CrossRef]
  80. Kenneth, L.; Hall, D.R.; Gebhardt, S.; Grové, D. Late Onset Preeclampsia is not an Innocuous Condition. Hypertens. Pregnancy 2010, 29, 262–270. [Google Scholar] [CrossRef]
  81. Schoofs, K.; Grittner, U.; Engels, T.; Pape, J.; Denk, B.; Henrich, W.; Verlohren, S. The importance of repeated measurements of the sFlt-1/PlGF ratio for the prediction of preeclampsia and intrauterine growth restriction. J. Perinat. Med. 2014, 42, 61–68. [Google Scholar] [CrossRef] [PubMed]
  82. Brown, M.A.; Magee, L.A.; Kenny, L.C.; Karumanchi, S.A.; McCarthy, F.P.; Saito, S.; Hall, D.R.; Warren, C.E.; Adoyi, G.; Ishaku, S. The hypertensive disorders of pregnancy: ISSHP classification, diagnosis & management recommendations for international practice. Pregnancy Hypertens. 2018, 13, 291–310. [Google Scholar] [PubMed]
  83. Gordijn, S.J.; Beune, I.M.; Thilaganathan, B.; Papageorghiou, A.; Baschat, A.A.; Baker, P.N.; Silver, R.M.; Wynia, K.; Ganzevoort, W. Consensus definition of fetal growth restriction: A Delphi procedure. Ultrasound Obstet. Gynecol. 2016, 48, 333–339. [Google Scholar] [CrossRef]
  84. Melamed, N.; Baschat, A.; Yinon, Y.; Athanasiadis, A.; Mecacci, F.; Figueras, F.; Berghella, V.; Nazareth, A.; Tahlak, M.; McIntyre, H.D.; et al. FIGO (International Federation of Gynecology and Obstetrics) initiative on fetal growth: Best practice advice for screening, diagnosis, and management of fetal growth restriction. Int. J. Gynecol. Obstet. 2021, 152, 3–57. [Google Scholar] [CrossRef]
  85. Magee, L.A.; von Dadelszen, P.; Singer, J.; Lee, T.; Rey, E.; Ross, S.; Asztalos, E.; Murphy, K.E.; Menzies, J.; Sanchez, J.; et al. The CHIPS Randomized Controlled Trial (Control of Hypertension in Pregnancy Study): Is Severe Hypertension Just an Elevated Blood Pressure? Hypertension 2016, 68, 1153–1159. [Google Scholar] [CrossRef] [PubMed]
  86. von Dadelszen, P.; Menzies, J.M.; Payne, B.; Magee, L.A.; PIERS (Pre-eclampsia Integrated Estimate of RiSk) Study Group. Predicting adverse outcomes in women with severe pre-eclampsia. Semin. Perinatol. 2009, 33, 152–157. [Google Scholar] [CrossRef] [PubMed]
  87. Thangaratinam, S.; Allotey, J.; Marlin, N.; Dodds, J.; Cheong-See, F.; von Dadelszen, P.; Ganzevoort, W.; Akkermans, J.; Kerry, S.; Mol, B.W.; et al. PREP Collaborative Network. Prediction of complications in early-onset pre-eclampsia (PREP): Development and external multinational validation of prognostic models. BMC Med. 2017, 15, 68. [Google Scholar] [CrossRef] [Green Version]
  88. Cheong-See, F.; Allotey, J.; Marlin, N.; Mol, B.; Schuit, E.; Riet, G.; Riley, R.; Moons, K.; Khan, K.; Thangaratinam, S. Prediction models in obstetrics: Understanding the treatment paradox and potential solutions to the threat it poses. BJOG Int. J. Obstet. Gynaecol. 2015, 123, 1060–1064. [Google Scholar] [CrossRef]
  89. Gómez, O.; Figueras, F.; Fernández, S.; Bennasar, M.; Martínez, J.M.; Puerto, B.; Gratacos, E. Reference ranges for uterine artery mean pulsatility index at 11-41 weeks of gestation. Ultrasound Obstet. Gynecol. 2008, 32, 128–132. [Google Scholar] [CrossRef]
  90. Ciobanu, A.; Wright, A.; Syngelaki, A.; Wright, D.; Akolekar, R.; Nicolaides, K.H. Fetal Medicine Foundation reference ranges for umbilical artery and middle cerebral artery pulsatility index and cerebroplacental ratio. Ultrasound Obstet. Gynecol. 2019, 53, 465–472. [Google Scholar] [CrossRef]
Figure 1. (AE) Box and whisker plots for serum concentrations of sEng, sFlt-1, PlGF and sFlt-1/PlGF and sFlt-1*sEng/PlGF ratios in study groups: PE + FGR (preeclampsia with concurrent FGR), iPE (isolated PE), iFGR (isolated, normotensive FGR) and healthy control patients. Boxes indicate interquartile range; whiskers indicate range; square bars indicate median, asterisks indicate extreme values.
Ijms 24 00972 g001aIjms 24 00972 g001bIjms 24 00972 g001c
Table 1. Basic characteristics and statistical analysis of the study groups (based on results of the Kruskal-Wallis test and analysis of variance ANOVA with a post hoc RIR Tukey test).
PE + FGRiPEiFGRControl
IIIIIIIV
ParameterMedianQ1–Q3MedianQ1–Q3MedianQ1–Q3MedianQ1–Q3p-ValueDifferences
Gravidity11–211–222–321.5–3ns-
Parity11–211–221–221–2ns-
Gestation age (weeks *)3228–343533–373533–373431–37nsI < II
Age (years)2927–353027–343330–372928–37ns-
Height (cm)167160–170164160–168167164–171165164–168ns-
Weight (kg)7266–898072–927067–797868–89ns-
I trimester
Weight (kg)6356–766761–756058–697165–75ns-
BMI2420–262523–282321–262824–28ns-
MAP9588–979383–968887–927975–91<0.05I, I + II > IV
DBP (mmHg)8076–827768–807570–786762–76<0.05I, I + II > IV
SBP (mmHg)120110–130126115–129119116–124111100–120<0.05I + II > IV
p-value reflecting statistically significant differences between the study groups and the control group. ns refers to the nonsignificant differences between the control and investigated groups. Q1–Q3 refers to the interquartile range; BMI refers to the body mass index; MAP is the arterial pressure; DBP refers to the diastolic blood pressure; SBP refers to the systolic blood pressure; Gestation age (weeks *) refers to the gestational age at the moment of venipuncture.
Table 2. Clinical results at the time of evaluation before delivery and statistical analysis of the study groups (based on the results of the Kruskal-Wallis test and analysis of variance ANOVA with a post hoc RIR Tukey test).
PE + FGRiPEiFGRControl
IIIIIIIV
ParameterMedianQ1–Q3MedianQ1–Q3MedianQ1–Q3MedianQ1–Q3p-ValueGroups
SBP max170156–178156150–165127115–134114104–122<0.005I > II > III > IV
DBP max104102–1119895–10581.576–846662–75<0.00005I,II > IV
MAP128121–131117.3114–12795.792–98.78476–89<0.00005I > II > III > IV
Proteinuria (mg/24 h)1438547–3483668295–1981170138–19200<0.00005I,II > IV
Total protein (g/dL)6.055.8–6.35.85.6–6.36.356–6.76.05.5–6.2ns-
Fibrinogen (g/L)4.43.7–55.24.3–5.64.74–5.23.853.5–4.2<0.05II > IV
INR0.90.86–0.930.90.9–0.980.920.9–0.971.01–1<0.00005I,II,III < IV
PT Index(%)109105–114106100–110105.3102–1109896–100<0.005I,II,III > IV
PT (s)1010.4–9.610.310.9–9.910.410.7–9.911.11.1–10.9<0.005I,II,III < IV
APTT (s)28.826.6–29.626.525.6–27.327.426.2–29.626.925.9–29.4ns-
D-dimers (ng/mL)12771050–180013621140–17311306951–16701359923–2389ns-
WBC (×109/L)10.38.8–11.49.89–12.49.47.5–11.49.058.4–10.9ns-
RBC (×1012/L)4.163.95–4.344.03.8–4.34.24–4.34.03.7–4.2ns-
Hb12.511.8–13.512.211.4–13.212.612–13.112.2511.5–12.7ns-
HCT (%)3734.3–38.834.933.7–38.536.835.6–37.935.333.9–37.2ns-
PLT (×109/L)192147–220189144–213207178–253220179–263ns-
ALT (U/L)28.521–7624.518–461614–281712–18<0.005I,II > IV
AST (U/L)4230–693025–412320–282015–21<0.00005I,II > IV
Creatinine (mg/dL)0.70.6–0.80.70.6–0.80.650.5–0.70.50.5–0.6<0.05I, I + II > IV
UA (mg/dL)7.26.7–8.26.55.5–7.25.53.95–6.64.23.2–4.6<0.00005I,II > IV
Urea3126.3–42.124.520–351919–2615.613.7–17<0.00005I,II > IV
p-value reflecting statistically significant differences between the study groups and the control group. ns refers to the nonsignificant differences between the control and investigated groups. Q1–Q3 refers to the interquartile range; MAP refers to the mean arterial pressure; DBP max refers to the maximum value of diastolic blood pressure; SBP max refers to the maximum value of systolic blood pressure; INR refers to the international normalized ratio; PT refers to the prothrombin time; APTT refers to the activated partial thromboplastin time; WBC refers to the white blood cell count; RBC refers to the red blood cell count; Hb refers to the hemoglobin concentration; HCT refers to the hematocrit; PLT refers to the platelet count; ALT refers to the alanine transaminase; AST refers to the aspartate transaminase; UA refers to uric acid.
Table 3. Characteristics and statistical analysis of ultrasound, including Doppler parameters, in the study groups (based on results of the Kruskal-Wallis test and analysis of variance ANOVA with a post hoc RIR Tukey test).
PE + FGRiPEiFGRControl
IIIIIIIV
ParameterMedianQ1–Q3MedianQ1–Q3MedianQ1–Q3MedianQ1–Q3pDifferences
UtPI mean1.61.4–2.01.01–11.61.3–20.70.65–0.75<0.0005I,III > IV
Ut PI pc10099–1009185–96100100–1005242–62<0.0005I,III > IV
UA PI1.31–2.421.00.9–11.21–1.70.80.65–0.87<0.00005I,II,III > IV
UA PI pc8453–1007359–829670–100113–46<0.00005I,II,III > IV
UA RI0.80.6–1.00.60.6–0.70.70.6–0.80.60.49–0.58<0.0001I,III > IV
MCA PI1.21.1–1.71.61.5–21.31.3–1.51.61.2–1.7<0.05I < II
MCA PI pc11–233212–4631–15218–35<0.05I < II
CPR1.20.6–1.61.61.5–1.810.7–1.62.01.7–2.2<0.0005I,III < IV
CPR pc11–16196–3511–135130–83<0.0005I,III < IV
AFI6.53–10108–14107.5–11119–14<0.05I < II
EFW1326708–171427602167–317319151464–225526071773–3351<0.00005I < IV
EFW pc11–25633–8321–56443–87<0.00005I,III < IV
AC242217–260323299–336281245–286304260–342<0.0005I < IV
AC pc11–55848–7441–75740–81<0.00005I,III < IV
p-value reflecting statistically significant differences between the study groups and the control group. ns—nonsignificant differences between the control and investigated groups. Q1–Q3—interquartile range. Ut PI (uterine artery pulsatility index); Ut PI pc (centile of uterine artery pulsatility index); UA PI (umbilical artery pulsatility index); UA PI pc (centile of umbilical artery pulsatility index); UA RI (umbilical artery resistance index); MCA PI (middle cerebral artery pulsatility index); CPR (cerebroplacental ratio); CPR pc (centile of cerebroplacental ratio); AFI (amniotic fluid index); EFW (estimated fetal weight); EFW pc (centile of estimated fetal weight); AC (abdominal circumference); AC pc (centile of abdominal circumference).
Table 4. Characteristics and statistical analysis of neonatal outcomes of the study groups (based on results of the Kruskal-Wallis test and analysis of variance ANOVA with a post hoc RIR Tukey test).
PE + FGRiPEiFGRControl
IIIIIIIV
ParameterMedianQ1–Q3MedianQ1–Q3MedianQ1–Q3MedianQ1–Q3pDifferences
Gestational age at birth (weeks)3228–343533–373533–373437–39ns-
Birth weight (g)1370680–170025001980–298019851480–232033403170–3520<0.00005I,II,III < IV
Birth percentile Hadlock * 199111–23318–813.51–86137–77<0.00005I,III < IV
Birth percentile Akolekar ** 201811–14622–8631–77047–87<0.00005I,III < IV
Apgar 1 minute76–887–1087–10109–10<0.0005I,II < IV
Apgar 5 min7.56–998–1088–10109.5–10<0.00005I < IV
p-value reflecting statistically significant differences between the study groups and the control group. Ns refers to the nonsignificant differences between controls and investigated groups. Q1–Q3 refers to interquartile range. * Hadlock FP, et al., In utero analysis of fetal growth: a sonographic weight standard. Radiology. 1991 Oct;181(1):129–33 [53]. ** Nicolaides KH, Wright D, Syngelaki A, Wright A, Akolekar R. Fetal Medicine Foundation fetal and neonatal population weight charts. Ultrasound ObstetGynecol 2018; doi:10.1002/uog.19073 [54].
Table 5. Distributions of the values of sFlt-1, sEng, PlGF and the sFlt-1/PlGF and sFlt-1*sEng/PlGF ratios in women with isolated PE, isolated FGR, combined PE and FGR and in the control group (based on the results of the Kruskal-Wallis test with Bonferroni adjustment).
GroupMMeQ1Q3SDH, p
sEng
[ng/mL]
(I) PE + FGR11.912.111.812.21.0H = 34.598
(II) iPE10.511.510.211.92.4p < 0.001
(III) iFGR9.911.79.211.93.0I > IV, II > IV, III > IV
(IV) Control6.45.84.18.32.9
PIGF
[pg/mL]
(I) PE + FGR72422211362H = 42.603
(II) iPE14914227227118p < 0.001
(III) iFGR216154117221261I > IV, II > IV, III > IV
(IV) Control8517694441248480
sFlt-1 [pg/mL](I) PE + FGR129,263115,70214,981221,278123,234H = 14.510
(II) iPE87,23476,3458614133,88899,327p = 0.002
(III) iFGR51,19333,59013,87166,99449,647I > IV, II > IV
(IV) Control97878878557410,8096416
RATIO sFlt-1/PlGF(I) PE + FGR2577107225028334638H = 46.100
(II) iPE11813141435473567p < 0.001
(III) iFGR40821981846438I > IV, II > IV, III > IV
(IV) Control181052417
RATIO sFlt-1*sEng/PlGF(I) PE + FGR31,54912,859301333,34556,617H = 44.965
(II) iPE13,83232511492641841,999p < 0.001
(III) iFGR4727258764610,1095350I > IV, II > IV, III > IV
(IV) Control1425324187191
p-value statistically significant differences between the study groups and the control group. M—mean value, Me—median value, Q1–Q3—interquartile range.
Table 6. Distribution of the sFlt-1/PlGF ratio in each study subgroup in the low, intermediate, high or very high risk groups according to the currently recomended cutoff values.
Ratio
sFlt-1/PlGF
PE + FGR
(n = 22)
iPE
(n = 21)
iFGR
(n = 14)
Control
(n = 20)
Mean/Median2577/10721181/314408/21818/10
Low5%0085%
<381 (5%)01 (7%)17 (85%)
Intermediate9%24%29%15%
38–85<34 w2 (9%)1 (5%)00
38–110>34 w04 (19%)4 (29%)3 (15%)
High14%14%00
>85<34 w3 (14%)3 (14%)00
>110>34 w0000
Very high16 (73%)13 (65%)9 (64%)0
>655<34 w10 (45%)3 (14%)4 (29%)0
>201>34 w6 (27%)10 (48%)5 (36%)0
Cutoff values are based on the following: (1) Stepan H, Herraiz I, Schlembach D, Verlohren S, Brennecke S, Chantraine F, Klein E, Lapaire O, Llurba E, Ramoni A, Vatish M, Wertaschnigg D, Galindo A: Implementation of the sFlt-1/PlGF ratio for prediction and diagnosis of preeclampsia in singleton pregnancy: implications for clinical practice. Ultrasound ObstetGynecol 2015;45:241–246 [55]. (2) Herraiz I, Llurba E, Verlohren S, Galindo A. Spanish Group for the study of angiogenic markers in preeclampsia. Update on the diagnosis and prognosis of preeclampsia with the aid of the sFlt-1/PlGF ratio in singleton pregnancies. FetalDiagnTher 2018;43:81–89 [56].
Table 8. Distributions of the values of sFlt-1, sEng, PlGF and the sFlt-1/PlGF and sFlt-1*sEng/PlGF ratios in pregnancies with and without adverse outcomes.
MeanMedianQ1Q3SD
sEng [ng/mL]adverse 11.611.811.312.21
non
adverse
10.411.89.812.12.8
PIGF [pg/mL]adverse 1075825186100
non
adverse
15612326190189
sFlt-1 [pg/mL]adverse 108,72777,9326201156,292124,261
non
adverse
82,51248,26013,052135,39587,355
Ratio
sFlt-1/PlGF
adverse 261047613010325544
non
adverse
8003221431090982
Ratio sFlt*sEng/PlGFadverse 31,5995876156012,71466,852
non
adverse
95273423149312,99612,084
Gestational age
[weeks]
adverse 313227354.8
non
adverse
353533372.7
Table 9. Comparison of the results in early and late PE.
Early PE
<34 Weeks
Late PE
≥34 Weeks
p Value
n = 22n = 21
MedianQ1–Q3MedianQ1–Q3
Gestational age [weeks]31.527–323635–370.0000001
PlGF pg/mL [pg/mL]3321–12512436–2380.01
sFlt-1 [pg/mL]104,3103152–172,02474,75914,981–135,395 NS
sEng [ng/mL]1211.6–12.211.710.2–12.1 NS
sFlt-1/PlGF 973228–2247364228–960 NS
NS stands for Not Statistically Significant.
Table 10. Comparison of the results in early and late FGR.
Early FGR
<34 Weeks
Late FGR
≥34 Weeks
p Value
n = 5n = 9
MedianQ1–Q3MedianQ1–Q3
Gestational age [weeks]3127–323635–370.0000001
PlGF [pg/mL]119117–150172143–2210.01
sFlt-1 [pg/mL]115,49056,238–127,05329,18313,051–36,878<0.05
sEng [ng/mL]11.711.6–1210.99.2–11.8NS
sFlt-1/PlGF972845–98421280–2220.01
NS stands for Not Statistically Significant.
Table 11. Preeclampsia diagnostic criteria formed by International Society for the Study of Hypertension in Pregnancy (ISSHP) in 2018.
Preeclampsia
Preeclampsia is gestational hypertension accompanied by ≥1 of the
following new-onset conditions at or after 20 weeks’ gestation:
Proteinuria
Other maternal organ dysfunction, including:
AKI (creatinine ≥ 90 umol/L; 1 mg/dL)
Liver involvement (elevated transaminases, e.g., alanine
aminotransferase or aspartate aminotransferase >40 IU/L) with or
without right upper quadrant or epigastric abdominal pain
Neurological complications (examples include eclampsia, altered
mental status, blindness, stroke, clonus, severe headaches, and
persistent visual scotomata)
Hematological complications (thrombocytopenia–platelet count
<150,000/μL, disseminated intravascular coagulation, hemolysis)
Uteroplacental dysfunction (such as fetal growth restriction, abnormal umbilical artery [UA] Doppler wave form analysis, or stillbirth)
Table 12. Consensus-based definitions for early and late fetal growth restriction (FGR).
Early FGR:
GA <32 weeks, in absence of congenital anomalies
Late FGR:
GA ≥32 weeks, in absence of congenital anomalies
AC/EFW < 3rd centile or UA-AEDF
Or
1. AC/EFW < 10th centile combined with
2. UtA-PI > 95th centile and/or
3. UA-PI >95th centile
AC/EFW < 3rd centile
Or at least two out of three of the following
1. AC/EFW < 10th centile
2. AC/EFW crossing centiles >2 quartiles on growth centiles *
3. CPR < 5th centile or UA-PI > 95th centile
AC, fetal abdominal circumference; AEDF, absent end-diastolic flow; CPR, cerebroplacental ratio; EFW, estimated fetal weight; GA, gestational age; PI, pulsatility index; UA, umbilical artery; UtA, uterine artery. Adapted from: Gordijn SJ, Beune IM, Thilaganathan B, Papageorghiou A, Baschat AA, Baker PN, Silver RM, Wynia K, Ganzevoort W. Consensus definition of fetal growth restriction: a Delphi procedure. Ultrasound Obstet Gynecol. 2016;48:333–9. AC, fetal abdominal circumference; AEDF, absent end-diastolic flow; CPR, cerebroplacental ratio; EFW, estimated fetal weight; GA, gestational age; PI, pulsatility index; UA, umbilical artery; UtA, uterine artery [83]. * Hadlock FP, et al., In utero analysis of fetal growth: a sonographic weight standard. Radiology. 1991 Oct;181(1):129–33 [53].
Table 13. Summary of the recommendations for the use of sFlt-1/PlGF ratio in women with signs and symptoms of PE based on the opinion of experts in the use of angiogenic markers.
Ratio
sFlt-1/PlGF
(EP/LP)
InterpretationTime to Delivery
(ep)
What Should Be Done?
LOW:
<38
Rule out PE:
1 week: NPV ≈ 99%
4 weeks: NPV ≈ 95%
UnmodifiedReassuring the patient. No further determinations are needed unless new suspicion arises.
Intermediate:
38–85/38–110
Rule in PE:
4 weeks PPV ≈ 40%
20% remain pregnant after 1 monthFollow up visit and retest in 1–2 weeks.
Maternal education about signs and symptoms of PE
High:
>85/>110
Diagnosis of PE (or PD-related disorder) is highly likely 15% remain pregnant after 2 weeksFollow up visit and retest in 2–4 days.
EP: consider referral to higher-level center.
LP: consider lowering the threshold for labour induction.
Very high:
>655/>201
Short-term complications and need to deliver are highly likely30% remain pregnant after 2 daysClose surveillance.
EP: corticosteroids to the mother for fetal lung maturation
NPV, ang. negative predictive value; PD, placental dysfunction; PE, preeclampsia; PlGF, placental growth factor; PPV, positive predictive value; sFlt-1, soluble form of fms-like tyrosine kinase-1; EP, early phase (<34 weeks); LP, late phase (≥34 weeks).
Disclaimer/Publisher’s Note: The statements, opinions and data contained in all publications are solely those of the individual author(s) and contributor(s) and not of MDPI and/or the editor(s). MDPI and/or the editor(s) disclaim responsibility for any injury to people or property resulting from any ideas, methods, instructions or products referred to in the content.

