Article

Genome-Wide Identification and Characterization of the Trehalose-6-Phosphate Synthetase Gene Family in Chinese Cabbage (Brassica rapa) and Plasmodiophora brassicae during Their Interaction

Molecular Biology of Vegetable Laboratory, College of Horticulture, Shenyang Agricultural University, Shenyang 110866, China
*
Authors to whom correspondence should be addressed.
Int. J. Mol. Sci. 2023, 24(2), 929; https://doi.org/10.3390/ijms24020929
Submission received: 17 November 2022 / Revised: 28 November 2022 / Accepted: 31 December 2022 / Published: 4 January 2023
(This article belongs to the Special Issue Abiotic Stress in Plant: From Gene to the Fields 2.0)

Abstract

:
Trehalose is a nonreducing disaccharide that is widely distributed in various organisms. Trehalose-6-phosphate synthase (TPS) is a critical enzyme responsible for the biosynthesis of trehalose, which serves important functions in growth and development, defense, and stress resistance. Although previous studies have found that the clubroot pathogen Plasmodiophora brassicae can lead to the accumulation of trehalose in infected Arabidopsis organs, it has been proposed that much of the accumulated trehalose is derived from the pathogen. At present, there is very little evidence to verify this view. In this study, a comprehensive analysis of the TPS gene family was conducted in Brassica rapa and Plasmodiophora brassicae. A total of 14 Brassica rapa TPS genes (BrTPSs) and 3 P. brassicae TPS genes (PbTPSs) were identified, and the evolutionary characteristics, functional classification, and expression patterns were analyzed. Fourteen BrTPS genes were classified into two distinct classes according to phylogeny and gene structure. Three PbTPSs showed no significant differences in gene structure and protein conserved motifs. However, evolutionary analysis showed that the PbTPS2 gene failed to cluster with PbTPS1 and PbTPS3. Furthermore, cis-acting elements related to growth and development, defense and stress responsiveness, and hormone responsiveness were predicted in the promoter region of the BrTPS genes. Expression analysis of most BrTPS genes at five stages after P. brassicae interaction found no significant induction. Instead, the expression of the PbTPS genes of P. brassicae was upregulated, which was consistent with the period of trehalose accumulation. This study deepens our understanding of the function and evolution of BrTPSs and PbTPSs. Simultaneously, clarifying the biosynthesis of trehalose in the interaction between Brassica rapa and P. brassicae is also of great significance.

1. Introduction

Trehalose is a nonreducing disaccharide with two glucose molecules linked through an α, α-1,1-glucosidic bond, which has been found to exist in bacteria, fungi, algae, invertebrates, and plants [1]. Previous studies have found that trehalose is known as a living substance that exists in all living organisms and is involved in growth and development [2,3]. Trehalose biosynthesis pathways are widely distributed in nature. There are five pathways for trehalose biosynthesis that have been identified according to the different catalytic enzymes [4] (Figure S1). The first pathway is called the TS pathway; trehalose synthase (TreS) in Pimelobacter sp. catalyzes the conversion of maltose into trehalose by intramolecular transglycosylation [5] (Figure S1A). The second pathway (TreY/TreZ pathway) has been reported in thermophilic archaea of the genus Sulfolobus, which converts maltodextrin to trehalose via the catalysis of maltooligosyl trehalose synthase (TreY) and maltooligosyl trehalose trehalohydrolase (TreZ) [6] (Figure S1B). In the third pathway (TreP pathway), mainly existing in some fungi, trehalose phosphorylase (TreP) bidirectionally catalyzes the hydrolysis of trehalose in the presence of inorganic phosphorus to produce glucose-1-phosphate and a molecule of glucose. However, since this reversible reaction can only be observed in in vitro experiments, it is uncertain whether the TreP enzyme is involved in the synthesis or degradation of trehalose in vivo [7,8] (Figure S1C). The fourth pathway was found in the hyperthermophilic archaeon Thermococcus litoralis, involving trehalose glycosyl-transferring synthase (TreT), which is an enzyme forming trehalose and ADP from ADP–glucose and glucose [9] (Figure S1D). The above four pathways of trehalose biosynthesis have been found in several prokaryotes and archaea, but the fifth pathway (TPS/TPP pathway) is the most widespread, has been found in all prokaryotic and eukaryotic organisms that synthesize trehalose, and is the only pathway found in plants. In this pathway, the enzymatic reaction is catalyzed by trehalose 6-phosphate synthase (TPS) and trehalose 6-phosphate phosphatase (TPP), and TPS catalyzes UDP-glucose (UDPG) and glucose 6-phosphate (G6P), producing trehalose 6-phosphate (T6P) and UDP. T6P is then further catalyzed to synthesize trehalose by TPP [10,11] (Figure S1E). The trehalose synthase gene was first reported from Pimelobacter sp. R48 by screening the genomic DNA library [12], and later, trehalose synthase genes were identified in bacteria, fungi, plants, arthropods, and insects [10,13,14,15].
TPS performs the first step in the biosynthetic pathway of T6P and trehalose. TPS is thus of particular interest as it directly affects the concentration of both T6P and trehalose, which play vital roles in trehalose metabolism and stress resistance in plants [16]. The Escherichia coli otsA and otsB genes were identified and cloned in 1992, and otsA and otsB mutations block osmoregulatory trehalose synthesis in E. coli [17]. In Saccharomyces cerevisiae, TPS and TPP are part of the trehalose synthase complex, and the TPS homolog, TPS1, forms a complex with the TPP homolog, TPS2, and two regulatory subunits, TPS3 and TSL (trehalose synthase long chain) [18]. In many insects, multiple TPS genes that encode proteins harboring TPS/OtsA- and TPP/OtsB-conserved domains have been found and cloned, such as those in Drosophila [19], Helicoverpa armigera [20], and Spodoptera exigua [21]. Early accounts of trehalose in plants were restricted to resurrection plants, for example, Selaginella species and Myrothamnus flabellifolia [22,23,24]. Soon after, the model plant Arabidopsis was shown to synthesize small amounts of trehalose, and functional genes encoding TPS and TPP were found in Arabidopsis thaliana. The TPS gene family in Arabidopsis and rice consists of 11 members [25,26], and TPS possesses two domains, TPS (Glyco_transf_20) and TPP (Trehalose_PPase), that correspond to OtsA and OtsB genes responsible for TPS and TPP activity, respectively, in E. coli [27,28]. Mutants of the Arabidopsis tps1 gene cause embryonic lethality, and AtTPS5 functions as a negative regulator of ABA signaling and is involved in altering the trehalose content [29], indicating that trehalose synthesis plays a crucial role in plants [30].
Trehalose plays a wide range of functional roles in organisms, which is also a typical microbial sugar accumulating in multifarious symbiotic or pathogenic interactions of microorganisms with plants [31]. In some microorganisms and invertebrate animals, trehalose serves as a carbon source or an osmoprotectant [31]. In prokaryotes, trehalose frequently serves as a source of reserve energy, a compatible solute to contend with osmotic stress in spores and resting cells, and as part of the cell wall structure [32]. In insects, hemolymph trehalose is a major store of carbohydrates and an important substrate during flight [33]. In plants, the disaccharide sucrose plays a similar role as trehalose [10]. However, trehalose has been found in small amounts in only a few plants, namely specialized resurrection species, such as Selaginella lepidophylla, and it plays a role in stress protection, especially drought [34]. In Arabidopsis thaliana and other drought-resistant species, despite the existence of multiple genes encoding trehalose synthesis, only a small amount of trehalose was detected, which may be related to the co-regulation of its precursor, T6P, in the regulation of plant stress [3,35,36]. In fungi, trehalose is a reserve carbohydrate and protector against stress challenges [37]. Trehalose plays a role in the colonization of plants by pathogens [4]. Multi-host pathogen Pseudomonas aeruginosa synthesizes trehalose, which is required during infection of Arabidopsis leaves [38]. The inhibition of the biosynthesis of trehalose by the plant pathogen Ralstonia solanacearum contributes to the reduction of its pathogenicity, and it also indicates the important role of trehalose in the interaction between plants and pathogens [39].
Clubroot, a devastating disease affecting Brassica plants, is caused by the obligate biotroph protist Plasmodiophora brassicae and is characterized by the development of large galls on infected roots, inhibiting the uptake of nutrients and water from the soil [40]. Altered carbohydrate metabolism, including that of starch, soluble sugars, and inositol, is an important symptom of clubroot disease. Notably, a previous study found that high trehalose levels accumulated in infected tissues after P. brassicae inoculation [41], and this accumulation pattern was consistent with the expression of PbTPS1, a putative trehalose-6-phosphate synthase gene from P. brassicae. Scholars have speculated that a large amount of trehalose is most likely synthesized by P. brassicae rather than by the host. The release of trehalose synthesized by P. brassicae into plants might interfere with the plant’s trehalose-sensing system and alter the host’s carbohydrates in the pathogen’s favor [41]. Plasmodiophora brassicae is an obligate parasite that parasitizes the roots of cruciferous plants, but research on it is limited because it cannot be isolated and cultured in vitro. Therefore, it is unclear whether accumulated trehalose is synthesized by host plants or P. brassicae. To address this, we focused on the role of TPS genes in the trehalose synthesis pathway in the interaction between Brassica rapa and P. brassicae and performed genome-wide identification, characterization, and expression analysis of the TPS genes from P. brassicae and its host plant B. rapa.
We identified the TPS genes in the B. rapa and P. brassicae genomic data and investigated the functional classification, evolutionary characterization, and expression patterns of the TPS gene family. The present study enhances our understanding of the function and evolution of BrTPSs and PbTPSs. The study is also of great significance in clarifying the biosynthesis of trehalose in the interaction between Brassica rapa and P. brassicae.

2. Results

2.1. Trehalose Sugar Content in Cabbage Roots after Infection with P. brassicae

Five weeks after inoculation with P. brassicae, each of the infected Chinese cabbage roots clearly showed typical symptoms of clubroot, and from 4 to 5 weeks post-inoculation (wpi), the clubroot became increasingly obvious (Figure 1A). To investigate changes during the development of clubroot, the trehalose content of the roots was analyzed at four different stages after infection (from the second week to the fifth week) (Figure 1B). From 2 to 3 wpi, the trehalose content was extremely low, and there was no difference between the healthy and infected plants. However, trehalose accumulated at 4 wpi when the trehalose content was slightly higher in infected plants than in healthy plants. Most notably at 5 wpi, trehalose increased greatly in infected plants, with a 1000-fold increase relative to healthy plants. This indicates that P. brassicae infection leads to the accumulation of a large amount of trehalose in Chinese cabbage roots.

2.2. Identification of TPS Family Members in B. rapa and P. brassicae

To analyze the biosynthesis of trehalose, we identified TPS genes in the B. rapa and P. brassicae genomes. Based on similarities with the 11 Arabidopsis AtTPSs, a total of 14 BrTPSs were identified in the B. rapa genome and named BrTPS1a to BrTPS11 based on their identity with AtTPSs. Among the 14 BrTPSs, 8 BrTPS genes had two copies corresponding to AtTPSs, while the orthologous gene of AtTPS3 was not found in the B. rapa genome. The majority of the BrTPS gene-coding sequences were about 2700 base pairs (bp), and the length of amino acid residues was about 900 aa. The shortest coding sequence of BrTPS5a was only 390 bp, and the length of the amino acids was 129 aa. The isoelectric point (pI) value of BrTPSs ranged from 4.7 to 9.48, and the protein molecular weight ranged from 14.7 to 165.8 kDa. Subcellular localization predictions showed that they were mainly localized in the chloroplast, vacuole, and cytoplasm (Table 1).
A total of three TPS genes were acquired by keyword search against the P. brassicae genome in NCBI’s nr database, namely PbTPS1, PbTPS2, and PbTPS3. The coding sequence length of the three PbTPS genes was longer than 2500 bp, and the length of the amino acid ranged from 853 to 860 aa. The molecular weight ranged from 95.50 to 96.49 kDa, and the predicted pI value ranged from 6.18 to 6.93. Subcellular localization prediction indicated that the three PbTPS proteins were located in the cytoplasm (Table 2).

2.3. Phylogenetic Analysis of BrTPSs and PbTPSs

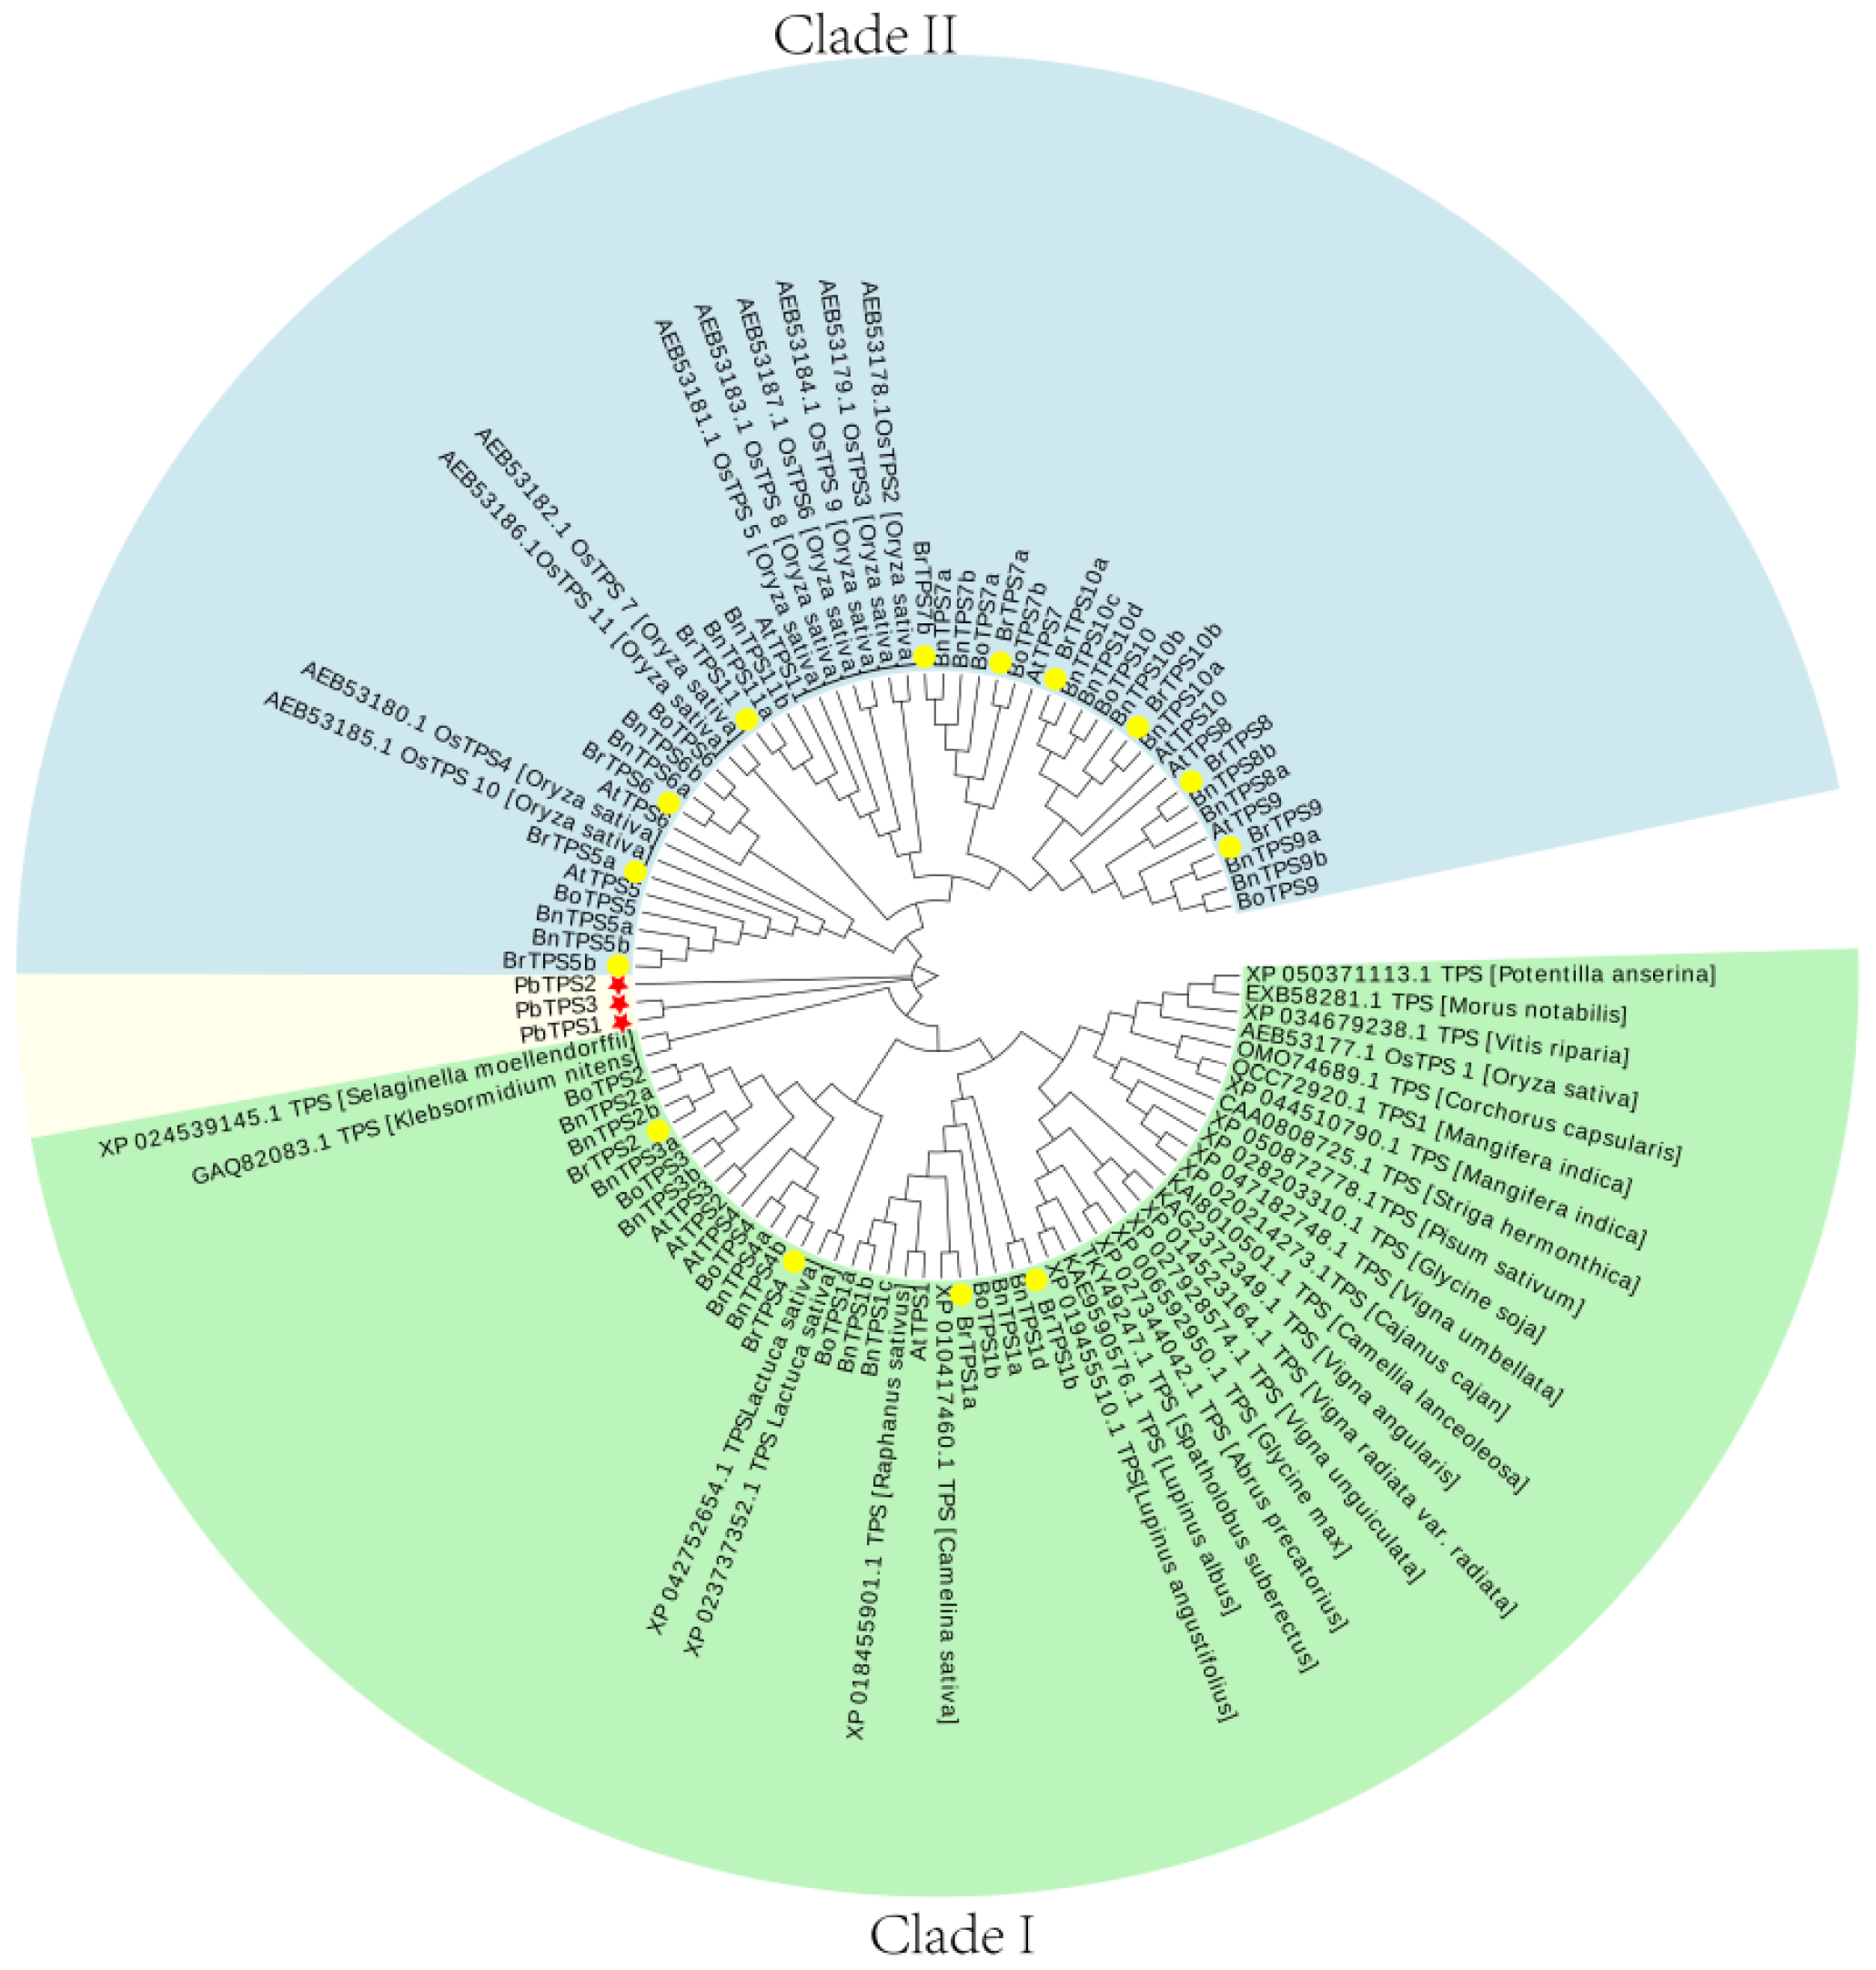
To analyze the evolutionary relationships of BrTPS and PbTPS genes in B. rapa and P. brassicae, an unrooted phylogenetic tree was constructed using full-length amino acid sequences (Figure 2). In total, The TPS sequences from 30 species were assessed in the phylogenetic tree (Supplementary Table S2). The TPSs of B. rapa were grouped into two major clades; BrTPS1a to BrTPS4 belonged to Clade I, and BrTPS5a to BrTPS11 belonged to Clade II. The PbTPSs belonged to a separate clade, which indicated that PbTPS is far away from other species in evolution. In addition, PbTPS3 and PbTPS1 were clustered into the same branch; PbTPS2 failed to cluster with them, which indicated that there are sequence differences between PbTPSs, and there may be functional differences.

2.4. Gene Structure and Conserved Domain Analyses of BrTPSs and PbTPSs

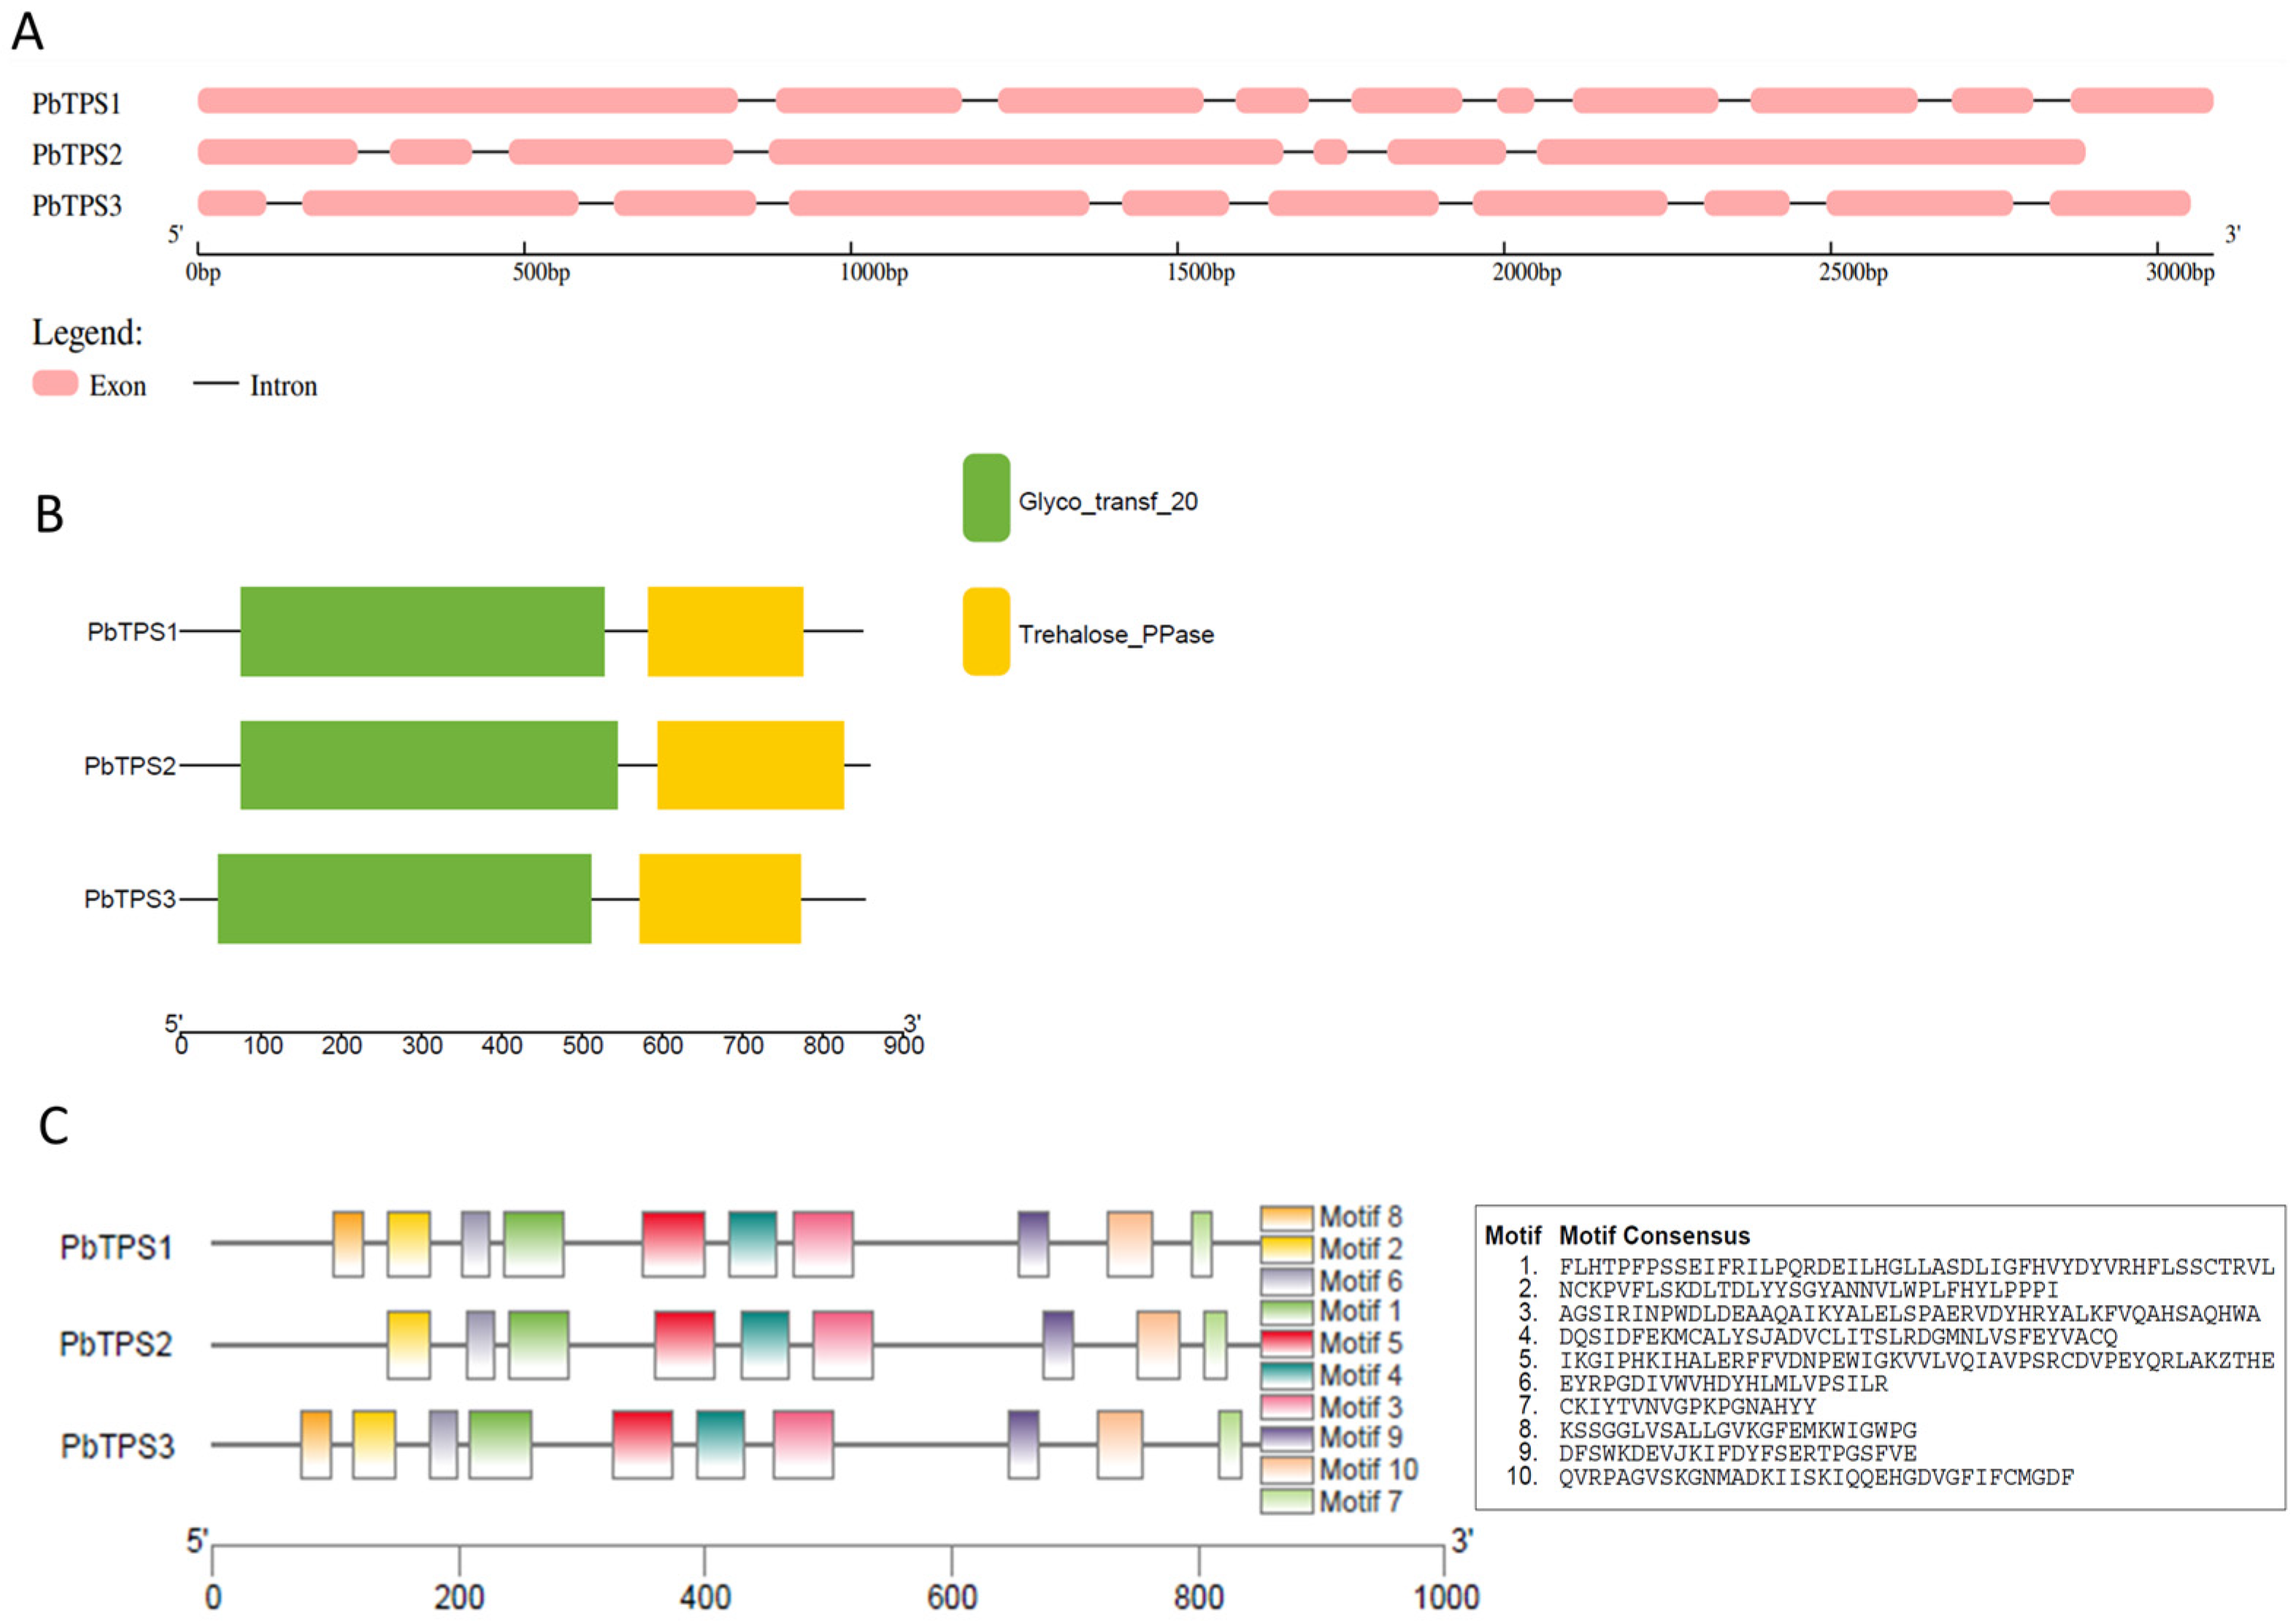
Gene structure analysis is an available method for understanding gene evolutions and their potential roles. Thus, the structures of the BrTPS and PbTPS genes were investigated. For 14 BrTPS genes, the number of exons ranged from 2 to 17, and the majority of BrTPS genes (accounting for 42.8%) had three exons. BrTPS4 contained the most exons (17), whereas BrTPS5a harbored the fewest exons (2). Interestingly, BrTPS genes clustered in the same clade generally possessed a similar exon–intron structure, and genes in Clade I had more exons than genes in Clade II (Figure 3A). Generally, analysis of these TPS gene structures showed that the conserved exon–intron structure within each cluster agreed with the classification of TPS genes in an NJ phylogenetic tree based on TPS sequences (Figure 2). For PbTPS genes, the number of exons ranged from 7 to 10. Among them, PbTPS1 and PbTPS3 had 10 exons, but PbTPS2 contained 7 exons (Figure 4A).
Domain analysis of the identified BrTPS and PbTPS protein sequences showed that, except BrTPS5a, the other TPS proteins contained a TPS structure domain (Glyco_transf_20) located at the N-terminal and a TPP domain (Trehalose_PPase) at the C-terminal. However, BrTPS5a contained only the TPP domain (Figure 3B and Figure 4B). To further elucidate the structural and functional features of BrTPSs and PbTPSs, 10 conserved motifs of the TPS proteins were identified using the MEME program. For BrTPS proteins, these motifs were conserved in most BrTPS proteins, except BrTPS7a and BrTPS5a, which harbored one and three motifs, respectively. The lengths of these motifs ranged from 21 to 50 amino acids. Among them, Motifs 1, 3, 4, 5, 6, 8, and 9 together composed the TPS domain (Glyco_transf_20). Motifs 2, 7, and 10 composed the TPP domain (Trehalose_PPase) (Figure 3C). For PbTPS proteins, these motifs were almost conserved in PbTPS proteins, except PbTPS2, which lacked Motifs 5 and 8. The lengths of these motifs ranged from 18 to 50 aa. According to Figure 4C, Motifs 1, 2, 3, 4, 5, 6, and 8 were located in the TPS domain, and Motifs 7, 8, and 10 were located in the TPP domain.

2.5. Chromosomal Location of BrTPS Genes

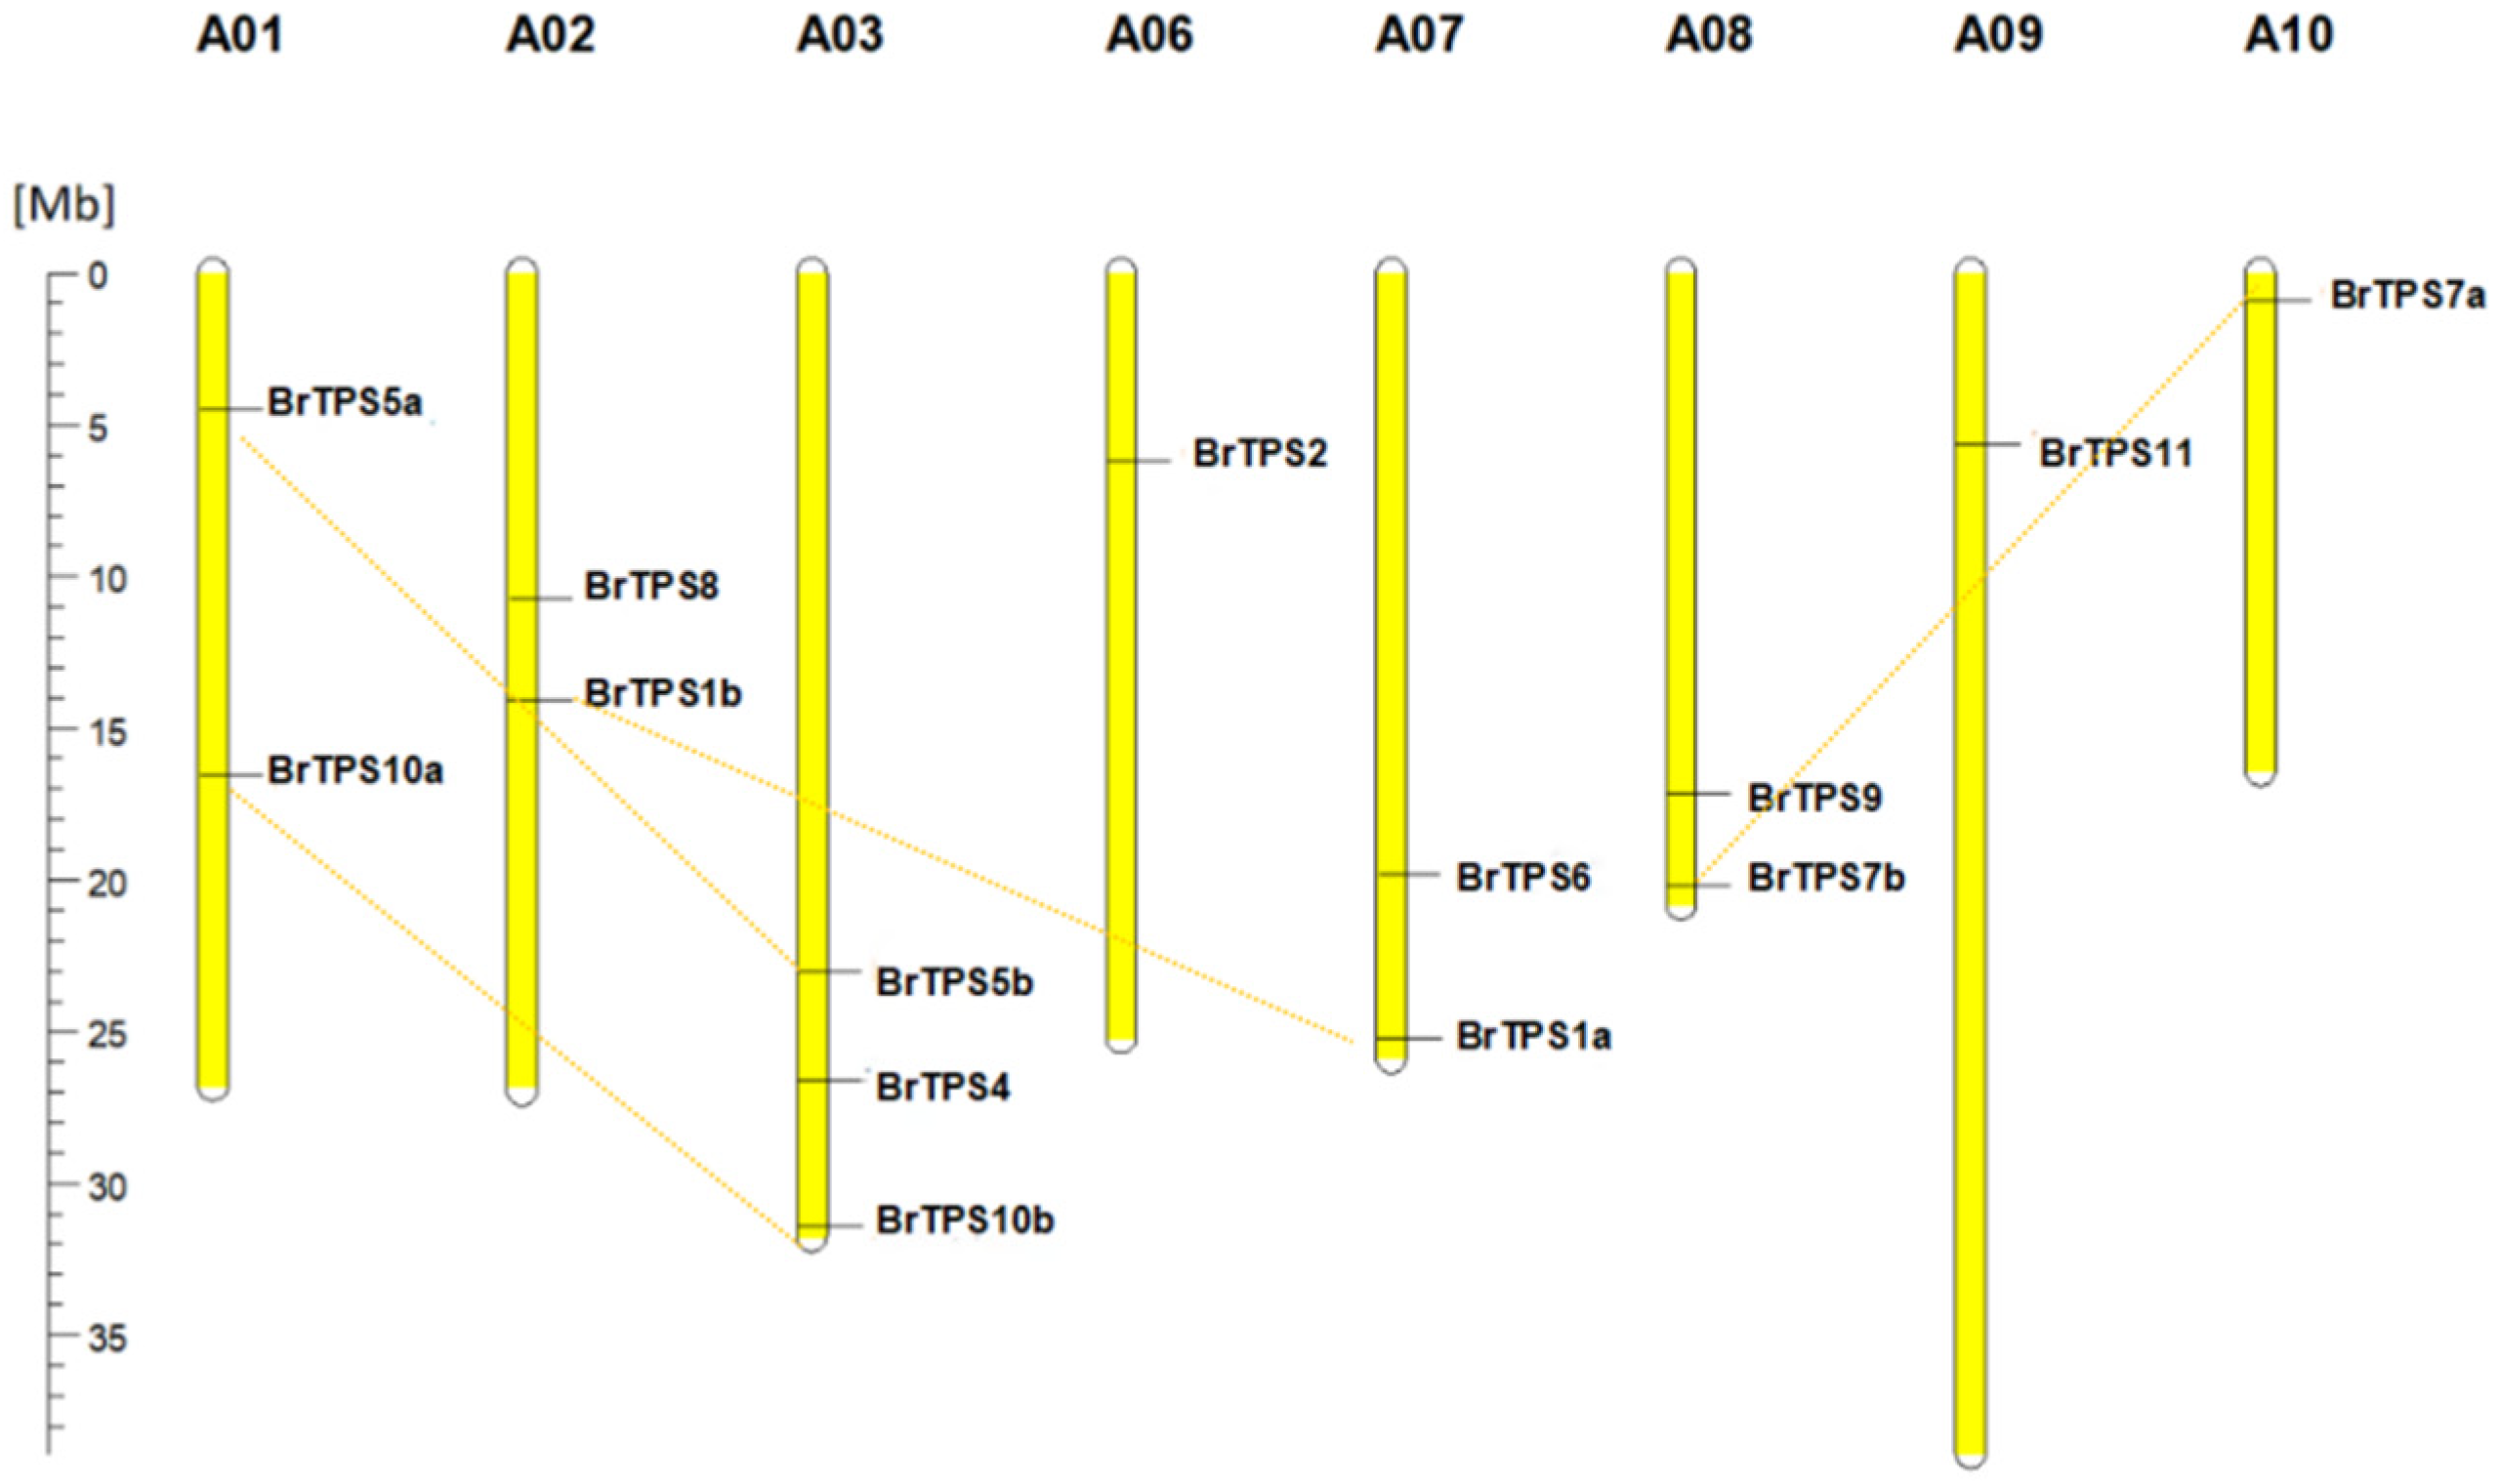
To analyze the distribution of BrTPS genes in the genome, we showed their position on each chromosome based on the B. rapa genome database (Figure 5). Fourteen BrTPS genes were dispersed on eight chromosomes. Each chromosome contained 1–3 BrTPS genes. Chromosome A03 contained three BrTPS genes (BrTPS4, BrTPS5b, and BrTPS10b), and chromosomes A06, A09, and A10, each contained one BrTPS gene (BrTPS2, BrTPS11, and BrTPS7a, respectively), while chromosomes A01, A02, A07, and A08 each had two BrTPS genes. A duplication event was identified in the B. rapa genomes. Four AtTPS genes (AtTPS1, -5, -7, and -10) were duplicated in B. rapa, and the BrTPS paralogous genes were dispersed on different chromosomes.

2.6. Identification of Cis-Acting Elements in the Promoter Region of BrTPS Genes

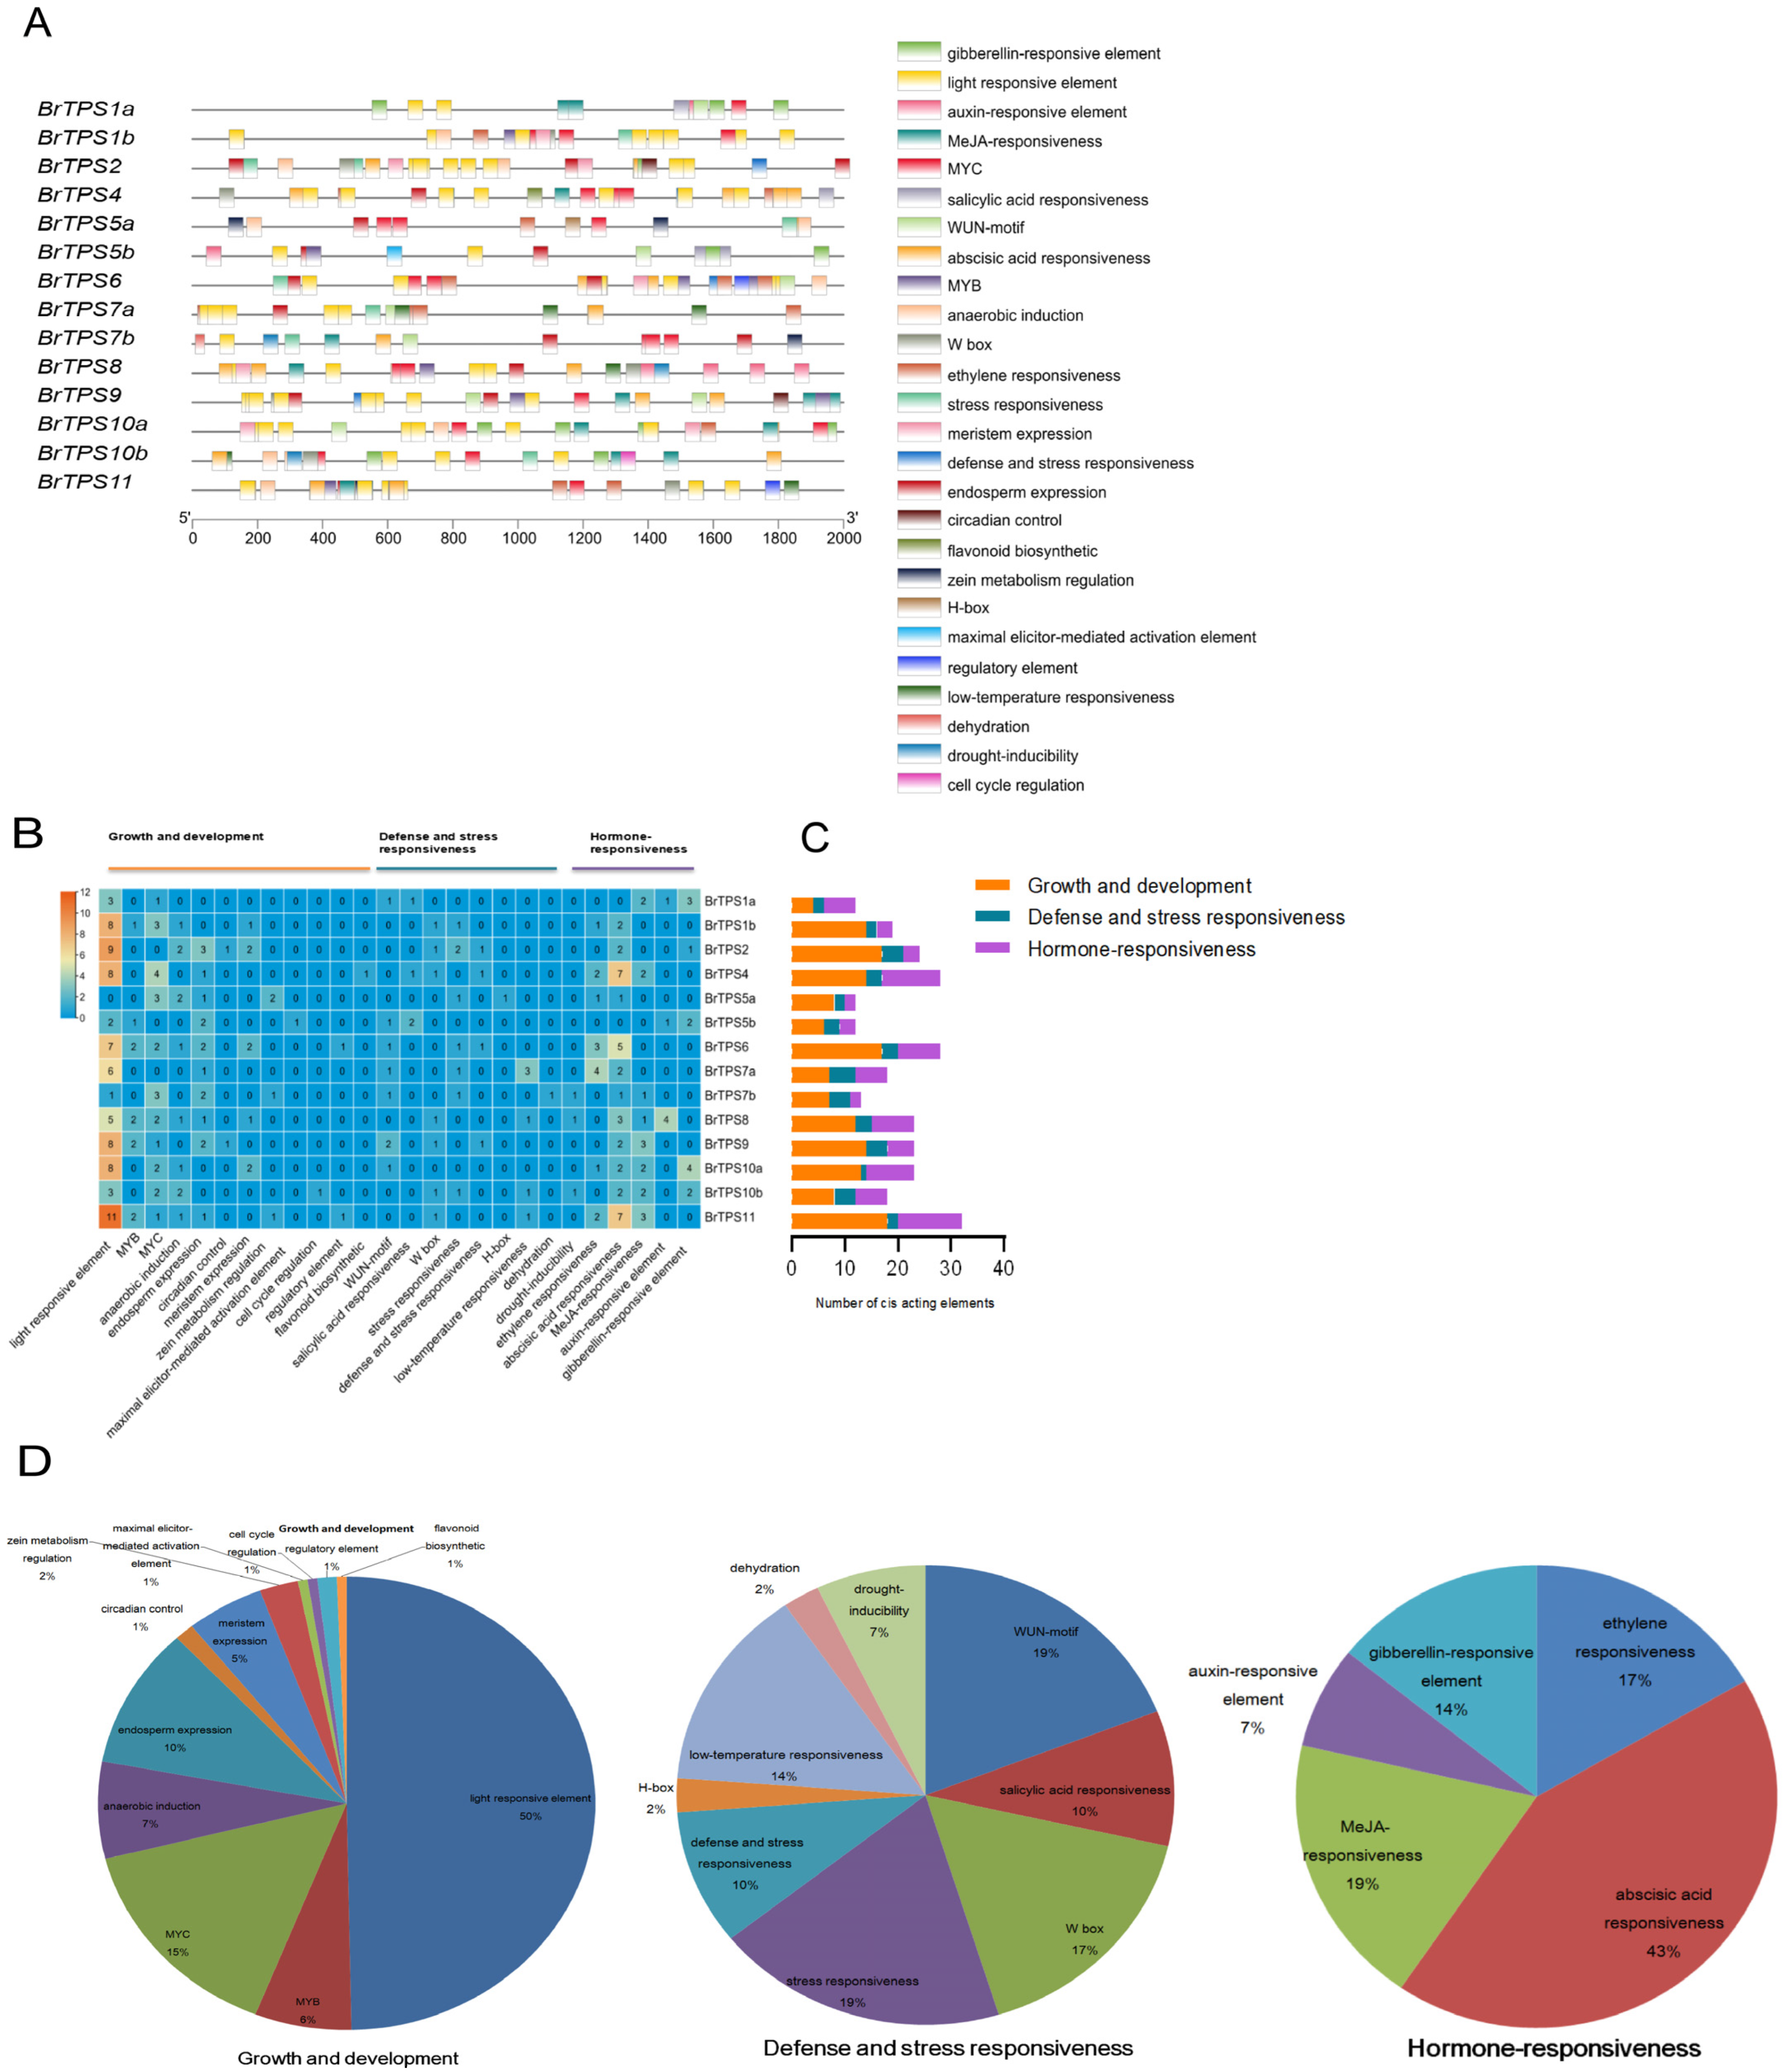
To ascertain the potential biological roles of BrTPS genes in B. rapa, 2000 bp sequences upstream of the start site of BrTPS genes were used to identify the potential cis-acting elements in the promoter region. A total of 285 functionally annotated cis-acting elements were predicted in these genes. Many cis-acting elements were involved in light responsiveness, stress responsiveness, hormone responsiveness, site binding, and other functions (Figure 6A). Generally, the cis-acting elements were roughly classified into three categories of cis-elements linked to growth and development, defense and stress responsiveness, and hormone responsiveness (Figure 6B). The cis-acting elements in growth and development were the most involved, followed by the cis-acting elements in response to hormones, and the elements in defense and stress were the least involved. Among the 14 BrTPS genes, BrTPS1a had the least cis-acting elements, while BrTPS11 contained the most (Figure 6C). In the plant growth and development category (159/285), 79 cis-elements (accounting for 50%) were involved in light responsiveness, which accounted for the largest proportion in this category, and this element was contained in all 14 BrTPS genes. Eleven cis-elements were involved in anaerobic induction, 16 in endosperm expression, 8 in meristem expression, 4 in zein metabolism regulation, 10 and 24 as MYB and MYC binding sites, respectively, and 2 in circadian control and regulation. Some BrTPS genes elicit specific cis-acting elements, such as the maximal elicitor-mediated activation element only in BrTPS5b, the cell cycle regulatory element only in BrTPS10b, and the flavonoid biosynthetic element only in BrTPS4, which indicates the specificity of the function of these genes (Figure 6B,D). In the defense and stress responsiveness category (42/285), eight cis-elements (accounting for 19%) were involved as WUN-motifs, eight (accounting for 19%) in stress responsiveness, six (accounting for 14%) in low-temperature responsiveness, four (accounting for 10%) in salicylic acid responsiveness, four in defense and stress responsiveness, and three (accounting for 7%) in drought inducibility. Additionally, the W-box element (accounting for 17%) was found in seven BrTPS genes. The dehydration responsiveness element (accounting for 2%) was found in BrTPS7b (Figure 6B,D). In the hormone responsiveness category (84/285), various cis-elements were related to ethylene responsiveness (accounting for 17%), abscisic acid responsiveness (accounting for 43%), MeJA responsiveness (accounting for 19%), auxin responsiveness (accounting for 7%), and gibberellin responsiveness (accounting for 14%). Notably, the largest number of cis-elements was in the abscisic acid-responsive elements. The results suggest that most BrTPS genes might be acid-induced and/or -repressed genes (Figure 6D).

2.7. Expression of BrTPS Genes under P. brassicae Infection

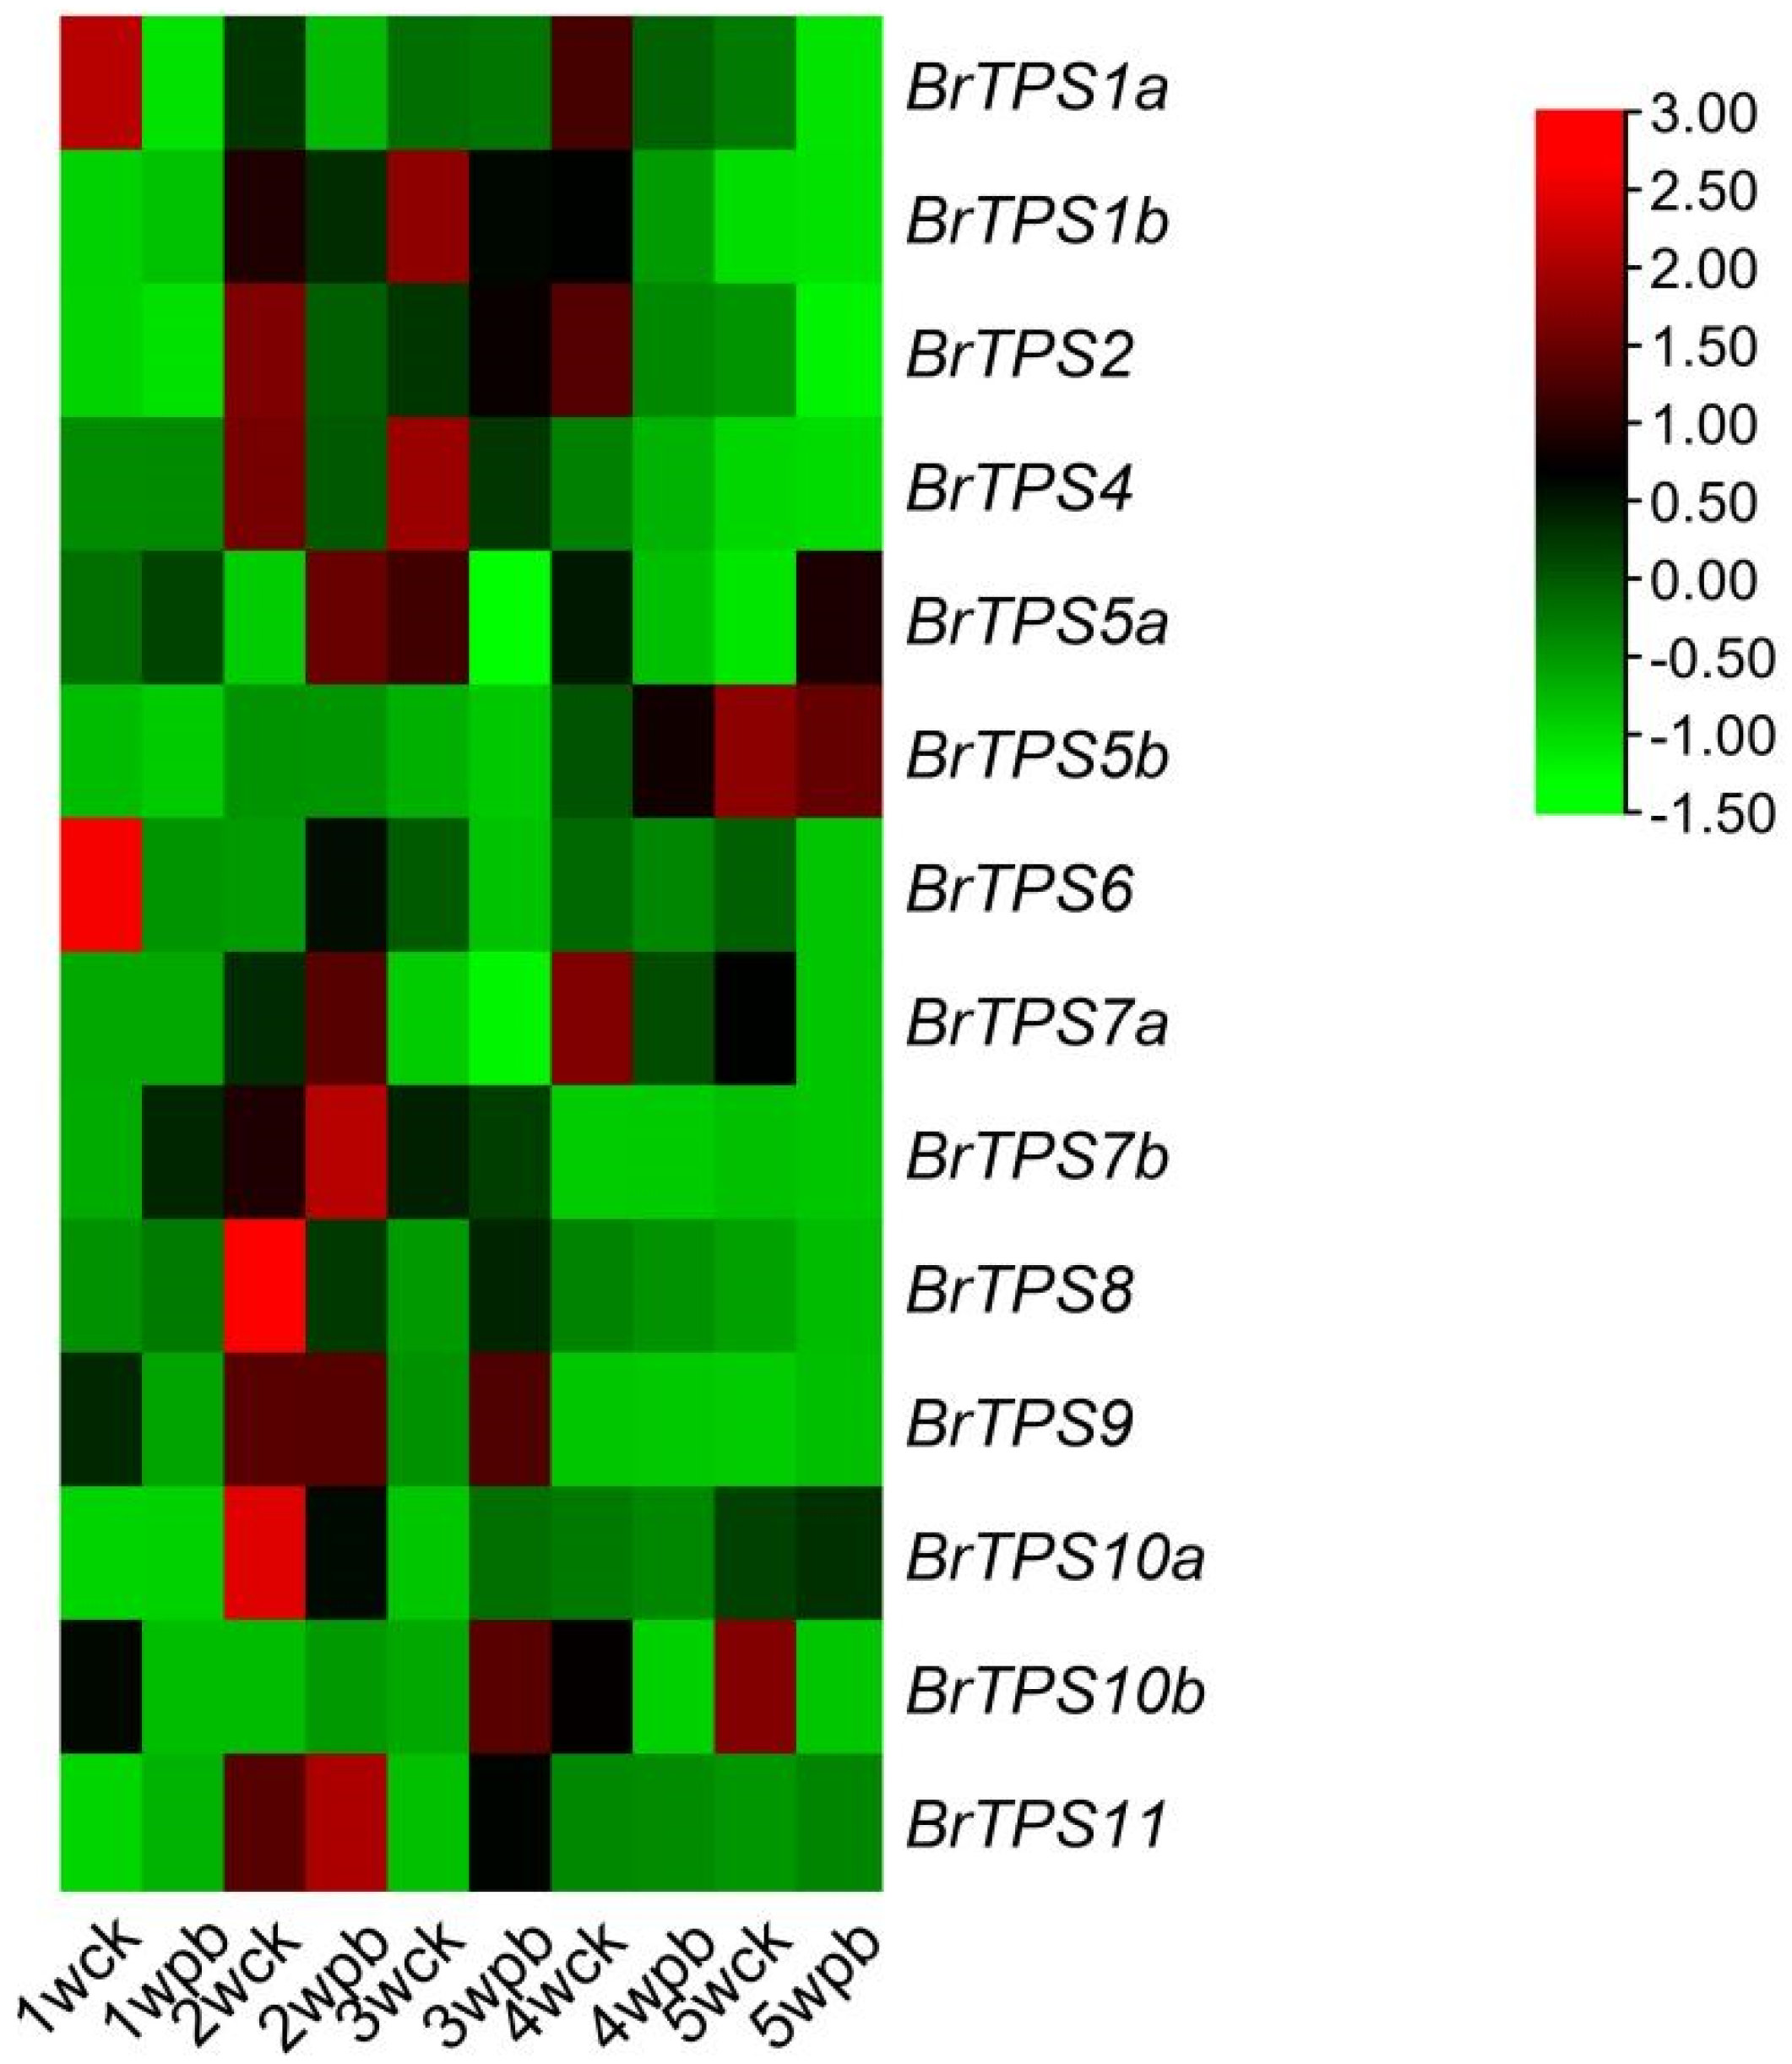
To further explore the role of BrTPS genes responsive to P. brassicae infection, the expression patterns of 14 BrTPSs were determined in the roots of Chinese cabbage from 1 to 5 wpi using qRT-PCR (Figure 7). Generally, BrTPS genes exhibited distinct time-specific expression profiles, suggesting the functional divergence of BrTPS genes at different stages during growth and development. We found that most of the genes were highly expressed at 1 to 3 wpi but downregulated at 4 to 5 wpi by investigating the differences in the expression of these 14 BrTPS at five stages after infection with P. brassicae between the Ck and Pb plants. At 1 wpi, the expression levels of four genes (BrTPS1b, BrTPS5a, BrTPS7b, and BrTPS11) in Pb plants were significantly higher than those in Ck plants; at 2 wpi, the expression levels of six genes (BrTPS5a, BrTPS6, BrTPS7a, BrTPs7b, BrTPs10b, and BrTPS11) in Pb plants were significantly higher than those in Ck plants; at 3 wpi, the expression levels of six genes (BrTPS2, BrTPS8, BrTPS9, BrTPs10a, BrTPs10b, and BrTPS11) in Pb plants were upregulated than those in Ck plants. Interestingly, only BrTPS5b and BrTPS5a were upregulated at 4 and 5 wpi, compared to Ck plants. Since trehalose was mainly accumulated at 4 to 5 wpi, it was worth noting that although BrTPS5a was upregulated relative to CK plants at 5 wpi, it has a higher expression at 2 wpi, and trehalose did not accumulate in a large amount at that time; similarly, we also noticed that the expression of BrTPS5b in Ck plants was higher than that in Pb plants at 5 wpi. Therefore, we speculated that BrTPS genes may play little role in trehalose synthesis.

2.8. Expression Analyses of PbTPS Genes

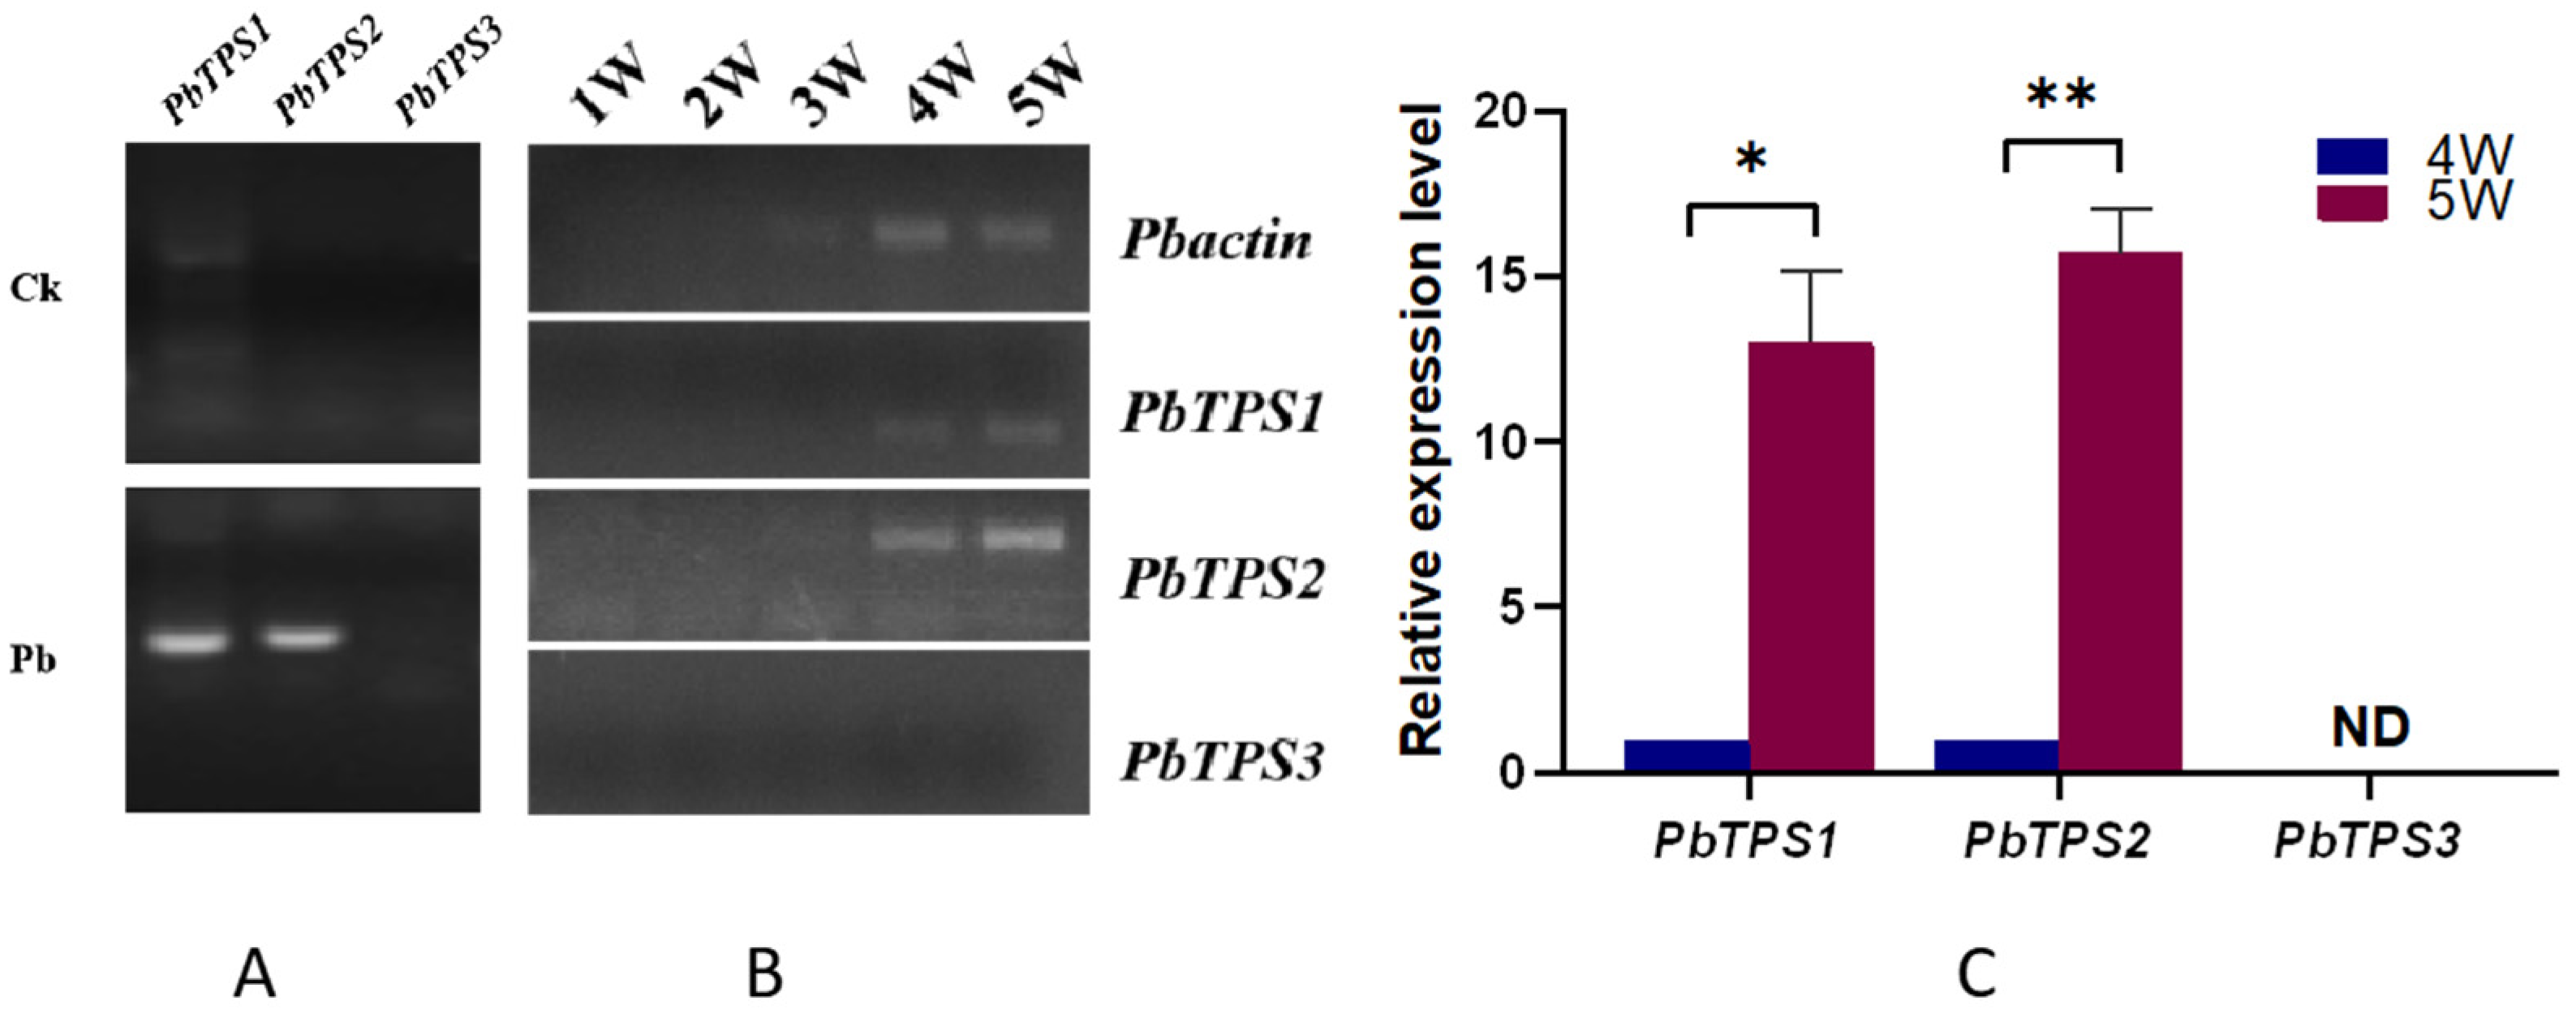
To determine the role of PbTPS genes correlated with the accumulation of trehalose, a semi-quantitative PCR analysis was carried out in the root samples of Pb and Ck plants to analyze the expression of the three PbTPS genes. PbTPS genes were amplified only in Pb plants (Figure 8A). A semi-quantitative PCR analysis of PbTPSs was carried out at the five stages (from 1 to 5 wpi) after inoculation. The transcripts were detected in the fourth and fifth weeks after inoculation, while the PbTPS3 gene was not detected at any stage (Figure 8B). Quantitative RT-PCR showed that PbTPS1 and PbTPS2 were significantly upregulated from 4 to 5 wpi. Specifically, PbTPS2 had the highest expression level, which was increased by more than 10-fold (Figure 8C).

3. Discussion

Plant pathogens tend to alter carbohydrate transport and distribution in host tissues, a process involving different types of sugars [42,43]. It has been proposed that the pathogen attempts to manipulate the carbohydrate metabolism of the host in the pathogen’s favor [44]. Previous studies have shown the accumulation of soluble sugars in Chinese cabbage tissues after P. brassicae infection, suggesting that P. brassicae infection could trigger active sugar translocation between the sugar-producing tissues and the clubbed tissue [45]. In addition, a previous study reported a significant accumulation of trehalose in Arabidopsis roots and hypocotyls after P. brassicae infection. In this study, we observed that the contents of trehalose were significantly increased in Chinese cabbage clubroots at 5 wpi, a 1000-fold increase compared to control plants. Almost no trehalose was detected in infected plants at 2 and 3 wpi, indicating that trehalose was mainly synthesized during the later stages of clubroot development. Simultaneously, smaller amounts of trehalose were also found in healthy plants, indicating that plants are capable of synthesizing small amounts of trehalose during growth and development. This result was consistent with previous reports that trehalose accumulates in the roots and hypocotyls of infected Arabidopsis [41].
TPS is the primary enzyme responsible for catalyzing the trehalose formation; therefore, elucidating the role of TPS genes in trehalose biosynthesis and their identification and analysis in both host plants and P. brassicae are of interest. Genes encoding TPS have been identified in many plants in the form of a gene family [46]. The Arabidopsis TPS gene family contains 11 members (AtTPS1–11) [16], rice contains 11 members (OsTPS1–11) [26], tomato contains 10 members (SlTPS1–10) [47], and watermelon contains 7 members (ClTPS1–7) [3]. However, the TPS gene family in B. rapa and P. brassicae has not been well studied. Herein, 14 BrTPS genes were identified in the B. rapa genome, and 3 PbTPS genes were identified in the P. brassicae genome. According to their gene structure and enzyme activity, the TPS family of genes in plants are classified into two major clades: Clades I and II. In the Arabidopsis genome, four genes belong to Clade I (AtTPS1–4) and seven to Clade II (AtTPS5–11) [25]. Brassica rapa TPS genes were also divided into two subfamilies: Clades I (BrTPS1a to BrTPS4) and II (BrTPS5a to BrTPS11), which was consistent with the classification in Arabidopsis [25] and rice [26]. There were 14 BrTPS genes, which was greater than the number of genes in A. thaliana and rice. In addition, Arabidopsis, a species closely related to the Brassica genus, contained more TPS genes than B. rapa, suggesting that there may be functional redundancy or divarication between the TPS members. However, the occurrence of gene loss during polyploid speciation was also found in the B. rapa genome corresponding to Arabidopsis TPS genes. For example, the AtTPS3 homolog was absent in the B. rapa genome. Some traits differed between the two BrTPS clades, such as in gene structure and gene length, but especially the gene structure. We observed that the structure of the BrTPS genes in Clades I and II was very different, and the number of introns and exons in Clade I was significantly greater than that in Clade II. Previous studies have suggested three mechanisms (exon/intron gain/loss, exonization/pseudoexonization, and insertion/deletion) that may lead to differences in gene structure [48], and a close relationship between the structure and function of genes has been observed [49]. Moreover, it was stated that the exon/intron number could affect the expression level; genes with fewer introns might be quickly induced [50,51]. Therefore, the BrTPS genes in Clades I and II may have experienced functional differentiation during evolution. Domain analysis showed that most BrTPS proteins had a TPS domain (Glyco_transf_20) at the N-terminus and a TPP domain (Trehalose_PPase) at the C-terminus, which was consistent with the results of other studies [11,16,27,46]. However, BrTPS5a contains only a Trehalose_PPase domain. Similarly, three GhTPS proteins (GhTPS6, GhTPS4, and GhTPS9) in cotton also lack a TPP domain [11], and the loss of the domain may be the result of evolution [46]. Conserved motif analysis demonstrated that the conserved number of BrTPS5a and BrTPS7a was less than that of the other BrTPSs, which may be related to the length of the genes. As for PbTPSs, there was no significant difference in the gene structure and conserved motif of the three PbTPSs, and all possessed a TPS domain at the N-terminal and a TPP domain at the C-terminal. Cis-acting elements were involved in the regulation of gene expression [46]. Previous studies have shown that TPS genes provide stress tolerance in different plant species. For example, plants overexpressing AtTPS1 improved drought resistance in Arabidopsis [52]. Overexpression of OsTPS8 was adequate to confer enhanced salinity tolerance [53], and watermelon ClTPS3 overexpression in Arabidopsis thaliana significantly improved salt tolerance [3]. In this study, a variety of signal response elements were contained in the promoter regions of BrTPS genes. Moreover, many BrTPS genes contain different stress response elements, indicating that BrTPS genes are involved in stress defense processes.
Trehalose is not only used as a stored energy but also serve as a protectant, when encountering drought, cold, osmotic stress, oxidation, and other stress conditions [5]. To determine whether large amounts of trehalose were synthesized by the host or P. brassicae, we examined the expression patterns of BrTPS and PbTPS genes under P. brassicae stress. At 4 and 5 wpi, the expression level of most BrTPS genes in Pb plants was not significantly higher than that in Ck plants, except for BrTPS5a and BrTPS5b. Although the expression level of BrTPS5a in Pb plants was higher than that in Ck at 5 wpi, its expression level was still lower than that at 2 wpi, in which trehalose did not accumulate. Therefore, the substantial accumulation of trehalose is likely not due to synthesis within the host plant. According to a previous study, the resting spores of P. brassicae were detected to contain 14.7 mg/g dry weight of trehalose, which was much higher than that of the infected Arabidopsis tissue, which indicated that P. brassicae is capable of synthesizing a large amount of trehalose. This result correlated with the expression of PbTPS1 in resting spores [41]. Here, we identified other TPS genes in P. brassicae and analyzed PbTPS gene expression patterns, showing that PbTPS3 was not expressed and that PbTPS1 and PbTPS2 were significantly upregulated from 4 to 5 wpi. Our results are consistent with the previous study and further confirm the view that increased trehalose is probably synthesized by pathogens rather than by the host plant. Most fungi and bacteria produce trehalose, and the virulence of some of these plant pathogens is dependent on their trehalose metabolism [10,38,54]. In addition, trehalose plays a key role in protecting bacteria and fungi against a range of stressors [55] and is abundant in the spores of fungi and yeast. For example, more than 7% trehalose and trace amounts of glucose were found on a dry-weight basis in the spores and macrocysts of Dictyostelium mucoroides but not in other lifecycle stages; thus, trehalose restricted in the spores and macrocysts was utilized as energy for germination [56]. Furthermore, trehalose in Neurospora tetrasperma served to activate the ascospores [57]. Similarly, trehalose in P. brassicae may be used as a stress protectant to protect the resting spores of P. brassicae from various stressors. The resting spores of P. brassicae have been reported to survive in the soil for decades [58], perhaps because excess energy allows the germination of resting spores in P. brassicae.
In summary, a large amount of trehalose accumulated in the roots of B. rapa during clubroot development. We identified 14 BrTPS genes from B. rapa and 3 PbTPS genes from P. brassicae. The phylogenetic analysis and gene structure, conserved motif, and cis-acting element analyses of BrTPS genes were performed. Expression analysis showed that most BrTPS genes were not significantly induced by P. brassicae infection, but the expression of the three PbTPS genes of P. brassicae was upregulated. Therefore, much of the accumulated trehalose most likely originated from the pathogen, and the trehalose in the resting spores of P. brassicae may serve as energy for germination.

4. Materials and Methods

4.1. Plant Material and P. brassicae Inoculation

The Chinese cabbage susceptible variety “BJN3-2” was used as a host and maintained in the culture room under a 16 h light/8 h dark photoperiod at 25 °C. Chinese cabbage plant material was sown in the greenhouse of Shenyang Agricultural University in May under natural conditions. The P. brassicae resting spores of a single-spore isolate (Pb4) were collected from clubbed roots and diluted to a density of 1 × 10⁷ spores/mL with sterile distilled water until inoculation. “BJN3-2” and the single-spore isolate (Pb4) of P. brassicae were preserved in the Laboratory of Vegetable Molecular Biology, College of Horticulture, Shenyang Agricultural University. The roots of 2-week-old cabbage seedlings were inoculated with 1 mL of a resting spore suspension, and plants inoculated with an equal volume of distilled water were used as controls. Plants were sampled and analyzed at 5 time points (from the first week to the fifth week) after inoculation. Each treatment was carried out with three biological replicates, and each replicate contained eight plants.

4.2. Soluble Sugar Extraction and Trehalose Content Determination

Soluble sugars were extracted from the roots of Chinese cabbage at weeks 2, 3, 4, and 5 after P. brassicae inoculation according to the previous method [45]. The GC-MS QP2010 ultra instrument (Shimadzu, Kyoto, Japan) was used for the gas quality analyses. The detailed setting information is as follows: the inlet temperature was 300 °C, the split ratio was 10:1, the carrier gas was high-purity helium, and the flow rate was 1 mL/min. The heating program was as follows: 120 °C for 3 min, 5 °C/min to 210 °C for 5 min, and 15 °C/min to 300 °C for 10 min. The ion source temperature was 200 °C, and the interface temperature was 280 °C. The solvent removal time was 3 min, and the scanning m/z was 45–500. Soluble sugars were extracted from three biological replicates at each time point. Gas quality analyses were repeated three times for each treatment.

4.3. Identification of TPS Genes in B. rapa and P. brassicae

To identify the TPS genes in the B. rapa genome, amino acid sequences of 11 A. thaliana Please use consistent spacing around headers. TPS (AtTPS) genes were selected as bait to search the B. rapa database (http://brassicadb.cn/#/) (accessed on 9 June 2021) by performing a BLASTP analysis. The paralogous genes of BrTPSs were named according to the level of sequence similarity with the corresponding genes in AtTPSs, and a suffix (a, b, c, etc.) was added to the gene according to the E-value from high to low. The TPS genes of P. brassicae were screened using the keywords “Plasmodiophora brassicae trehalose-6-phosphate synthase” from the whole genome sequencing data of P. brassicae in the National Center for Biotechnology Information database (NCBI) (https://www.ncbi.nlm.nih.gov/) (accessed on 5 May 2022) [59,60,61,62]. The Conserved Domains database (http://pfam.xfam.org/) (accessed on 5 May 2022) was used to ensure that all candidate TPSs contained the TPS domain. Proteins that contained typical domains (Glyco_transf_20 or Trehalose_PPase) were selected. The physicochemical parameters, including isoelectric points (pI) and molecular weight (kDa), were calculated using the online ExPASy2 database (https://www.expasy.org/resources/compute-pi-mw) (accessed on 10 May 2022). Subcellular localization prediction was performed using Cell-PLoc 2.0 (http://www.csbio.sjtu.edu.cn/bioinf/Cell-PLoc-2/) (accessed on 10 May 2022).

4.4. BrTPS and PbTPS Phylogenetic Evolution Analysis

The TPS protein sequences of Arabidopsis were downloaded from the Arabidopsis genome database (https://www.arabidopsis.org/index.jsp) (accessed on 9 June 2021). Brassica napus and Brassica oleracea TPS protein sequences were downloaded from the BRAD database (http://brassicadb.cn/#/) (accessed on 9 June 2021). The TPS genes in Arabidopsis, B. napus, B. oleracea, B. rapa, and P. brassicae were named AtTPSs, BnTPSs, BoTPSs, BrTPSs, and PbTPSs, respectively. Other organisms’ TPS protein sequences were subjected to protein BLAST in NCBI’s nr database (Non-Redundant Protein Sequence Database). All TPS protein sequences were used for phylogenetic analysis. Multiple sequence alignment of all TPS protein sequences was conducted with the ClustalW program [63]. An unrooted neighbor-joining (NJ) phylogenetic tree was constructed using MEGA6 [64] software with a bootstrap test of 1000 replicates.

4.5. Analysis of BrTPS and PbTPS Gene Structures and Conserved Motifs

The exon–intron structures of the BrTPS and PbTPS genes were identified using the Gene Structure Display Server (GSDS, http://gsds.cbi.-pku.edu.cn/) (accessed on 11 May 2022) [65]. The putative conserved motifs of BrTPS and PbTPS proteins were then identified by online MEME tool (http://meme-suite.org/tools/meme) (accessed on 11 May 2022). Protein sequences were analyzed using the MEME program with any number of repetitions. The maximum retrieval value for the motif was set to 10, and the other parameters were set to default. The conserved domains were visualized using the TBtools software package (http://www.tbtools.com/) (accessed on 11 May 2022) [66].

4.6. Chromosomal Location and Cis-Acting Element Analysis of BrTPS Genes

The chromosomal positions of the BrTPSs genes were acquired from the BRAD database (http://brassicadb.cn/#/) (accessed on 11 May 2022). MapChart software [67] was used to map BrTPS genes’ chromosomal positions and relative distances; the 2 kb sequences in the BrTPS genes’ upstream region were obtained using the BRAD database (http://brassicadb.cn/#/) (accessed on 12 May 2022). Subsequently, the online tool PlantCARE (http://bioinformatics.psb.ugent.be/webtools/plantcare/html/) (accessed on 12 May 2022) was employed to investigate putative cis-regulatory elements in the promoter region of BrTPS genes in B. rapa. TBtools [66] software was used to visualize these cis-regulatory elements.

4.7. Total RNA Extraction and Quantitative Real-Time PCR

RNA was extracted from Chinese cabbage roots using Trizol reagent (Tiangen, Beijing, China) according to the manufacturer’s protocol. First-strand cDNA was obtained using reverse transcription performed with MonScript™ RTIII Super Mix (Monad, China). Quantitative real-time RT-PCR was performed using the SYBR® Green Premix Pro Taq HS qPCR Kit AG11701 (Accurate Biotechnology, Changsha, China). For reference genes, 18s and Pbactin were used for B. rapa. and P. brassicae, respectively. PCR reactions were carried out in triplicate with three independent RNA samples, and the primers were synthesized by Hongxun Biological Company (Suzhou, China) and are listed in Supplementary Table S1. The 2−ΔΔCt [68] method was used to analyze the relative gene expression level.

4.8. Statistical Analysis

The data are presented as the means ± SDs (standard deviations). Other statistical evaluations and significance tests were performed via Student’s t-tests with the SPSS statistical software (Version 19.0; SPSS, Inc., Chicago, IL, USA). The data were graphically analyzed using GraphPad Prism V8.0.2 (San Diego, CA, USA).

Supplementary Materials

The following supporting information can be downloaded at: https://www.mdpi.com/article/10.3390/ijms24020929/s1.

Author Contributions

L.K. performed the experiments, analyzed the data, and drafted the manuscript. J.L., W.Z., X.L., Y.Z. and X.C. participated in certain experiments. Z.Z. and Z.P. contributed to the conception and design of this study. All authors have read and agreed to the published version of the manuscript.

Funding

This work was supported by the National Natural Science Youth Fund of China (No. 32202480), the China Agriculture Research System of MOF and MARA (CARS-12), and the LiaoNing Revitalization Talents Program (XLYC2002034).

Institutional Review Board Statement

Not applicable.

Informed Consent Statement

Not applicable.

Data Availability Statement

Not applicable.

Conflicts of Interest

The authors declare no conflict of interest.

References

  1. Jin, Q.; Hu, X.; Li, X.; Wang, B.; Wang, Y.; Jiang, H.; Mattson, N.; Xu, Y. Genome-Wide Identification and Evolution Analysis of Trehalose-6-Phosphate Synthase Gene Family in Nelumbo nucifera. Front Plant Sci. 2016, 7, 1445. [Google Scholar] [CrossRef] [Green Version]
  2. Park, M.; Mitchell, W.J.; Rafii, F. Effect of Trehalose and Trehalose Transport on the Tolerance of Clostridium perfringens to Environmental Stress in a Wild Type Strain and Its Fluoroquinolone-Resistant Mutant. Int. J. Microbiol. 2016, 2016, 4829716. [Google Scholar] [CrossRef] [PubMed] [Green Version]
  3. Yuan, G.; Liu, J.; An, G.; Li, W.; Si, W.; Sun, D.; Zhu, Y. Genome-Wide Identification and Characterization of the Trehalose-6-phosphate Synthetase (TPS) Gene Family in Watermelon (Citrullus lanatus) and Their Transcriptional Responses to Salt Stress. Int. J. Mol. Sci. 2021, 23, 276. [Google Scholar] [CrossRef]
  4. Vanaporn, M.; Titball, R.W. Trehalose and bacterial virulence. Virulence 2020, 11, 1192–1202. [Google Scholar] [CrossRef] [PubMed]
  5. Elbein, A.D.; Pan, Y.T.; Pastuszak, I.; Carroll, D. New insights on trehalose: A multifunctional molecule. Glycobiology 2003, 13, 17r–27r. [Google Scholar] [CrossRef] [PubMed]
  6. Streeter, J.G.; Bhagwat, A. Biosynthesis of trehalose from maltooligosaccharides in Rhizobia. Can. J. Microbiol. 1999, 45, 716–721. [Google Scholar] [CrossRef] [PubMed]
  7. Wannet, W.J.; Op den Camp, H.J.; Wisselink, H.W.; van der Drift, C.; Van Griensven, L.J.; Vogels, G.D. Purification and characterization of trehalose phosphorylase from the commercial mushroom Agaricus bisporus. Biochim. Biophys. Acta 1998, 1425, 177–188. [Google Scholar] [CrossRef] [PubMed]
  8. Schiraldi, C.; Di Lernia, I.; De Rosa, M. Trehalose production: Exploiting novel approaches. Trends Biotechnol. 2002, 20, 420–425. [Google Scholar] [CrossRef] [PubMed]
  9. Qu, Q.; Lee, S.J.; Boos, W. TreT, a novel trehalose glycosyltransferring synthase of the hyperthermophilic archaeon Thermococcus litoralis. J. Biol. Chem. 2004, 279, 47890–47897. [Google Scholar] [CrossRef] [Green Version]
  10. Lunn, J.E.; Delorge, I.; Figueroa, C.M.; Van Dijck, P.; Stitt, M. Trehalose metabolism in plants. Plant J. 2014, 79, 544–567. [Google Scholar] [CrossRef]
  11. Mu, M.; Lu, X.K.; Wang, J.J.; Wang, D.L.; Yin, Z.J.; Wang, S.; Fan, W.-L.; Ye, W.W. Genome-wide Identification and analysis of the stress-resistance function of the TPS (Trehalose-6-Phosphate Synthase) gene family in cotton. BMC Genet. 2016, 17, 1–11. [Google Scholar]
  12. Tsusaki, K.; Nishimoto, T.; Nakada, T.; Kubota, M.; Chaen, H.; Sugimoto, T.; Kurimoto, M. Cloning and sequencing of trehalose synthase gene from Pimelobacter sp. R48. Biochim. Et Biophys. Acta (BBA)-Gen. Subj. 1996, 1290, 1–3. [Google Scholar] [CrossRef]
  13. Thammahong, A.; Puttikamonkul, S.; Perfect, J.R.; Brennan, R.G.; Cramer, R.A. Central Role of the Trehalose Biosynthesis Pathway in the Pathogenesis of Human Fungal Infections: Opportunities and Challenges for Therapeutic Development. Microbiol. Mol. Biol. Rev. 2017, 81, e00053-16. [Google Scholar] [CrossRef] [Green Version]
  14. García, M.D.; Argüelles, J.C. Trehalase inhibition by validamycin A may be a promising target to design new fungicides and insecticides. Pest Manag. Sci. 2021, 77, 3832–3835. [Google Scholar] [CrossRef]
  15. Tang, B.; Wang, S.; Wang, S.G.; Wang, H.J.; Zhang, J.Y.; Cui, S.Y. Invertebrate Trehalose-6-Phosphate Synthase Gene: Genetic Architecture, Biochemistry, Physiological Function, and Potential Applications. Front. Physiol. 2018, 9, 30. [Google Scholar] [CrossRef] [Green Version]
  16. Yang, H.L.; Liu, Y.J.; Wang, C.L.; Zeng, Q.Y. Molecular Evolution of Trehalose-6-Phosphate Synthase (TPS) Gene Family in Populus, Arabidopsis and Rice. PLoS ONE 2012, 7, e42438. [Google Scholar] [CrossRef]
  17. Kaasen, I.; Falkenberg, P.; Styrvold, O.B.; Strøm, A. Molecular cloning and physical mapping of the otsBA genes, which encode the osmoregulatory trehalose pathway of Escherichia coli: Evidence that transcription is activated by katF (AppR). J. Bacteriol. 1992, 174, 3422. [Google Scholar] [CrossRef] [Green Version]
  18. Vicente, R.L.; Spina, L.; Gómez, J.P.L.; Dejean, S.; Parrou, J.L.; François, J.M. Trehalose-6-phosphate promotes fermentation and glucose repression in Saccharomyces cerevisiae. Microb. Cell 2018, 5, 444–459. [Google Scholar] [CrossRef]
  19. Chen, Q.; Ma, E.; Behar, K.L.; Xu, T.; Haddad, G.G. Role of Trehalose Phosphate Synthase in Anoxia Tolerance and Development in Drosophila melanogaster. J. Biol. Chem. 2002, 277, 3274–3279. [Google Scholar] [CrossRef] [Green Version]
  20. Xu, J.; Bao, B.; Zhang, Z.F.; Yi, Y.Z.; Xu, W.H. Identification of a novel gene encoding the trehalose phosphate synthase in the cotton bollworm, Helicoverpa armigera. Glycobiology 2009, 19, 250–257. [Google Scholar] [CrossRef] [Green Version]
  21. Tang, B.; Chen, J.; Yao, Q.; Pan, Z.; Xu, W.; Wang, S.; Zhang, W. Characterization of a trehalose-6-phosphate synthase gene from Spodoptera exigua and its function identification through RNA interference. J. Insect Physiol. 2010, 56, 813–821. [Google Scholar] [CrossRef]
  22. Paul, M.J.; Primavesi, L.F.; Jhurreea, D.; Zhang, Y. Trehalose metabolism and signaling. Annu. Rev. Plant Biol. 2008, 59, 417–441. [Google Scholar] [CrossRef] [Green Version]
  23. Zhao, S.M.; Fu, F.L.; Gou, L.; Wang, H.G.; He, G.; Li, W.C. Cloning and truncation modification of trehalose-6-phosphate synthase gene from Selaginella pulvinata. Gene 2013, 512, 414–421. [Google Scholar] [CrossRef]
  24. Engelhardt, C.; Petereit, F.; Lechtenberg, M.; Liefländer-Wulf, U.; Hensel, A. Qualitative and quantitative phytochemical characterization of Myrothamnus flabellifolia Welw. Fitoterapia 2016, 114, 69–80. [Google Scholar] [CrossRef]
  25. Vandesteene, L.; López-Galvis, L.; Vanneste, K.; Feil, R.; Maere, S.; Lammens, W.; Rolland, F.; Lunn, J.E.; Avonce, N.; Beeckman, T.; et al. Expansive Evolution of the TREHALOSE-6-PHOSPHATE PHOSPHATASE Gene Family in Arabidopsis. Plant Physiol. 2012, 160, 884–896. [Google Scholar] [CrossRef] [Green Version]
  26. Zang, B.; Li, H.; Li, W.; Deng, X.W.; Wang, X. Analysis of trehalose-6-phosphate synthase (TPS) gene family suggests the formation of TPS complexes in rice. Plant Mol. Biol. 2011, 76, 507–522. [Google Scholar] [CrossRef]
  27. Vandesteene, L.; Ramon, M.; Roy, K.L.; Dijck, P.V.; Rolland, F. A single active trehalose-6-P synthase (TPS) and a family of putative regulatory TPS-like proteins in Arabidopsis. Mol. Plant 2010, 3, 406–419. [Google Scholar] [CrossRef]
  28. Morabito, C.; Secchi, F.; Schubert, A. Grapevine TPS (trehalose-6-phosphate synthase) family genes are differentially regulated during development, upon sugar treatment and drought stress. Plant Physiol. Biochem. 2021, 164, 54–62. [Google Scholar] [CrossRef]
  29. Tian, L.; Xie, Z.; Lu, C.; Hao, X.; Wu, S.; Huang, Y.; Li, D.; Chen, L. The trehalose-6-phosphate synthase TPS5 negatively regulates ABA signaling in Arabidopsis thaliana. Plant Cell Rep. 2019, 38, 869–882. [Google Scholar] [CrossRef]
  30. Eastmond, P.J.; van Dijken, A.J.; Spielman, M.; Kerr, A.; Tissier, A.F.; Dickinson, H.G.; Jones, J.D.; Smeekens, S.C.; Graham, I.A. Trehalose-6-phosphate synthase 1, which catalyses the first step in trehalose synthesis, is essential for Arabidopsis embryo maturation. Plant J. 2002, 29, 225–235. [Google Scholar] [CrossRef]
  31. Wang, S.; Ouyang, K.; Wang, K. Genome-Wide Identification, Evolution, and Expression Analysis of TPS and TPP Gene Families in Brachypodium distachyon. Plants 2019, 8, 362. [Google Scholar] [CrossRef] [PubMed]
  32. Avonce, N.; Mendoza-Vargas, A.; Morett, E.; Iturriaga, G. Insights on the evolution of trehalose biosynthesis. BMC Evol. Biol. 2006, 6, 109. [Google Scholar] [CrossRef] [Green Version]
  33. Wegener, G.; Macho, C.; Schlöder, P.; Kamp, G.; Ando, O. Long-term effects of the trehalase inhibitor trehazolin on trehalase activity in locust flight muscle. J. Exp. Biol. 2010, 213, 3852–3857. [Google Scholar] [CrossRef] [Green Version]
  34. Pampurova, S.; Verschooten, K.; Avonce, N.; Van Dijck, P. Functional screening of a cDNA library from the desiccation-tolerant plant Selaginella lepidophylla in yeast mutants identifies trehalose biosynthesis genes of plant and microbial origin. J. Plant Res. 2014, 127, 803–813. [Google Scholar] [CrossRef] [Green Version]
  35. Schluepmann, H.; van Dijken, A.; Aghdasi, M.; Wobbes, B.; Paul, M.; Smeekens, S. Trehalose mediated growth inhibition of Arabidopsis seedlings is due to trehalose-6-phosphate accumulation. Plant Physiol. 2004, 135, 879–890. [Google Scholar] [CrossRef] [Green Version]
  36. O’Hara, L.E.; Paul, M.J.; Wingler, A. How do sugars regulate plant growth and development? New insight into the role of trehalose-6-phosphate. Mol. Plant 2013, 6, 261–274. [Google Scholar] [CrossRef] [Green Version]
  37. Argüelles, J.C. Physiological roles of trehalose in bacteria and yeasts: A comparative analysis. Arch. Microbiol. 2000, 174, 217–224. [Google Scholar] [CrossRef]
  38. Djonović, S.; Urbach, J.M.; Drenkard, E.; Bush, J.; Feinbaum, R.; Ausubel, J.L.; Traficante, D.; Risech, M.; Kocks, C.; Fischbach, M.A.; et al. Trehalose biosynthesis promotes Pseudomonas aeruginosa pathogenicity in plants. PLoS Pathog. 2013, 9, e1003217. [Google Scholar] [CrossRef] [Green Version]
  39. MacIntyre, A.M.; Barth, J.X.; Pellitteri Hahn, M.C.; Scarlett, C.O.; Genin, S.; Allen, C. Trehalose Synthesis Contributes to Osmotic Stress Tolerance and Virulence of the Bacterial Wilt Pathogen Ralstonia solanacearum. Mol. Plant Microbe. Interact. 2020, 33, 462–473. [Google Scholar] [CrossRef] [Green Version]
  40. Dixon, G.R. The biology of Plasmodiophora brassicae Wor.—A review of recent advances. Acta Hortic. 2006, 706, 271–282. [Google Scholar] [CrossRef]
  41. Brodmann, A.; Schuller, A.; Ludwig-Müller, J.; Aeschbacher, R.A.; Wiemken, A.; Boller, T.; Wingler, A. Induction of trehalase in Arabidopsis plants infected with the trehalose-producing pathogen Plasmodiophora brassicae. Mol Plant Microbe Interact. 2002, 15, 693–700. [Google Scholar] [CrossRef]
  42. Yuan, M.; Wang, S. Rice MtN3/saliva/SWEET family genes and their homologs in cellular organisms. Mol. Plant 2013, 6, 665–674. [Google Scholar] [CrossRef] [Green Version]
  43. Chen, L.Q.; Cheung, L.S.; Feng, L.; Tanner, W.; Frommer, W.B. Transport of sugars. Annu. Rev. Biochem. 2015, 84, 865–894. [Google Scholar] [CrossRef]
  44. Doidy, J.; Grace, E.; Kühn, C.; Simon-Plas, F.; Casieri, L.; Wipf, D. Sugar transporters in plants and in their interactions with fungi. Trends Plant Sci. 2012, 17, 413–422. [Google Scholar] [CrossRef]
  45. Li, H.; Li, X.; Xuan, Y.; Jiang, J.; Wei, Y.; Piao, Z. Genome Wide Identification and Expression Profiling of SWEET Genes Family Reveals Its Role during Plasmodiophora brassicae-Induced Formation of Clubroot in Brassica rapa. Front. Plant Sci. 2018, 9, 207. [Google Scholar] [CrossRef]
  46. Dan, Y.; Niu, Y.; Wang, C.; Yan, M.; Liao, W. Genome-wide identification and expression analysis of the trehalose-6-phosphate synthase (TPS) gene family in cucumber (Cucumis sativus L.). PeerJ 2021, 9, e11398. [Google Scholar] [CrossRef]
  47. Chen, Z.; Lou, J. Identification and expression of the trehalose-6-phosphate synthase gene family members in tomato exposed to different light spectra. Arch. Biol. Sci. 2017, 69, 93–101. [Google Scholar] [CrossRef]
  48. Xu, G.; Guo, C.; Shan, H.; Kong, H. Divergence of duplicate genes in exon-intron structure. Proc. Natl. Acad. Sci. USA 2012, 109, 1187–1192. [Google Scholar] [CrossRef] [PubMed] [Green Version]
  49. Yuan, G.; He, S.; Bian, S.; Han, X.; Liu, K.; Cong, P.; Zhang, C. Genome-wide identification and expression analysis of major latex protein (MLP) family genes in the apple (Malus domestica Borkh.) genome. Gene 2020, 733, 144275. [Google Scholar] [CrossRef] [PubMed]
  50. Koralewski, T.E.; Krutovsky, K.V. Evolution of exon-intron structure and alternative splicing. PLoS ONE 2011, 6, e18055. [Google Scholar] [CrossRef] [Green Version]
  51. Heidari, P.; Puresmaeli, F.; Mora-Poblete, F. Genome-Wide Identification and Molecular Evolution of the Magnesium Transporter (MGT) Gene Family in Citrullus lanatus and Cucumis sativus. Agronomy 2022, 12, 2253. [Google Scholar] [CrossRef]
  52. van Dijken, A.J.; Schluepmann, H.; Smeekens, S.C. Arabidopsis trehalose-6-phosphate synthase 1 is essential for normal vegetative growth and transition to flowering. Plant Physiol. 2004, 135, 969–977. [Google Scholar] [CrossRef] [PubMed] [Green Version]
  53. Vishal, B.; Krishnamurthy, P.; Ramamoorthy, R.; Kumar, P.P. OsTPS8 controls yield-related traits and confers salt stress tolerance in rice by enhancing suberin deposition. New Phytol. 2019, 221, 1369–1386. [Google Scholar] [CrossRef] [PubMed] [Green Version]
  54. Foster, A.J.; Jenkinson, J.M.; Talbot, N.J. Trehalose synthesis and metabolism are required at different stages of plant infection by Magnaporthe grisea. EMBO J. 2003, 22, 225–235. [Google Scholar] [CrossRef]
  55. Carlos, G.; Carmen-Lisset, F. The importance of a functional trehalose biosynthetic pathway for the life of yeasts and fungi. FEMS Yeast Res. 2010, 4, 351–359. [Google Scholar]
  56. Clegg, J.S.; Filosa, M.F. Trehalose in the Cellular Slime Mould Dictyostelium mucoroides. Nature 1961, 192, 1077–1078. [Google Scholar] [CrossRef]
  57. Sussman, A.S.; Lingappa, B.T. Role of Trehalose in Ascospores of Neurospora Tetrasperma. Science 1959, 130, 1343. [Google Scholar] [CrossRef]
  58. Hwang, S.F.; Strelkov, S.E.; Feng, J.; Gossen, B.D.; Howard, R.J. Plasmodiophora brassicae: A review of an emerging pathogen of the Canadian canola (Brassica napus) crop. Mol. Plant Pathol. 2012, 13, 105–113. [Google Scholar] [CrossRef]
  59. Sedaghatkish, A.; Gossen, B.D.; Yu, F.; Torkamaneh, D.; Mcdonald, M.R. Whole-genome DNA similarity and population structure of Plasmodiophora brassicae strains from Canada. BMC Genom. 2019, 20, 744. [Google Scholar] [CrossRef]
  60. Rolfe, S.A.; Strelkov, S.E.; Links, M.G.; Clarke, W.E.; Robinson, S.J.; Djavaheri, M.; Malinowski, R.; Haddadi, P.; Kagale, S.; Parkin, I.A.; et al. The compact genome of the plant pathogen Plasmodiophora brassicae is adapted to intracellular interactions with host Brassica spp. BMC Genom. 2016, 17, 272. [Google Scholar] [CrossRef] [Green Version]
  61. Bi, K.; He, Z.; Gao, Z.; Zhao, Y.; Fu, Y.; Cheng, J.; Xie, J.; Jiang, D.; Chen, T. Integrated omics study of lipid droplets from Plasmodiophora brassicae. Sci. Rep. 2016, 6, 36965. [Google Scholar] [CrossRef] [PubMed] [Green Version]
  62. Schwelm, A.; Fogelqvist, J.; Knaust, A.; Jülke, S.; Lilja, T.; Bonilla-Rosso, G.; Karlsson, M.; Shevchenko, A.; Dhandapani, V.; Choi, S.R.; et al. The Plasmodiophora brassicae genome reveals insights in its life cycle and ancestry of chitin synthases. Sci. Rep. 2015, 5, 11153. [Google Scholar] [CrossRef] [PubMed]
  63. Larkin, M.A.; Blackshields, G.; Brown, N.P.; Chenna, R.; Mcgettigan, P.A.; Mcwilliam, H.; Valentin, F.; Wallace, I.M.; Wilm, A.; Lopez, R. Clustal W and Clustal X version 2.0. Bioinformatics 2007, 23, 2947–2948. [Google Scholar] [CrossRef] [PubMed] [Green Version]
  64. Tamura, K.; Stecher, G.; Peterson, D.; Filipski, A.; Kumar, S. MEGA6: Molecular Evolutionary Genetics Analysis version 6.0. Mol. Biol. Evol. 2013, 30, 2725–2729. [Google Scholar] [CrossRef] [Green Version]
  65. Hu, B.; Jin, J.; Guo, A.Y.; Zhang, H.; Luo, J.; Gao, G. GSDS 2.0: An upgraded gene feature visualization server. Bioinformatics 2015, 31, 1296–1297. [Google Scholar] [CrossRef] [Green Version]
  66. Chen, C.; Rui, X.; Hao, C.; He, Y. TBtools, a Toolkit for Biologists integrating various HTS-data handling tools with a user-friendly interface. bioRxiv 2018. [Google Scholar] [CrossRef]
  67. Voorrips, R.E. MapChart: Software for the Graphical Presentation of Linkage Maps and QTLs. J. Hered. 2002, 93, 77–78. [Google Scholar] [CrossRef]
  68. Kenneth, J.L.; Thomas, D.S. Analysis of relative gene expression data using real-time quantitative PCR and the 2−ΔΔCT method. Methods 2002, 25, 402–408. [Google Scholar]
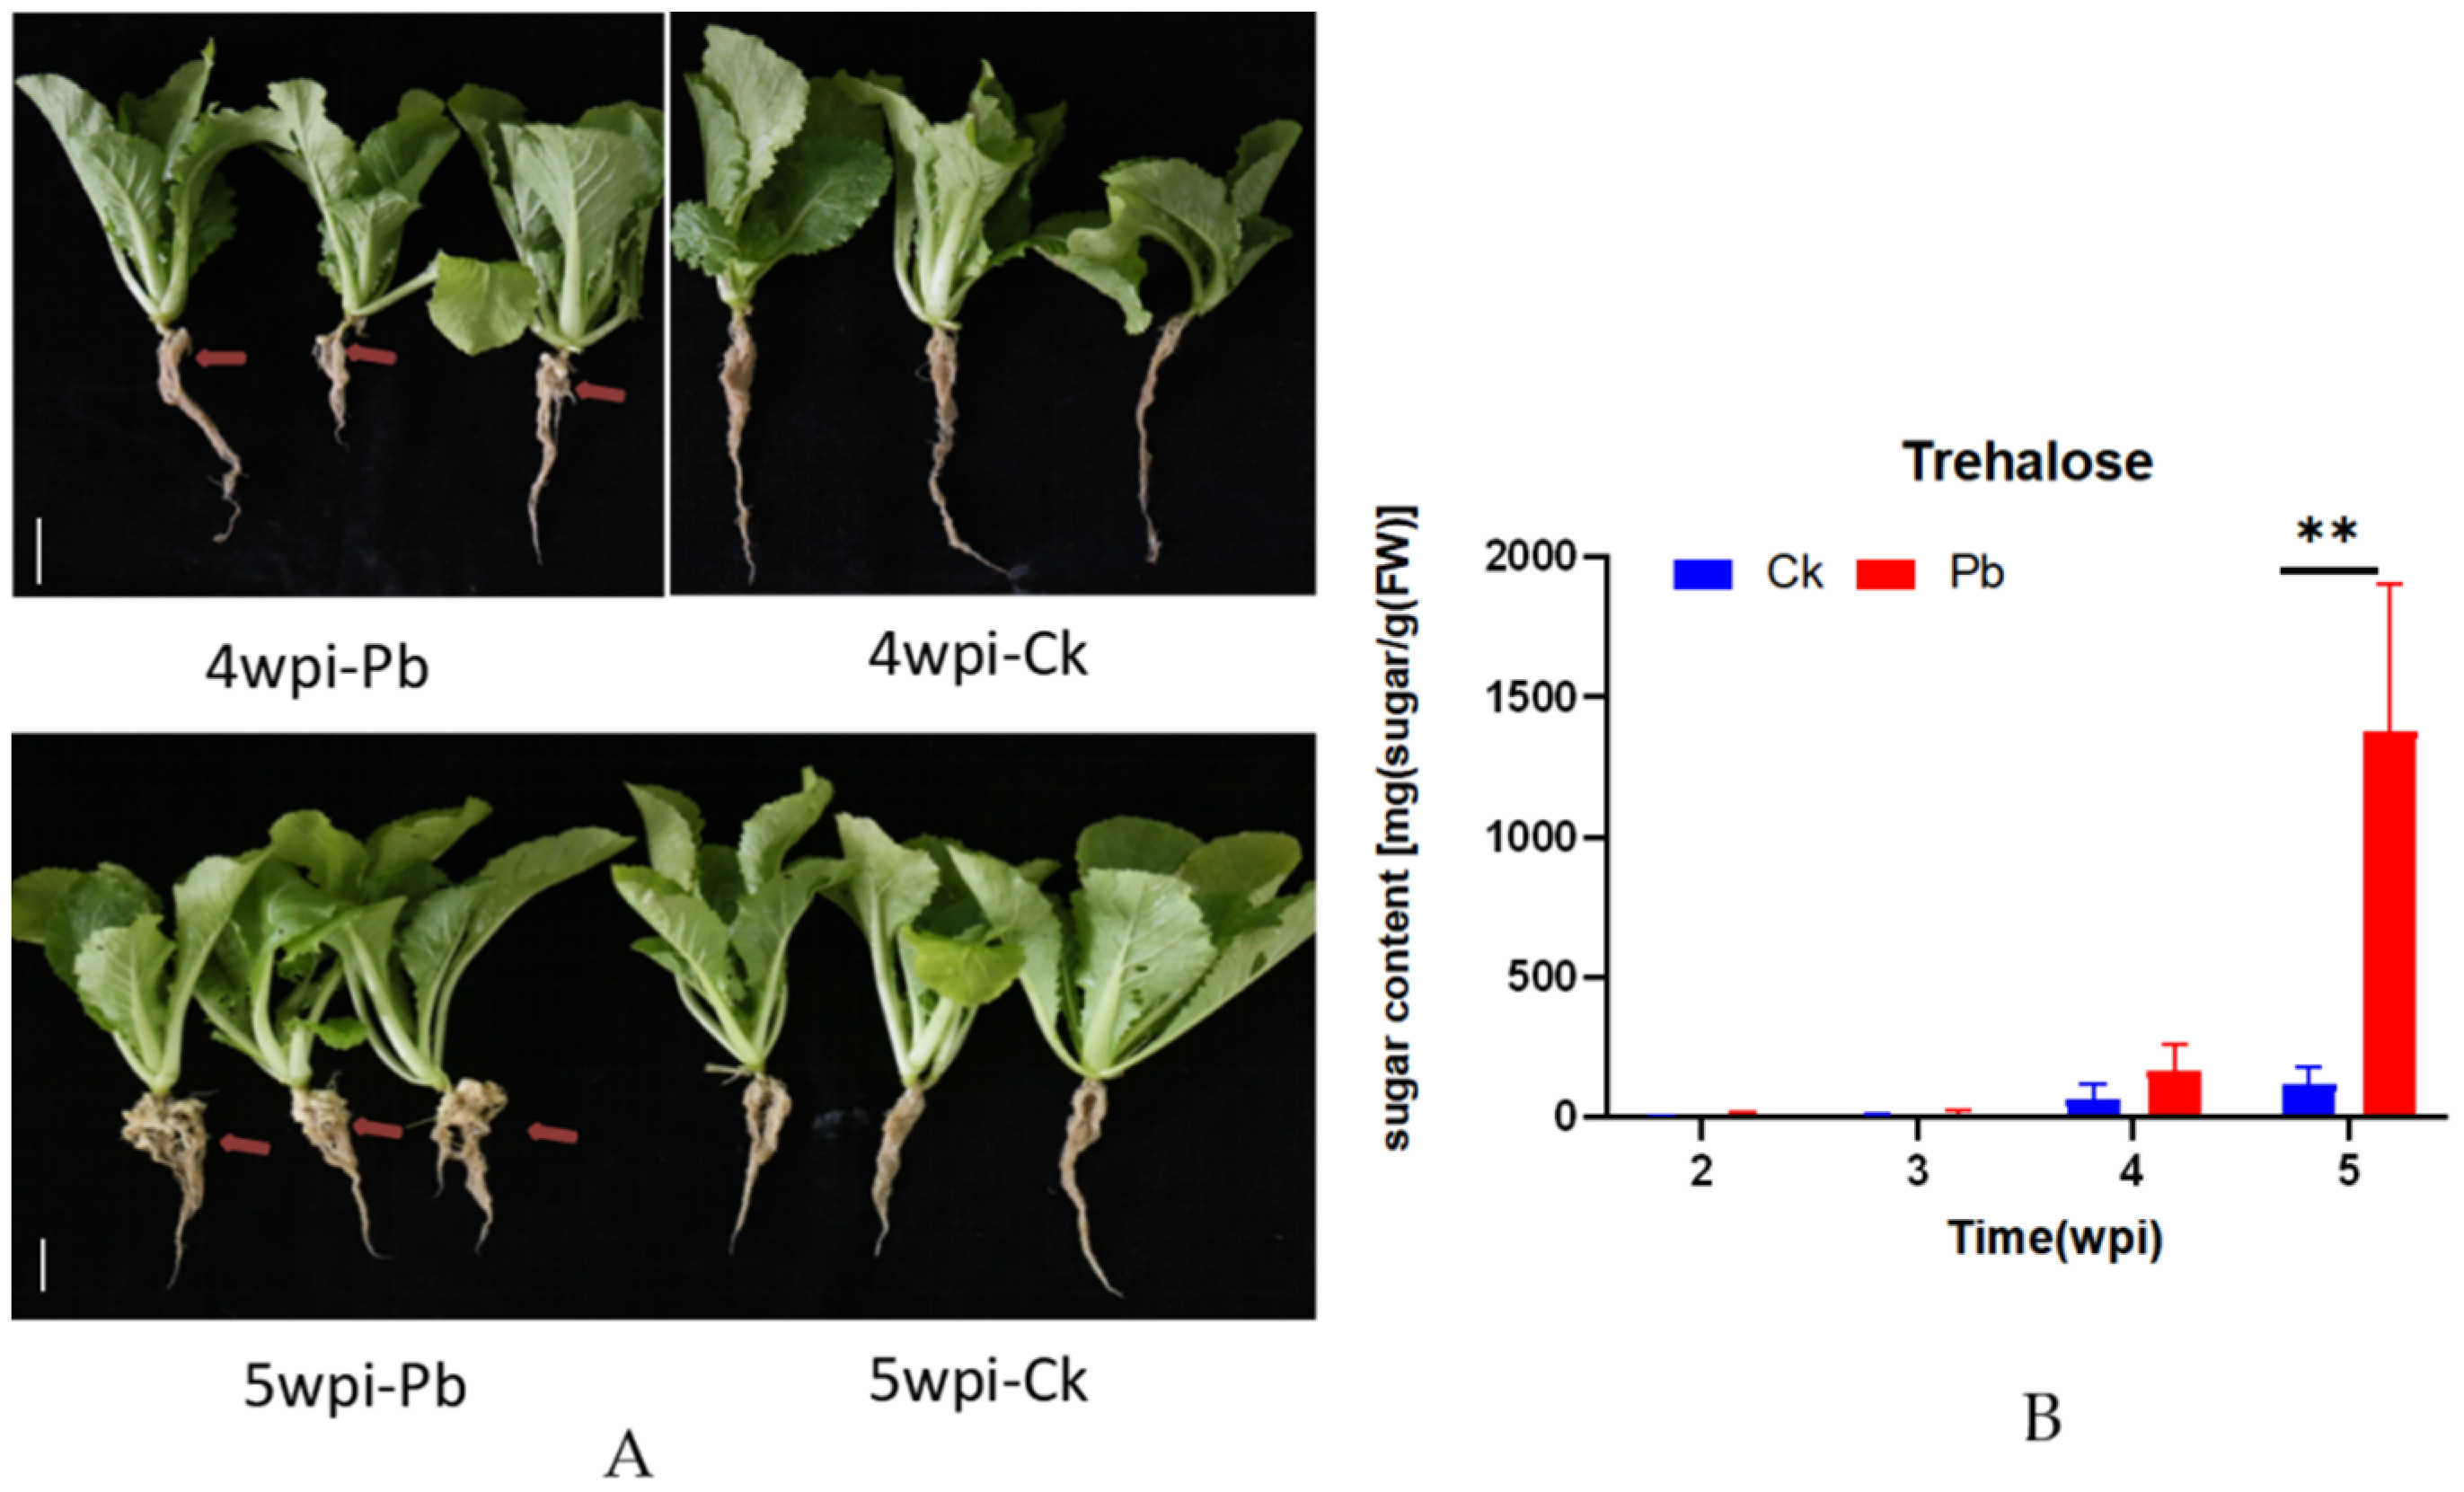
Figure 1. Phenotypic investigation and trehalose contents in the roots of Chinese cabbage after plasmodiophora brassicae inoculation. CK: inoculation-distilled water; Pb: inoculation with P. brassicae. (A) Investigation of clubroot disease of roots at 4 and the 5 weeks post-inoculation (wpi) with P. brassicae. The red arrow points to the location of the clubroot disease. The white scale range represents 2 cm. (B) The trehalose contents in the roots of Chinese cabbage after P. brassicae inoculation. The abscissa represents the time post-inoculation, and the ordinate represents the value of sugar content. The data represent mean values ± SDs. The asterisks indicate p-values (** p < 0.01) according to Student’s t test. Horizontal axis is the time point from 2 weeks to 5 weeks post-inoculation (wpi).
Ijms 24 00929 g001
Figure 2. Phylogenetic relationship of BrTPS and PbTPS. All TPS proteins were divided into three subgroups, represented by three colors. The green color represents Class I proteins, the blue color represents Class II proteins. The yellow circle symbol represents the BrTPS proteins. The unrooted phylogenetic tree was constructed using the neighbor-joining (NJ) method with 1000 bootstrap replications by MEGA6 software.
Ijms 24 00929 g002
Figure 3. Gene structures, domains, and motifs of the BrTPS family. (A) Exon/intron organization of BrTPS genes. Pink boxes represent exons and black lines of same length represent introns. The length of exons can be inferred by the scale at the bottom. (B) The conserved domain analysis of BrTPS protein. Trehalose-6-phosphate synthase (TPS) domain (Glyco_transf_20), trehalose-6-phosphate phosphatase (TPP) domain (Trehalose_PPase), and haloacid dehalogenase-like hydrolase domain-containing 3 (Hydrolase 3) are shown by green, yellow, and red, respectively. (C) Conserved motifs of BrTPS proteins. Ten putative motifs are indicated in different colored boxes. The details of the motifs are listed at the bottom.
Ijms 24 00929 g003
Figure 4. Gene structures, domains, and motifs of the PbTPS family. (A) Exon/intron organization of PbTPS genes. Pink boxes represent exons and black lines with same length represent introns. The length of exons can be inferred by the scale at the bottom. (B) The conserved domain analysis of PbTPS protein. Trehalose-6-phosphate synthase (TPS) domain (Glyco_transf_20), trehalose-6-phosphate phosphatase (TPP) domain (Trehalose_PPase) are shown by green and yellow, respectively. (C) Conserved motifs of PbTPS. Ten putative motifs are indicated in different colored boxes. The details of the motifs are listed on the right.
Ijms 24 00929 g004
Figure 5. The TPS gene locations in B. rapa chromosomes. The chromosomes are represented by yellow bars. The chromosomal position of each BrTPS gene was mapped according to the B. rapa genome. The chromosome number is indicated at the top of each chromosome. The scale is in megabases (Mb).
Ijms 24 00929 g005
Figure 6. Predicted cis-elements in BrTPS gene promoters. Promoter sequences (2000 bp) of 14 BrTPS genes were analyzed using the PlantCARE database. (A) Kind and position of cis-acting elements in BrTPSs. (B) numbers of cis-acting elements. The gradient blue colors and numbers in the grid indicate the number of different cis-acting elements in BrTPSs. (C) Number of cis-acting elements in 14 BrTPS genes containing three category; histograms with different colors represent different categories. (D) Proportion of different cis-acting elements in each category.
Ijms 24 00929 g006
Figure 7. Relative Expression profiles of BrTPS genes in the Chinese cabbage root after of P. brassicae. infection. CK represents inoculation with water; Pb represents inoculation with P. brassicae. Expression of each BrTPS gene was measured by qRT-PCR from 1 week to 5 weeks post-inoculation. The expression levels of genes are presented using fold change values transformed to Log2 format. The data indicate the relative expression levels normalized to that of the internal control 18srRNA. Red and green colors correspond to up- and downregulations of the BrTPS gene expressions, respectively.
Ijms 24 00929 g007
Figure 8. Analysis PbTPS genes in the Chinese cabbage root after P. brassicae infection. (A) Reverse-transcription polymerase chain reaction analysis of the expression of PbTPS in infected and healthy plants roots, the template of PCR reaction was root cDNA mixture from 1 week to 5 weeks post-inoculation (wpi). CK: heathy plants; Pb: infected plants. (B) Real-time PCR analysis of the expression of PbTPSs in infected plants roots. 1W–5W represent five time points from 1 week to 5 weeks post-inoculation with P. brassicae. (C) qRT-PCR analysis of the expression of PbTPSs in infected plants roots at 4 wpi and 5 wpi. Values represent the mean and standard deviation of triplicate results. “ND” means not detected. Asterisks indicate values that are statistically significantly different from the 4 wpi using Student’s t test. (* p < 0.05; ** p < 0.01).
Ijms 24 00929 g008
Table 1. The information of TPS genes in B. rapa.
Gene NameGene Accession NumberArabidopsis homologous GenesCDS Length (bp)Amino Acids Length (aa)pI 1Molecular Weight (KDa)Predicted Subcellular Localization
BrTPS1aBra035049AT1G7858028539506.63106.9Cell wall/cytoplasm/vacuole
BrTPS1bBra008366AT1G7858027879286.87104.5Vacuole
BrTPS2Bra026011AT1G1698025358446.0495.7Chloroplast/vacuole
BrTPS4Bra019043AT4G2755023617866.1188.6Chloroplast/vacuole
BrTPS5aBra040180AT4G177703901299.4814.7Nucleus/vacuole
BrTPS5bBra012642AT4G1777025748575.9296.9Vacuole
BrTPS6Bra004054AT1G6802025928636.0398Cytoplasm/Vacuole
BrTPS7aBra015497AT1G0641011253744.742.9Cytoplasm/vacuole
BrTPS7bBra030651AT1G0641025598525.5496.9Vacuole
BrTPS8Bra007906AT1G70290438014596.81165.8Chloroplast/vacuole
BrTPS9Bra016328AT1G2387026078685.8598.6Vacuole
BrTPS10aBra031526AT1G6014025748576.0497Chloroplast/vacuole
BrPS10bBra017888AT1G6014025868616.0196.9Chloroplast/vacuole
BrTPS11Bra038548AT2G1870025958646.1697.8Chloroplast/vacuole
1 The isoelectric point of the protein.
Table 2. The information of TPS genes in P brassicae.
Gene NameGenBank IDCDS Length (bp)Amino Acids Length (aa)pI 1Molecular Weight (KDa)Predicted Subcellular Localization
PbTPS1CAL69928.128538606.3196.49Cytoplasm
PbTPS2CEP00348.125778586.9395.87Cell membrane/cytoplasm
PbTPS3CEO95489.125628536.18 95.50Cytoplasm
1 The isoelectric point of the protein.
Disclaimer/Publisher’s Note: The statements, opinions and data contained in all publications are solely those of the individual author(s) and contributor(s) and not of MDPI and/or the editor(s). MDPI and/or the editor(s) disclaim responsibility for any injury to people or property resulting from any ideas, methods, instructions or products referred to in the content.