1. Introduction
Alzheimer’s disease (AD), the most common cause of dementia among elderly people, is characterized by a compromise of cholinergic activity as a result of a decrease in the levels of the neurotransmitter acetylcholine and a reduction in acetylcholine synthetizing enzyme choline acetyltransferase, as well as hydrolyzing enzyme acetylcholinesterase (AChE) [
1]. Intriguingly, despite this reduction in AChE enzymatic activity, estimation of the protein levels in the brain of AD patients demonstrated that total AChE protein levels are preserved [
2]. Maintenance of high levels of AChE protein may account for preservation or increments in the pool of enzymatically inactive AChE species in the pathological brain. This imbalance between active/inactive AChE species has not been studied until now and may result from alterations in post-translational modifications of AChE that could alter the protein structure and conformation, affecting enzymatic function. In this regard, glycosylation is a common post-translational modification that affects protein structure and function [
3]. AChE is a glycoprotein with three potential N-glycosylation sites that play an important role in proper folding, trafficking of the protein from endoplasmic reticulum (ER) to Golgi, as well as to achieve full enzymatic activity. Indeed, correct N-glycosylation is essential for AChE maturation and membrane targeting [
4] since abnormally glycosylated forms are retained in the ER.
Alterations in AChE glycosylation have been described in some pathological conditions, such as Creutzfeldt–Jakob disease [
5], breast cancer [
6], and also in AD. Indeed, in the brain and cerebrospinal fluid (CSF) of AD patients, glycosylation of AChE enzymatic activity is altered [
7] and expression of a particular AChE monomeric form with different glycosylation is increased [
8,
9]. Moreover, it has been suggested that the increase in AChE activity that occurs around amyloid plaques is due to AChE displaying differences in glycosylation, as compared with those from normal brain, and that these altered glycoforms may facilitate formation of amyloid fibrils in the AD brain [
10].
Alterations in glycosylation in AD have also been reported for other AD key proteins, such as β-amyloid precursor protein (APP), tau, and β-secretase 1 (BACE1), and γ-secretase subunit nicastrin [
11,
12,
13,
14]. Altered glycosylation would affect multiple biological processes, such as neuroinflammation, cell adhesion, and cell signaling in AD brains [
12]. In an altered glycosylation pattern in the brain of AD patients, presenilin 1 (PS1) could develop an important role. PS1 is the catalytic component of the γ-secretase complex participating in both amyloidogenic and non-amyloidogenic pathways of APP processing; thus, β-amyloid (or Aβ), the AD triggering effector [
15,
16], is a proteolytic peptide generated by processing of APP by successive action of two enzymes, β-secretase and γ-secretase (for a review, see [
17]). Since mutations in PS1 are implicated in the development of most of the familiar forms of AD (fAD), malfunction of PS1 is associated with AD pathology [
18]. On the other hand, it has also been suggested that PS1 can modulate glycosylation of diverse proteins, either by directly affecting the glycosylation process [
12] or by regulating the cellular location of these glycoproteins [
19,
20]. In fact, PS1 has been implicated in glycosylation and maturation of nicastrin, another component of the γ-secretase complex [
21], APP [
19,
20,
22], and tropomyosin receptor kinase B (TrkB) [
20]. Furthermore, it has been shown that PS1 modulates the intracellular trafficking and surface expression of a microglia receptor, the triggering receptor expressed on myeloid cells 2 (TREM2), also affecting its phagocytic function [
23].
Previous reports from our group have demonstrated that PS1 can interact with AChE, showing an intracellular overlapping distribution in reticulum and Golgi [
24]. PS1 influences the processing of the AChE membrane anchor PRiMA subunit [
25], but it can also influence glycosylation of AChE [
24]. In this regard, expression of the fAD-linked A246 human PS1 mutation in a transgenic mouse model leads to a reduction in AChE activity and alterations in AChE glycosylation, suggesting that loss of function of PS1 caused by fAD mutation may disturb AChE maturation [
24]
In this study, we have investigated in brain cortex of AD, including fAD patients, alterations in glycosylation of both enzymatic active and total AChE protein by lectin binding assays. We have also analyzed the role of PS1 in the glycosylation, trafficking, and location of AChE in the plasmatic membrane in cellular models that stably overexpress PS1.
3. Discussion
In this study, we have seen that active and inactive forms of AChE differ in their glycosylation pattern, with the presence of oligosaccharides that contain terminal mannoses in active species. Interestingly, this mannose glycosylation pattern associated with acquisition of enzymatic activity appears to be altered in brain cortex of sAD patients compared with controls but also appears to differ with regard to fAD. The occurrence of fAD mutations in PS1 gene, together with previous data [
24], strongly suggests a role for PS1 in AChE glycosylation. Hence, we have demonstrated alterations in AChE glycosylation in CHO cells that overexpress PS1, which, in turn, indicate that PS1 modulates the trafficking in Golgi regions and location of active AChE variants in the plasmatic membrane.
In the brain cortex of AD patients, our results corroborate the reduction in enzymatically active AChE tetrameric forms, whereas AChE protein levels that were mostly attributed to an inactive pool were preserved [
2]. The inactive AChE forms in the brain have been previously identified as AChE-T splicing variants [
26]. The splicing of the ACHE gene generates different transcripts with distinct N- and C-terminal peptides that determine the ability of the molecule to form oligomers, yet they all share the same catalytic domain [
30]. In the brain, AChE-T transcript is the most abundant and generates monomeric subunits that could be organized into dimers and tetramers. The tetramers anchored to the membrane are considered to be the cholinergic functioning forms [
29,
30,
31,
32]. Therefore, depletion of enzymatically active AChE species could determine the cholinergic impairment present in AD. Nonetheless, the biological significance of the inactive pool of AChE is unknown.
The inactive pool of AChE has been attributed to monomeric species that could act as reservoirs for further assembly of cholinergic tetramers, or other exportable species that could play non-cholinergic roles. However, the evidence indicates that most of the inactive AChE molecules are rapidly degraded and do not transit the Golgi apparatus [
33]. Moreover, inactive AChE-T species may be in part due to inefficient post-translational processing of the AChE subunits within the AD brain, which, in turn, compromises the ability to form the active complex as acquisition of catalytic activity is significantly affected by glycosylation [
4]. Thus, an imbalance of active/inactive species in the AD brain may be not only due to depletion of cholinergic neurons in the brain of affected subjects [
34] but also to an altered glycosylation pattern of AChE.
AChE contains three N-glycosylation sites and mutants that express defects in one or all the sites showing reduced or absent AChE activity [
4]. Indeed, a lack of glycosylation leads to misfolding and failure to export AChE to the plasma membrane, reducing enzymatic activity [
35,
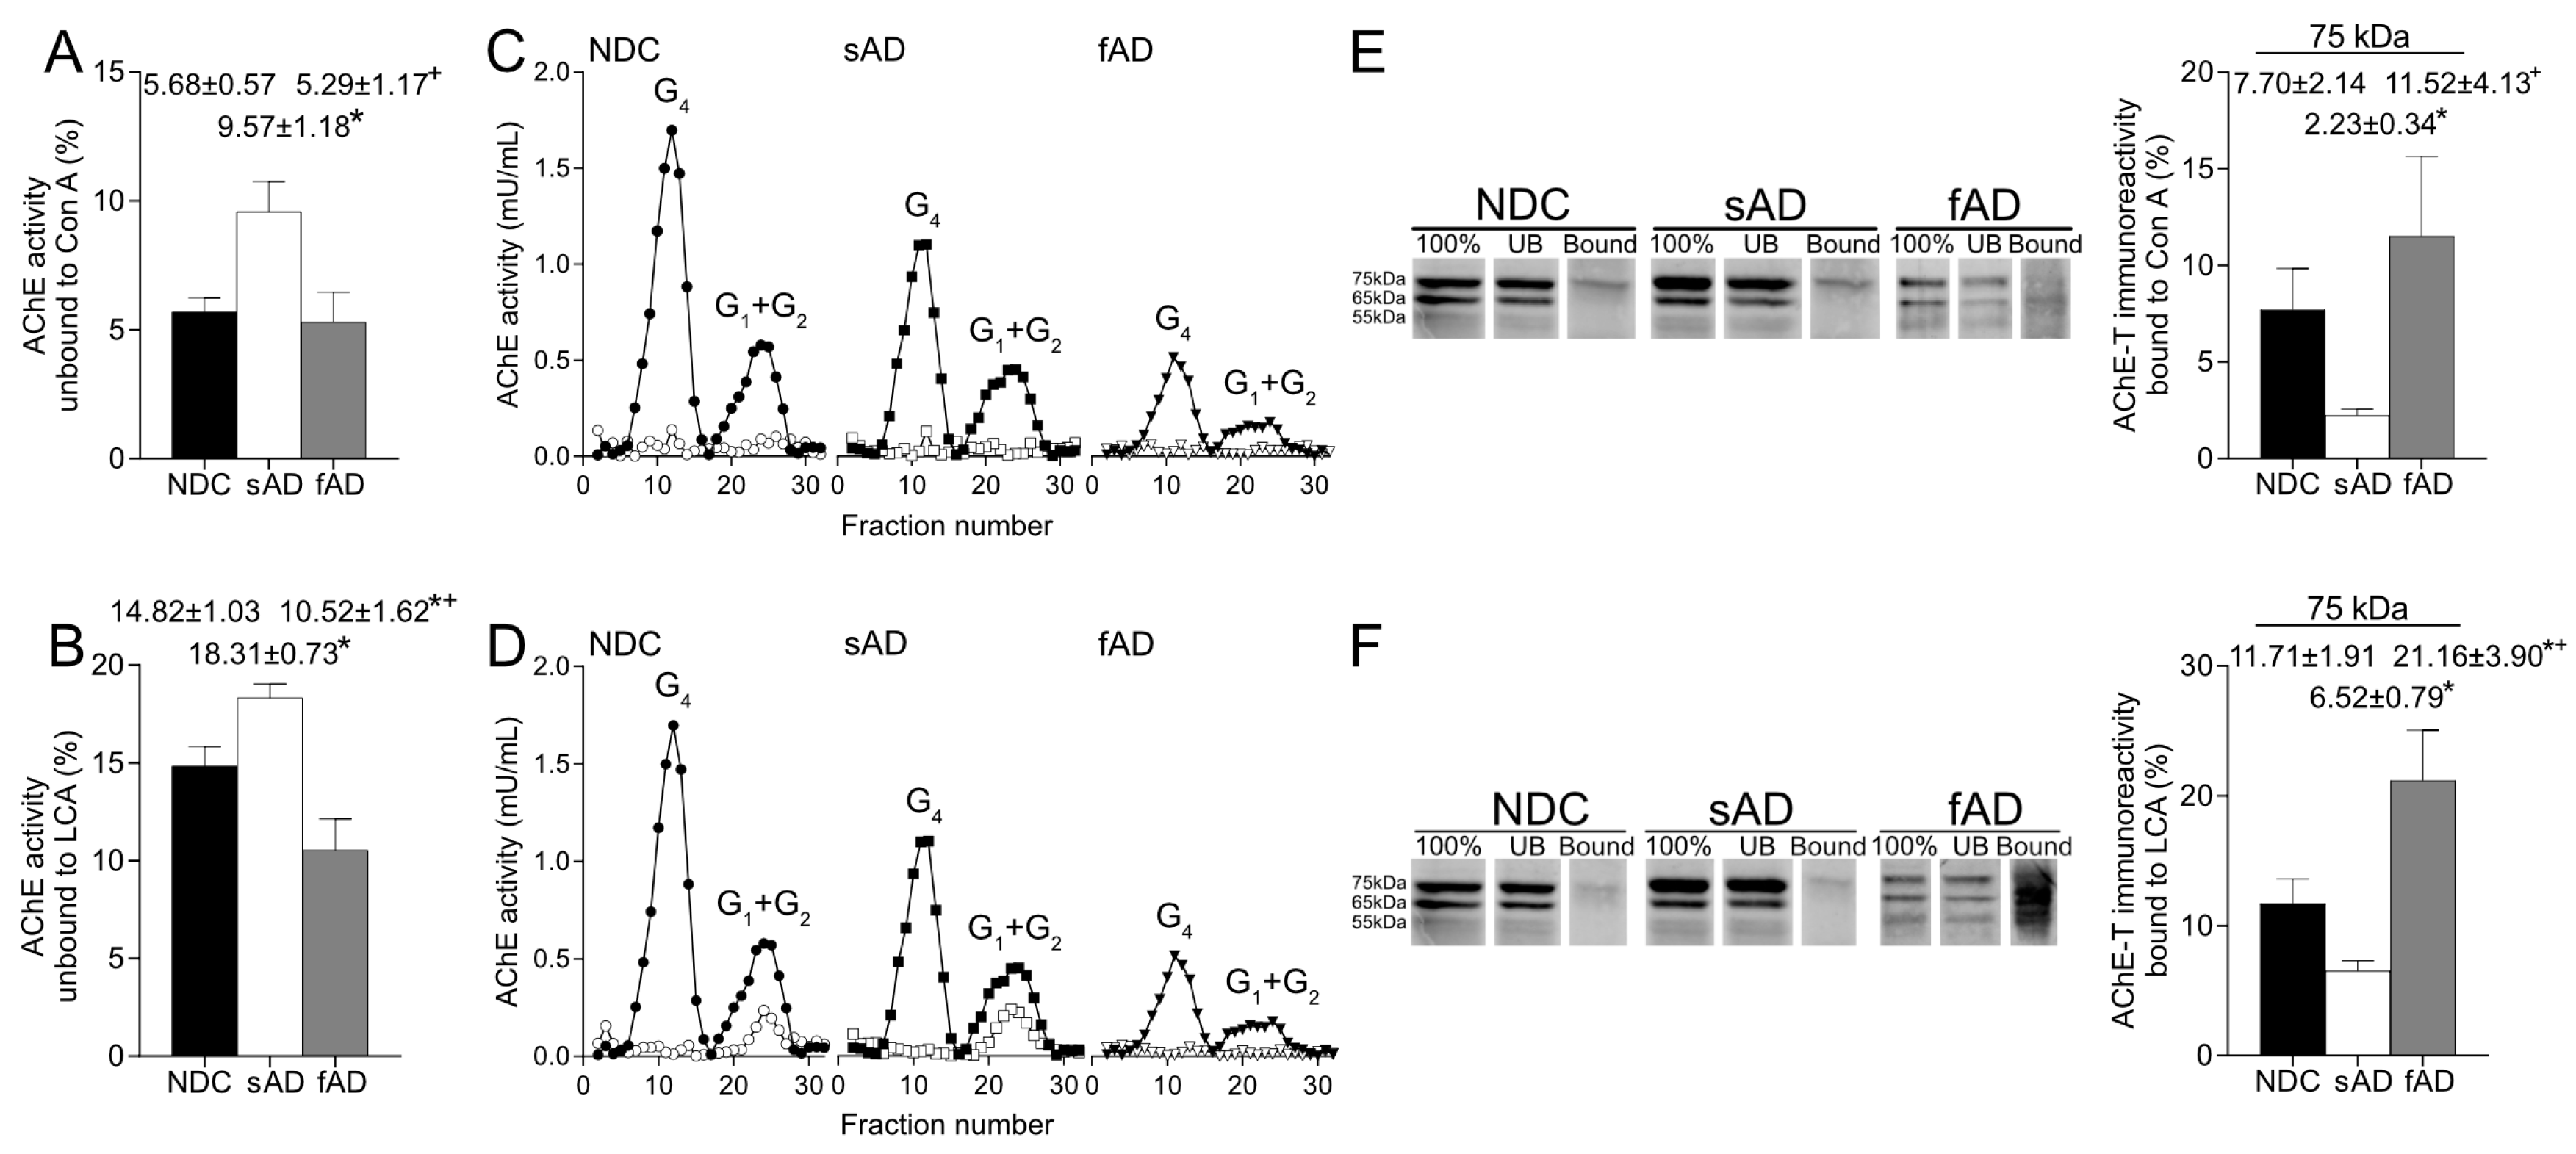
36]. In this study, we have analyzed, via lectin binding assays, glycosylation of AChE enzymatic activity and protein. Glycosylation assays showed that active AChE displays terminal mannoses, and, given the high binding to LCA, the results indicate that most forms consist of mature oligosaccharides. Furthermore, a large proportion of the active AChE presented glycans contained terminal N-acetylglucosamine and/or sialic acid, as suggested by the binding to WGA. On the contrary, the interaction with SNA suggested that just a small percentage of active AChE species presented terminal sialic acid.
AChE is a polymorphic protein that can be assembled as different molecular forms of the same catalytic subunit. Moreover, diverse molecular forms may display distinct patterns of glycosylation in the same cell [
29]. In our study, sucrose gradients showed that all active forms presented mannose-containing oligosaccharides, whilst mature glycans that contain mannoses with a fucose core are present in a larger proportion as tetrameric forms rather than monomers. It may be possible that the different glycosylation of the lighter forms could differentiate the molecular forms that are precursors of more complex forms. Hence, in the human brain, enzymatically active AChE displayed a complex glycosylation pattern that differed between molecular forms [
9]. However, in the present study, lectin binding of AChE protein, which comprises active and inactive species, showed differences compared to the results obtained by determining enzymatic activity, with only a small percentage of the protein displaying oligosaccharides with terminal mannoses and sialic acid. Hence, non-active AChE is less recognized by the lectins used in this study than active AChE. We can speculate that, in pathological conditions, alterations in glycosylation processing of non-active AChE impairs correct folding of the protein and acquisition of proper enzymatic activity.
More relevantly, the glycosylation pattern of AChE in the brain resulted in altered sAD samples as the percentage of both enzymatically active AChE and the 75-kDa protein recognized by Con A and LCA were lower than in NDC. Thus, in the sAD cortex, there was a reduction in the active AChE glycoforms that displayed terminal mannoses. It is expected that glycosylation of mature, active AChE is completed in Golgi, and glycans recognized by LCA should be added in trans-Golgi regions, suggesting that the alterations in AChE glycosylation detected in sAD might occur at this subcellular level.
Interestingly, binding of AChE to the lectins was different in samples from fAD patients compared to sAD since the fraction of AChE with mannose residues in fucosylated oligosaccharides was higher in these fAD samples. Our results suggest a particular mechanism in fAD that would affect glycosylation of AChE. The fAD samples present mutations in the gene that codifies PS1, and, since it has been suggested that PS1 influences glycosylation of proteins, such as nicastrin [
37] and neural cell adhesion molecule (NCAM) [
38], we hypothesize that alterations in PS1 could affect AChE glycosylation. Indeed, previous studies of our group demonstrated that PS1 physically interacts with AChE and that this interaction, when resolved by co-immunoprecipitation, is lower in fAD than in sAD [
24]. Moreover, transgenic mice that express the fAD PS1-A246E mutation showed an impairment in AChE maturation and glycosylation [
24].
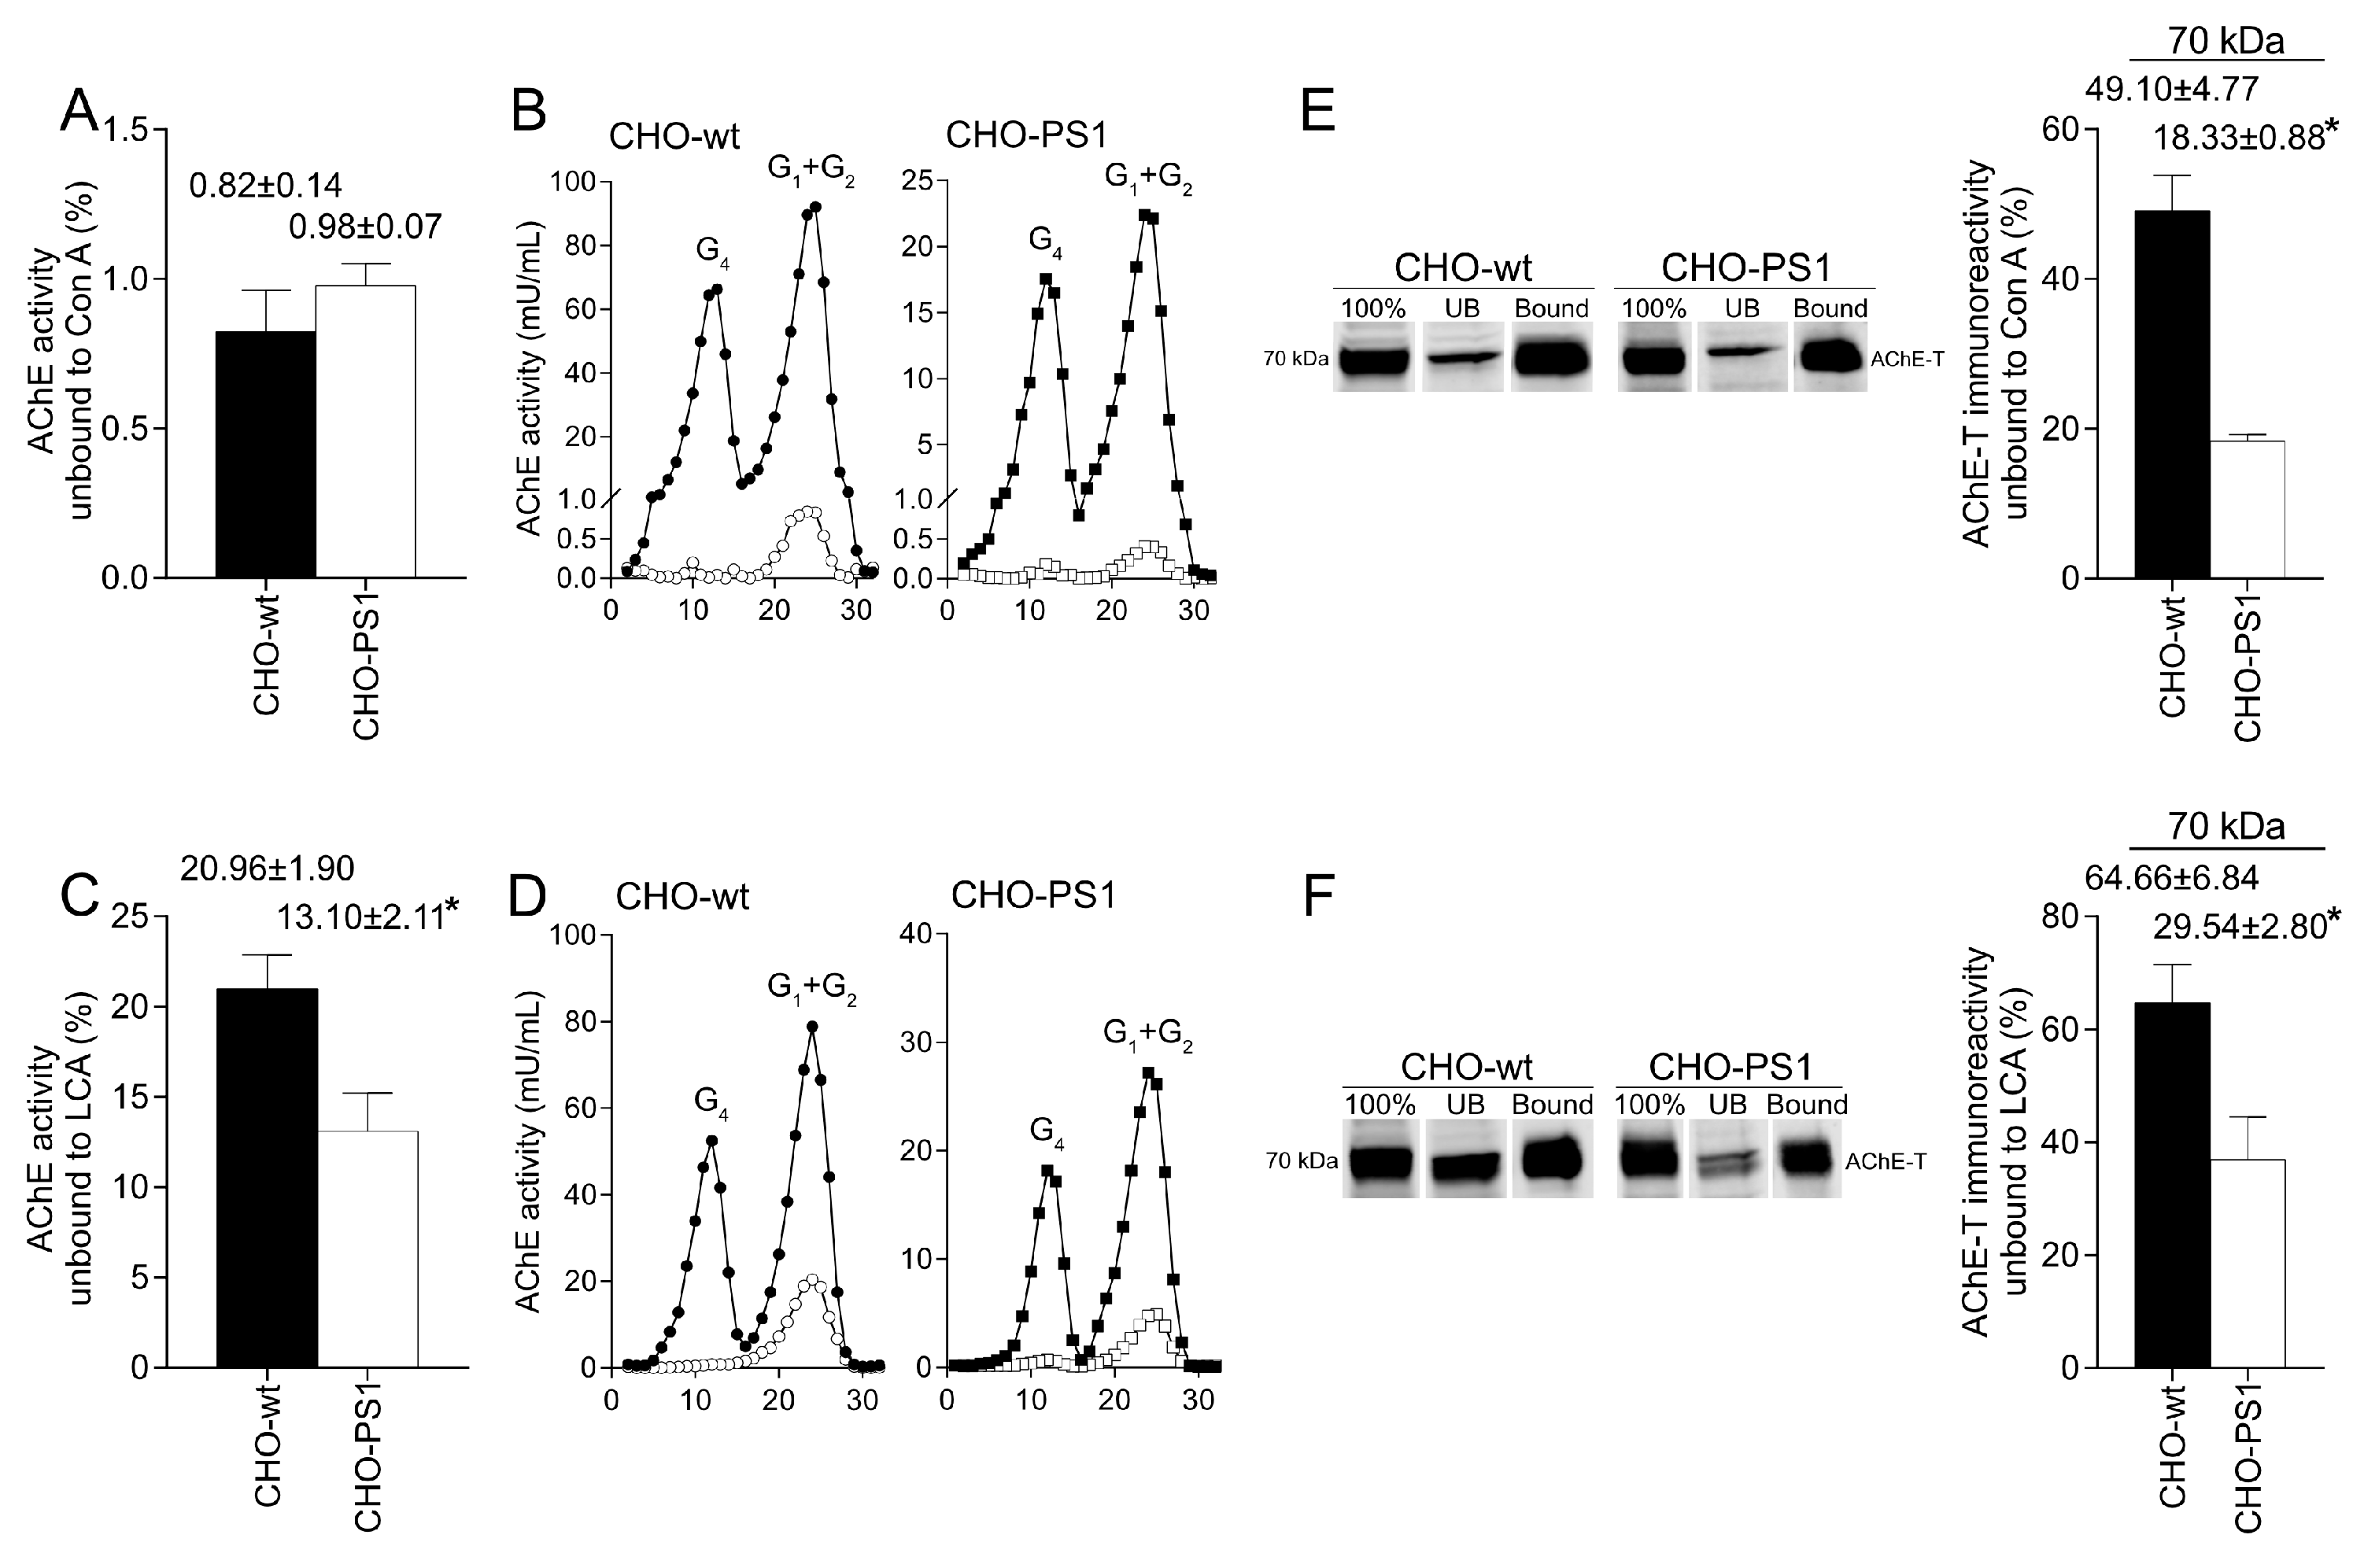
We further analyzed the influence of PS1 in the glycosylation of AChE-T variants using a cellular model (CHO-PS1) that stably overexpressed human wild-type PS1 and APP [
28]. In these CHO cells, co-transfection of AChE-T and PRiMA1, subunits of cholinergic AChE tetramers, leads to synthesis of cholinergic G4-PRiMA-linked forms, as confirmed by sedimentation analysis on sucrose density gradients. This profile of molecular forms of AChE in CHO cells resembles the profile of human brain cortices (compare
Figure 1 and
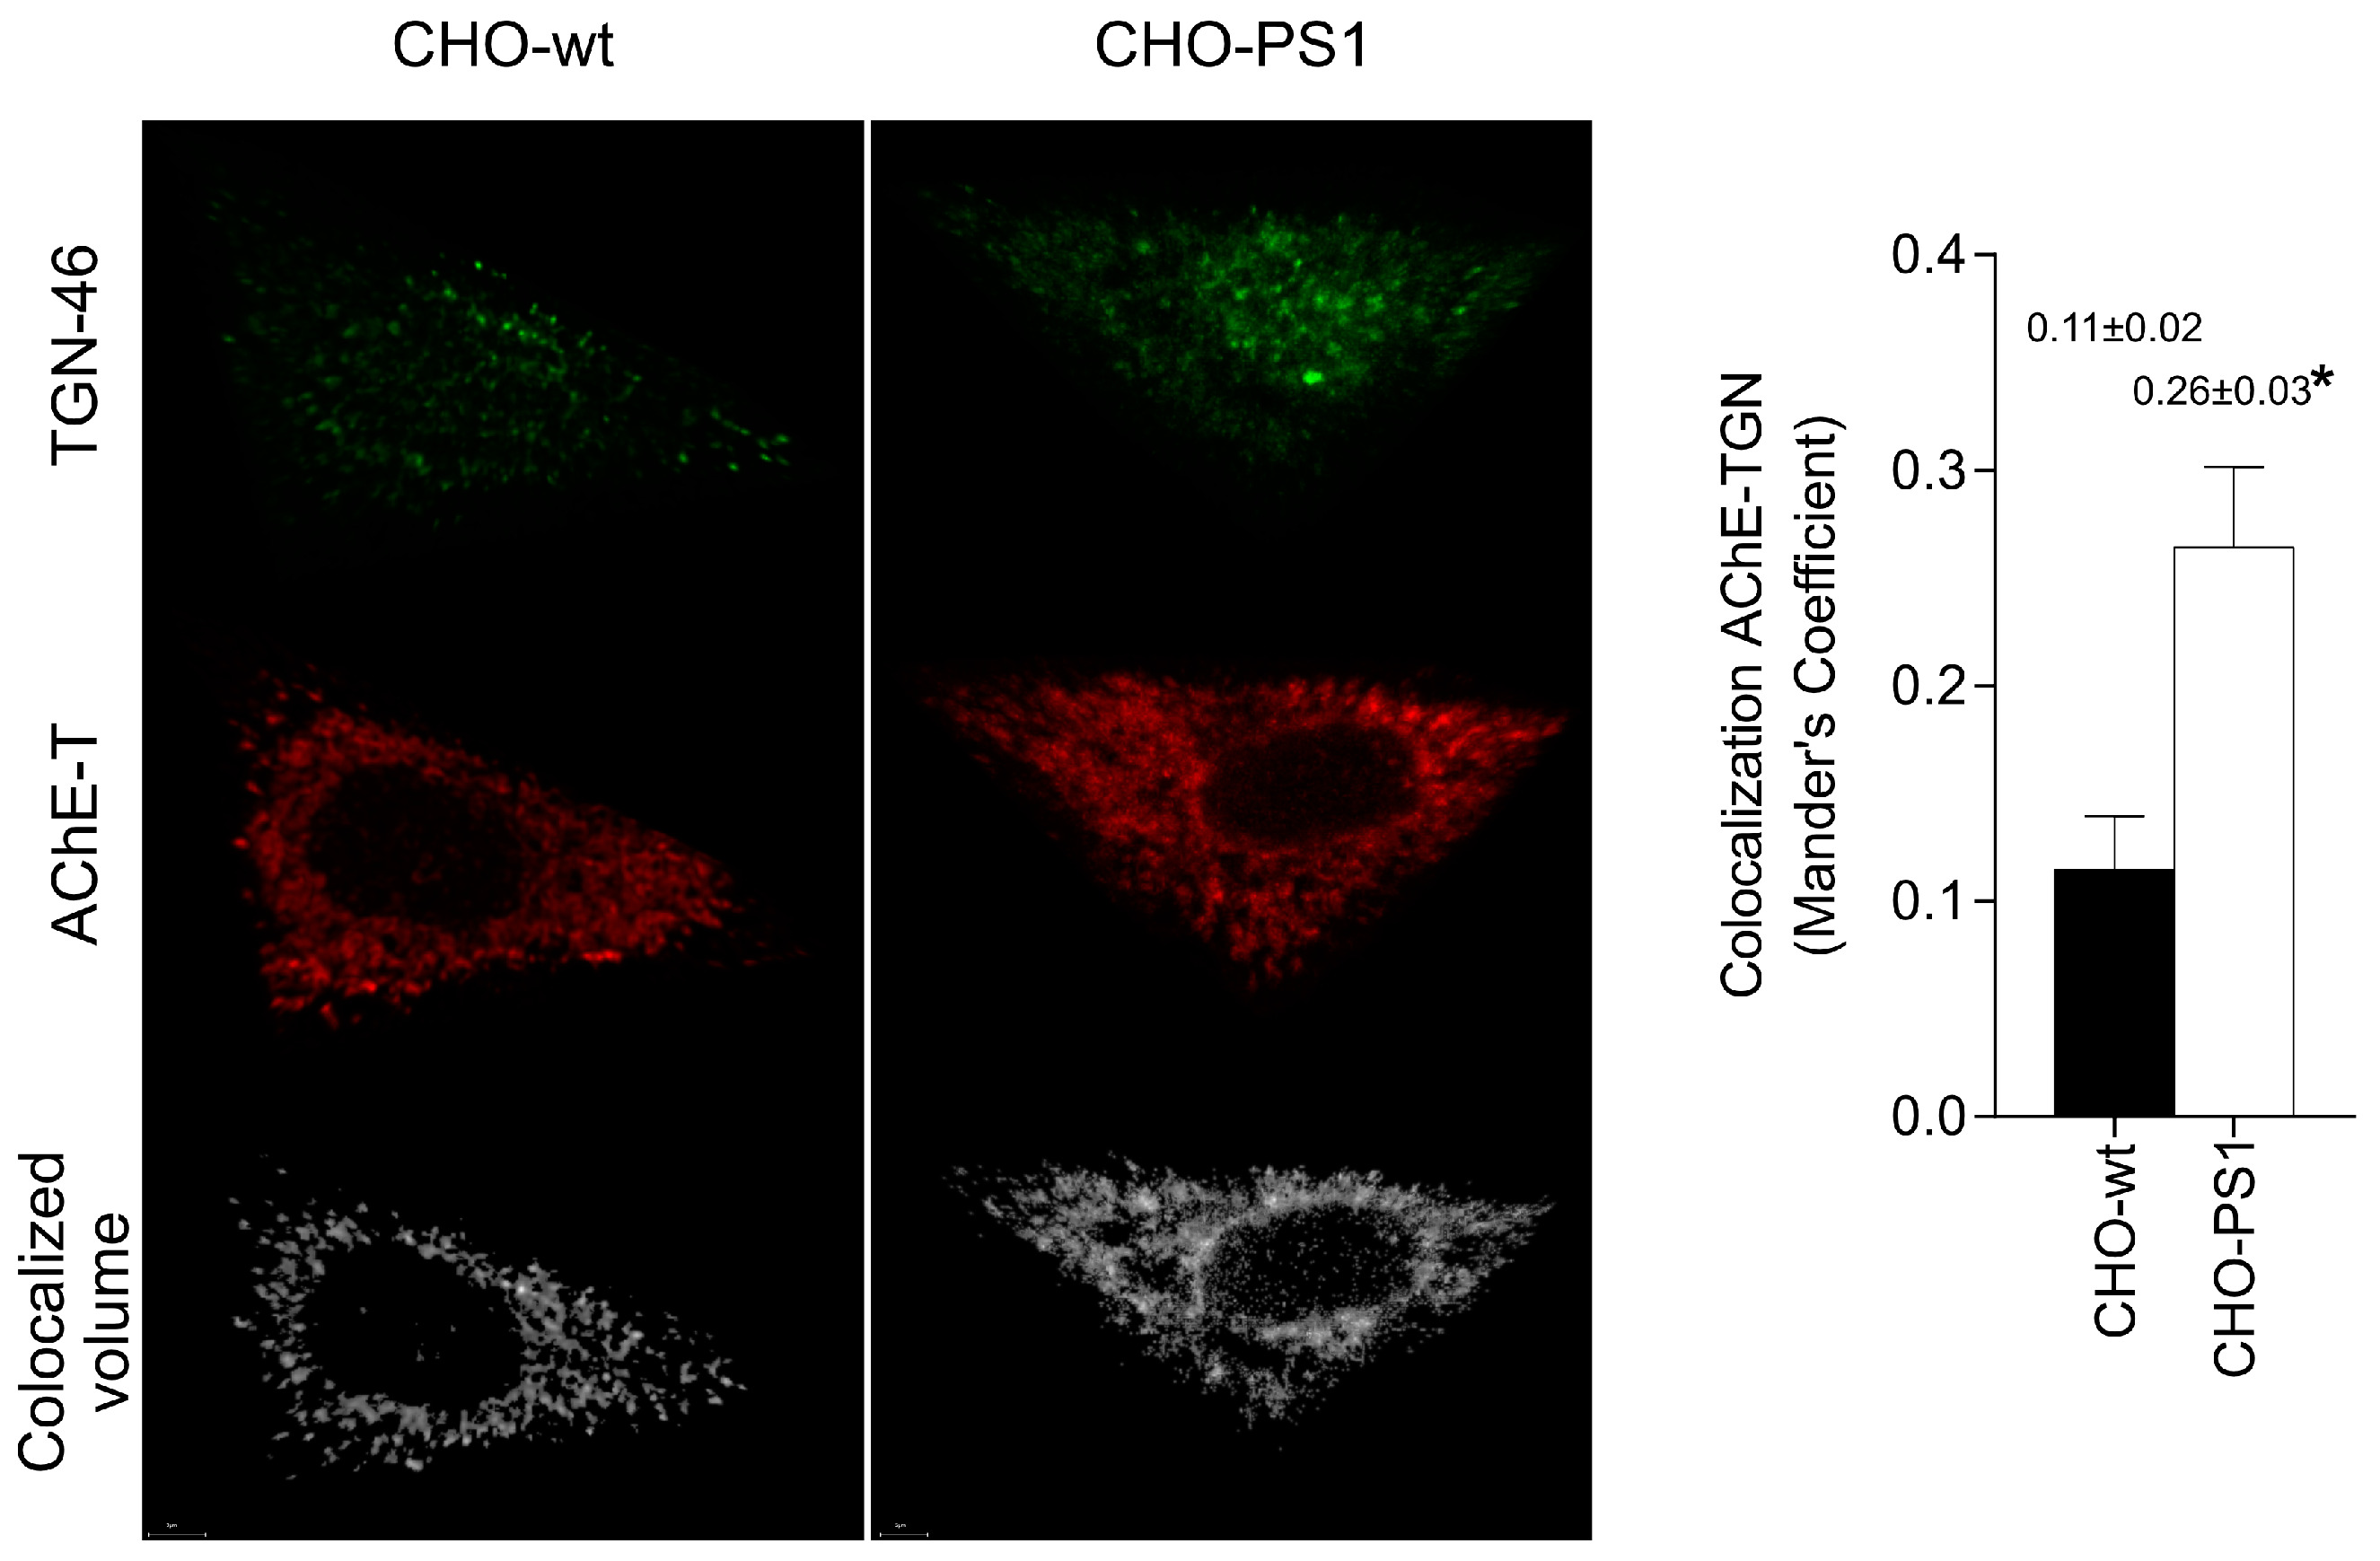
Figure 3). In the CHO-PS1 cells, AChE glycosylation was different to wild-type, with a higher amount of AChE (active and total protein) exhibiting oligosaccharides that displayed mannoses with a fucosylated core. As previously mentioned, core fucose residues are added in trans-Golgi regions; thus, our results indicate that PS1 would favor glycosylation of AChE-T in these subcellular regions. Indeed, co-localization assays of AChE-T with a TGN marker confirmed that the amount of AChE in trans-Golgi was higher in cells that overexpress PS1. We, therefore, speculate that PS1 could act as a chaperone of AChE (and other glycoproteins) trafficking along these biosynthetic compartments. Previous reports situate PS1 and AChE co-localizing in COS-7 cells throughout the endoplasmic reticulum and Golgi apparatus [
24]. In these compartments, PS1 can mediate N-glycosylation of diverse glycoproteins [
12,
39]. PS1 could affect the subcellular location of these glycoproteins, which will influence the N-glycosylation process. In this regard, a recent study has shown that PS1 overexpression increases the localization of BACE1 in the endoplasmic reticulum and Golgi [
40], indicating again a role for PS1 in processing, maturation, and transportation of glycoproteins. We could not discount that PS1 may have a direct effect on N-glycosylation of a subset of glycoproteins, which will affect their final, and functional, subcellular location [
12]. In the AD context, impaired PS1 function modulating glycosylation may be physio-pathologically relevant as a widely investigated role in APP proteolytic processing and deserve further research.
Moreover, an indirect influence of PS1 on AChE glycosylation through Aβ should be considered. Several studies have demonstrated that Aβ is able to alter glycosylation of proteins, such as reelin [
41], and even AChE active monomers [
9]. In CHO-PS1, as a result of the overexpression of PS1 and APP, increased Aβ generation is expected [
42], but, in our present study, wild-type cells treated with Aβ42 did not display alterations in glycosylation. These results do not discount the potential influence of Aβ on AChE glycosylation but point toward a direct role of PS1 in AChE glycosylation, which is independent of β-amyloid. Moreover, the role of PS1 in AChE glycosylation was also indicated by a reduction in LCA binding of AChE when PS1 expression is partially diminished following treatment with PS1 siRNA.
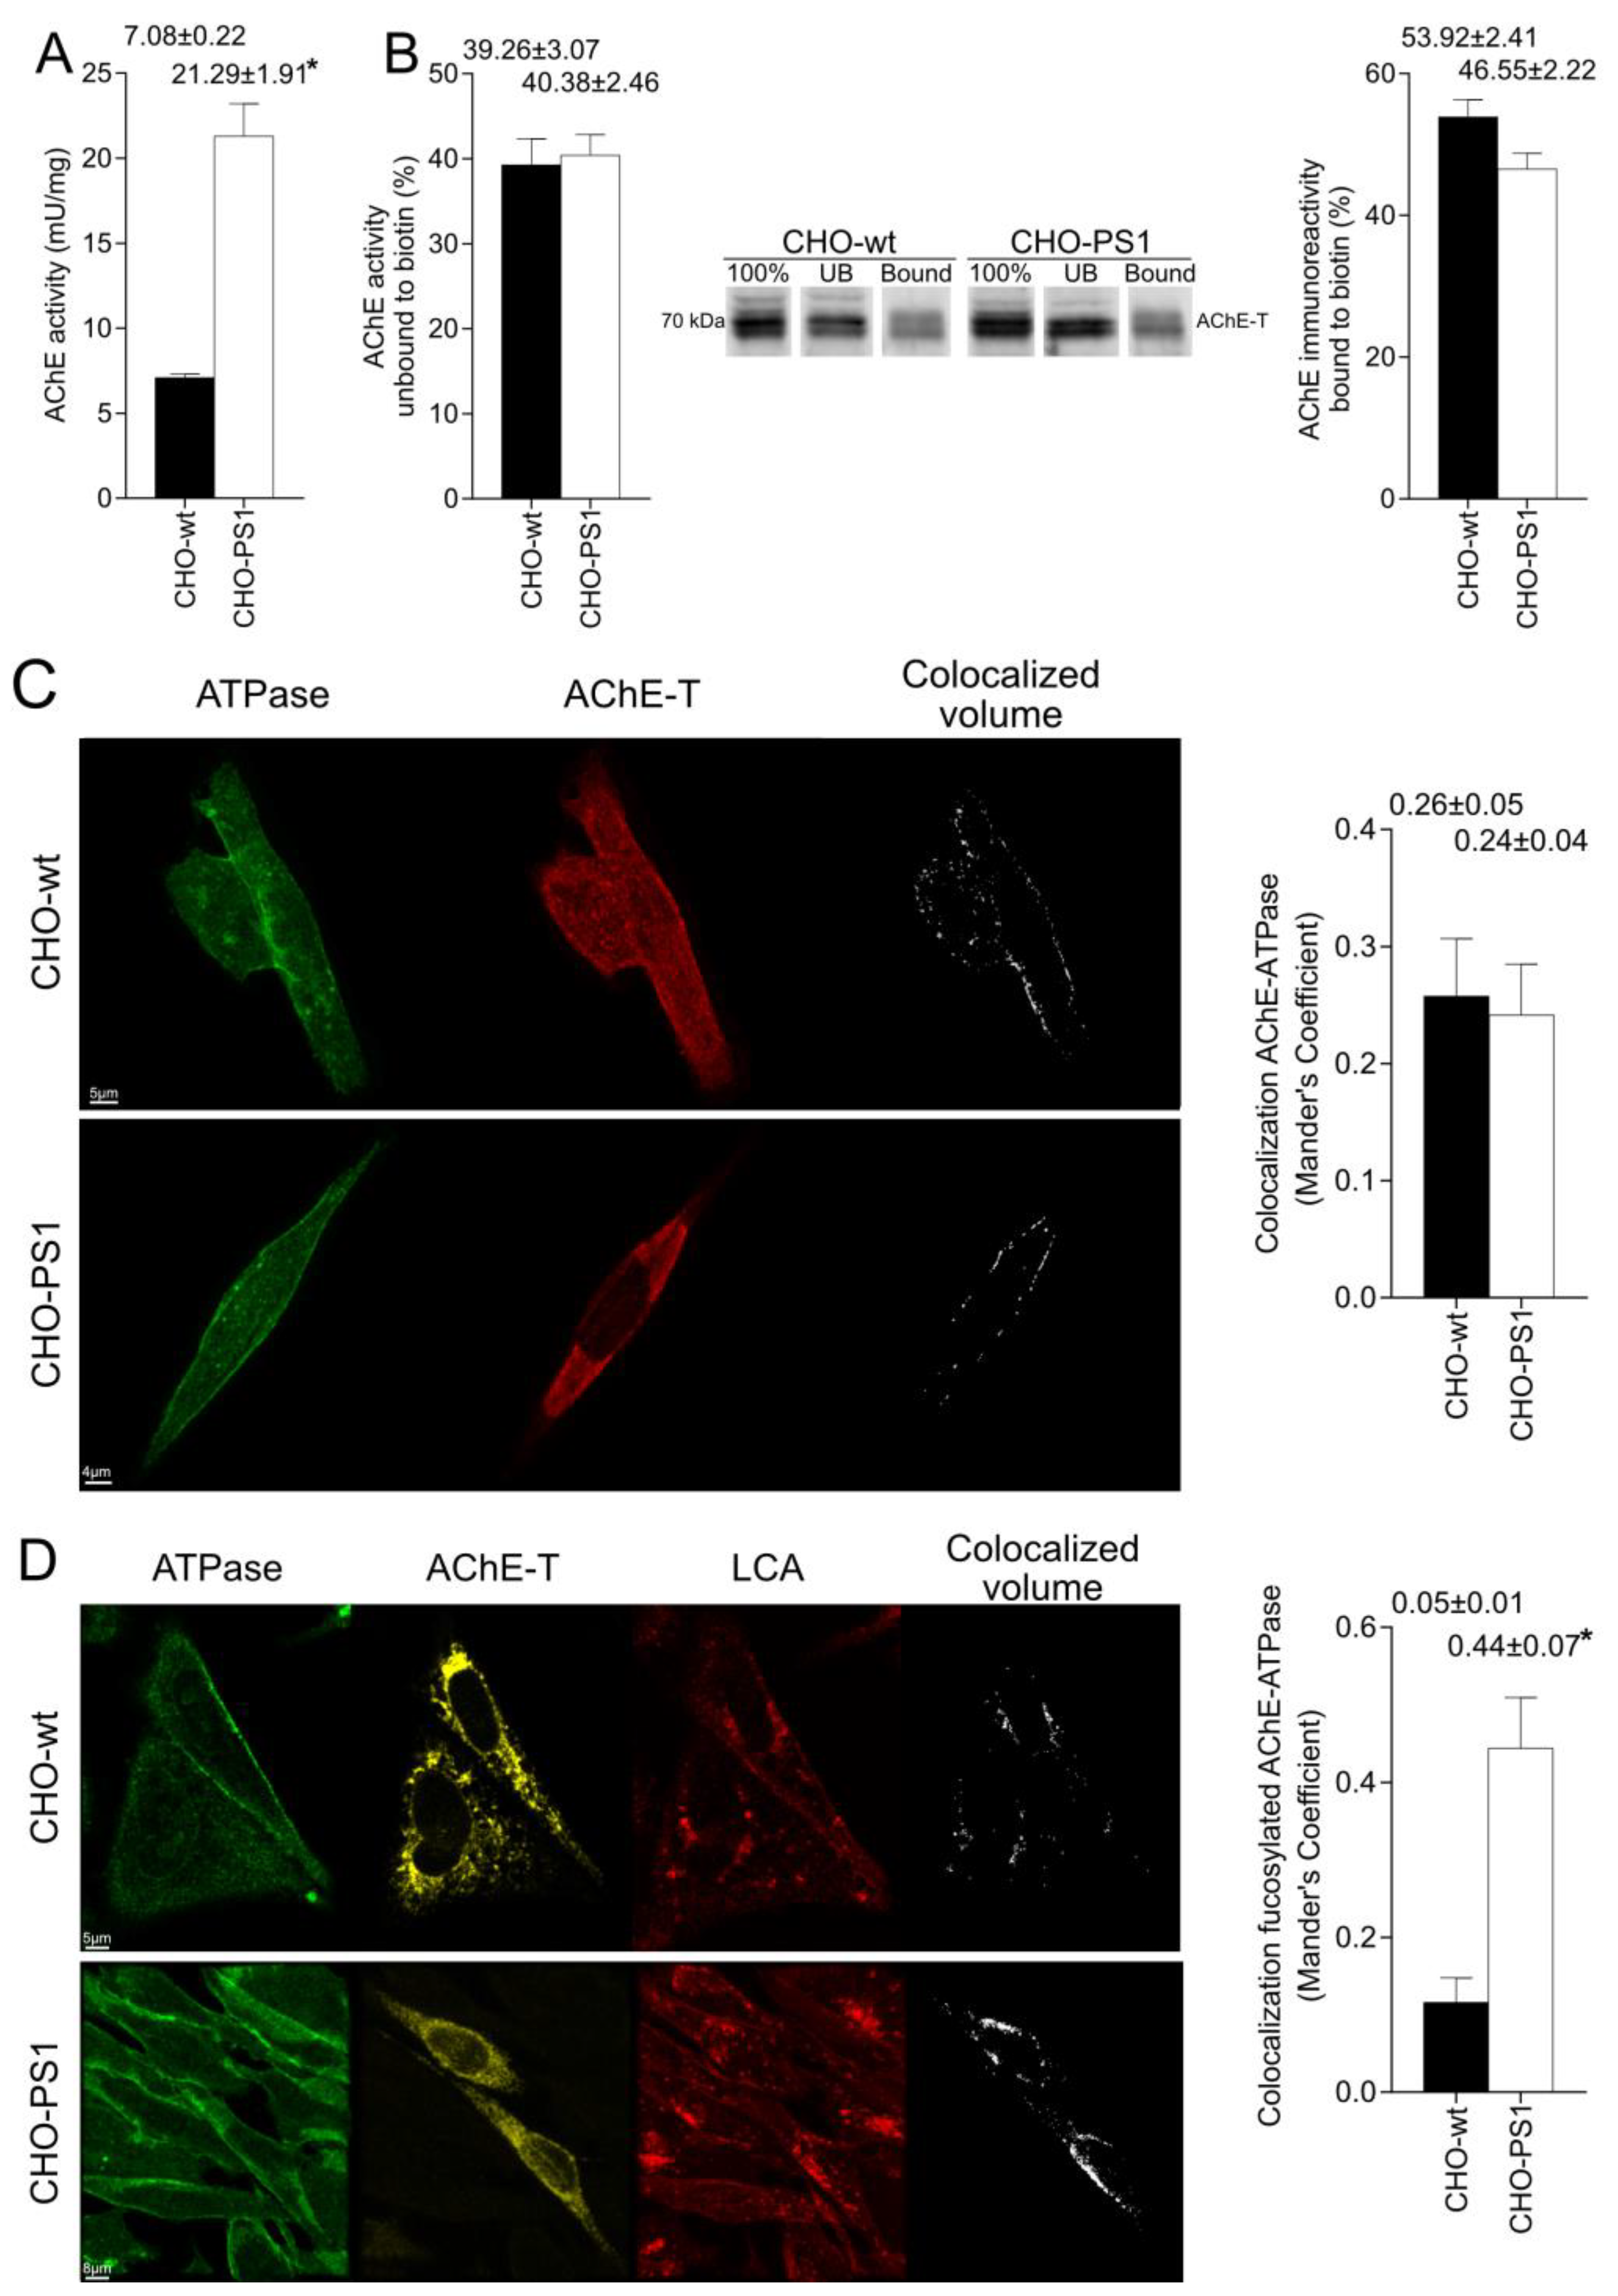
The mature glycosylated cholinergic AChE Is finally transported out of the Golgi/TGN and located in the plasmatic membrane to properly carry out its physiological function. In our study, we reported that the AChE enzymatic activity at plasma membrane was increased in cells that overexpress PS1, although AChE protein levels did not change with respect to wild-type cells. Interestingly, confocal assays showed that the amount of AChE located at the membrane that contains mannose residues in fucosylated core glycans was higher in CHO-PS1 cells. Thus, PS1 could modulate the trafficking and final location of active forms of AChE in the plasmatic membrane. This active AChE contains core fucosylated oligosaccharides that present terminal mannose residues, indicating a role of PS1 in maturation of active AChE in TGN. Nonetheless, we could not discount that PS1 may affect AChE internalization from the cell surface or modulate recycling from endosomes and trans-Golgi to the cell surface. PS1 localized at the endoplasmic reticulum is not associated with γ-secretase activity [
43,
44], supporting a regulatory transport function at this step in the secretory pathway [
45].
In conclusion, PS1 can regulate maturation and trafficking of AChE, modulating its glycosylation. Since we demonstrated that glycosylation differs between active and inactive forms of AChE, we inferred that PS1 could influence the proportion of active AChE. In fAD caused by mutations in PS1, defective regulation could have physio-pathological implications, resulting in altered intracellular transport of AChE, which has also been demonstrated for other key glycoproteins in AD, such as TREM2 [
23] and BACE1 [
40]. In our study, AChE from fAD patients showed a glycosylation pattern different to sAD that could be the result of alterations in trafficking mediated by PS1. In sAD, a multifactorial pathology, the changes in AChE glycosylation are more complex to decipher and could also reflect alterations in molecular form patterns, with a specific decrease in tetrameric forms. Further studies are needed to decipher the role of PS1 as a potential chaperone of the cellular location of other glycoproteins. Altered glycosylation of a key subset of glycoproteins may also influence APP proteolytic processing and Aβ generation, having a role in AD pathogenesis.
4. Materials and Methods
4.1. Human Brain Samples
This study was approved by the ethic committee of the Hospital General Universitario de Elche and performed according to the Declaration of Helsinki. A collection of frozen frontal cortex (Brodmann areas 9/10) samples from sporadic AD (sAD) patients [n = 4, 2 male/2 female; 88 ± 6 years], non-demented control (NDC) cases [n = 4, 2 male/2 female; 60 ± 6 years] was obtained from the UIPA Neurological Tissue Bank (Unidad de Investigación Proyecto Alzheimer, Madrid, Spain). After neuropathological examination, AD cases were categorized as stages V–VI of Braak (Braak and Braak, 1998). NDC samples correspond to individuals with no clinical dementia and no evidence of brain pathology. Frontal cortex samples of four fAD patients, carriers of PSEN1 mutations as indicated: two PS1-V89L cases [male, 54 years old (y), Braak stage V; mal, 57 y Braak stage VI], one PS1-M139T case (male, 64 y, Braak stage V), and one PS1-E318G case (male, 54 y, Braak stage IV] were also included in the study. These fAD samples were obtained from the Banc of Teixits Neurològics, Universitat de Barcelona-Hospital Clínic (Barcelona, Spain). The mean post-mortem interval of all tissues was between 1.5 and 6 h, with no significant differences between groups.
Approximately 0.1 g of human frontal cortex samples (stored at −80 °C) were thawed slowly at 4 °C and homogenized (10%
w/
v) in 50 mM Tris-HCl (Cat. No. T1503: Sigma-Aldrich Co., St. Louis, MO, USA), pH 7.5, 500 mM NaCl (Cat. No. S9888: Sigma-Aldrich Co.), 5 mM EDTA (Cat. No. ED-500: Sigma-Aldrich Co.), 1% (
w/
v) Nonidet P-40 (Cat. No I3021: Sigma-Aldrich Co.), 0.5% (
w/
v) Triton X-100 (Cat. No. T9284: Sigma-Aldrich Co.) and complemented with a protease inhibitor cocktail [
9]. Homogenates were sonicated and centrifuged at 70,000×
g at 4 °C for 1 h, and supernatants collected and frozen at −80 °C until assayed.
4.2. Cell Culture
Chinese Hamster Ovary cells with wild-type phenotype (CHO-wt) were grown in D-MEM+GlutaMAX™-I (Dulbecco’s Modified Eagle Medium; Gibco
®, Life technologies Paisley, UK) supplemented with 10% fetal bovine serum (FBS, Gibco
®) and 1% penicillin/streptomycin solution (P/S; 100 U/mL, 100 µg/mL, Gibco
®). CHO cells stably overexpressing wild-type human PS1 and APP [CHO-PS1, a generous gift from Dr. Selkoe; see [
28] were grown in D-MEM+GlutaMAX™-I supplemented with 10% FBS, 1% P/S, G-418 (200 µg/mL), and puromycin (2.5 µg/mL).
CHO-wt and CHO-PS1 cells were seeded at a density of 5 × 10⁵ cells on 35 mm tissue culture dishes and transfected the following day with plasmid cDNA using Lipofectamine™ 3000 (Invitrogen™, Life Technologies, Paisley, UK) according to the manufacturer’s instructions. The plasmids employed encoded: PCI “empty” vector (Promega, Madison, WI, USA) serving as a negative control; human AChE-T variant, the most common in the brain, under the cytomegalovirus (CMV) promoter-enhancer (a generous gift from Dr. H. Soreq, The Institute of Life Sciences, The Hebrew University of Jerusalem, Jerusalem, Israel); and PRiMA-HA complementary DNA containing the full-length mouse PRiMA isoform I with a hemagglutinin (HA) epitope inserted before the C-terminus stop codon (a generous gift from Dr. K. Tsim, Department of Biology and Center for Chinese Medicine, The Hong Kong University of Science and Technology Hong Kong, China). Cells were transfected with 4 µg of PCI or 4 µg of AChE-T or 2 µg of AChE-T plus 2 µg PRiMA-HA.
To knock down the PS1 gene expression in CHO-PS1, cells were transfected with 50 nM human PS1 siRNA (Cat. No sc-36312, Santa Cruz, Dallas, TX, USA or BLOCK-iT™ Alexa Fluor™ Red Fluorescent Control Oligo 50 nM (Cat. No 14750100, Invitrogen, Waltham, MA, USA) as a negative control. The transfection was repeated the following day at a lower concentration of 30 nM. After 24 h, the cells were solubilized. Uptake of BLOCK-iT by cells was assessed using fluorescence microscopy.
For treatment with Aβ synthetic peptide, Aβ1–42 (Aβ42) (American Peptide Co., Inc., Sunnyvale, CA, USA) and the scrambled control peptide (AIAEGDSHVLKEGAYMEIFDVQGHVFGGKIFRVVDLGSHNVA) were dissolved in sterilized distilled water at a concentration of 1 mg/mL, aliquoted, and stored at −80 °C. Suspensions of Aβ42 or the scrambled peptide corresponding to a final concentration of 5 μM were added to each culture 4 h after the AChE and PRiMA transfection and the treatment was repeated 24 h later. Once Aβ42 preparations had been added to the cells, the medium was no longer changed.
After 48h of AChE plus PRiMA transfection, cells were washed with phosphate–saline buffer (PBS) and resuspended in 120 µL ice-cold extraction buffer: 50 mM Tris-HCl, pH 7.5, 150 mM NaCl, 5m M EDTA, 1% (w/v) Nonidet P-40, 0.5% (w/v) Triton X-100 and supplemented with the protease inhibition cocktail as mentioned above. Cell lysates were sonicated and centrifuged at 70,000× g at 4 °C for 1 h, and then supernatants were collected and frozen at −80 °C until assayed. AChE activity was measured to determine transcription efficacy.
4.3. AChE Assay and Total Protein Determination
AChE activity was determined by a modified microassay version of the colorimetric Ellman method [
46]. AChE was assayed with 1 mM acetylthiocholine iodide (Cat. No A-5751, Sigma-Aldrich Co.) in the presence of 50 µM tetraisopropyl pyrophosphoramide (Iso-OMPA, Cat. No T1505, Sigma-Aldrich Co.) to block any contamination from butyrylcholinesterase. One milliunit (mU) of AChE activity was defined as the number of nmoles of acetylthiocholine hydrolyzed per min at 22 °C.
Enzymatic activity from the membrane surface of the cells was measured in wells with attached intact cells. For that, wells were washed with PBS and then Ellman’s assay was performed. Then, cells were washed to eliminate any residue left from the enzymatic activity assay and protein concentration was determined in the well to normalize the results obtained.
Total protein concentrations were determined using the bicinchoninic acid method, with bovine serum albumin (BSA) as standard (Cat. No 23225, ThermoFisher, Waltham, MA, USA), according to manufacturer’s instructions.
4.4. Sedimentation Analysis
Molecular forms of AChE in brain and cellular extracts were separated according to their sedimentation coefficients by ultracentrifugation on 5–20% (w/v) continuous sucrose gradients in 50 mM Tris-HCl (Ph 7.4) containing 150 mM NaCl, 50 mM MgCl2 (Cat. No M9272, Sigma-Aldrich Co.), and 0.5% Triton X-100. Equal sample volumes were carefully added onto the top of the gradient and ultracentrifugation was carried out for 4 h at 250,000× g and 4 °C in a Beckman TLS 55 rotor. After centrifugation, 30 fractions were gently collected from the top of the tube and assayed for AChE activity to identify individual AChE forms (G4 = tetrameric species, G1 + G2 = monomers plus dimers). Catalase (11.4S) and alkaline phosphatase (6.1S) were employed as markers of known sedimentation coefficient to identify AChE molecular forms.
4.5. Cell-Surface Biotinylation Assay
The EZ-Link™ Sulfo-NHS-SS Biotinylation Kit (Cat. No 21445, ThermoFisher) was used to determine the presence AChE on cell surface in CHO-wt and CHO-PS1 cells transfected with AChE plus PRiMA cDNAs. Briefly, cells were incubated with EZ-Link™ Sulfo-NHS-SS-Biotin (Cat. No 21331, ThermoFisher) for 30 min at 4 °C. Then, biotinylated cells were quenched with PBS plus 50 mM NH4Cl (Cat. No A9434, Sigma-Aldrich). Afterward, cells were solubilized with the cell lysis buffer and centrifuged at 10,000× g for 2 min at 4 °C to obtain the supernatant, which was incubated with the NeutrAvidin overnight at 4 °C. Unbound fraction to NeutrAvidin was obtained after centrifugation 30 s at 6000× g and the supernatant stored. Proteins bound with NeutrAvidin were eluted with Laemmli-sodium dodecyl sulphate (SDS) buffer (Cat. No 15403949, ThermoFisher) plus 50 mM dithiothreitol (DTT, Cat. No DTT-RO, Roche, Basel, Switzerland). The bound and unbound AChE species were assayed by Western blotting.
4.6. Lectin Binding Analysis of AChE
Analysis of AChE glycosylation was performed by lectin binding assays. The Sepharose-conjugated lectins employed were: Canavalia ensiformis (Con A, Cat. No C9017, Sigma-Aldrich Co.), Lens culinaris agglutinin (LCA, Cat. No L0511, Sigma-Aldrich Co.), Triticum vulgaris agglutinin (wheat germ, WGA, Cat. No L1394, Sigma-Aldrich Co.), and Sambucus nigra (SNA, Cat. No AL-1303-2, Vector laboratories, Newark, CA, USA). Aliquots of 300 μL of brain extracts or 120 μL of cell homogenates were mixed with 80 μL or 50 μL of immobilized lectins (equal amount of protein to each lectin), respectively, and incubated overnight at 4 °C with gentle agitation. AChE-lectin complexes were separated from free AChE by centrifugation, and bound AChE was eluted from the lectin by incubation with Laemmli SDS sample buffer for 5 min at 98 °C. The AChE activity unbound to the lectin was analyzed in the supernatant fraction and both the bound and unbound AChE species were assayed by Western blotting.
4.7. Western Blotting Assays
AChE, PRiMA-HA, and PS1 were analyzed by immunoblotting after sodium dodecyl sulphate-polyacrylamide electrophoresis (SDS-PAGE) under fully reducing conditions. Prior to electrophoresis, samples were denatured by heating at 98 °C for 7 min to specifically target AChE and at 50 °C for 15 min to PS1. Samples of brain or cell extracts were resolved on 8.5% or 10% SDS-polyacrylamide slab gels, respectively, loading 50 μg of protein. For lectin binding and biotinylated assays, equal amounts of the extract and unbound fraction and equivalent volume of the bound fraction were resolved.
Following electrophoresis, proteins were blotted onto nitrocellulose membranes (0.2 µm, Cat. No 1620168, Bio-Rad, Hercules, CA, USA), blocked with commercial blocking buffer (Cat. No 927-70001, LI-COR Biosciences, Lincoln, NE, USA), and probed with the following primary antibodies: anti-C-terminal AChE antibody (A11, RRID: AB_10917070, Santa Cruz); anti-HA antibody (HA, RRID: AB_260070, Sigma-Aldrich Co.); anti-PS1 antibody (against loop a.a. 275-367, RRID: AB_91785, Sigma-Aldrich Co.). A rabbit anti-glyceraldehyde 3-phosphate dehydrogenase antibody (GAPDH, RRID: AB_307275, Abcam, Cambridge, UK) was used as loading control. Western blots for different antibodies were performed separately to avoid re-probing of blots. Antibody binding was detected with the corresponding conjugated secondary antibody (IRDye 800CW goat anti-mouse IgG and IRDye 680CW goat anti-rabbit; RRID: AB_2687825 and AB_10956166, respectively, LI-COR Biosciences) and visualized on an Odyssey CLx Infrared Imaging System (RRID: SCR_014579, LI-COR Biosciences). Densitometric quantification of the signal from immunoreactivity bands was obtained employing LI-COR Software (Image Studio, RRID: SCR_015795, LI-COR Biosciences). For semi-quantitative analysis of AChE protein in brain samples, protein levels were normalized to GADPH.
4.8. Confocal Microscopy
Cellular localization of AChE was analyzed by immunocytochemistry in CHO-wt and CHO-PS1 cells. Cells were seeded at a concentration of 50,000 cells/well in a 12-well sterile culture plate containing one 18 mm diameter glass coverslip per well followed by transfection with both AChE and PRiMA cDNA. After 48 h, cells were fixed with methanol (Cat. No 8402.2500, J.T. Baker, Radnor, PA, USA) and after blocked with 2% BSA (Cat. No A3059, Sigma-Aldrich Co.) PBS-based buffer with 3.25 mM digitonin (Cat. No D141, Sigma-Aldrich Co.). Then, they were incubated with the primary antibodies: an anti-Na+/K+ ATPase antibody (ATPase, RRID: AB_1310695, Abcam); Anti-C-terminal AChE antibody (A11, RRID: AB_10917070, Santa Cruz); or anti-trans-Golgi network protein 2 (TGN46, RRID: AB_10597396, Proteintech, Rosemont, IL, USA). Then, incubation with the corresponding secondary antibody (Alexa Fluor® 488 goat anti-rabbit IgG, Cyanine3 goat anti-mouse, Cyanine5 goat anti-mouse; RRID: AB_143165, AB_2534030, AB_2534033, respectively; Invitrogen) was completed. For glycosylation imaging, fixed cells were incubated with DyLight® 649-LCA conjugated (Cat. No DL-1048-1, Vector Laboratories) for 15 min at room temperature prior to blocking.
To analyze location of proteins in plasmatic membrane, the blocking buffer did not include digitonin to avoid permeation of the membrane. Dual and triple immunofluorescence images were captured with sequential scans using a Leica laser-scanning spectral vertical confocal microscope (Leica TCS SP2, RRID: SCR_020231, Leica) and images digitalized and adjusted using Imaris (v9.3, RRID: SCR_007370) software.
4.9. Statistical Analysis
All data were analyzed with GraphPad Prism 7.0 (GraphPad Software Inc., San Diego, CA, USA). The Shapiro–Wilk test was used to analyze the distribution of each variable. The statistical analyses performed for parametric data were the Student’s unpaired t-test for comparisons between two groups, or by one-way ANOVA followed by a Tukey multiple comparisons test when three groups were compared. Non-parametric data were compared using the Mann–Whitney test for comparisons between two groups, and the Kruskal–Wallis test followed by a Dunn’s multiple comparisons test when three groups were compared. Results were presented as mean ± standard error of the mean (SEM), and p values < 0.05 were considered significant. Atypical data were removed from analysis using the ROUT method (Robust regression and Outlier removal), Q = 1%.

 and
and 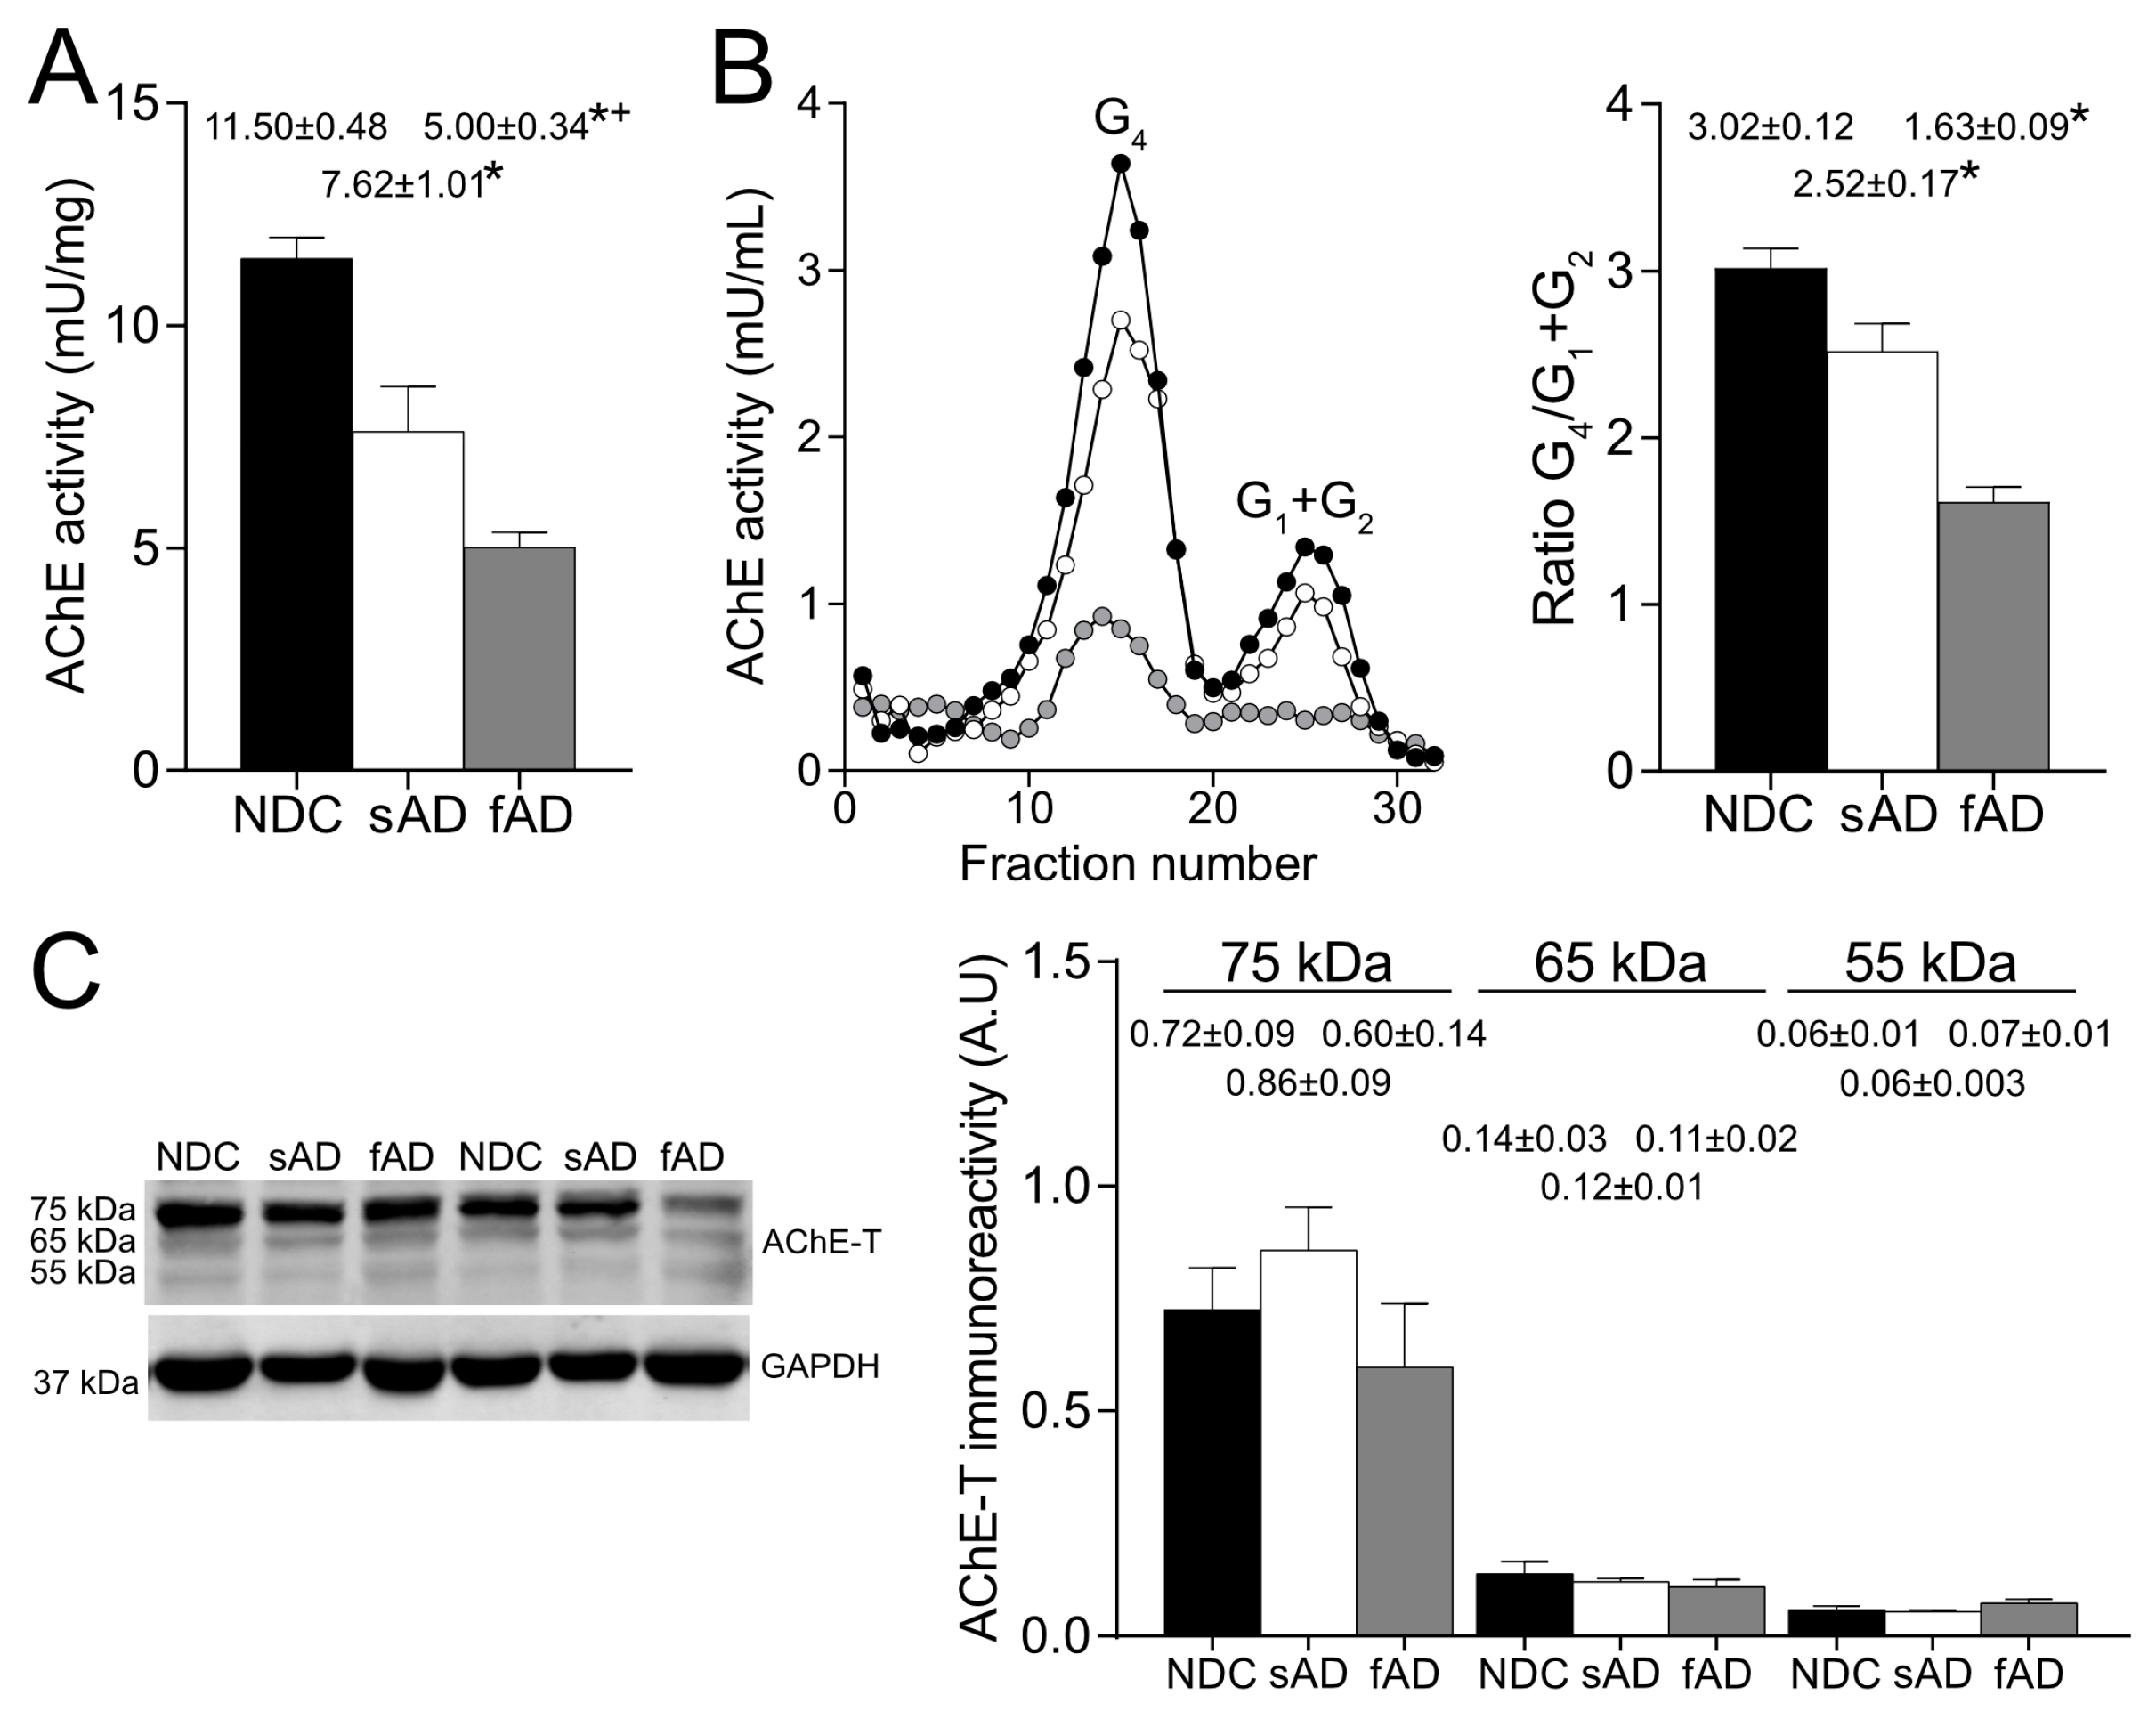


