Article

Nonspecific Amyloid Aggregation of Chicken Smooth-Muscle Titin: In Vitro Investigations

by
Alexander G. Bobylev
1,*,
Elmira I. Yakupova
2,
Liya G. Bobyleva
1,
Nikolay V. Molochkov
1,
Alexander A. Timchenko
3,
Maria A. Timchenko
4,
Hiroshi Kihara
5,
Alexey D. Nikulin
3,
Azat G. Gabdulkhakov
3,
Tatiana N. Melnik
3,
Nikita V. Penkov
6,
Michail Y. Lobanov
3,
Alexey S. Kazakov
4,
Miklós Kellermayer
7,
Zsolt Mártonfalvi
7,
Oxana V. Galzitskaya
1,3 and
Ivan M. Vikhlyantsev
1,8,*
1
Institute of Theoretical and Experimental Biophysics, Russian Academy of Sciences, Pushchino, 142290 Moscow Region, Russia
2
A.N. Belozersky Institute of Physico-Chemical Biology, Lomonosov Moscow State University, 119991 Moscow Region, Russia
3
Institute of Protein Research, Russian Academy of Sciences, Pushchino, 142290 Moscow Region, Russia
4
Institute for Biological Instrumentation, Federal Research Center, Pushchino Scientific Center for Biological Research of the Russian Academy of Sciences, Pushchino, 142290 Moscow Region, Russia
5
Department of Early Childhood Education, Himeji-Hinomoto College, 890 Koro, Kodera-cho, Himeji 679-2151, Japan
6
Institute of Cell Biophysics, FRC PSCBR, Russian Academy of Sciences, Pushchino, 142290 Moscow Region, Russia
7
Department of Biophysics and Radiation Biology, Semmelweis University, 1085 Budapest, Hungary
8
Institute of Fundamental Medicine and Biology, Kazan Federal University, 420008 Kazan, Russia
*
Authors to whom correspondence should be addressed.
Int. J. Mol. Sci. 2023, 24(2), 1056; https://doi.org/10.3390/ijms24021056
Submission received: 28 November 2022 / Revised: 29 December 2022 / Accepted: 29 December 2022 / Published: 5 January 2023

Abstract

:
A giant multidomain protein of striated and smooth vertebrate muscles, titin, consists of tandems of immunoglobulin (Ig)- and fibronectin type III (FnIII)-like domains representing β-sandwiches, as well as of disordered segments. Chicken smooth muscles express several titin isoforms of ~500–1500 kDa. Using various structural-analysis methods, we investigated in vitro nonspecific amyloid aggregation of the high-molecular-weight isoform of chicken smooth-muscle titin (SMTHMW, ~1500 kDa). As confirmed by X-ray diffraction analysis, under near-physiological conditions, the protein formed amorphous amyloid aggregates with a quaternary cross-β structure within a relatively short time (~60 min). As shown by circular dichroism and Fourier-transform infrared spectroscopy, the quaternary cross-β structure—unlike other amyloidogenic proteins—formed without changes in the SMTHMW secondary structure. SMTHMW aggregates partially disaggregated upon increasing the ionic strength above the physiological level. Based on the data obtained, it is not the complete protein but its particular domains/segments that are likely involved in the formation of intermolecular interactions during SMTHMW amyloid aggregation. The discovered properties of titin position this protein as an object of interest for studying amyloid aggregation in vitro and expanding our views of the fundamentals of amyloidogenesis.

1. Introduction

It is known that, to normally perform their biological functions, newly synthesized proteins must fold into a certain three-dimensional structure [1,2]. The folded structures of proteins are only moderately stable. Certain factors, such as genetic mutations or disturbances of protein synthesis and degradation, can lead to incorrect protein stacking or misfolding followed by the formation of pathological aggregates [3]. Improper protein stacking is a rather common phenomenon associated most often with the development of diseases such as amyloidoses [4]. With the development of amyloidosis in humans or animals, the protein loses its native conformation to form amyloids, aggregates of incorrectly folded forms of protein having a specific structure. Amyloid aggregates, as well as their intermediate forms (mainly oligomers), may lead to cellular death [5,6,7,8,9,10].
Amyloid aggregates of many proteins have been found in various tissues and organs of amyloidosis humans and animals. These diseases include, in particular, liver amyloidosis, Alzheimer’s disease, Parkinson’s disease, type II diabetes, and prion diseases, as well as systemic amyloidoses [11,12,13,14]. Amyloids have a number of specific characteristics, such as the ability to bind to Congo Red and thioflavin T; they are resistant to proteases and insoluble in most solvents [14]. The main property of amyloids, regardless of the type of aggregates they form, is the presence of a quaternary cross-β structure [15,16].
Besides pathological amyloids, there are functional amyloids—protein aggregates that perform certain functions. Functional amyloids are found in many species of living organisms from plants, fungi, and protozoa to higher animals, including humans [17,18,19,20,21,22,23,24,25,26,27].
Despite the extensive investigation, there is as yet no clear understanding of the molecular mechanisms of amyloid aggregation. The differences behind the mechanisms of the formation of functional versus pathological amyloids have yet to be resolved. This is probably due to the complexity of the object of study. In order to obtain the required information about amyloids, it is necessary to use an array of methods (such as nuclear magnetic resonance spectroscopy, transmission electron microscopy (TEM), cryo-electron microscopy, atomic-force microscopy (AFM), X-ray diffraction, small-angle X-ray scattering (SAXS), Fourier-transform infrared spectroscopy (FTIR), which is often technically difficult to perform, since each of the methods has its own limitations regarding the object of study.
Titin (also called connectin [28,29]) is one of the most difficult objects when studying its aggregation properties. In vitro studies on isolated titin preparations revealed a tendency of this protein to form various sorts of intermolecular interactions that led to the formation of oligomers and aggregates. Thus, the aggregation of titin in vitro was first investigated in 1993 [30]. It was shown that, in solutions of low ionic strength (0.1 M KCl near neutral pH (6.5)), striated muscle titin assembles into higher-order aggregates [30]. In 2003, atomic-force microscopy revealed that, in a solution containing 25 mM imidazole–HCl, 0.2 M KCl, 4 mM MgCl2, 1 mM EGTA, 0.01% NaN3, 1 mM dithiothreitol (DTT), 20 µg/mL leupeptin, 10 µM E-64, pH 7.4, isolated titin molecules are capable of self-assembly into oligomers within a mere 10 min [31]. The observed titin oligomers could be divided into bimolecular species, as well as consisting of several molecules. In each case, however, a globular head was observed, with which other titin molecules interacted, thus forming an oligomer [31].
In vitro investigations of the specificity of aggregation between titin domains conducted in 2005 concluded that the ability for aggregation increases when the identity of amino acid sequences of the domains is greater than 40% [32]. In 2015, the in vitro aggregation of some titin Ig-domains obtained by a recombinant method was studied [33]. The neighboring identical titin domains were shown to be able to form misfolded structures [33].
The experiments in vitro with molecular simulations carried out in 2015 showed that during the refolding of tandem repeats (I27–I27 and I27–I28 immunoglobulin-like domains of titin), independent of sequence identity, more than half of all molecules transiently formed a wide range of misfolded conformations [33]. Simulations suggested that a large fraction of these misfolds resemble an intramolecular amyloid-like state named “intramolecular amyloids” [33]. These authors also reported that, during the refolding of tandem repeats, the development of a strand-swapped long-lived misfolded state without an amyloid-like structure is possible [33].
In 2016, the ability of a low-molecular-weight (500 kDa) isoform or possibly a truncated form of chicken smooth-muscle titin (SMTLMW) to form in vitro amyloid aggregates was described [34]. In 2018, the ability of that isoform to form in vitro amyloid aggregates with different properties in two solutions differing in ionic strength was found [35].
In the present work, using a number of structural analysis methods, we investigated the formation of an in vitro amyloid structure of a chicken smooth-muscle titin isoform with a molecular weight of ~1500–1600 kDa (SMTHMW). A peculiar feature of this protein and, in particular, this isoform of titin relative to other amyloid proteins studied is its large size. One titin molecule is comparable to the size of the protofibrils of some amyloid proteins. Thus, it was of interest to elucidate whether this high-molecular-weight isoform of smooth-muscle titin was capable of forming aggregates, their structural features, and the type of aggregation—amyloid/non-amyloid. The results obtained point at the nonspecific amyloid aggregation of the protein.

2. Results

2.1. DLS Analysis of SMT Aggregations

Based on our previous research into SMTLMW [34,35] and SMTHMW [36], we were aware of the conditions required to form amyloid aggregates of these proteins. This work, in order to understand the features of chicken titin aggregation rate, investigated the kinetics of SMTHMW aggregation. We used dynamic light scattering (DLS), the simplest and most convenient method to study the aggregation kinetics of amyloid proteins [34,35,37]. The method also enables analyzing the aggregation reversibility, which has been shown earlier for SMTLMW [35].
Figure 1a shows a change in the autocorrelation function of the scattered light upon the formation of SMTHMW aggregates in a solution containing 0.15 M glycine–KOH at pH 7.0–7.5 over 60 min. During the first 20 min of incubation, the correlation function g1(t) was observed to decay almost mono-exponentially (Figure 1a), with the subsequent emergence of a shoulder at high correlation times. This is indicative of the formation of large aggregates with smaller diffusion coefficients. After 40 min, the correlation function g1(t) featured a greater decay time and a more pronounced shoulder (Figure 1a) at high correlation times, which indicated an aggregation increase. A pronounced correlation-function shoulder was also observed during 40, 50, and 60 min of incubation (Figure 1a).
Several peaks reflecting the dimensions of SMTHMW aggregates were obtained by the correlation function analysis. Prior to the formation of aggregates, only two well-resolved peaks with the average Rh of approximately 16 nm (the dominating peak of approximately 73%) and 86 nm (the minor peak of approximately 27%) were observed (Figure 1b, 0 min). The first peak corresponds, most likely, to SMTHMW molecules, whereas the second can be indicative of their insignificant aggregation. During the first 20 min of incubation, we observed a shift of the peaks and an increase in the ratio of the volumes of the larger- and smaller-size fraction, indicating the development of the titin aggregation process (Rh~53 nm and ~479 nm) (Figure 1b).
After 40 min of the experiment, a stable fraction of larger aggregates with a hydrodynamic radius of ~1175 nm (96.7%) appeared. This fraction was also observed after 50 and 60 min of the experiment (Figure 1b). Another peak, indicating the formation of titin aggregates with the average Rh of approximately 3813 nm emerged after 50 min of incubation and, after over 60 min, Rh was more than 4475 nm. It should be noted that the peak with Rh of approximately 4500 nm was at the limit of the range for this method. Therefore, the formation of larger SMTHMW aggregates cannot be excluded (Figure 1b).
The next task was to elucidate the ability of SMTHMW aggregates to disaggregate upon increasing ionic strength. Figure 1c presents data on the partial disaggregation of SMTHMW aggregates after incubation in a solution containing 0.6 M KCl and 30 mM KH2PO4 (pH 7.0). A decrease in the percentage of particles with larger hydrodynamic radii and an increase in the number of particles with smaller hydrodynamic radii (Figure 1c) were observed.

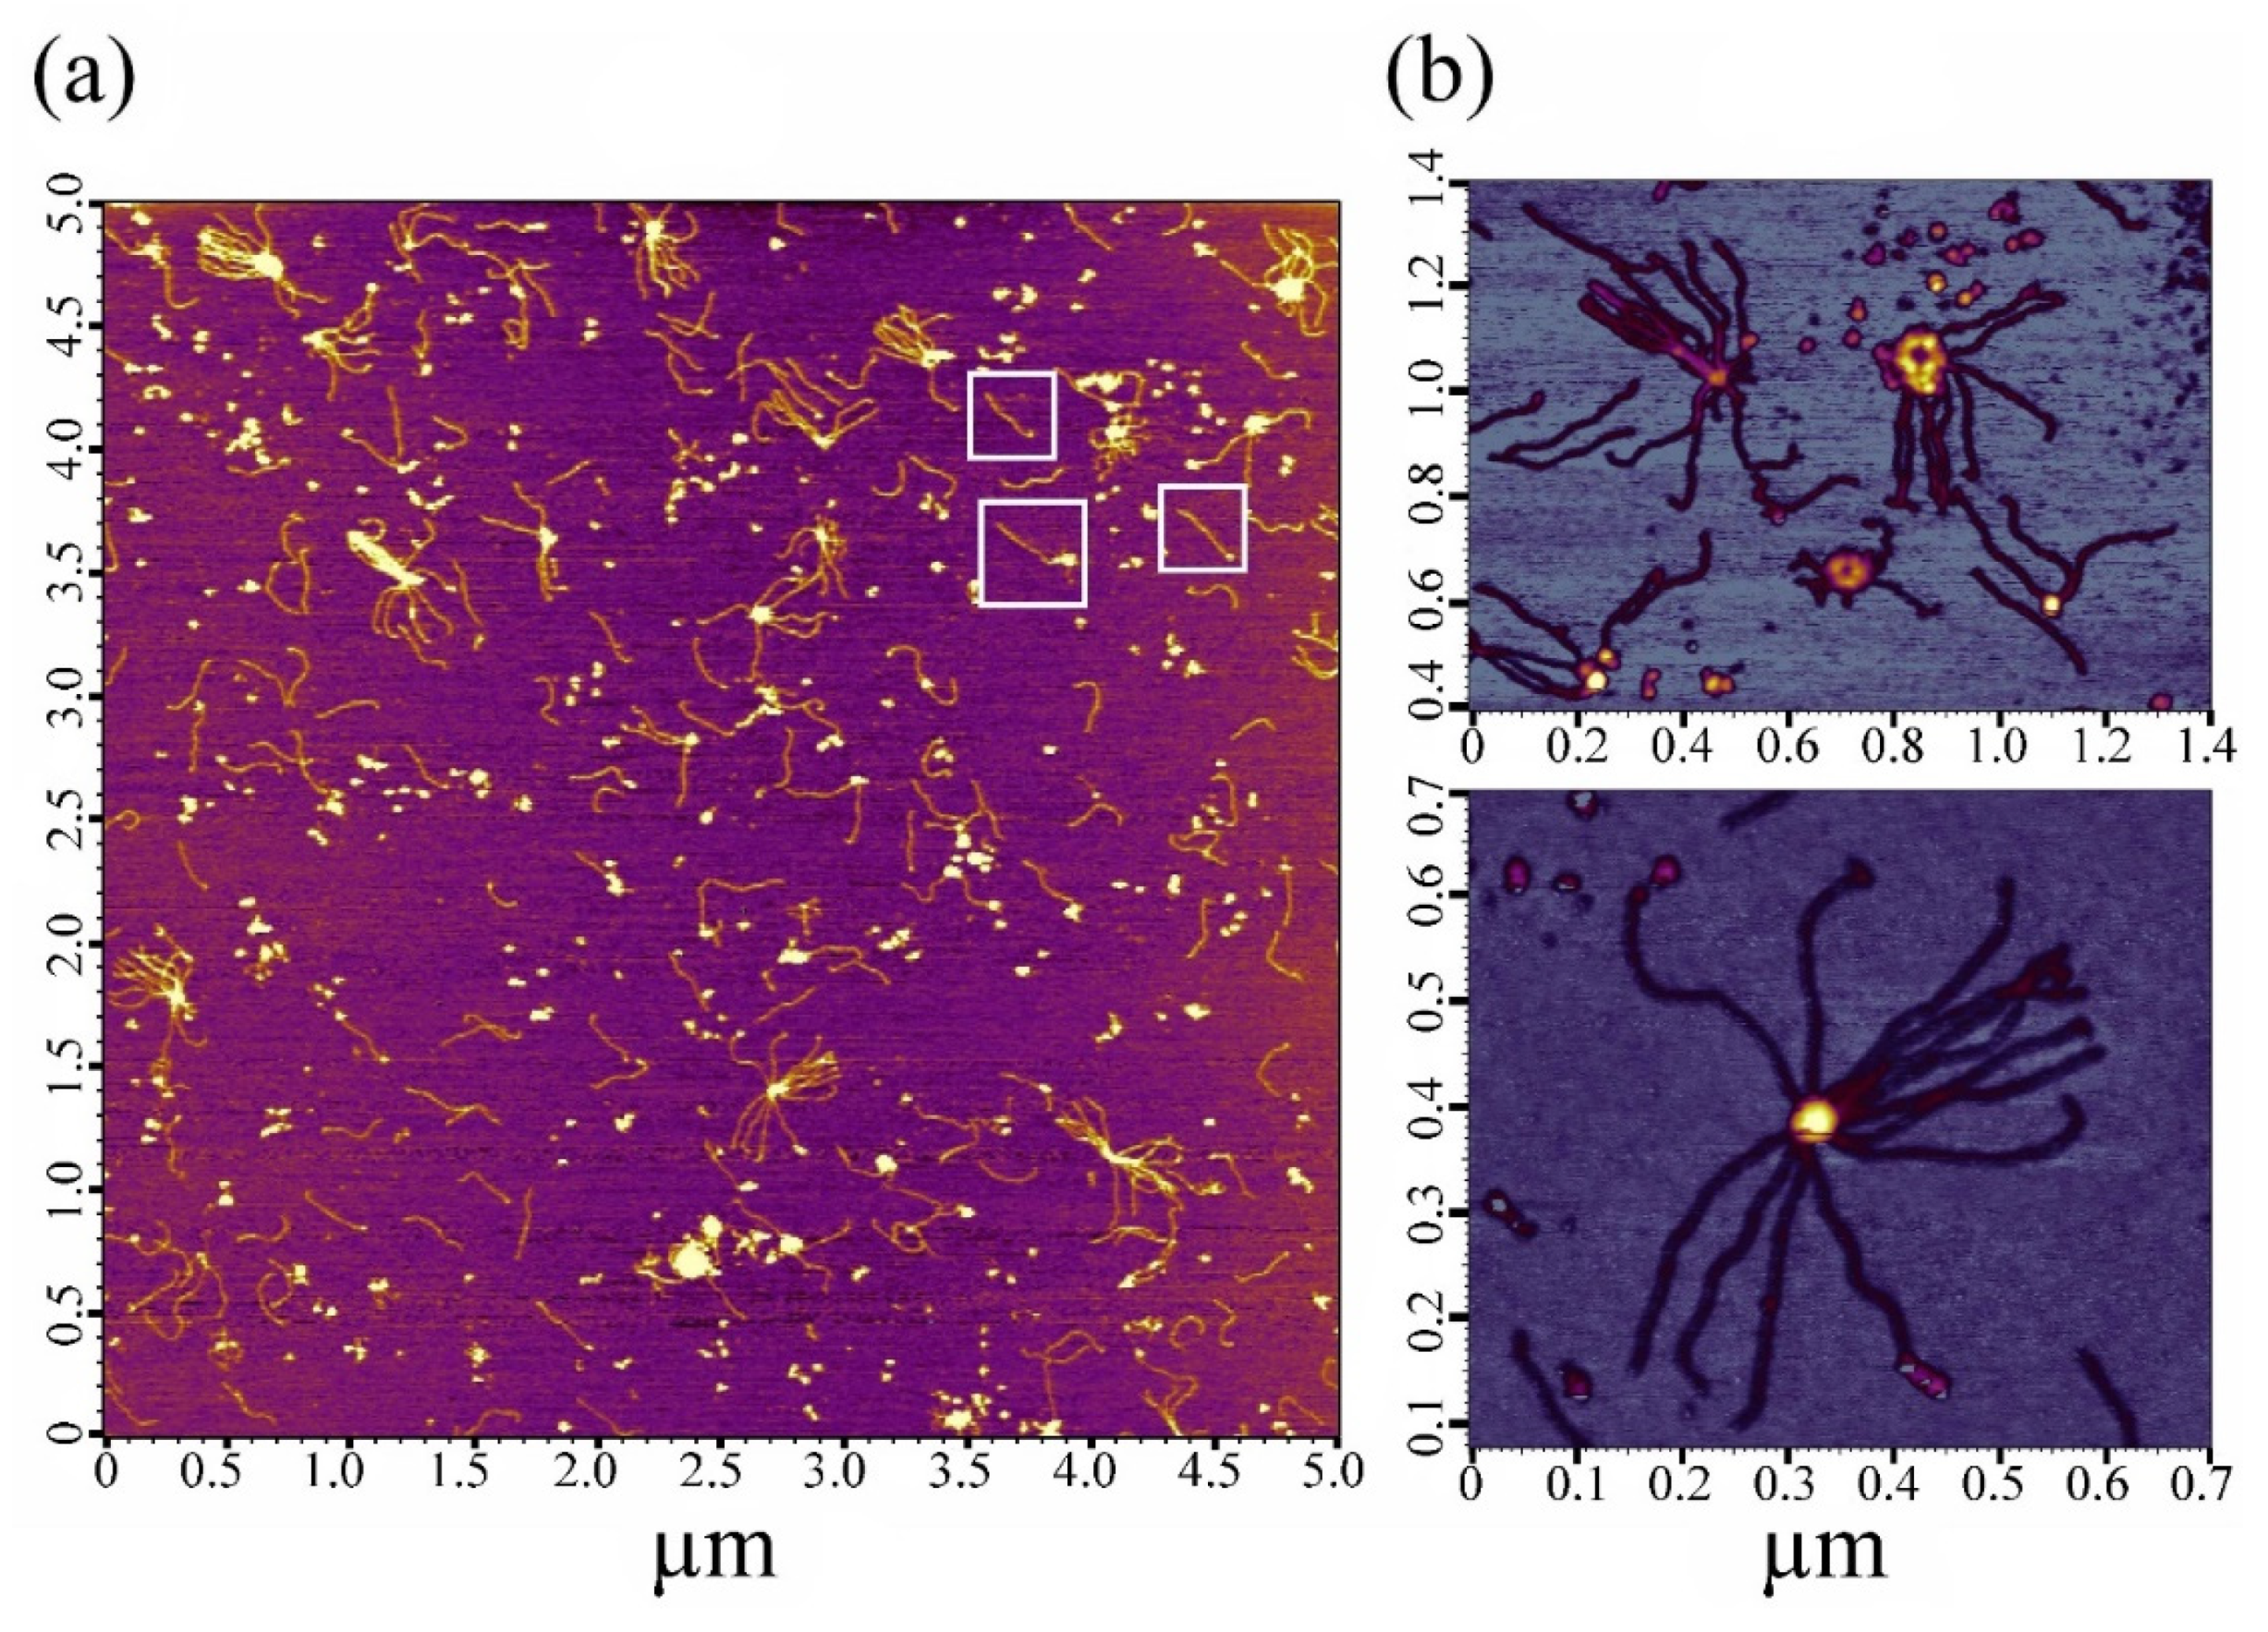
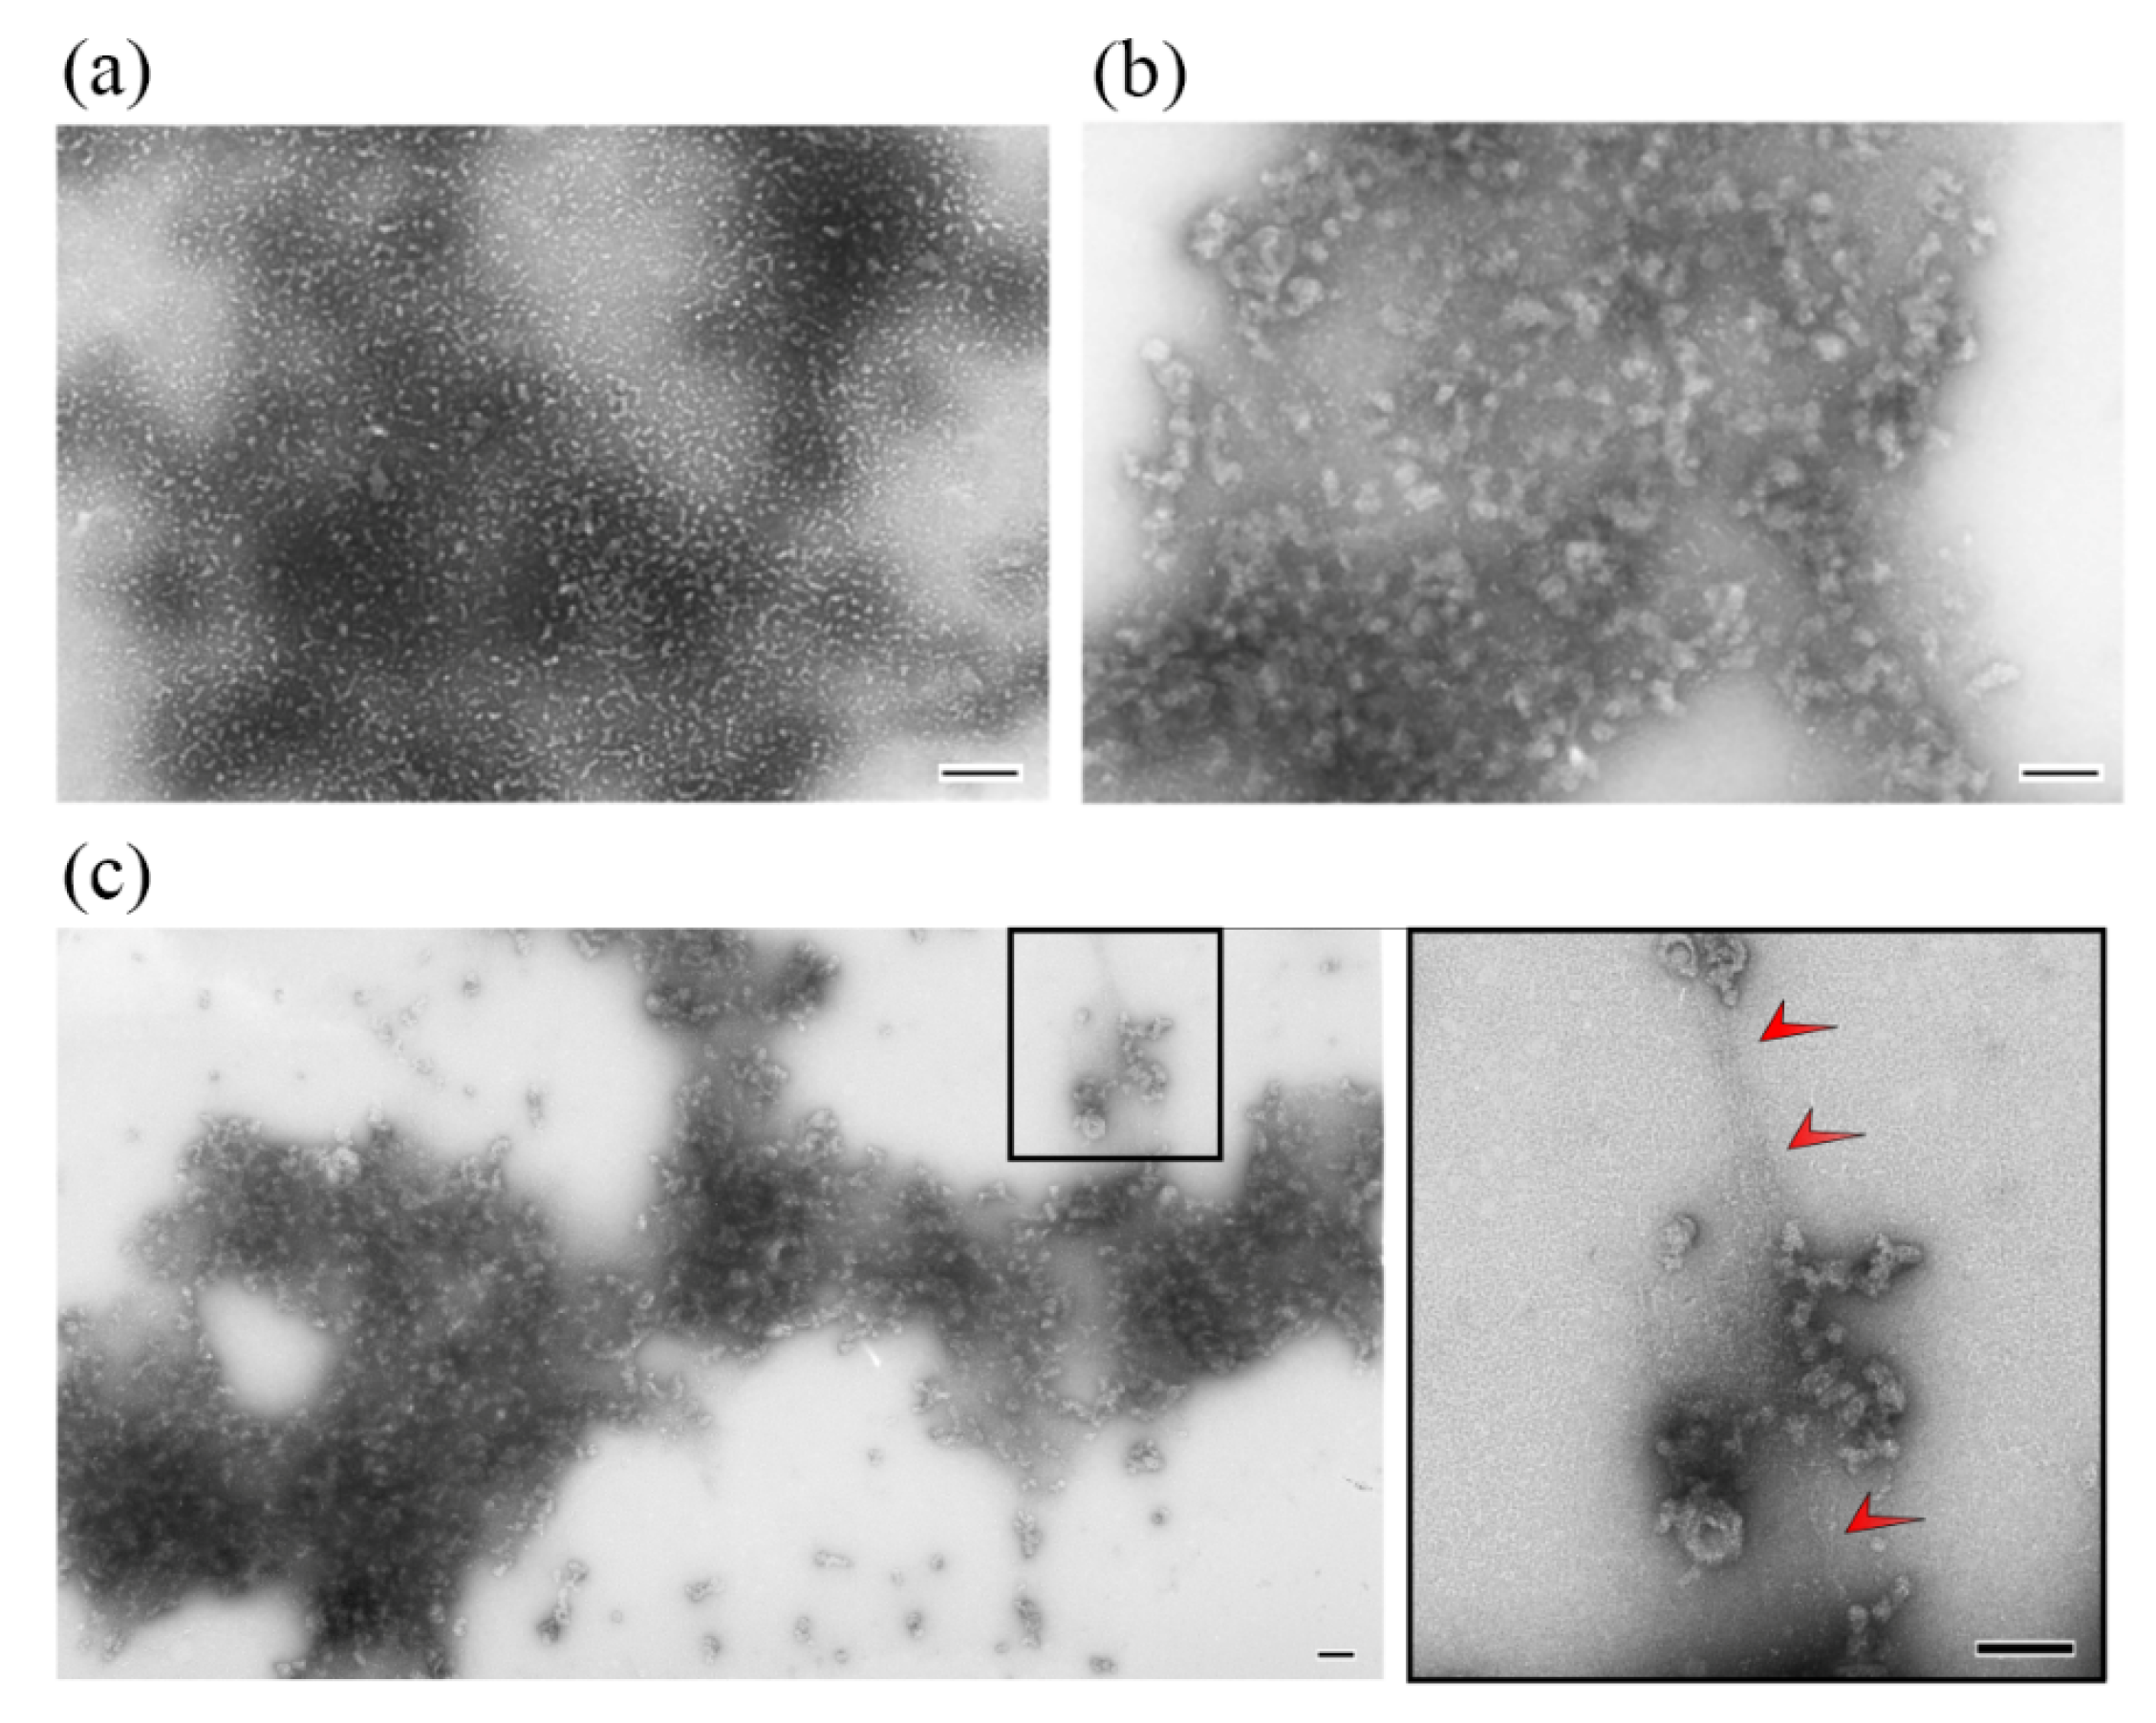
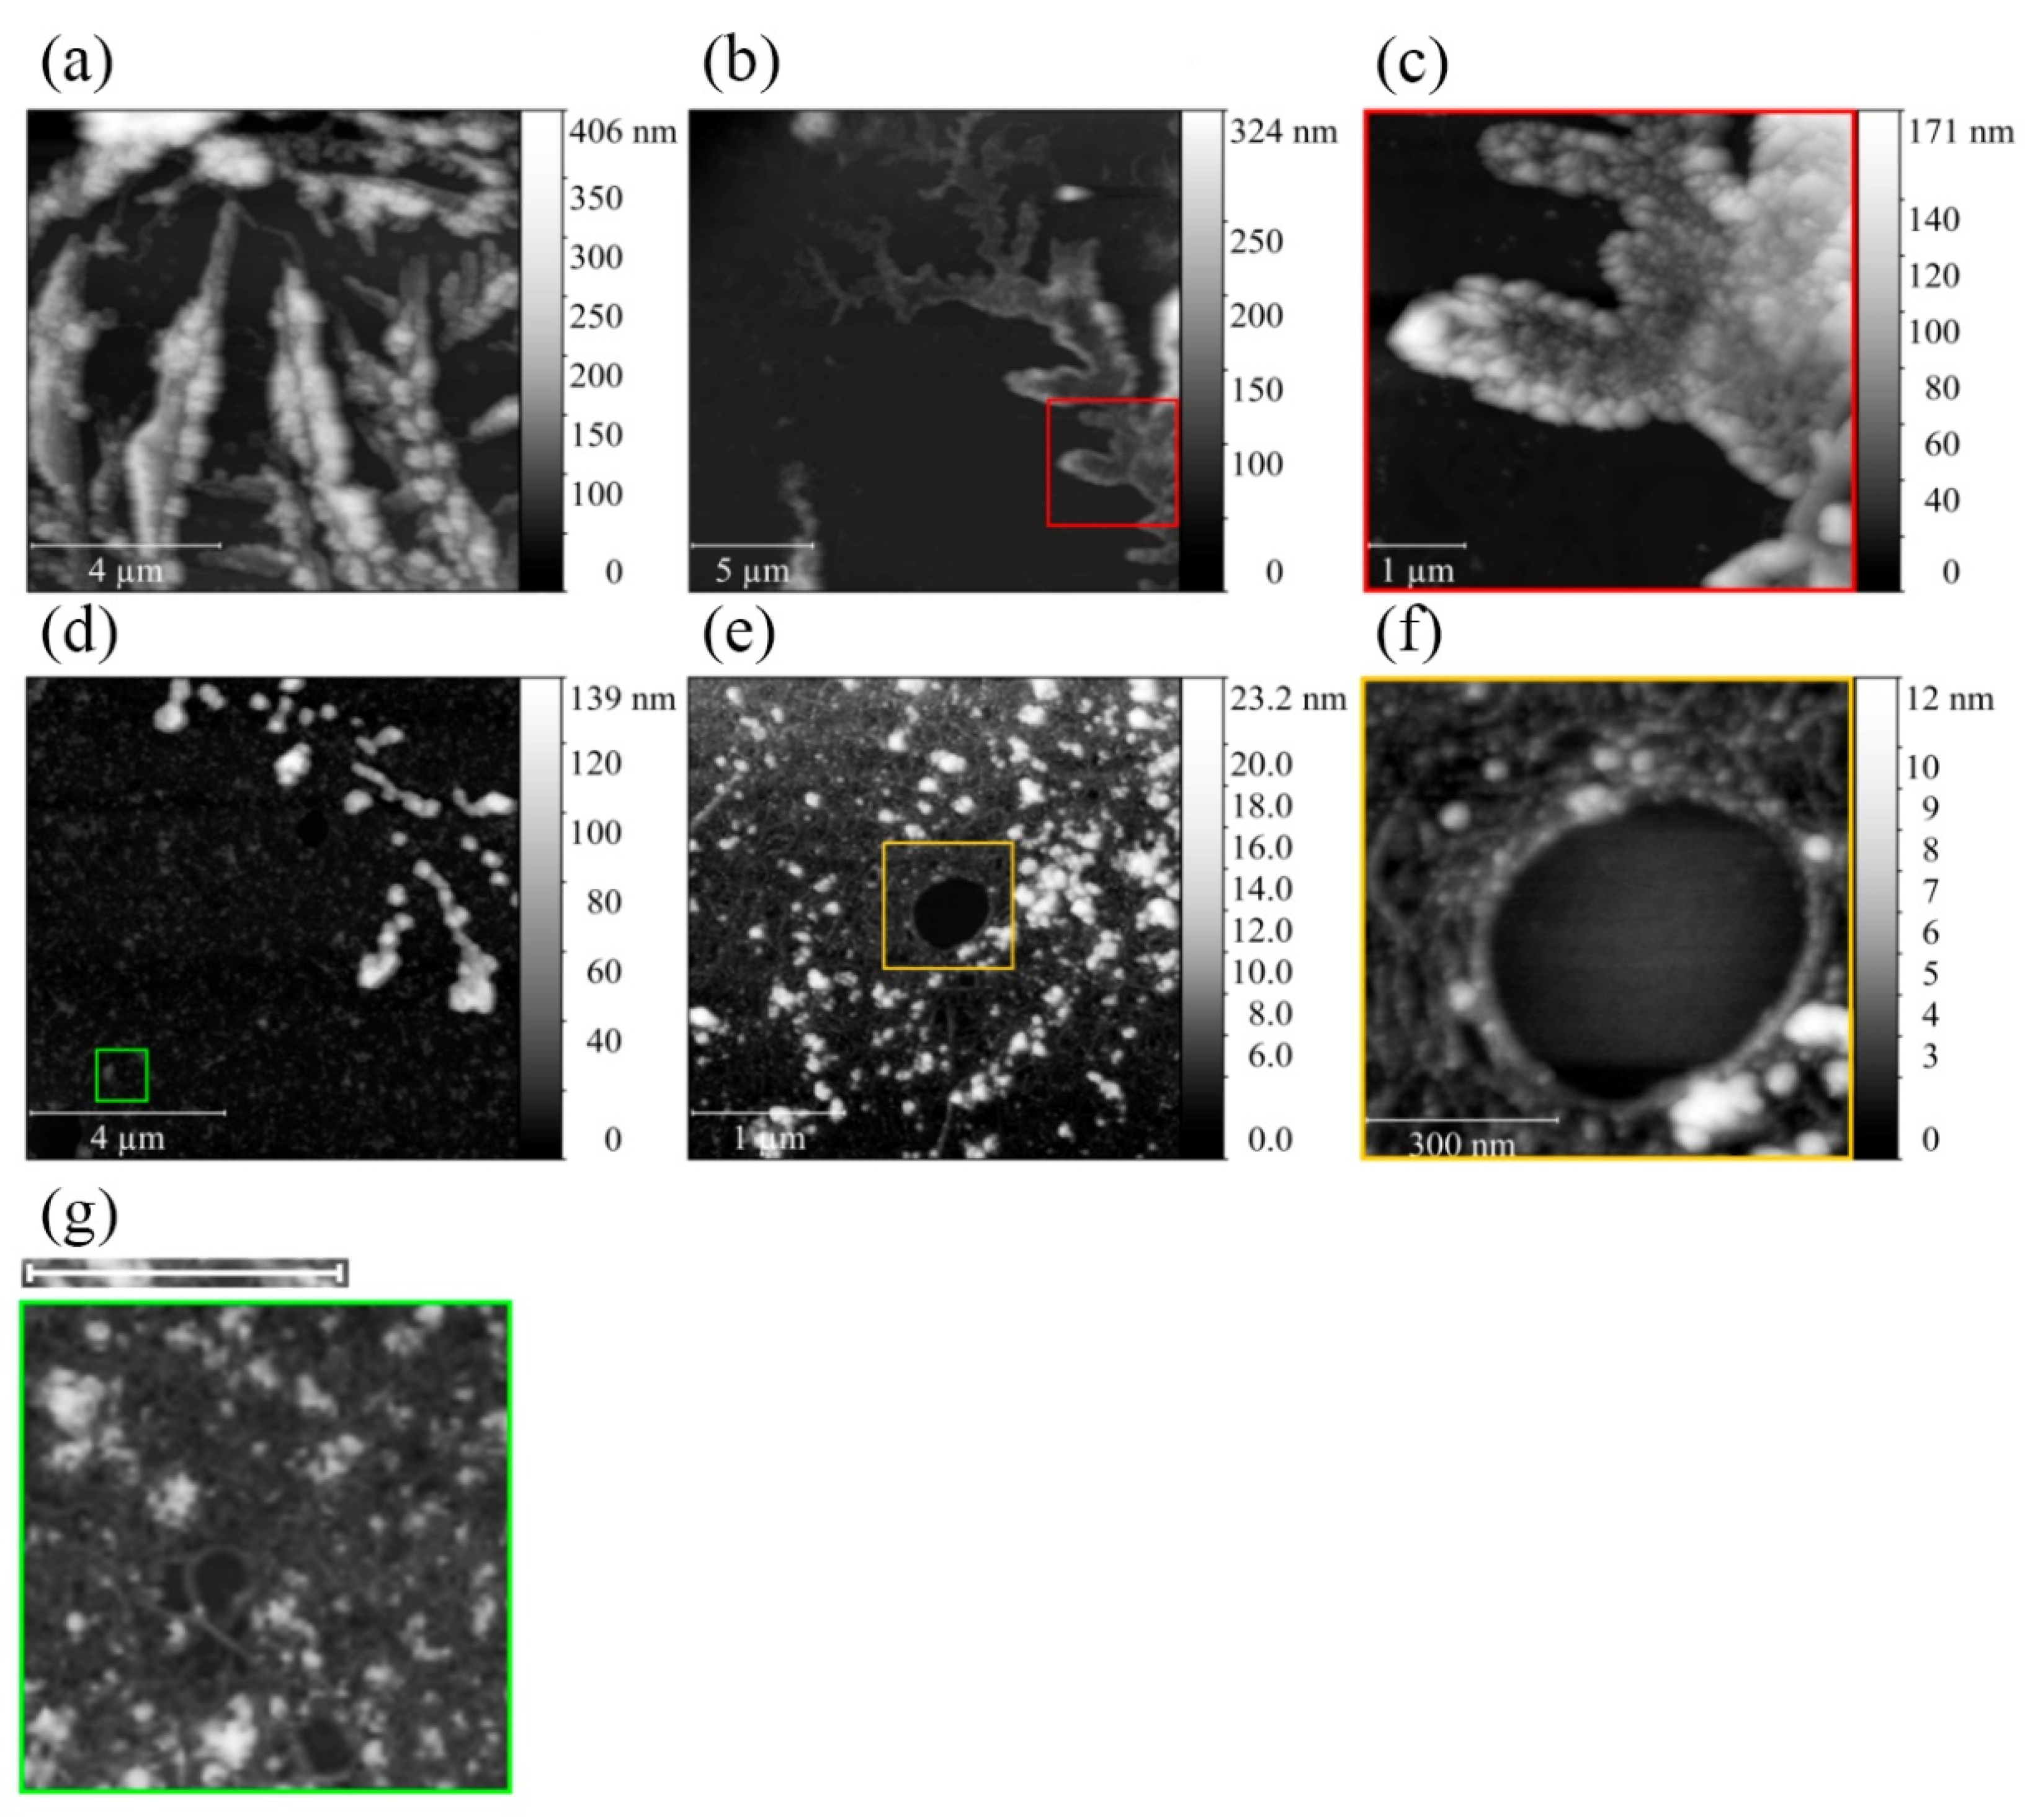
2.2. Electron and Atomic-Force Microscopy of SMTHMW Aggregates

Based on the DLS data presented above, investigations were conducted using two time intervals (1 h and 24 h). Figure 2 shows AFM images of SMTHMW molecules in a solution of 0.6 M KCl, 30 mM KH2PO4, 1 mM DTT, 0.1 M NaN3, and pH 7.0. It was found that, as in the case of striated-muscle titin [31,38,39], the smooth-muscle titin molecules had a filamentous shape with threads 3–4 nm thick and ~300 nm (on average) long with a globular head on one end (Figure 2a, inside the white squares). Besides individual molecules, oligomers of this protein were also found: several titin molecules interacting with one another, often forming a thickening in the center (Figure 2b). Similar oligomers have been found earlier in titin preparations isolated from rabbit skeletal muscles [31].
Figure 3 shows electron micrographs of negatively stained SMTHMW aggregates formed in a solution containing 0.15 M glycine–KOH, pH 7.0–7.5, at 4 °C. SMTHMW formed amorphous aggregates after 1 h and 24 h incubation (Figure 3). Aggregates became larger after 24 h of incubation. In a number of cases, filamentous structures of about 4 nm in diameter (represented, most likely, by titin filaments) were observed between amorphous aggregates (Figure 3c).
According to AFM, after 1 h, aggregation SMTHMW aggregates looked like large amorphous structures several micrometers long and up to 350 nm high (Figure 4a). After 24 h of aggregation, they had the form of branching flattened structures of more than 10 μm in length and 200–250 nm in height (Figure 4b,c).
To determine their capability of disaggregation, SMTHMW aggregates formed during 1 and 24 h were transferred to conditions with increased ionic strength (0.6 M KCl, 30 mM KH2PO4, 1 mM DTT, 0.1 M NaN3, and pH 7.0). Figure 4d presents the results of 1 h disaggregation. As can be seen in the figure, SMTHMW became much smaller and spherical amorphous aggregates of about 100–200 nm in diameter and 100–120 nm in height. Apart from amorphous aggregates, individual filaments occurred on the substrate (Figure 4g); judging by their size, they may be bundles of SMTHMW molecules.
Figure 4e,f shows the disaggregation results for SMTHMW aggregates formed for 24 h. Spherical amorphous aggregates up to 23 nm in height can be seen, as well as a network of threads with a height of 5–6 nm.

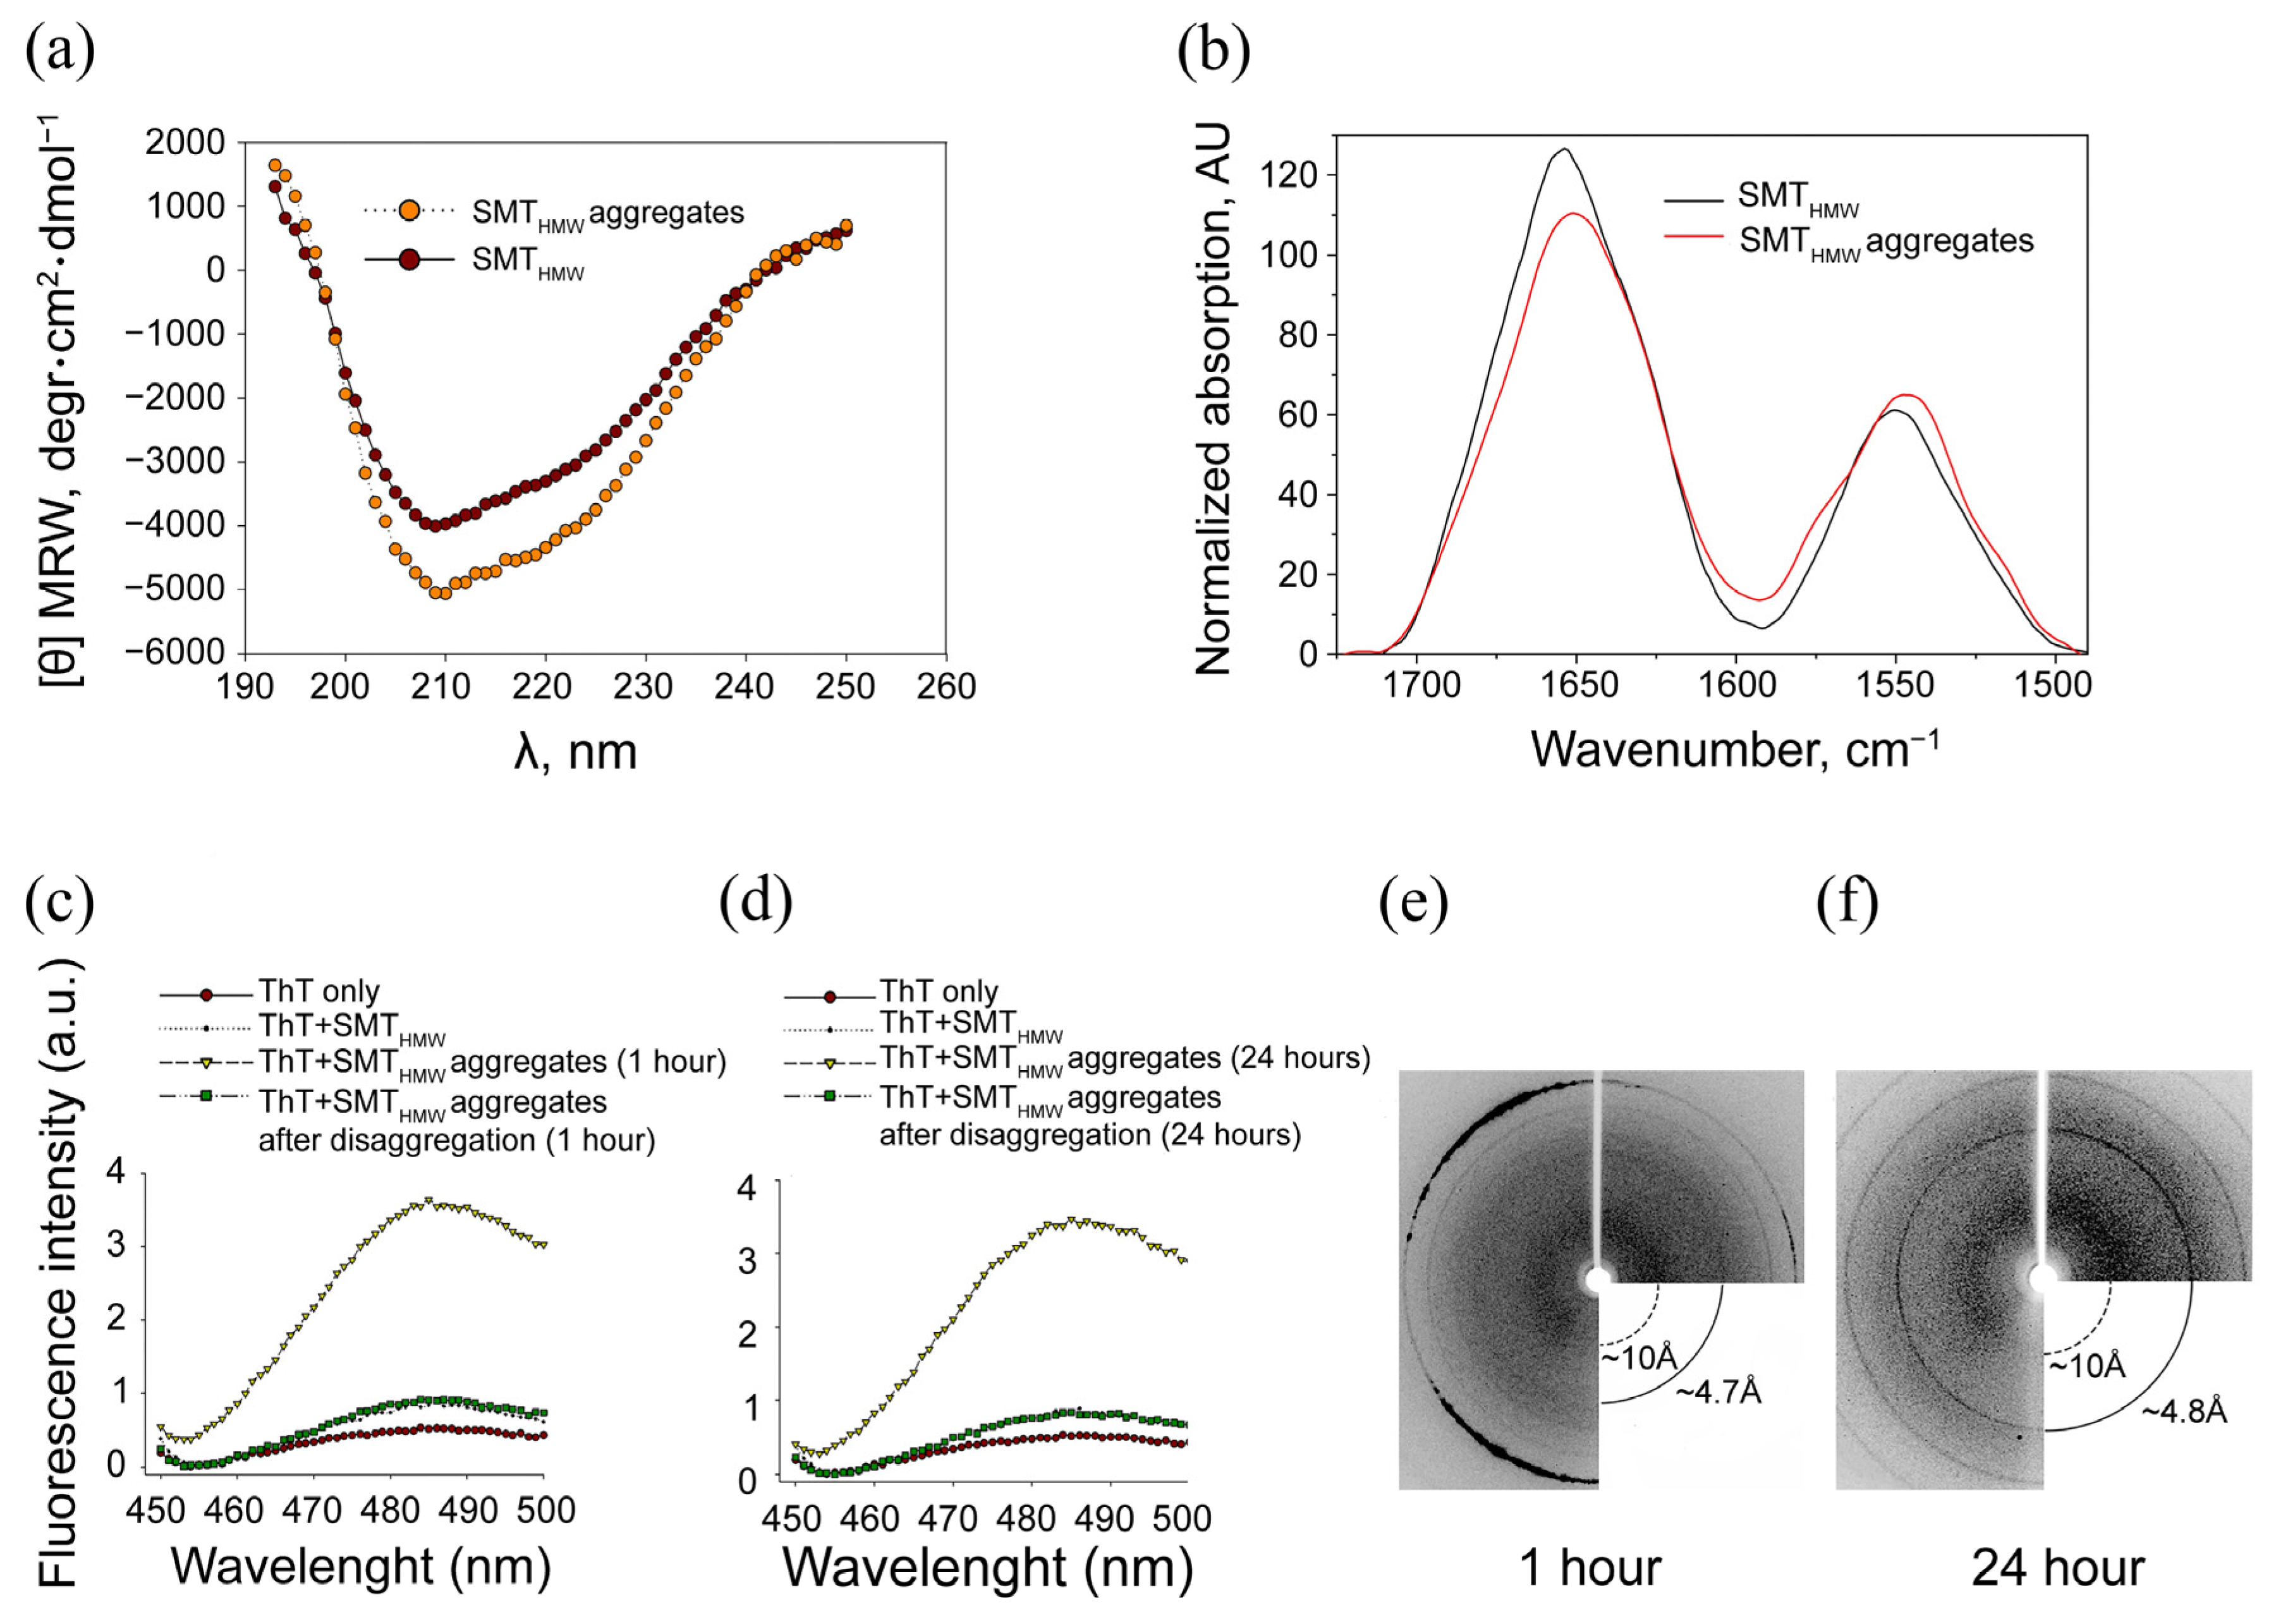
2.3. Circular Dichroism

Figure 5a illustrates the circular dichroism (CD) spectrum of SMTHMW before and after the formation of aggregates. No changes in the secondary structure were detected upon the formation of SMTHMW aggregates: after chromatography the preparation had 6 ± 6% α-helices and 41 ± 6% β-structures, 53 ± 6% of turns and a disordered structure, whereas aggregated SMTHMW had a helix and β-structure content of 5 ± 6% and 42 ± 6%, respectively, 53 ± 6% of turns and disordered structure. Thus, in both cases, we detected a high content of β-structure and a disordered secondary structure.

2.4. Fourier-Transform Infrared Spectroscopy

Figure 5b presents FTIR data obtained at 20 °C and corrected for the spectral contribution of water vapor and CO2. The experimental data were analyzed following the principles described in [40]. The obtained estimates of the content of secondary structure elements in samples of titin and its aggregates are given in Table 1. As the circular dichroism data, the FTIR data indicate that the secondary structure of the protein does not change during SMTHMW aggregation.

2.5. Association of SMTHMW Aggregates with Thioflavin T

To identify the amyloid nature of SMTHMW aggregates, we investigated their binding to thioflavin T. A significant increase in ThT fluorescence intensity in the presence of SMTHMW aggregates formed over 1 h (Figure 5c) and 24 h (Figure 5d) was recorded and compared with that in the presence of monodispersed SMTHMW. After disaggregation, the ThT fluorescence in the presence of SMTHMW aggregates was at the same level as that of monodispersed SMTHMW after 1 and 24 h of the experiment.

2.6. X-ray Diffraction of SMTHMW Aggregates

The amyloid cross-β structure of SMTHMW aggregates was revealed by X-ray diffraction (Figure 5e,f). A 1 h aggregation featured a diffuse reflex at ~10 Å and a relatively sharp reflex at ~4.7 Å (Figure 5e). X-ray diffraction of SMTHMW aggregates after a 24 h aggregation revealed a diffuse reflex at ~10 Å and a sharp reflex at ~4.8 Å (Figure 5f). The detected reflections can be ascribed to a cross-β structure. Thus, the presence of a cross-β structure identified by X-ray diffraction analysis confirms that SMTHMW aggregates are amyloids.

2.7. Small-Angle X-ray Scattering (SAXS)

SAXS was used to obtain information about the conformation of molecules in solution. For such high-molecular-weight structures as titin, this method makes it possible to approximately estimate their internal conformation, taking into account the tangent of the slope (tan A) of the log I–log S dependence. It is known that, for a rod-shaped conformation, tan A = 1; that, for a planar conformation, tan A = 2; that, for globular particles tan, A = 4. Using the DAMMIF program [41], it is also possible to visualize the approximate three-dimensional structure of the protein.
From these data (Figure 6), it follows that molecular SMTHMW has a flat shape (plate conformation) (tan A = −2.7) (Figure 6a). The latter is clearly visible in the insert (Figure 6c). The aggregated shape of SMTHMW particles is also close to plate-like (more charged plate conformation) (tan A = 2.65) (Figure 6b).

2.8. Differential Scanning Calorimetry of SMTHMW

The thermal stability of SMTHMW aggregates was elucidated by differential scanning calorimetry (DSC). Figure 7 presents typical temperature dependences of excess heat capacity of SMTHMW in monomeric and aggregated forms. As seen in the figure, the curves have heat absorption peaks that might correspond to cooperative disruption of the structure. Repeated heating of the preparations confirms that the process is irreversible. The heat absorption peak maximum temperature of molecular titin, Tm, was 317.7 ± 0.1 K; the value of transition calorimetric enthalpy, ΔHcal = 870 ± 90 kJ mol−1. The heat absorption peak maximum temperature of titin aggregates, Tm, was 321.7 ± 0.1 K; the value of transition calorimetric enthalpy, ΔHcal = 1090 ± 110 kJ mol−1.

2.9. SMT Amino Acid Sequence Identity

To reveal segments with large amino acid sequence identity that, according to available data, have an increased tendency for aggregation [33], we calculated the identity in the amino acid sequence between adjacent pairs of domains in smooth-muscle titin. Chicken titin (UniProtKB—A6BM71_CHICK) was chosen for the calculations. Calculations carried out using the BLAST program showed that the average identity in the amino acid sequence between neighboring FnIII domains does not exceed 33 ± 7%, and between neighboring Ig domains, it does not exceed 20 ± 11%, which is a relatively low indicator (Table 2, Supplementary File S1). In two cases, however, domains with an identity higher than 50% were observed.

2.10. Calculation of Unstructured Areas in the SMT Molecule

The disorder was revealed by analyzing the amino acid sequence UniProtKB—A6BM71_CHICK using IsUnstruct, a specialized program for predicting the natural disorder of proteins [43,44]. The average disorder of a titin fragment was 90% for PRK12323; 90%, Ig-like; 30%, FnIII-like; 55%, none (Figure 8).

3. Discussion

In the present work, we investigated the amyloidogenic propensity in the smooth-muscle isoform of the giant protein titin. According to our results, three titin isoforms—with molecular weights of ~500, ~1200, and ~1500–1600 kDa—were isolated from chicken gizzard muscle tissue. Previously, we have shown the 500 kDa splice-isoform of titin or its truncated fragment (SMTLMW) to form in vitro aggregates with amyloid properties and structure [34,35]. In this study, we show that the smooth-muscle titin isoform with MW~1500–1600 kDa and an isoform or a proteolytic fragment of this protein with MW~1200 kDa (SMTHMW) also form aggregates in vitro. Detailed research into the SMTHMW aggregation process was conducted to better understand the changes occurring in this protein, which is undoubtedly involved in smooth muscle contraction.
Using DLS, we found that, upon decreasing ionic strength, chicken SMTHMW formed large aggregates with a hydrodynamic radius of ~4500 nm over 1 h (Figure 1a). EM and AFM showed SMTHMW aggregates formed over 1 h to be amorphous (Figure 3 and Figure 4). In general, chicken SMTHMW aggregation was fast, which made it impossible to determine the lag period. The high aggregation rate of SMTHMW (three times as high as that for SMTLMW [34]) was, apparently, due to the oligomeric forms of the protein and its monomers present, as shown by AFM, in the high ionic-strength solution (Figure 2). Our results are consistent with the literature data showing that the presence of oligomeric forms at the initial stage of aggregation accelerates the process [45].
An increase of ThT fluorescence detected at the binding of the dye to SMTHMW aggregates an hour after their formation indicates the amyloid nature of the structures formed (Figure 5c,d). This is also supported by the X-ray diffraction data: the presence of reflexes at 4.7 and 10 Å confirms the amyloid nature of SMTHMW aggregates formed both after 1 and 24 h of incubation (Figure 5e,f). The X-ray diffraction data are indicative of the presence of a quaternary cross-β structure in SMTHMW aggregates. It should be noted that both reflexes are circular and partially blurred. Nevertheless, the reflex representing the distance between the beta segments in the sheet was observed both after 1 h (4.7 Å, Figure 5e) and after 24 h (4.8 Å, Figure 5f) of aggregation. The 10 Å reflex representing the distance between the beta sheets was blurred but was also present in both cases. According to numerous literature data, such reflexes are characteristic of amyloid or amyloid-like structures [46].
An uncharacteristic feature of the amyloid aggregation of titin is the formation of aggregates without changing the secondary structure, which was confirmed by CD and FTIR independent techniques (Figure 5a,b, Table 1). According to the literature data, in vitro experiments with some proteins have shown that prior to the formation of amyloids, the structure of their molecules must undergo a transformation of the type of α-helix to β-folding or random coil to β-sheet [47,48,49]. We revealed no such changes in the amyloid aggregation of chicken SMTHMW. Similar results have been obtained earlier for chicken SMTLMW [34,35] and for skeletal myosin binding protein C [46] that also consists of Ig-like and FnIII-like domains. It appears that the ability to form amyloid aggregates without changes in the secondary structure of molecules is a characteristic feature of the above-mentioned multidomain proteins, which distinguishes them from most other amyloid proteins.
Taking into account the EM data on protein filaments between amorphous SMTHMW aggregates (Figure 3c) and the data on the presence of protein “filaments” after disaggregation of SMTHMW aggregates (Figure 4e–g), we suggested that not the entire protein but only its particular domains were involved in intermolecular interactions in the process of amyloid SMTHMW aggregation. The proposed SMTHMW scheme of stacking to form an amyloid structure during the aggregation is given in Figure 9. In particular, segments that have a disordered structure and those whose structure is amyloid are shown.
Are there any confirmations of the assumption we make? In the literature, there are comparative data obtained by cryoelectron microscopy on the structure of functional amyloid aggregates of Orb2 and pathological aggregates of amyloid β-peptide [50]. Those authors have shown that only a small part of its molecule is involved in the formation of the amyloid nucleus in the functional amyloids of Orb2, whereas most of the molecule remains dynamically disordered. Formation of the amyloid nucleus in pathological amyloid β-peptide, on the contrary, involves most of its molecule. Given these data and the revealed properties of SMTHMW aggregates, they can be classified as functional, which is indirectly confirmed by their ability to disaggregate with ionic strength increasing (Figure 1 and Figure 4). It should only be noted that this type of aggregation is a model, since neither functional nor pathological SMTHMW aggregates have been found in living cells.
It should also be understood that, due to the huge size and complex structure of the titin molecule, its complete transition to the amyloid form is hardly possible. However, its particular segments are, most likely, capable of forming an amyloid structure. This assumption can be supported by literature data on the unfolding of individual titin domains [51]. In particular, those authors have shown that the stepwise unfolding/folding of titin immunoglobulin (Ig) domains occurs in the elastic I band region of intact myofibrils at physiological sarcomere lengths and forces of 6–8 pN [52]. For this reason, we consider the formation of amyloid segments to occur exactly between partially opened domains of neighboring titin molecules.
It has also been shown that most proteins have amyloidogenic segments [53,54]. We calculated the number of amyloidogenic segments in randomly selected domains of a chicken titin fragment, predicted using the FoldAmyloid program (three Ig-like and three FnIII-like). From the data obtained (Supplementary File S2), there are at least two amyloidogenic segments in each of the counted domains; furthermore, for example, the Ig-like (I10) domain has five such segments. These data indicate a high potential propensity of titin, inherent in its domains, to form amyloid aggregates.
When discussing the type of SMTHMW aggregates, it is necessary to dwell in more detail on the DSC data, which are indicative of yet another feature of titin’s amyloid aggregation. It is known that amyloid fibrils or aggregates of several proteins melt and dissociate at temperatures of the order of 75–100 °C, which manifests itself in the form of characteristic endothermic transitions on the thermograms [55,56,57,58,59]. It has been shown that amyloid fibrils are more resistant to temperature than the native protein (their transition temperatures differ by about 30–40 K) [59]. At the same time, it has been shown that the enthalpy of the melting of amyloid fibrils is less than that of the native protein. Based on this, it has been concluded that the density of intermolecular interactions in the amyloid structure is lower than in the native protein [59]. Our experiments showed that the melting point of the aggregated form of SMTHMW is slightly higher (by only 4 K) than that of the molecular form of the protein (Figure 7). Herewith, the melting enthalpies of the aggregated and non-aggregated forms of SMTHMW practically did not differ. These data suggest that the total binding energy during the formation of SMTHMW aggregates did not change. Attention should be also paid to the heat absorption peaks themselves. If we compare the data obtained by us for SMT with the data for globular proteins, then the heat absorption peak should be much larger. There is a possibility that the current peak of heat absorption can correspond to the energy spent on the breakdown of the aggregates or oligomers of the molecular and aggregated forms of the protein or even its particular domains. If this is the case, then we failed to register the melting point, and it is above 373 K. Nevertheless, the obtained data are of interest. It can be summed up that, in this temperature range (up to 373 K), the molecular form of the protein and its aggregates have relatively similar stability.
Discussing the issue of the type of (functional or pathological) amyloid aggregation, it is worth noting that no cases of the transformation of functional to pathological amyloids have been recorded. Most probably, there are molecular mechanisms of protection against such a transformation that developed in the process of evolution. Thus, it is known that, in multidomain proteins with homologous tandem repeats, the neighboring domains have a low identity in the amino acid sequence. This feature formed, apparently, as a result of evolutionary pressure, prevents incorrect protein stacking and subsequent aggregation [33]. It is generally accepted that a low tendency for aggregation is characteristic of those proteins in which the identity between domains is less than 40% [33]. Data on the identity of individual titin domains in the amino acid sequence are known [33]. We calculated the identity of amino acid sequences for chicken titin (Table 2). Calculations showed this fragment to contain only two domains with an identity greater than 50% (Supplementary File S1). The average identity of the amino acid sequence between pairs of neighboring FnIII-like or Ig-like domains does not exceed 40% (Table 2). Thus, it can be concluded that chicken SMT has a low tendency towards aggregation. It has been shown, however, that upon sarcomere elongation, titin domains are capable of unfolding in situ [52], herewith opening the hidden hydrophobic sites that may lead to its aggregation.
In conclusion, regarding the possible role of the revealed changes for the muscle in vivo, it is necessary to recall one of the early works in which the authors show, using AFM, that repeated mechanical cycles of the extension/relaxation of multidomain proteins can lead to the formation of misfolded structures formed by two neighboring domains [60]. The misfolding was completely reversible and changed the mechanical topology of the domains, while maintaining the same stability as in the original folded state. The authors conclude that multidomain proteins can assume a new state of incorrect stacking. These data and the data we obtained can be important from the viewpoint of a better understanding of the functioning of multidomain muscle proteins, in particular titin, in the sarcomere and muscle as a whole. It is not to be ruled out that structural changes occurring in this protein during the muscle extension/contraction cycle are involved not only in the fine-tuning of elastic properties but also in changing the contractile response of the muscle. Future in vivo studies of titin structural modifications and misfolding will reveal more subtle nuances of the involvement of this protein in the functioning of muscle cells.

4. Conclusions

In summary, in vitro nonspecific amyloid aggregation of chicken SMTHMW was found. Over relatively short times (within 1 h), the protein formed amorphous amyloid aggregates with a quaternary cross-β structure without undergoing changes in the secondary structure. The thermal stability of SMTHMW aggregates did not practically differ from that observed in protein preparations containing both monomers and oligomers. Amyloid aggregates of SMTHMW disaggregated almost completely at an increase in the ionic strength of the solution. Amyloid aggregates of this type are functional rather than pathological, so a similar aggregation of titin in vivo to perform certain functions cannot be ruled out. However, the involvement of this protein in the formation of amyloid deposits has not been shown yet, which positions this protein as a model object to study the process of the amyloid aggregation of a non-pathological type. Our data expand the views about the fundamentals of amyloidogenesis. Besides, disclosing the mechanisms of the formation of functional and pathological amyloids and understanding their differences at the structural level can give an idea of how the cell regulates amyloid aggregation for its desired functioning, avoiding the manifestation of the toxicity of pathological amyloids.

5. Materials and Methods

5.1. Purification of Chicken Gizzard SMT

Smooth-muscle titin was prepared from chicken gizzard by the method described in [61] with our modifications described in [34]. SMTHMW was purified by gel filtration on a Sepharose-CL2B column equilibrated in a buffer containing 0.6 M KCl, 30 mM KH2PO4, 1 mM DTT, 0.1 M NaN3, pH 7.0. Protein concentration was determined by a SPECORD UV VIS spectrophotometer using the extinction coefficient (E2801 mg/mL) of 1.37 for titin [62]. For this research, the protein has been isolated more than 20 times.

5.2. SDS-PAGE and Mass Spectrometry Analysis of Titin

The presence of SMTHMW in the sample was confirmed by sodium dodecyl sulfate–polyacrylamide gel electrophoresis (SDS-PAGE) (Supplementary File S3) and mass spectrometry analysis, the data of which are described in [36]. The molecular weight of SMTHMW was assessed by TotalLab software v1.11 (Supplementary File S3). Two protein bands are visible, which are most likely SMTHMW isoforms, or the lower band is a proteolytic fragment of this protein (Supplementary File S3, gels 1–4). By the densitometry data, the molecular weight of the upper band of the protein is ~1635 ± 245 kDa; its content is ~68.5%. The molecular weight of the lower band is ~1245 ± 189 kDa; its content is ~31.5%. The SDS-PAGE of titin was performed using a separating gel containing 6.5–7% polyacrylamide prepared as described [62]. The gels were stained with Coomassie Brilliant Blue G-250 and R-250 mixed at a 1:1 ratio. For shotgun mass spectrometry analysis, the sample was solubilized into a buffer (4% sodium dodecyl sulfate in 0.1 M Tris-HCl pH 7.6, 0.1 M dithiothreitol) and incubated for 5 min at 95 °C as described [36,63]. The samples were sonicated (4 × 30 s at 20 W; ME220, Covaris, Woburn, MA, USA), centrifuged (5 min, 16,000× g), and the supernatant was collected. The YM-30 filter (Millipore, Ireland) was used for alkylation and trypsinolysis (14 h, 2 μg of trypsin (Trypsin Gold, Promega, Madison, WI, USA)) according to the FASP method [64]. Peptides were desalted using C18 microcolumns and subjected to HPLC–MS/MS analysis using the HPLC Ultimate 3000 RSLCnano system (Thermo Scientific, Waltham, MA, USA) as described [36,63].

5.3. Conditions for the Formation of SMT Aggregates

Purified SMTHMW in a column buffer (0.6 M KCl, 30 mM KH2PO4, 1 mM DTT, 0.1 M NaN3, pH 7.0) was used to form aggregates. SMT aggregates (concentration, 0.2–0.4 mg/mL) were formed by dialysis in Sigma-Aldrich cellulose membrane tubing (size, 25 × 16 mm) for 1 and 24 h at 4 °C against a solution containing 0.15 M glycine–KOH, pH 7.0–7.5. In disaggregation experiments, SMT aggregates were dialyzed during 1 and 24 h against a column buffer.

5.4. Dynamic Light Scattering Experiments

DLS experiments were conducted according to a protocol described in [34,35]. For the DLS analysis of SMT aggregation, a protein sample in a buffer containing 0.6 M KCl, 30 mM KH2PO4, 1 mM DTT, 0.1 M NaNO3, pH 7.0, at an initial concentration of 1 mg/mL, was transferred into a solution of 0.15 M glycine–KOH, pH 7.0–7.5, by gradual dilution to a final concentration of 0.1 mg/mL to decrease ionic strength. Further steps were as in [35]. The collected autocorrelation functions were converted into particle-size distributions, using the general-purpose algorithm provided with the ZS Zetasizer Nano (Malvern Instruments Ltd., Malvern, UK) used in this experiment. Particle-size distributions obtained from alternative inversion algorithms yielded comparable results. The dynamic viscosity of the protein solutions determined using an SV-10 Sine-wave Vibro Viscometer (A&D Company Ltd., Tokyo, Japan) at 25 °C was 0.92 cP. This value was taken into consideration when measuring the particle dimensions in SMT samples collected 60 min after the dialysis. The analyzed volume of scattering with a beam cross-section of ~100 µm, accounting for the protein concentration used, contained about 10 billion SMT protein molecules, the signal from which was measured. The correlation function signal accumulated over 15 cycles of 15 s each (the way it is described in [34,35]). The results were obtained from three independent experiments.

5.5. Transmission Electron Microscopy

A drop of aggregated protein suspension at a concentration of 0.1 mg/mL was applied to a carbon-coated collodion film (2% collodion solution in amyl acetate (Sigma-Aldrich, St. Louis, MO, USA)) on a copper grid (Sigma-Aldrich, St. Louis, MO, USA) and negatively stained with 2% aqueous uranyl acetate (SPI-Chem., West Chester, PA, USA). Samples were examined under a JEM-100B electron microscope (JEOL Ltd., Tokyo, Japan). Samples obtained from five independent protein isolations were analyzed; many different fields of view were analyzed.

5.6. Atomic-Force Microscopy

For AFM measurements, titin aggregates were attached to freshly cleaved mica. An aliquot of titin (10–20 µL) was pipetted onto the mica surface and incubated at room temperature for 10 min. Unbound protein was washed away by extensive rinsing with distilled water, then by blowing gently with a stream of high-purity N2 gas. The noncontact mode (alternating current or AC mode) AFM images of titin aggregates bound to the mica surface were acquired with a Cypher ES AFM instrument (Asylum Research, Santa Barbara, CA, USA). Scanning was performed at high set-point values (0.8–1.2 V) to avoid the binding of the sample to the cantilever tip. Silicon nitride cantilevers (Olympus) were used for scanning in air (AC160TS, resonance frequency~300 kHz). At a typical scanning frequency of 0.7–1.4 Hz, we collected 512 × 512 pixel or 1024 × 1024 pixel height-, amplitude-, and phase-contrast images.
To prepare samples of SMTHMW aggregates for AFM, 2 µL of the protein was transferred to freshly cleaved mica and incubated for 5 min. The sample was then washed three times in a drop of distilled water deionized by a type I Milli-Q system for 30 s and dried in the air. AFM imaging was performed using an AFM Ntegra-Vita microscope (NT-MDT, Russia) in noncontact (tapping) mode in air. The typical scan rate was 0.5–1 Hz. Measurements were carried out using NSG03 cantilevers with a resonance frequency of 47–150 kHz and ensured a 10 nm tip curvature radius. The processing and presentations of AFM images were performed using Nova software 1.0.26 (NT-MDT, Moscow Region, Russia) and Gwyddion 2.4450 software (http://gwyddion.net/download-old.php accessed on 17 April 2018. Experiments were replicated by independently executing the process of protein preparation, their incubation at 37 °C, and sample analysis three times. AFM images of a buffer solution (0.15 M glycine–KOH, pH 7.0–7.5) containing no titin are presented in Supplementary File S4. Samples obtained from three independent protein isolations were analyzed; many different fields of view were analyzed.

5.7. Circular Dichroism

SMTHMW was dialyzed for 24 h against a buffer containing 0.15 M glycine–KOH, pH 7.0–7.5. The CD spectra prior to and after SMTHMW aggregation were recorded in a Jasco J-815 spectrometer (JASCO Inc., Tokyo, Japan) using 0.1 cm optical path-quartz cells and wavelengths of 250–190 nm.
Three repeats of the spectrum were taken for each investigated sample. Data processing and graphical representation were performed in the SigmaPlot program. Based on the absorption spectrum, the exact protein concentration was calculated using the formula: C = ABS280/l/Ke (where ABS280 is the absorption value at a wavelength of 280 nm, l is the optical path length in cm, Ke is the extinction coefficient).
Three spectra in the far UV region obtained for the investigated sample were averaged and smoothed in the spectropolarimeter software (Spectra Manager Version 2, Spectra Analysis Version 2.02.06 (Build 1) Spectra Analysis Jasco). A similar procedure was done for the three spectra obtained for the buffer solution. The averaged spectrum of the buffer solution was subtracted from the obtained averaged spectrum of the investigated sample. The value of molar ellipticity [Θ] was calculated by the formula:
[Θ]λ = Θ λ · RMW/l·c,
where Θ λ is the measured value of ellipticity at the wavelength λ, millidegrees; RMW, the average molecular weight of the residue, calculated from the amino acid sequence; l, the optical path length, mm; c, protein concentration, mg/mL.
The secondary structure was calculated using the CONTIN/LL module of the CDPro program [65]. The mean root square deviation (RMSD) according to the CDPRO program did not exceed 6%.

5.8. Fourier-Transform Infrared Spectroscopy

Measurements were carried out on a Thermo Scientific Nicolet 6700 FT-IR spectrometer, equipped with the Smart Proteus accessory with a Peltier cuvette holder, in transmission mode in a cuvette of crystalline calcium fluoride with an optical pathlength of 4 μm, using a liquid nitrogen-cooled MCT detector. Scanning in the wavenumber range from 650 to 4000 cm−1; resolution, 1 cm−1; averaging over 256 spectra. The device was calibrated according to the manufacturer’s instructions.
The IR spectra of titin preparations’ solutions in a corresponding buffer and the spectra of the buffer itself were measured at 20 °C. The concentration of the protein was 10 mg/mL. The optical path length of the CaF2 cuvette was calculated for each measurement based on the optical density of the test sample at 3404 cm−1, using the water absorption value at an optical pathlength of 1 µm equal to 0.533 AU, adjusted for the protein concentration in the sample [66]. The optical pathlength of the cuvette was 4.52 ± 0.04 μm. The IR spectrum of the protein preparation was measured twice; the buffer spectrum was also registered twice. The IR spectrum of the buffer (0.6 M KCl, 30 mM KH2PO4, 1 mM DTT, 0.1 M NaNO3, pH 7.0, for molecular SMT; and 0.15 M glycine–KOH, pH 7.0–7.5, for the aggregated form of the protein) was subtracted from each protein spectrum, taking into account the difference in the values of the optical path length in the measurements. Each difference spectrum was adjusted for the spectral contribution of water vapor and CO2, followed by the analysis in the wavenumber range of 1725 to 1481 cm–1 for the content of secondary structure elements in the protein, following the principles described in [40]. A sample obtained from three different isolations of the protein was used. The obtained estimates of secondary structure elements in the protein were averaged by the results of two measurements. The standard deviations of the values of the secondary structure elements in the protein are given.

5.9. Fluorescence Analysis with Thioflavin T

The amyloid nature of the SMTHMW aggregates was estimated by the intensity of thioflavin T (ThT) fluorescence (1 ThT:5 SMT (w/w)). Fluorescence was measured at λex = 440 nm and λem = 488 nm using a Cary Eclipse spectrophotometer (Varian, Palo Alto, CA, USA). Four independent series of measurements were carried out. The amyloid nature was assessed from the difference of fluorescence intensity between the non-aggregated and aggregated forms of the protein. This method was used as a control of the amyloid nature of titin aggregates after each isolation of the protein.

5.10. X-ray Diffraction

SMTHMW aggregates for X-ray diffraction analysis were prepared after a 1 h and 24 h incubation at 4 °C in an experimental solution. A sample obtained from three different isolations of the protein was used. Then the aggregates were concentrated up to more than 10 mg/mL by centrifugation at 12,000 rpm for 60 min. Droplets of this preparation were placed between the ends of wax-coated glass capillaries (approximately 1 mm in diameter) separated by a gap of approximately 1.5 mm. Fiber diffraction images were collected using a Microstar X-ray generator with HELIOX optics equipped with a Platinum135 CCD detector (X8 Proteum system, Bruker AXS) at the Institute of Protein Research, Russian Academy of Sciences, Pushchino. Cu Kα radiation, λ = 1.54 Å (1 Å = 0.1 nm), was used. The samples were positioned at a right angle to the X-ray beam using a four-axis kappa goniometer. Different exposures and different oscillation angles were used; the sample itself was irradiated in different orientations.

5.11. Small Angle X-ray Scattering

SAXS experiments were carried out on a small-angle camera of the Photon Factory (Tsukuba, Japan). The protein solution in a thermostatted cuvette with mica windows was irradiated by X-rays of a wavelength 1.503 Å at 23 °C. The distance between the sample and the detector was 2.35 m. The range of the measured scattering vectors is Q = 0.008–0.2 Å−1 (Q = 4π sin θ/λ, where λ is the X-ray radiation wavelength and 2θ is the scattering angle). X-ray scattering was detected by a PILATUS 100K two-dimensional X-ray detector. The shape of the particles was estimated from the tangent of the angle of inclination log I on log Q, where I is the scattering intensity, and Q is the scattering vector modulus [67]. Log I–log Q dependences in SAXS data were approximated by linear regression. Correlation coefficients (R2) ranged from 0.92 to 0.99.

5.12. Differential Scanning Calorimetry

DSC measurements were made on a SCAL-1 precision scanning microcalorimeter (Scal Co. Ltd., Pushchino, Russia) with 0.33 mL glass cells at a scanning rate of 1 K/min and under a pressure of 2.5 atm [68]. The experiments were performed in 0.15 M glycine–KOH at pH 7.0–7.5. The protein concentrations were 1.2 mg/mL. The experimental calorimetric traces were adjusted for the calorimetric baseline, and the molar partial heat capacity functions were calculated in a standard manner. The excess heat capacity was evaluated by the subtraction of the linearly extrapolated initial and final heat capacity functions with correction for the difference of these functions by using a sigmoidal baseline [69]. DSC experiments were carried out 2 times for both the monomeric and aggregated SMTHMW forms. The obtained curves coincided in temperature Tm to an accuracy of 0.1 K. The relative error in determining calorimetric enthalpy, ΔHcal did not exceed 10%.

5.13. Calculation of the Identity of the Amino Acid Sequence and Disordered Regions in the SMTHMW Molecule

The SMTHMW amino-acid sequence identity was calculated by the BLAST program. The data were retrieved from the UniProtKB databases: UniProtKB—A6BM71_CHICK.

Supplementary Materials

The following supporting information can be downloaded at: https://www.mdpi.com/article/10.3390/ijms24021056/s1.

Author Contributions

A.G.B. conceived and designed the experiments; A.G.B., E.I.Y., L.G.B., N.V.M., A.A.T., M.A.T., H.K., A.D.N., A.G.G., T.N.M., N.V.P., M.Y.L., A.S.K., Z.M., O.V.G. and I.M.V. performed the experiments; A.G.B., E.I.Y., L.G.B., N.V.M., A.A.T., M.A.T., T.N.M., N.V.P., A.S.K., M.K., O.V.G. and I.M.V. analyzed the data; A.G.B., M.K. and I.M.V. wrote the manuscript; A.G.B., E.I.Y., N.V.M., A.A.T., M.A.T., T.N.M. and A.S.K. prepared the figures; A.G.B., M.K., O.V.G. and I.M.V. reviewed the manuscript. All authors have read and agreed to the published version of the manuscript.

Funding

This research was funded by the Russian Science Foundation, grant number 22-24-00805, by the Hungarian National Research, Development and Innovation Office (K135360 to M.K.) and by grants from the Hungarian National Research, Development and Innovation Office: FK128956 and 2019-2.1.7-ERA-NET-2020-00013 to Z.M.

Institutional Review Board Statement

The manuscript does not contain clinical studies or patient data.

Informed Consent Statement

Not applicable.

Data Availability Statement

All data generated or analyzed in the course of this research (including files of additional information) were incorporated into the article and supplementary files.

Acknowledgments

The research used the equipment of the ITEB RAS Shared Facilities Centre “Structural and Functional Studies of Biosystems” (https://www.ckp-rf.ru/catalog/ckp/3037/ accessed on 29 December 2022), Electron Microscopy Core Facilities of the Pushchino Biological Research Centre (https://www.ckp-rf.ru/catalog/ckp/670266/ accessed on 29 December 2022).

Conflicts of Interest

The authors declare that there is no conflict of interest regarding this work.

Abbreviations

SMTHMW, high-molecular-weight isoform of smooth-muscle titin (~1500 kDa); SMTLMW, low-molecular-weight isoform of smooth-muscle titin (~500 kDa); Ig, titin immunoglobulin-like domain; FnIII, titin fibronectin-like type III domains; CD, circular dichroism; FTIR, Fourier-transform infrared spectroscopy; DLS, dynamic light scattering; DTT, dithiothreitol; SDS–PAGE, sodium dodecyl sulfate–polyacrylamide gel electrophoresis; ThT, thioflavin T; TEM, transmission electron microscopy, AFM, atomic-force microscopy; SAXS, small-angle X-ray scattering; DSC, differential scanning calorimetry.

References

  1. Tsytlonok, M.; Craig, P.O.; Sivertsson, E.; Serquera, D.; Perrett, S.; Best, R.B.; Wolynes, P.G.; Itzhaki, L.S. Complex energy landscape of a giant repeat protein. Structure 2013, 21, 1954–1965. [Google Scholar] [CrossRef] [PubMed] [Green Version]
  2. Tian, P.; Best, R.B. Best structural determinants of misfolding in multidomain proteins. PLoS Comput. Biol. 2016, 12, e1004933. [Google Scholar] [CrossRef] [Green Version]
  3. Gershenson, A.; Gierasch, L.M.; Pastore, A.; Radford, S.E. Energy landscapes of functional proteins are inherently risky. Nat. Chem. Biol. 2014, 10, 884–891. [Google Scholar] [CrossRef] [PubMed] [Green Version]
  4. Dobson, C.M. Protein folding and misfolding. Nature 2003, 426, 884–890. [Google Scholar] [CrossRef]
  5. Stefani, M.; Rigacci, S. Protein folding and aggregation into amyloid: The interference by natural phenolic compounds. Int. J. Mol. Sci. 2013, 14, 12411–12457. [Google Scholar] [CrossRef] [Green Version]
  6. Ittner, L.M.; Ke, Y.D.; Delerue, F.; Bi, M.; Gladbach, A.; van Eersel, J.; Wölfing, H.; Chieng, B.C.; Christie, M.J.; Napier, I.A.; et al. Dendritic function of tau mediates amyloid-beta toxicity in Alzheimer’s disease mouse models. Cell 2010, 142, 387–397. [Google Scholar] [CrossRef] [Green Version]
  7. Haass, C.; Mandelkow, E. Fyn-tau-amyloid: A toxic triad. Cell 2010, 142, 356–358. [Google Scholar] [CrossRef] [Green Version]
  8. Marshall, K.E.; Marchante, R.; Xue, W.F.; Serpell, L.C. The relationship between amyloid structure and cytotoxicity. Prion 2014, 8, 192–196. [Google Scholar] [CrossRef] [Green Version]
  9. Bucciantini, M.; Giannoni, E.; Chiti, F.; Baroni, F.; Formigli, L.; Zurdo, J.; Taddei, N.; Ramponi, G.; Dobson, C.M.; Stefani, M. Inherent toxicity of aggregates implies a common mechanism for protein misfolding diseases. Nature 2002, 416, 507–511. [Google Scholar] [CrossRef]
  10. Sengupta, U.; Nilson, A.N.; Kayed, R. The role of amyloid-β oligomers in toxicity, propagation, and immunotherapy. EBioMedicine 2016, 6, 42–49. [Google Scholar] [CrossRef]
  11. Knowles, T.P.; Vendruscolo, M.; Dobson, C.M. The amyloid state and its association with protein misfolding diseases. Nat. Rev. Mol. Cell Biol. 2014, 15, 384–396. [Google Scholar] [CrossRef]
  12. Dobson, C.M. Experimental investigation of protein folding and misfolding. Methods 2004, 34, 4–14. [Google Scholar] [CrossRef]
  13. Buxbaum, J.N.; Linke, R.P. A molecular history of the amyloidosis. J. Mol. Biol. 2000, 421, 142–159. [Google Scholar] [CrossRef] [PubMed]
  14. Dobson, C.M. Principles of protein folding, misfolding and aggregation. Semin. Cell Dev. Biol. 2004, 15, 3–16. [Google Scholar] [CrossRef]
  15. Sunde, M.; Serpell, L.C.; Bartlam, M.; Fraser, P.E.; Pepys, M.B.; Blake, C.C. Common core structure of amyloid fibrils by synchrotron X-ray diffraction. J. Mol. Biol. 1997, 273, 729–739. [Google Scholar] [CrossRef] [Green Version]
  16. Nelson, R.; Eisenberg, D. Recent atomic models of amyloid fibril structure. Curr. Opin. Struct. Biol. 2006, 16, 260–265. [Google Scholar] [CrossRef]
  17. Olsen, A.; Jonsson, A.; Normark, S. Fibronectin binding mediated by a novel class of surface organelles on Escherichia coli. Nature 1989, 338, 652–655. [Google Scholar] [CrossRef]
  18. Römling, U.; Bian, Z.; Hammar, M.; Sierralta, W.D.; Normark, S. Curli fibers are highly conserved between Salmonella typhimurium and Escherichia coli with respect to open structure and regulation. J. Bacteriol. 1998, 180, 722–731. [Google Scholar] [CrossRef] [Green Version]
  19. Otzen, D.; Nielsen, P.H. We find them here, we find them there: Functional bacterial amyloid. Cell Mol. Life Sci. 2008, 65, 910–927. [Google Scholar] [CrossRef]
  20. Claessen, D.; Rink, R.; de Jong, W.; Siebring, J.; de Vreugd, P.; Boersma, F.G.; Dijkhuizen, L.; Wosten, H.A. A novel class of secreted hydrophobic proteins is involved in aerial hyphae formation in Streptomyces coelicolor by forming amyloid-like fibrils. Genes Dev. 2003, 17, 1714–1726. [Google Scholar] [CrossRef]
  21. Si, K.; Lindquist, S.L.; Kandel, E.R. A neuronal isoform of the aplysia CPEB has prion-like properties. Cell 2003, 115, 879–891. [Google Scholar] [CrossRef] [Green Version]
  22. Iconomidou, V.A.; Vriend, G.; Hamodrakas, S.J. Amyloids protect the silkmoth oocyte and embryo. FEBS Lett. 2000, 479, 141–145. [Google Scholar] [CrossRef] [Green Version]
  23. Iconomidou, V.A.; Chryssikos, G.D.; Giorius, V.; Galarius, A.S.; Cordopatis, P.; Hoenger, A.; Hamodrakas, S.J. Amyloid fibril formation propensity is inherent into the hexapeptide tandemly repeating sequence of the central domain of silkmoth chorion proteins of the A-family. J. Struct. Biol. 2006, 156, 480–488. [Google Scholar] [CrossRef]
  24. Podrabsky, J.E.; Carpenter, J.F.; Hand, S.C. Survival of water stress in annual fish embryos: Dehydration avoidance and egg envelope amyloid fibers. Am. J. Physiol. Regul. Integr. Comp. Physiol. 2001, 280, R123–R131. [Google Scholar] [CrossRef] [Green Version]
  25. Fowler, D.M.; Koulov, A.V.; Alory-Jost, C.; Marks, M.S.; Balch, W.E.; Kelly, J.W. Functional amyloid formation within mammalian tissue. PLoS Biol. 2005, 4, e6. [Google Scholar] [CrossRef]
  26. Berson, J.F.; Theos, A.C.; Harper, D.C.; Tenza, D.; Raposo, G.; Marks, M.S. Proprotein convertase cleavage liberates a fibrillogenic fragment of a resident glycoprotein to initiate melanosome biogenesis. J. Cell. Biol. 2003, 161, 521–533. [Google Scholar] [CrossRef] [Green Version]
  27. Antonets, K.S.; Belousov, M.V.; Sulatskaya, A.I.; Belousova, M.E.; Kosolapova, A.O.; Sulatsky, M.I.; Andreeva, E.A.; Zykin, P.A.; Malovichko, Y.V.; Shtark, O.Y.; et al. Accumulation of storage proteins in plant seeds is mediated by amyloid formation. PLoS Biol. 2020, 18, e3000564. [Google Scholar] [CrossRef]
  28. Wang, K.; McClure, J.; Tu, A. Titin: Major myofibrillar components of striated muscle. Proc. Natl. Acad. Sci. USA 1979, 76, 3698–3702. [Google Scholar] [CrossRef] [Green Version]
  29. Maruyama, K.; Kimura, S.; Ohashi, K.; Kuwano, Y. Connectin, an elastic protein of muscle. Identification of “titin” with connectin. J. Biochem. 1981, 89, 701–709. [Google Scholar] [CrossRef]
  30. Koretz, J.F.; Irving, T.C.; Wang, K. Filamentous aggregates of native titin and binding of C-protein and AMP-deaminase. Arch. Biochem. Biophys. 1993, 304, 305–309. [Google Scholar] [CrossRef]
  31. Kellermayer, M.S.; Bustamante, C.; Granzier, H.L. Mechanics and structure of titin oligomers explored with atomic force microscopy. Biochim. Biophys. Acta 2003, 1604, 105–114. [Google Scholar] [CrossRef] [PubMed] [Green Version]
  32. Wright, C.F.; Teichmann, S.A.; Clarke, J.; Dobson, C.M. The importance of sequence diversity in the aggregation and evolution of proteins. Nature 2005, 438, 878–881. [Google Scholar] [CrossRef] [PubMed]
  33. Borgia, A.; Kemplen, K.R.; Borgia, M.B.; Soranno, A.; Shammas, S.; Wunderlich, B.; Nettels, D.; Best, R.B.; Clarke, J.; Schuler, B. Transient misfolding dominates multidomain protein folding. Nat. Commun. 2015, 6, 8861. [Google Scholar] [CrossRef] [Green Version]
  34. Bobylev, A.G.; Galzitskaya, O.V.; Fadeev, R.S.; Bobyleva, L.G.; Yurshenas, D.A.; Molochkov, N.V.; Dovidchenko, N.V.; Selivanova, O.M.; Penkov, N.V.; Podlubnaya, Z.A.; et al. Smooth muscle titin forms in vitro amyloid aggregates. Biosci. Rep. 2016, 36, e00334. [Google Scholar] [CrossRef] [Green Version]
  35. Yakupova, E.I.; Vikhlyantsev, I.M.; Bobyleva, L.G.; Penkov, N.V.; Timchenko, A.A.; Timchenko, M.A.; Enin, G.A.; Khutzian, S.S.; Selivanova, O.M.; Bobylev, A.G. Different amyloid aggregation of smooth muscles titin in vitro. J. Biomol. Struct. Dyn. 2018, 36, 2237–2248. [Google Scholar] [CrossRef] [PubMed]
  36. Bobylev, A.G.; Fadeev, R.S.; Bobyleva, L.G.; Kobyakova, M.I.; Shlyapnikov, Y.M.; Popov, D.V.; Vikhlyantsev, I.M. Amyloid aggregates of smooth-muscle titin impair cell adhesion. Int. J. Mol. Sci. 2021, 22, 4579. [Google Scholar] [CrossRef] [PubMed]
  37. Hill, S.E.; Robinson, J.; Matthews, G.; Muschol, M. Amyloid protofibrils of lysozyme nucleate and grow via oligomer fusion. Biophys. J. 2009, 96, 3781–3790. [Google Scholar] [CrossRef] [Green Version]
  38. Tskhovrebova, L.; Trinick, J. Titin: Properties and family relationships. Nat. Rev. Mol. Cell Biol. 2003, 4, 679–689. [Google Scholar] [CrossRef]
  39. Vikhlyantsev, I.M.; Okuneva, A.D.; Shumilina, U.V.; Salmov, N.N.; Bobylev, A.G.; Molochkov, N.V.; Podlubnaya, Z.A. Method for isolation of intact titin (connectin) molecules from mammalian cardiac muscle. Biochemistry 2013, 78, 455–462. [Google Scholar] [CrossRef]
  40. Yang, H.; Yang, S.; Kong, J.; Dong, A.; Yu, S. Obtaining information about protein secondary structures in aqueous solution using Fourier transform IR spectroscopy. Nat. Protoc. 2015, 10, 382–396. [Google Scholar] [CrossRef] [PubMed]
  41. Svergun, D.I. Restoring low resolution structure of biological macromolecules from solution scattering using simulated annealing. Biophys. J. 1999, 76, 2879–2886. [Google Scholar] [CrossRef] [Green Version]
  42. Noguchi, H.; Takemori, S.; Kajiwara, J.; Kimura, M.; Maruyama, K.; Kimura, S. Chicken breast muscle connectin: Passive tension and I-band region primary structure. J. Mol. Biol. 2007, 370, 213–219. [Google Scholar] [CrossRef] [PubMed]
  43. Lobanov, M.Y.; Galzitskaya, O.V. The Ising model for prediction of disordered residues from protein sequence alone. Phys. Biol. 2011, 8, 35004. [Google Scholar] [CrossRef] [PubMed]
  44. Lobanov, M.Y.; Sokolovskiy, I.V.; Galzitskaya, O.V. IsUnstruct: Prediction of the residue status to be ordered or disordered in the protein chain by a method based on the Ising model. J. Biomol. Struct. Dyn. 2013, 31, 1034–1043. [Google Scholar] [CrossRef] [PubMed]
  45. Kumar, S.; Walter, J. Phosphorylation of amyloid beta (Aβ) peptides—A trigger for formation of toxic aggregates in Alzheimer’s disease. Aging 2011, 3, 803–812. [Google Scholar] [CrossRef]
  46. Bobyleva, L.G.; Shumeyko, S.A.; Yakupova, E.I.; Surin, A.K.; Galzitskaya, O.V.; Kihara, H.; Timchenko, A.A.; Timchenko, M.A.; Penkov, N.V.; Nikulin, A.D.; et al. Myosin binding protein-C forms amyloid-like aggregates in vitro. Int. J. Mol. Sci. 2021, 22, 731. [Google Scholar] [CrossRef]
  47. Pan, K.M.; Baldwin, M.; Nguyen, J.; Gasset, M.; Serban, A.; Groth, D.; Mehlhorn, I.; Huang, Z.; Fletterick, R.J.; Cohen, F.E. Conversion of alpha-helices into beta-sheets features in the formation of the scrapie prion proteins. Proc. Natl. Acad. Sci. USA 1993, 90, 10962–10966. [Google Scholar] [CrossRef] [Green Version]
  48. Sun, Y.; Kakinen, A.; Xing, Y.; Faridi, P.; Nandakumar, A.; Purcell, A.W.; Davis, T.P.; Ke, P.C.; Ding, F. Amyloid self-assembly of hIAPP8-20 via the accumulation of helical oligomers, α-helix to β-sheet transition, and formation of β-barrel intermediates. Small 2019, 15, e1805166. [Google Scholar] [CrossRef]
  49. Ji, W.; Yuan, C.; Chakraborty, P.; Gilead, S.; Yan, X.; Gazit, E. Stoichiometry-controlled secondary structure transition of amyloid-derived supramolecular dipeptide co-assemblies. Commun. Chem. 2019, 2, 65. [Google Scholar] [CrossRef] [Green Version]
  50. Ulamec, S.M.; Radford, S.E. Spot the Difference: Function versus toxicity in amyloid fibrils. Trends Biochem. Sci. 2020, 45, 635–636. [Google Scholar] [CrossRef]
  51. Eckels, E.C.; Haldar, S.; Tapia-Rojo, R.; Rivas-Pardo, J.A.; Fernández, J.M. The mechanical power of titin folding. Cell Rep. 2019, 27, 1836–1847.e4. [Google Scholar] [CrossRef] [Green Version]
  52. Rivas-Pardo, J.A.; Eckels, E.C.; Popa, I.; Kosuri, P.; Linke, W.A.; Fernández, J.M. Work done by titin protein folding assists muscle contraction. Cell Rep. 2016, 14, 1339–1347. [Google Scholar] [CrossRef] [Green Version]
  53. Rousseau, F.; Serrano, L.; Schymkowitz, J.W. How evolutionary pressure against protein aggregation shaped chaperone specificity. J. Mol. Biol. 2006, 355, 1037–1047. [Google Scholar] [CrossRef]
  54. Goldschmidt, L.; Teng, P.K.; Riek, R.; Eisenberg, D. Identifying the amylome, proteins capable of forming amyloid-like fibrils. Proc. Natl. Acad. Sci. USA 2010, 107, 3487–3492. [Google Scholar] [CrossRef] [Green Version]
  55. Azuaga, A.I.; Dobson, C.M.; Mateo, P.L.; Conejero-Lara, F. Unfolding and aggregation during the thermal denaturation of streptokinase. Eur. J. Biochem. 2002, 269, 4121–4133. [Google Scholar] [CrossRef] [Green Version]
  56. Rezaei, H.; Choiset, Y.; Eghiaian, F.; Treguer, E.; Mentre, P.; Debey, P.; Grosclaude, J.; Haertle, T. Amyloidogenic unfolding intermediates differentiate sheep prion protein variants. J. Mol. Biol. 2002, 322, 799–814. [Google Scholar] [CrossRef]
  57. Baxa, U.; Ross, P.D.; Wickner, R.B.; Steven, A.C. The N-terminal prion domain of Ure2p converts from an unfolded to a thermally resistant conformation upon filament formation. J. Mol. Biol. 2004, 339, 259–264. [Google Scholar] [CrossRef]
  58. Morel, B.; Casares, S.; Conejero-Lara, F. A single mutation induces amyloid aggregation in the α-spectrin SH3 domain: Analysis of the early stages of fibril formation. J. Mol. Biol. 2006, 356, 453–468. [Google Scholar] [CrossRef]
  59. Morel, B.; Varela, L.; Conejero-Lara, F. The thermodynamic stability of amyloid fibrils studied by differential scanning calorimetry. J. Phys. Chem. B. 2010, 114, 4010–4019. [Google Scholar] [CrossRef]
  60. Oberhauser, A.F.; Marszalek, P.E.; Carrion-Vazquez, M.; Fernandez, J.M. Single protein misfolding events captured by atomic force microscopy. Nat. Struct. Biol. 1999, 6, 1025–1028. [Google Scholar] [CrossRef]
  61. Trinick, J.; Knight, P.; Whiting, A. Purification and properties of native titin. J. Mol. Biol. 1984, 180, 331–356. [Google Scholar] [CrossRef]
  62. Fritz, J.D.; Swartz, D.R.; Greaser, M.L. Factors affecting polyacrylamide gel electrophoresis and electroblotting of high-molecular-weight myofibrillar proteins. Anal. Biochem. 1989, 180, 205–210. [Google Scholar] [CrossRef]
  63. Makhnovskii, P.A.; Zgoda, V.G.; Bokov, R.O.; Shagimardanova, E.I.; Gazizova, G.R.; Gusev, O.A.; Lysenko, E.A.; Kolpakov, F.A.; Vinogradova, O.L.; Popov, D.V. Regulation of proteins in human skeletal muscle: The role of transcription. Sci. Rep. 2020, 10, 3514. [Google Scholar] [CrossRef] [Green Version]
  64. Wiśniewski, J.R.; Zougman, A.; Nagaraj, N.; Mann, M. Universal sample preparation method for proteome analysis. Nat. Methods 2009, 6, 359–362. [Google Scholar] [CrossRef]
  65. Sreerama, N.; Woody, R.W. Estimation of protein secondary structure from circular dichroism spectra: Comparison of CONTIN, SELCON, and CDSSTR methods with an expanded reference set. Anal. Biochem. 2000, 287, 252–260. [Google Scholar] [CrossRef]
  66. Venyaminov, S.; Prendergast, F.G. Water (H2O and D2O) molar absorptivity in the 1000–4000 cm−1 range and quantitative infrared spectroscopy of aqueous solutions. Anal. Biochem. 1997, 248, 234–245. [Google Scholar] [CrossRef]
  67. Feigin, L.A.; Svergun, D.A. Structure Analysis by Small-angle X-ray and Neutron Scattering; Springer: Berlin/Heidelberg, Germany; Plenum Press: New York, NY, USA, 1987. [Google Scholar]
  68. Senin, A.A.; Potekhin, S.A.; Tiktopulo, E.I.; Filomonov, V.V. Differential scanning microcalorimetr SCAL-1. J. Therm. Anal. Cal. 2000, 62, 153–160. [Google Scholar] [CrossRef]
  69. Privalov, P.L.; Potekhin, S.A. Scanning microcalorimetry in studying temperature-induced changes in proteins. Methods Enzymol. 1986, 131, 4–51. [Google Scholar] [CrossRef]
Figure 1. (a) Evolution of field autocorrelation functions g1(t) of light scattered during SMTHMW amyloid aggregate formation (pH 7.0–7.5, T = 25 °C). Aggregation was observed in a solution containing 0.15 M glycine–KOH, pH 7.0–7.5; (b) size distributions of SMTHMW particles. Generation of large aggregates and their time-dependent growth are shown; (c) distribution of SMTHMW particles after 1 h disaggregation (for clarity, the graph shows monodispersed SMTHMW). The data reflect the distributions corresponding to certain time points. Three independent experiments were carried out.
Ijms 24 01056 g001
Figure 2. AFM images of molecular SMTHMW obtained in a solution of 0.6 M KCl, 30 mM KH2PO4, 1 mM DTT, 0.1 M NaN3, and pH 7.0. In the field of view, there are filamentous protein molecules—monomers (marked with white squares) (a), which assemble into oligomers forming a central thickening (b).
Ijms 24 01056 g002
Figure 3. Electron microscopy of SMTHMW aggregates formed in a solution containing 0.15 M glycine–KOH at pH 7.0–7.5 at 4 °C. (a) 1 h aggregation of SMTHMW. (b,c) 24 h aggregation of SMTHMW. Protein filaments of a diameter of about 4 nm between amorphous aggregates (shown by red arrows on the insert) can be seen. The most representative data, obtained as a result of 10 independent experiments, are given. Scale bar, 100 nm.
Ijms 24 01056 g003
Figure 4. Atomic-force microscopy of SMTHMW aggregates in a solution containing 0.15 M glycine and pH 7.0–7.5. (a) SMTHMW after 1 h aggregation. (b,c) SMTHMW after 24 h aggregation. (d,g) SMTHMW aggregates after 1 h disaggregation; (e,f) SMTHMW aggregates after 24 h disaggregation. Scale bar in (g), 1 μm. The most representative data, obtained as a result of 3 independent experiments, are given.
Ijms 24 01056 g004
Figure 5. Investigation of the structure of SMTHMW aggregates by various methods. (a) CD spectrum of SMTHMW; (b) FTIR spectra of titin and its aggregates at 20 °C. Protein concentration was 10 mg/mL; (c,d) thioflavin T (ThT) staining of SMTHMW aggregates formed in a solution containing 0.15 M glycine–KOH at pH 7.0–7.5. (c) 1 h formation of aggregates; (d) 24 h formation of aggregates; (e,f) X-ray diffraction of SMTHMW aggregates formed after 1 h (e) and 24 h (f).
Ijms 24 01056 g005
Figure 6. Investigation of the structure of SMTHMW aggregates by small-angle X-ray scattering. (a) The scattering curve for molecular SMTHMW in logarithmic representation log I–log Q, where I is the scattering intensity in 0.6 M KCl, c = 0.5 mg/mL (non-aggregated protein form), Q is the scattering vector, tan A = −2.7; (b) SMTHMW in 0.15 M Gly (aggregated); Q, scattering vector; tan A = −2.65; (c) SMTHMW in 0.6 M KCl, c = 0.5 mg/mL; dark line, approximation by the DAMMIF program.
Ijms 24 01056 g006
Figure 7. Typical temperature dependence of excess heat capacity of SMTHMW in monomeric (black) and aggregated (blue) forms. Experiments were carried out 2 times for both the monomeric and aggregated SMTHMW forms. The obtained curves coincided in temperature Tm to an accuracy of 0.1 K. The relative error in determining calorimetric enthalpy, ΔHcal, did not exceed 10%.
Ijms 24 01056 g007
Figure 8. Titin-chicken domain structure schematic aligned with the protein disorder prediction plots by the IsUnstruct program [44]. Probabilities of ≥0.5 mean a disorder.
Ijms 24 01056 g008
Figure 9. A schematic of the internal structure of aggregates with a cross-β-sheet structure, formed by smooth-muscle titin. (a) The proposed structure of SMT aggregates based on circular dichroism, FTIR and X-ray diffraction data, suggesting the presence of a large amount of disorder. (b) A beta sheet and the distance of 4.7 Å between the beta strands. (c) The beta sheets and the distance of 10 Å between them are shown separately.
Ijms 24 01056 g009
Table 1. Secondary structure content in chicken titin samples calculated by the FTIR method.
Preparationα-Helices, %β-Folds, %Turns, %Disordered Structure, %
Molecular SMTHMW26 ± 1.025 ± 2.011.7 ± 0.632 ± 2.0
Aggregated SMTHMW24.6 ± 1.626 ± 2.010.7 ± 0.434 ± 2.0
The results of two experiments are presented. The means and standard deviations are given.
Table 2. Identity of the chicken-titin amino acid sequence.
ProteinDomain 1
(for Pair Comparison)
Number of Domains in the GroupAverage Length of DomainDomain 2
(for Pair Comparison)
(Id) Mean Identity,
%
Side Standard Dispersion/Deviation of Identity, %N0, Number of Domain Pairs with Zero IdentityN, Total Number of Domain PairsN0/N·100, %
Chicken titinIg-like6481.4Ig-like20%11%647403216%
Ig-like6481.4FnIII-like3%4%22338458%
Ig-like6481.4none2%6%52670475%
FnIII-like684.3FnIII-like33%7%0300%
FnIII-like684.3none2%2%436665%
none11104.2none3%5%5911054%
Identity was calculated by the formula: Id = 2 × Nid/(L1 + L2). Nid—number of identical residues in the alignment. L—number of residues in the domain. Chicken titin domains were taken from the website: UniProtKB—A6BM71_CHICK. If there was a distance of more than 50 residues between the domains, then a pseudodomain with the signature none FnIII-like = Fibronectin type-III was created. This corresponded to the I-band region of the skeletal muscle sarcomere, which is involved in extension and contraction between the Z-line and the A–I junction [42]. The complete sequence for the smooth muscle isoform of titin or full-sized chicken skeletal titin is not available in the literature.
Disclaimer/Publisher’s Note: The statements, opinions and data contained in all publications are solely those of the individual author(s) and contributor(s) and not of MDPI and/or the editor(s). MDPI and/or the editor(s) disclaim responsibility for any injury to people or property resulting from any ideas, methods, instructions or products referred to in the content.

