Article

Three-Dimensional Gene Regulation Network in Glioblastoma Ferroptosis

State Key Laboratory of Medicinal Chemical Biology, Frontiers Science Center for Cell Responses, College of Life Sciences, Nankai University, Tianjin 300071, China
*
Authors to whom correspondence should be addressed.
These authors contributed equally to this work.
Int. J. Mol. Sci. 2023, 24(19), 14945; https://doi.org/10.3390/ijms241914945
Submission received: 3 August 2023 / Revised: 30 September 2023 / Accepted: 4 October 2023 / Published: 6 October 2023
(This article belongs to the Section Molecular Neurobiology)

Abstract

:
Ferroptosis is an iron-dependent form of cell death, which is reported to be associated with glioma progression and drug sensitivity. Targeting ferroptosis is a potential therapeutic approach for glioma. However, the molecular mechanism of glioma cell ferroptosis is not clear. In this study, we profile the change of 3D chromatin structure in glioblastoma ferroptosis by using HiChIP and study the 3D gene regulation network in glioblastoma ferroptosis. A combination of an analysis of HiChIP and RNA-seq data suggests that change of chromatin loops mediated by 3D chromatin structure regulates gene expressions in glioblastoma ferroptosis. Genes that are regulated by 3D chromatin structures include genes that were reported to function in ferroptosis, like HDM2 and TXNRD1. We propose a new regulatory mechanism governing glioblastoma cell ferroptosis by 3D chromatin structure.

1. Introduction

Glioma is a common intracranial primary tumor. About 80% of malignant primary brain tumors are glioblastoma (GBM), which is the most malignant glioma and has a high mortality rate [1,2]. Currently, the clinical treatment methods for glioma are limited, and patients’ median survival time is only 14–17 months [3]. Despite the fact that glioma therapeutic approaches have improved in recent years, the clinical effects and prognosis are still not satisfactory. Finding the accurate drug target is important, and problems such as drug resistance and immunosuppression in glioma treatment have not yet been fully solved. Tumor cell death is key in tumor therapy, and elucidating the molecular mechanisms of tumor cell death is important to the development and improvement of therapeutic approaches. However, the molecular mechanisms of glioma cell death remain unclear.
Ferroptosis is a newly defined form of cell death (2012), which is caused by iron-induced oxidative damage, the disruption of the cell membrane, and cell lysis [4,5]. Ferroptosis is related to oncogenesis and tumor development and is regulated by multiple cancer-associated signaling pathways [6]. Recent studies have shown that ferroptosis inhibits the growth of glioma cells, which is associated with the survival of patients and the clinical outcome of radiotherapy and chemotherapy [7], but the mechanisms underlying this are not clear.
The development of 3D genomic technologies reveals that gene regulatory elements regulate distal target genes’ expression through the 3D structure of chromatin, and the 3D gene regulatory network can regulate physiological and biochemical processes in cells [8,9,10]. Several studies reported that change in the 3D structure of chromatin regulates the expression of oncogenes and tumor suppressor genes and affects tumor initiation and development [10,11,12,13,14,15,16]. As an important physiological process that affects glioma initiation and progression, ferroptosis involves multiple important signaling pathways, and the related gene regulation may be associated with the change of the 3D chromatin architecture. In this study, H3K27ac HiChIP was performed to investigate the change of active enhancer-related 3D chromatin structures in glioblastoma cell ferroptosis. By combining an analysis of RNA-seq and ChIP-seq data, this study found a 3D enhancer-gene regulation network in glioblastoma cell ferroptosis.

2. Results

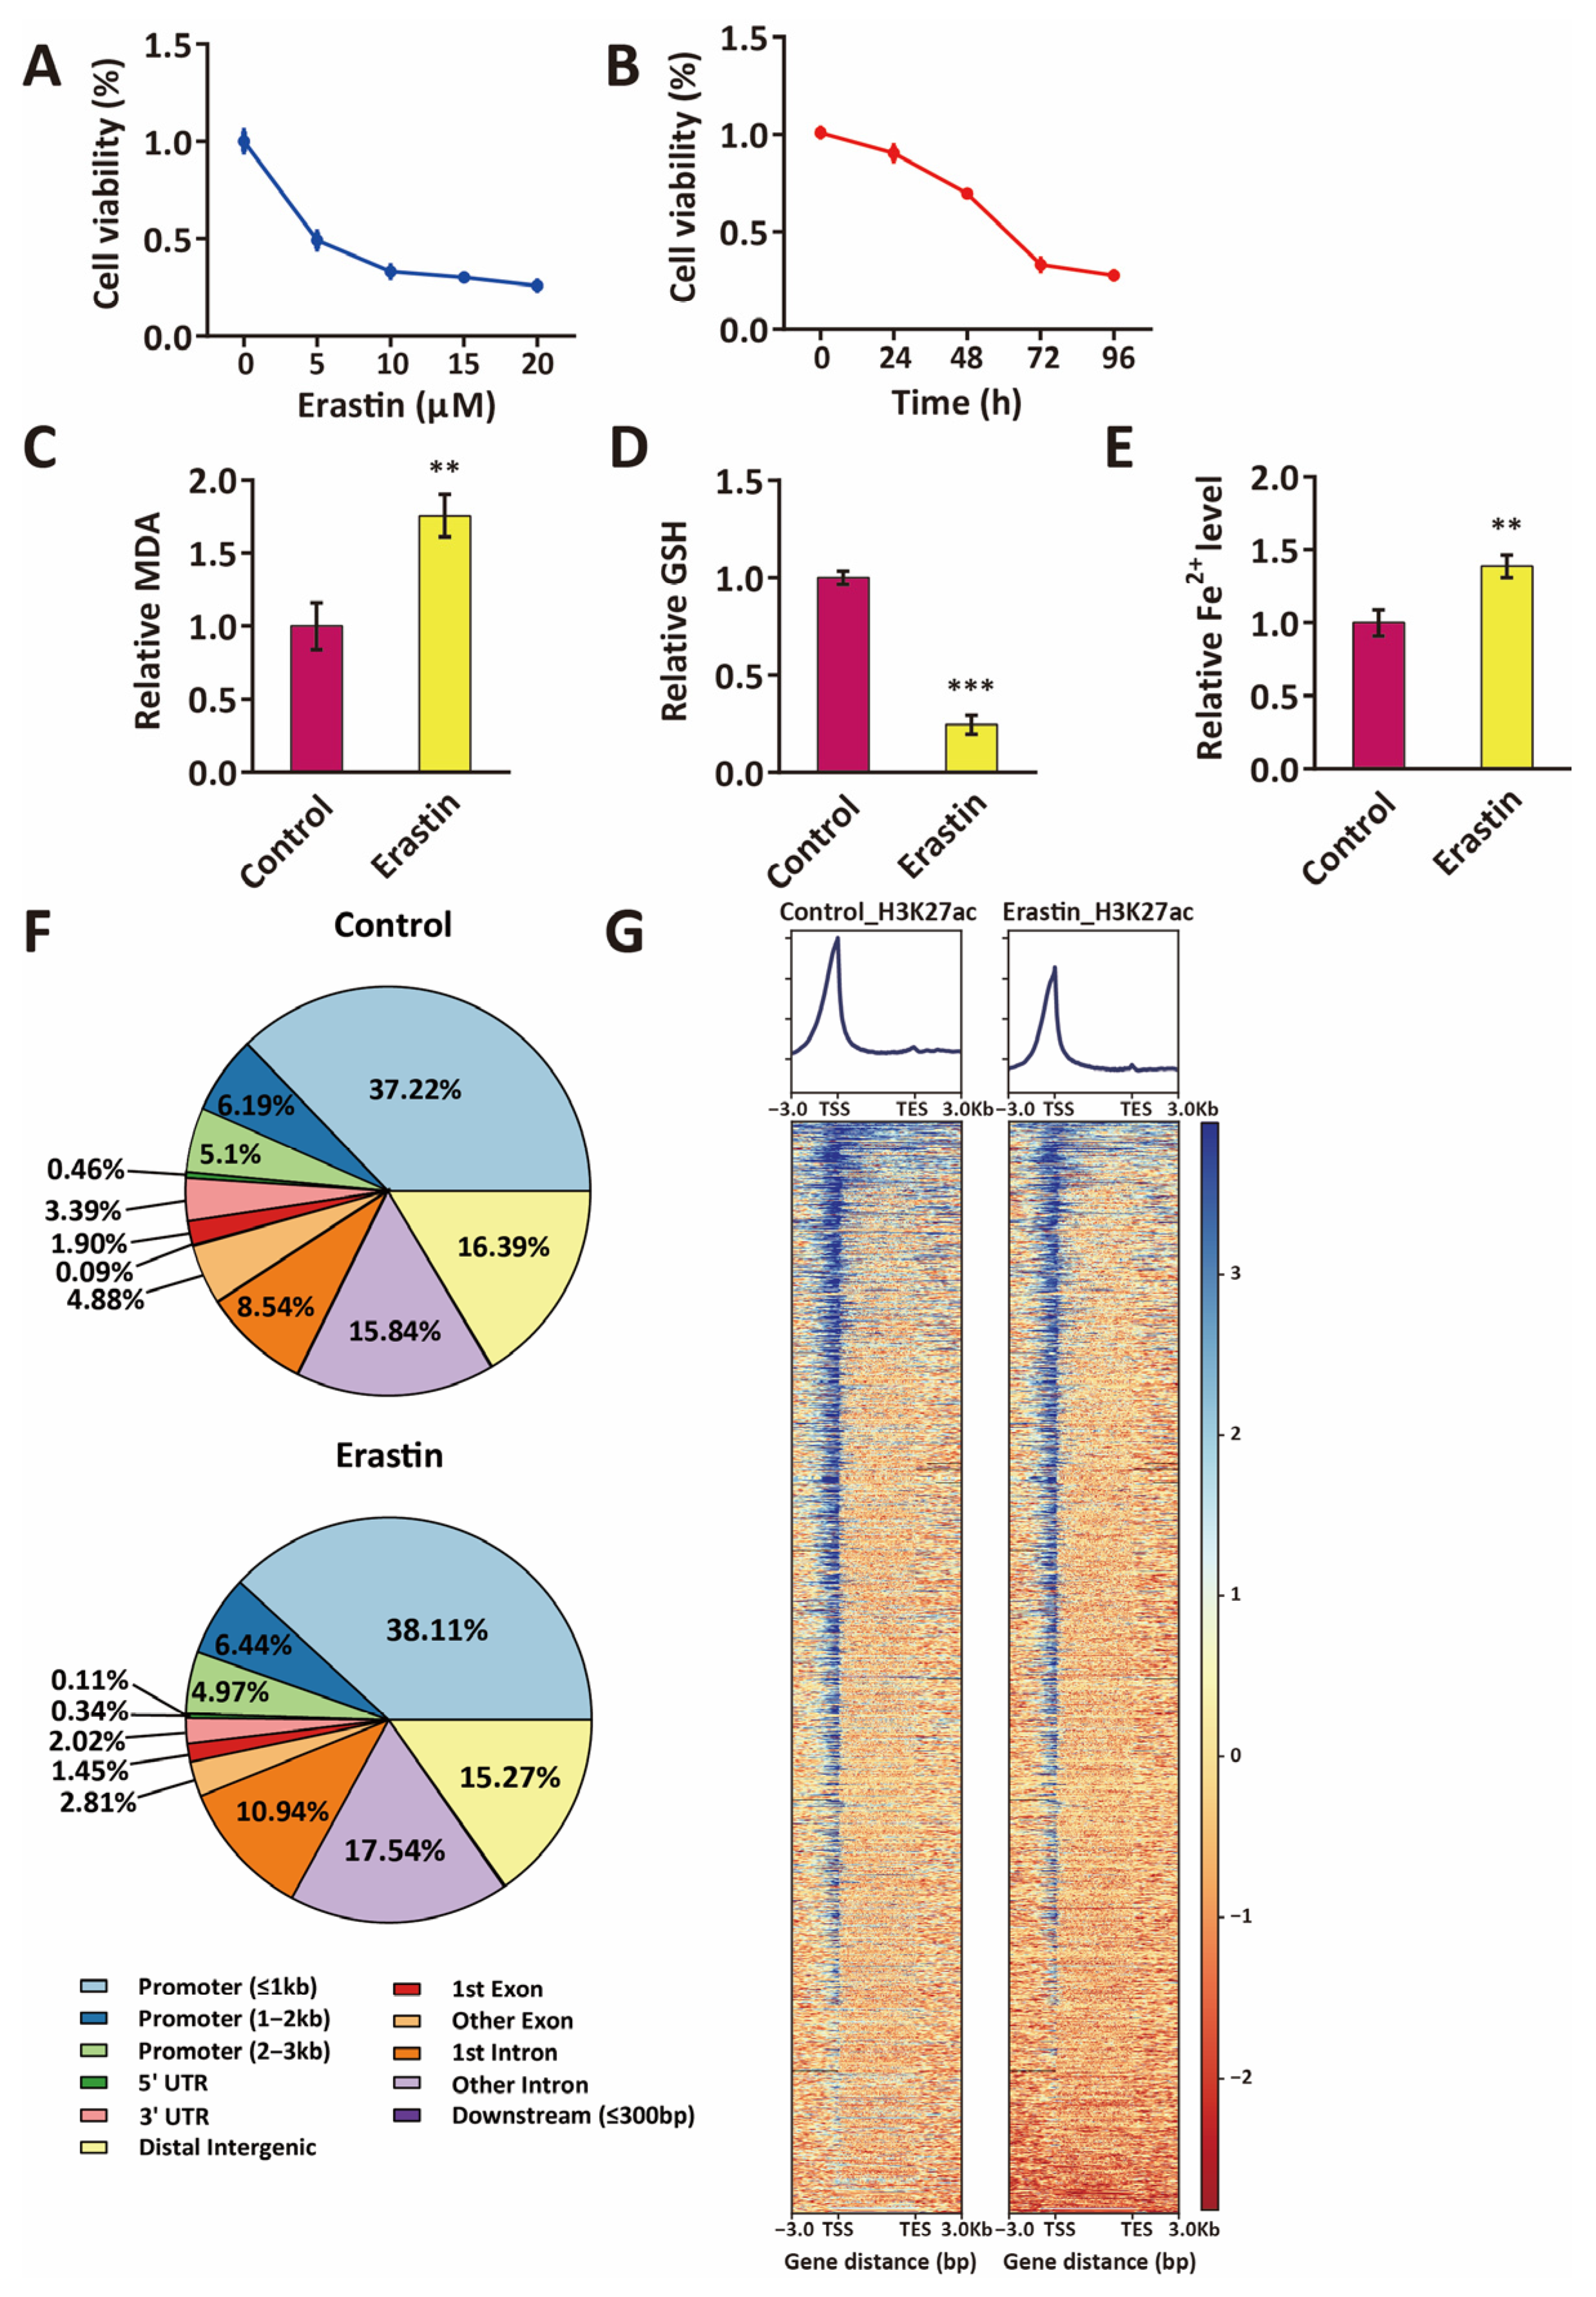
2.1. Distribution of Active Enhancers in Ferroptotic Glioblastoma Cells

Erastin is a small molecular compound that inhibits the system Xc- and prevents the import of cystine, reducing glutathione (GSH) biosynthesis and glutathione peroxidase 4 (GPX4) activity and finally inducing cell death via ferroptosis [17]. To establish a model of Erastin-induced ferroptosis in glioblastoma cells, U87MG cells were treated for different concentrations of Erastin. Significant survival inhibition of U87MG was detected by MTS assay under the treatment of Erastin, and higher concentrations or longer treatment times of Erastin induced a more significant decrease in cell viability (Figure 1A,B and Figure S1A,B). U87MG cell survival inhibition reached lower than 50% after 72 h of treatment with 10 μM Erastin (Figure 1A and Figure S1A). Malondialdehyde (MDA) is the product of polyunsaturated fatty acid peroxidation. The level of MDA in cells indicates the degree of cellular oxidation, which can be used to quantify ferroptosis. A significant increase of intracellular MDA levels in U87MG glioblastoma cells was detected after Erastin treatment (10 μM, 72 h) compared to control (Figure 1C and Figure S1C). The depletion of glutathione (GSH) is associated with an increase in cell ferroptosis, and significant GSH depletion was shown in the Erastin (10 μM, 72 h)-treated U87MG cells (Figure 1D and Figure S1D). In addition, the accumulation of intracellular Fe2+ is a marker of increased ferroptosis, and the level of Fe2+ significantly increased in Erastin (10 μM, 72 h)-treated U87MG cells compared to control (Figure 1E and Figure S1E). These data suggest significant ferroptosis in U87MG cells treated with 10 μM Erastin for 72 h.
H3K27ac is known as a marker of active enhancers in mammals [18,19]. Enrichment of H3K27ac modification is associated with the upregulation of gene expression. H3K27ac ChIP-seq was performed in control glioblastoma cells and glioblastoma cells that were treated with Erastin (10 μM, 72 h) to investigate the distribution of active enhancers in control glioblastoma cells and ferroptotic glioblastoma cells. In both control glioblastoma cells and ferroptotic glioblastoma cells, ~50% of all H3K27ac peaks are at promoters, ~40% are at non-coding regions, such as intergenic regions and introns, and ~5% appeared in exon regions (Figure 1F). No significant global changes in H3K27ac enrichment were detected in ferroptotic glioblastoma cells relative to control cells (Figure 1F). H3K27ac peaks are mainly enriched near the transcriptional start sites of the genes in both control glioblastoma cells and ferroptotic glioblastoma cells (Figure 1G).

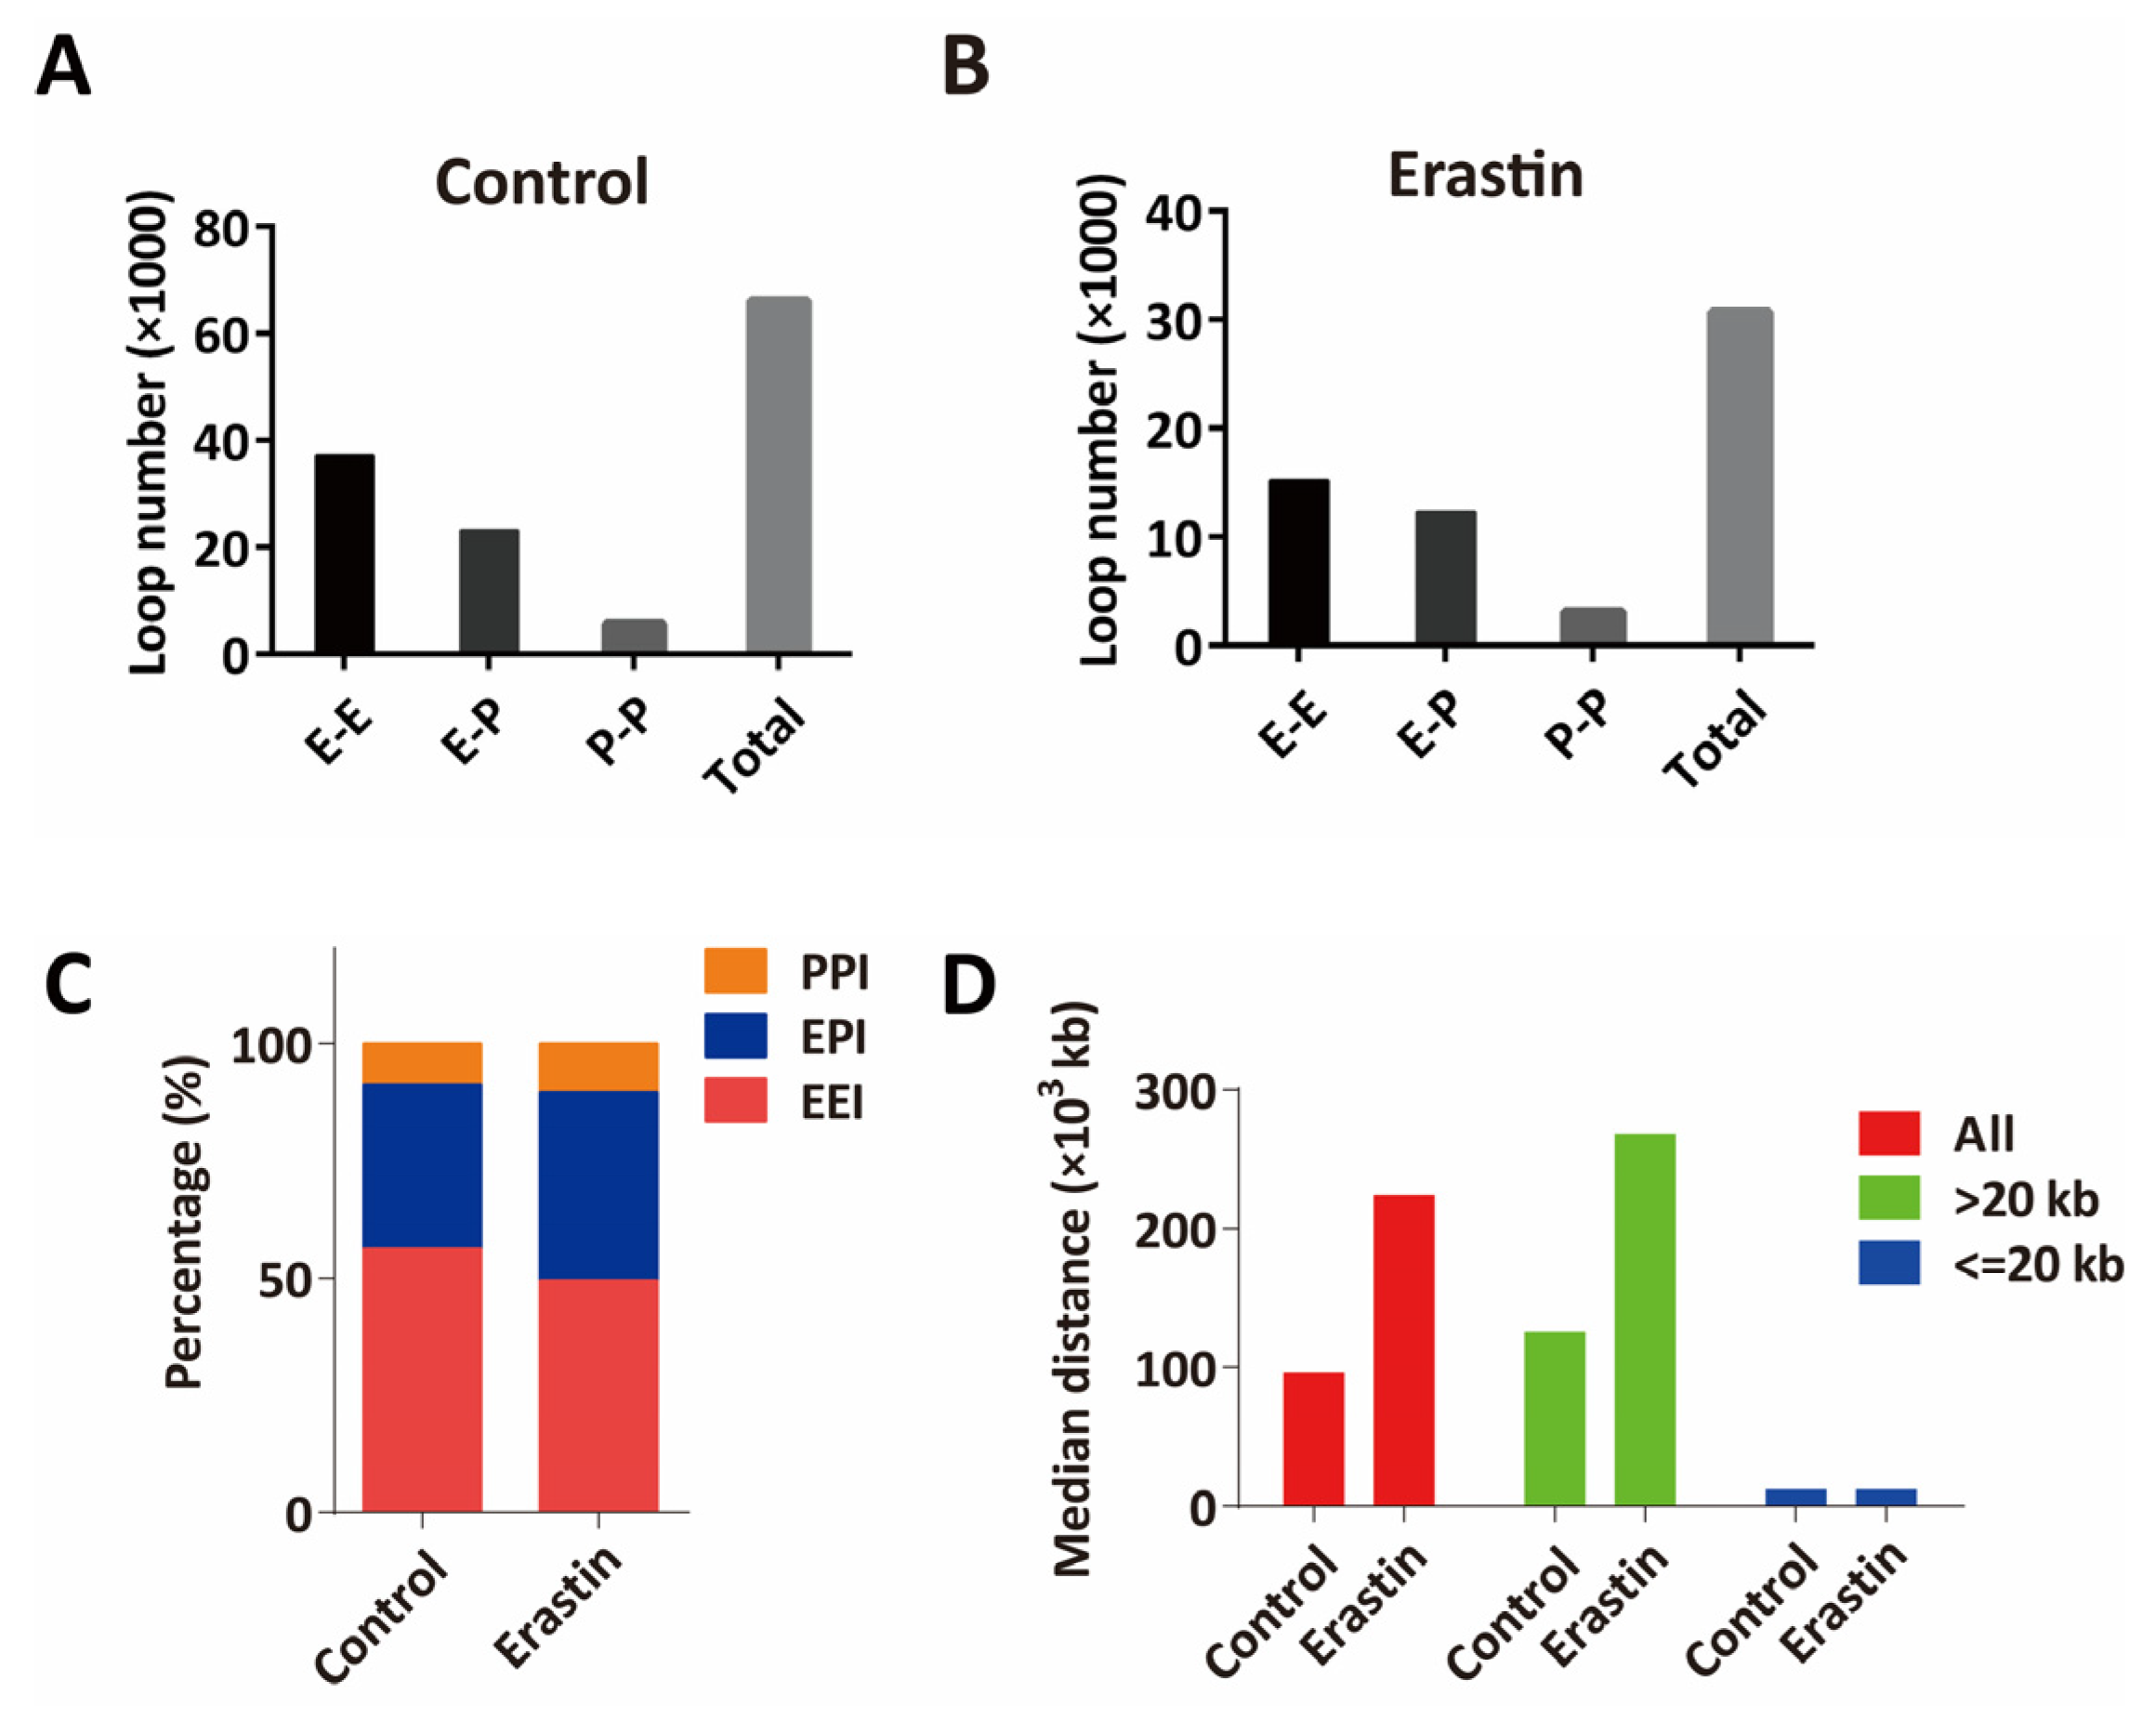
2.2. HiChIP Identifies the Change of 3D Chromatin Structure in Glioblastoma Cell Ferroptosis

To investigate functions of 3D genome structure in glioblastoma cell ferroptosis, H3K27ac HiChIP was performed to identify enhancer-related 3D chromatin structures in control glioblastoma cells and ferroptotic glioblastoma cells. HiChIP identified 66172 and 30722 high-confidence, reproducible chromatin loops in control glioblastoma cells and Erastin (10 μM, 72 h)-treated ferroptotic glioblastoma cells, respectively. HiChIP data indicated the change of 3D chromatin structure in ferroptotic glioblastoma cells compared to control (Figure 2A,B). MAP1LC3B and CHAC1 were reported to function in ferroptosis [20,21,22,23].
To determine whether the change of 3D chromatin structures induced a transcription change of genes in ferroptosis, RNA-seq was performed in U87MG cells and Erastin (10 μM, 72 h)-treated U87MG cells to detect the transcriptome change in ferroptotic glioblastoma cells. HiChIP data indicated increased chromatin interactions near MAP1LC3B and CHAC1 loci in ferroptotic glioblastoma cells.
Chromatin loops that are identified by H3K27ac HiChIP include enhancer–enhancer interactions (EEI), enhancer–promoter interactions (EPI), and promoter–promoter interactions (PPI) (Figure 3A,B). Among all enhancer and promoter interaction networks in control U87MG glioblastoma cells, 56.2% were EEI, 35.1% were EPI, and 8.7% were PPI, while in Erastin (10 μM, 72 h)-treated U87MG glioblastoma cells, PPI and EPI increased to 10.3% and 40.1%, respectively, and EEI decreased to 49.6% (Figure 3C). Moreover, the median length of chromatin interaction loops was longer in Erastin (10 μM, 72 h)-treated U87MG glioblastoma cells compared to control, and more long-range chromatin interactions were detected in Erastin-treated U87MG cells (Figure 3D), suggesting global alterations of 3D chromatin structure in ferroptosis.

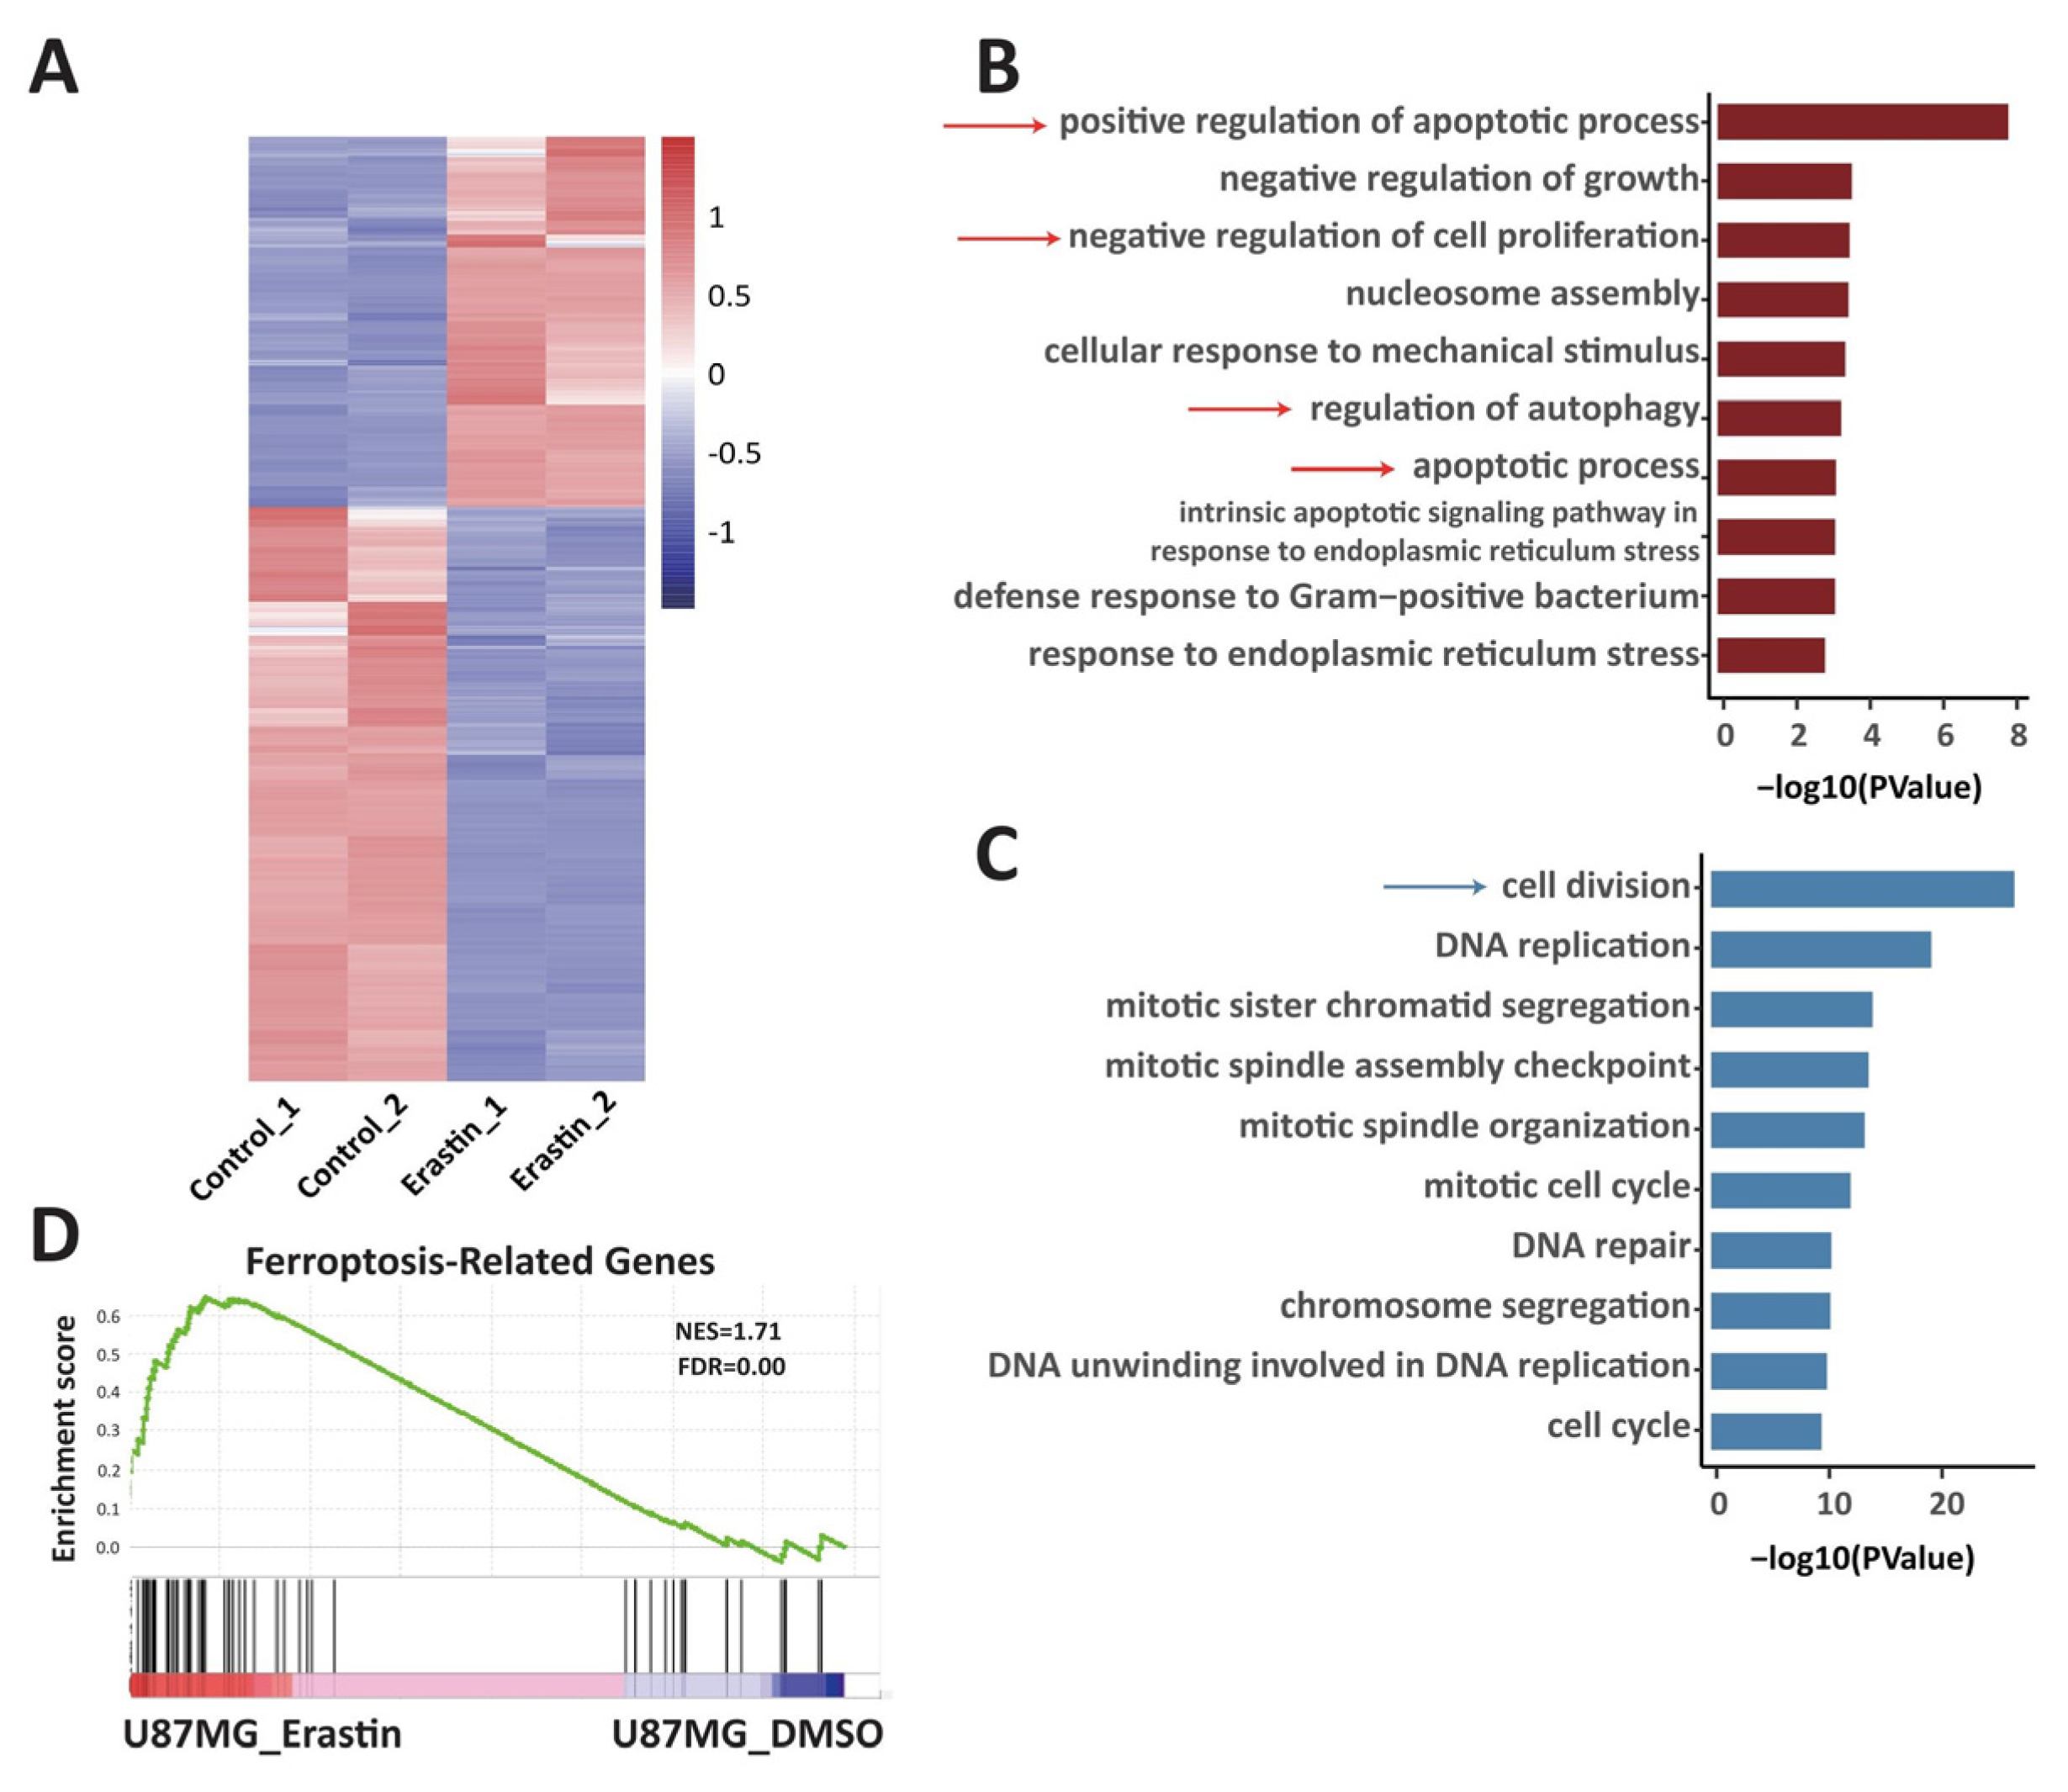
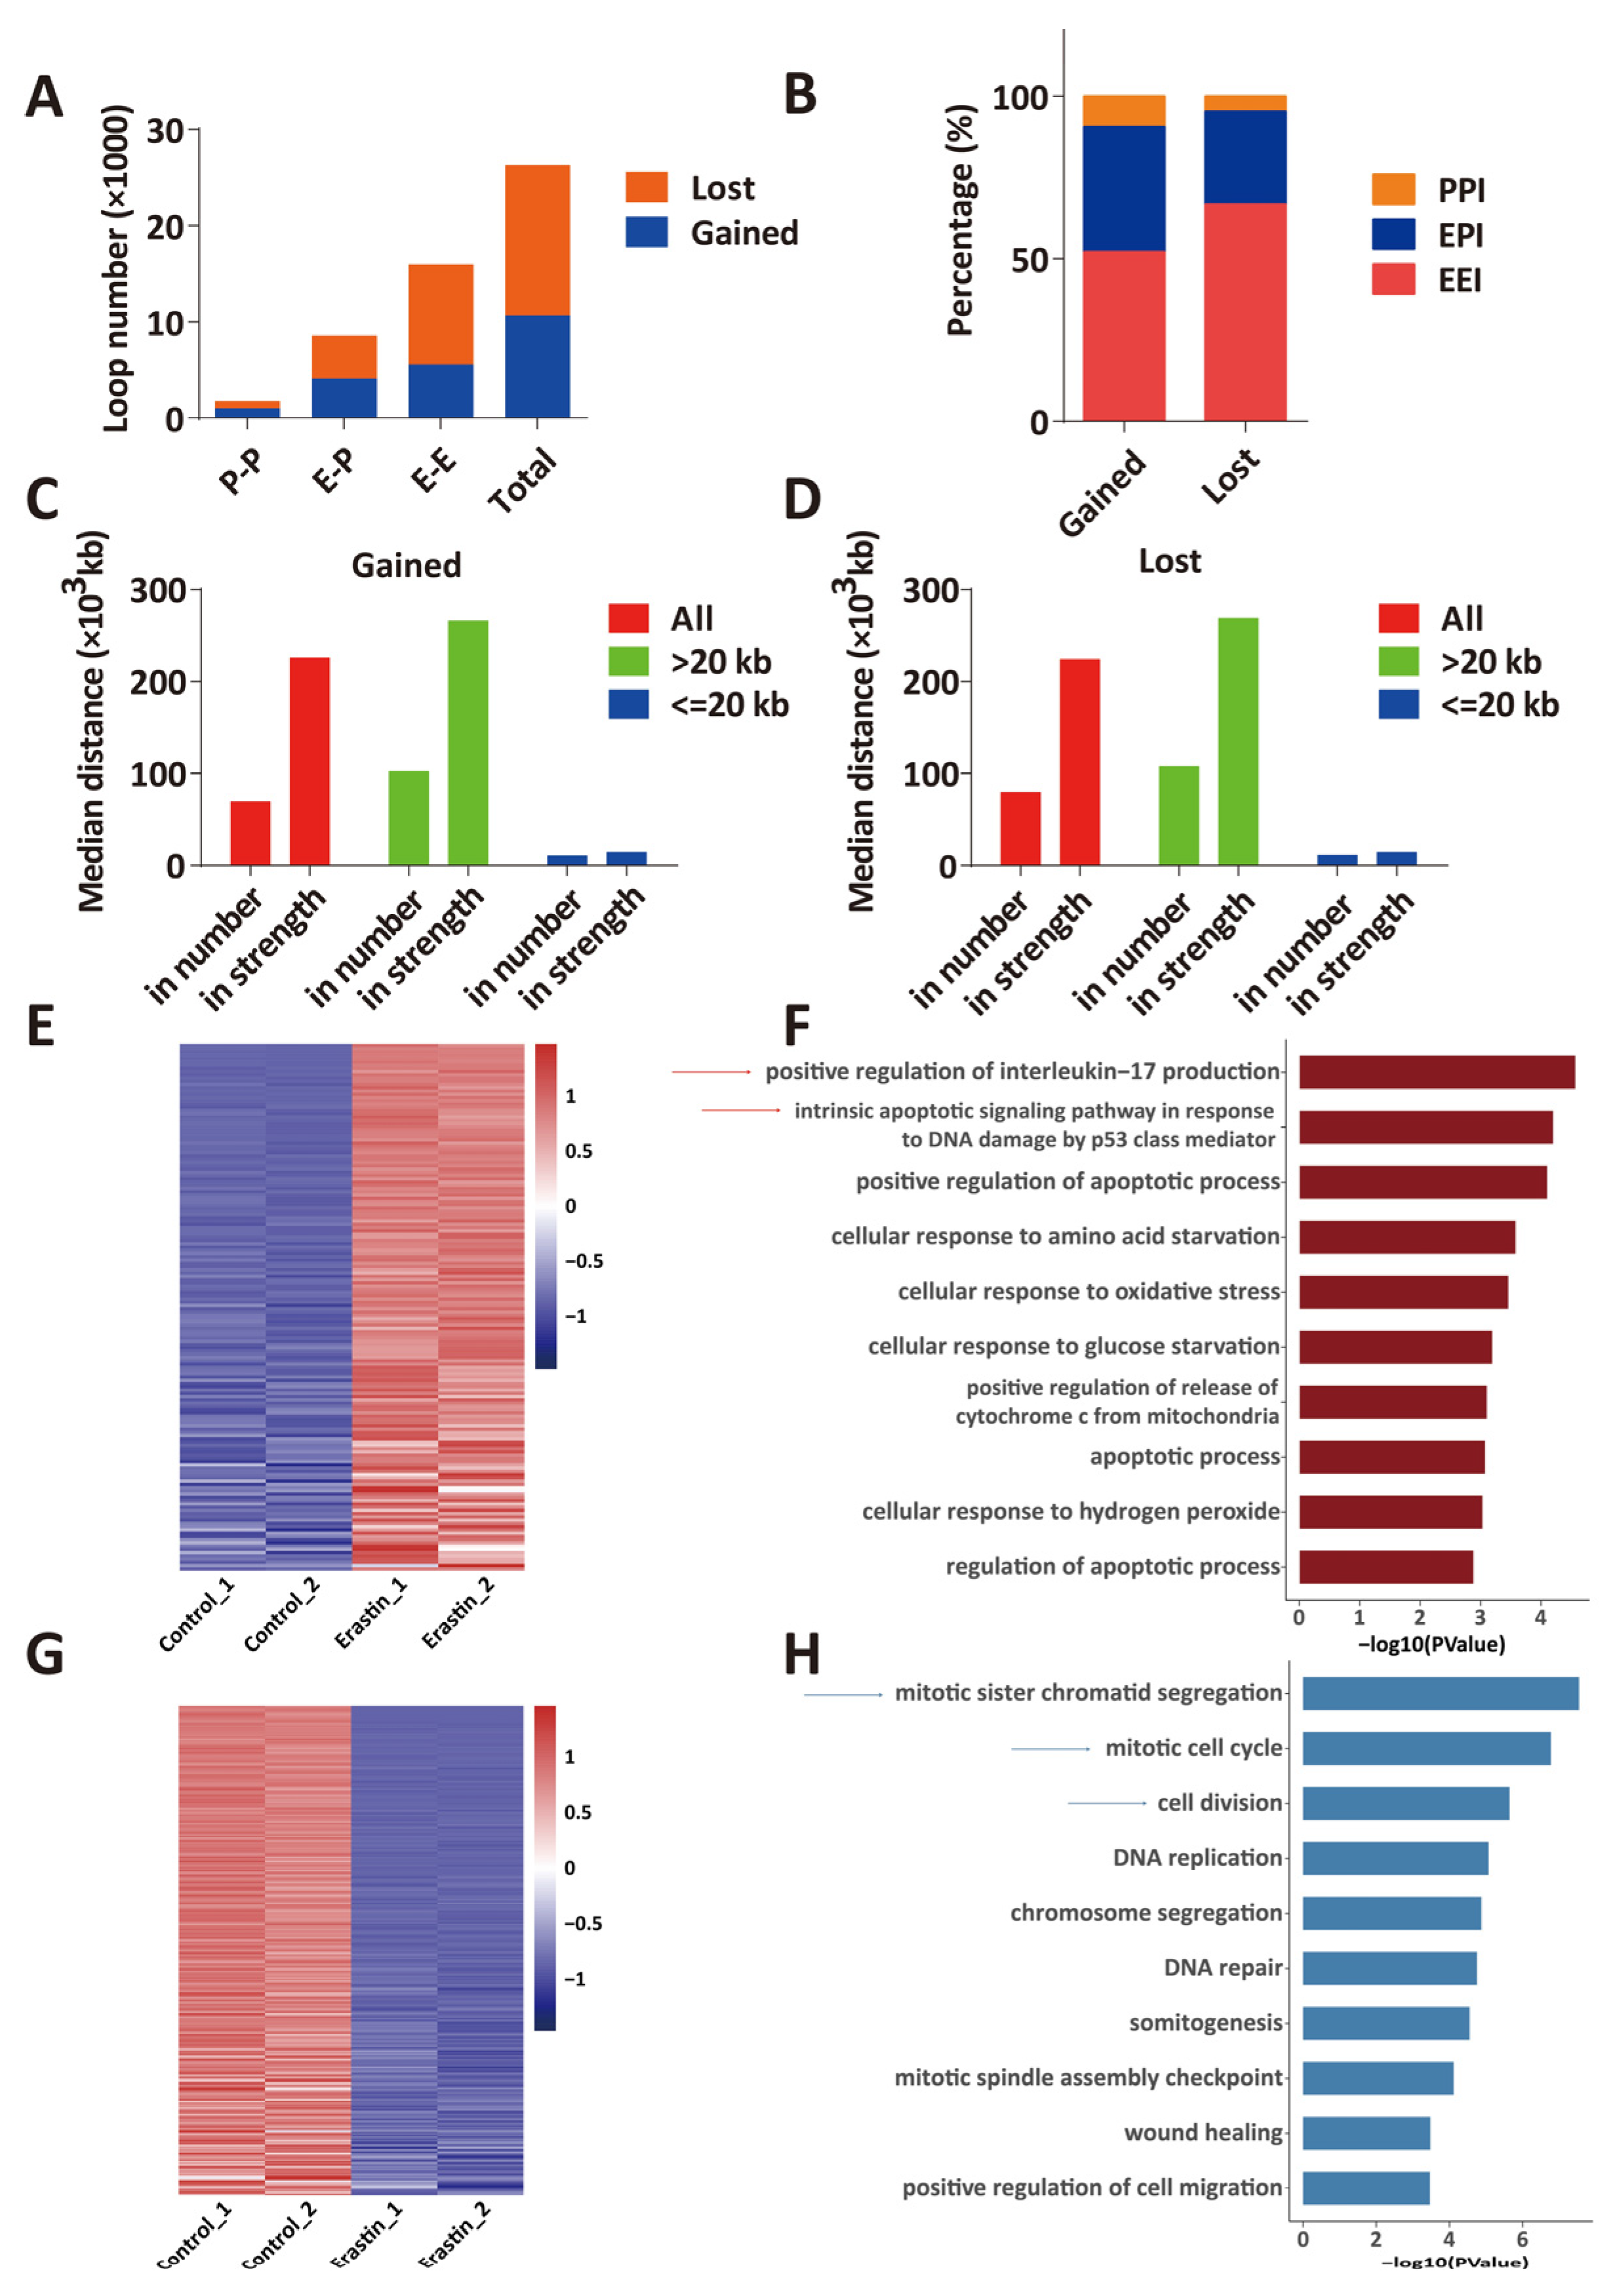
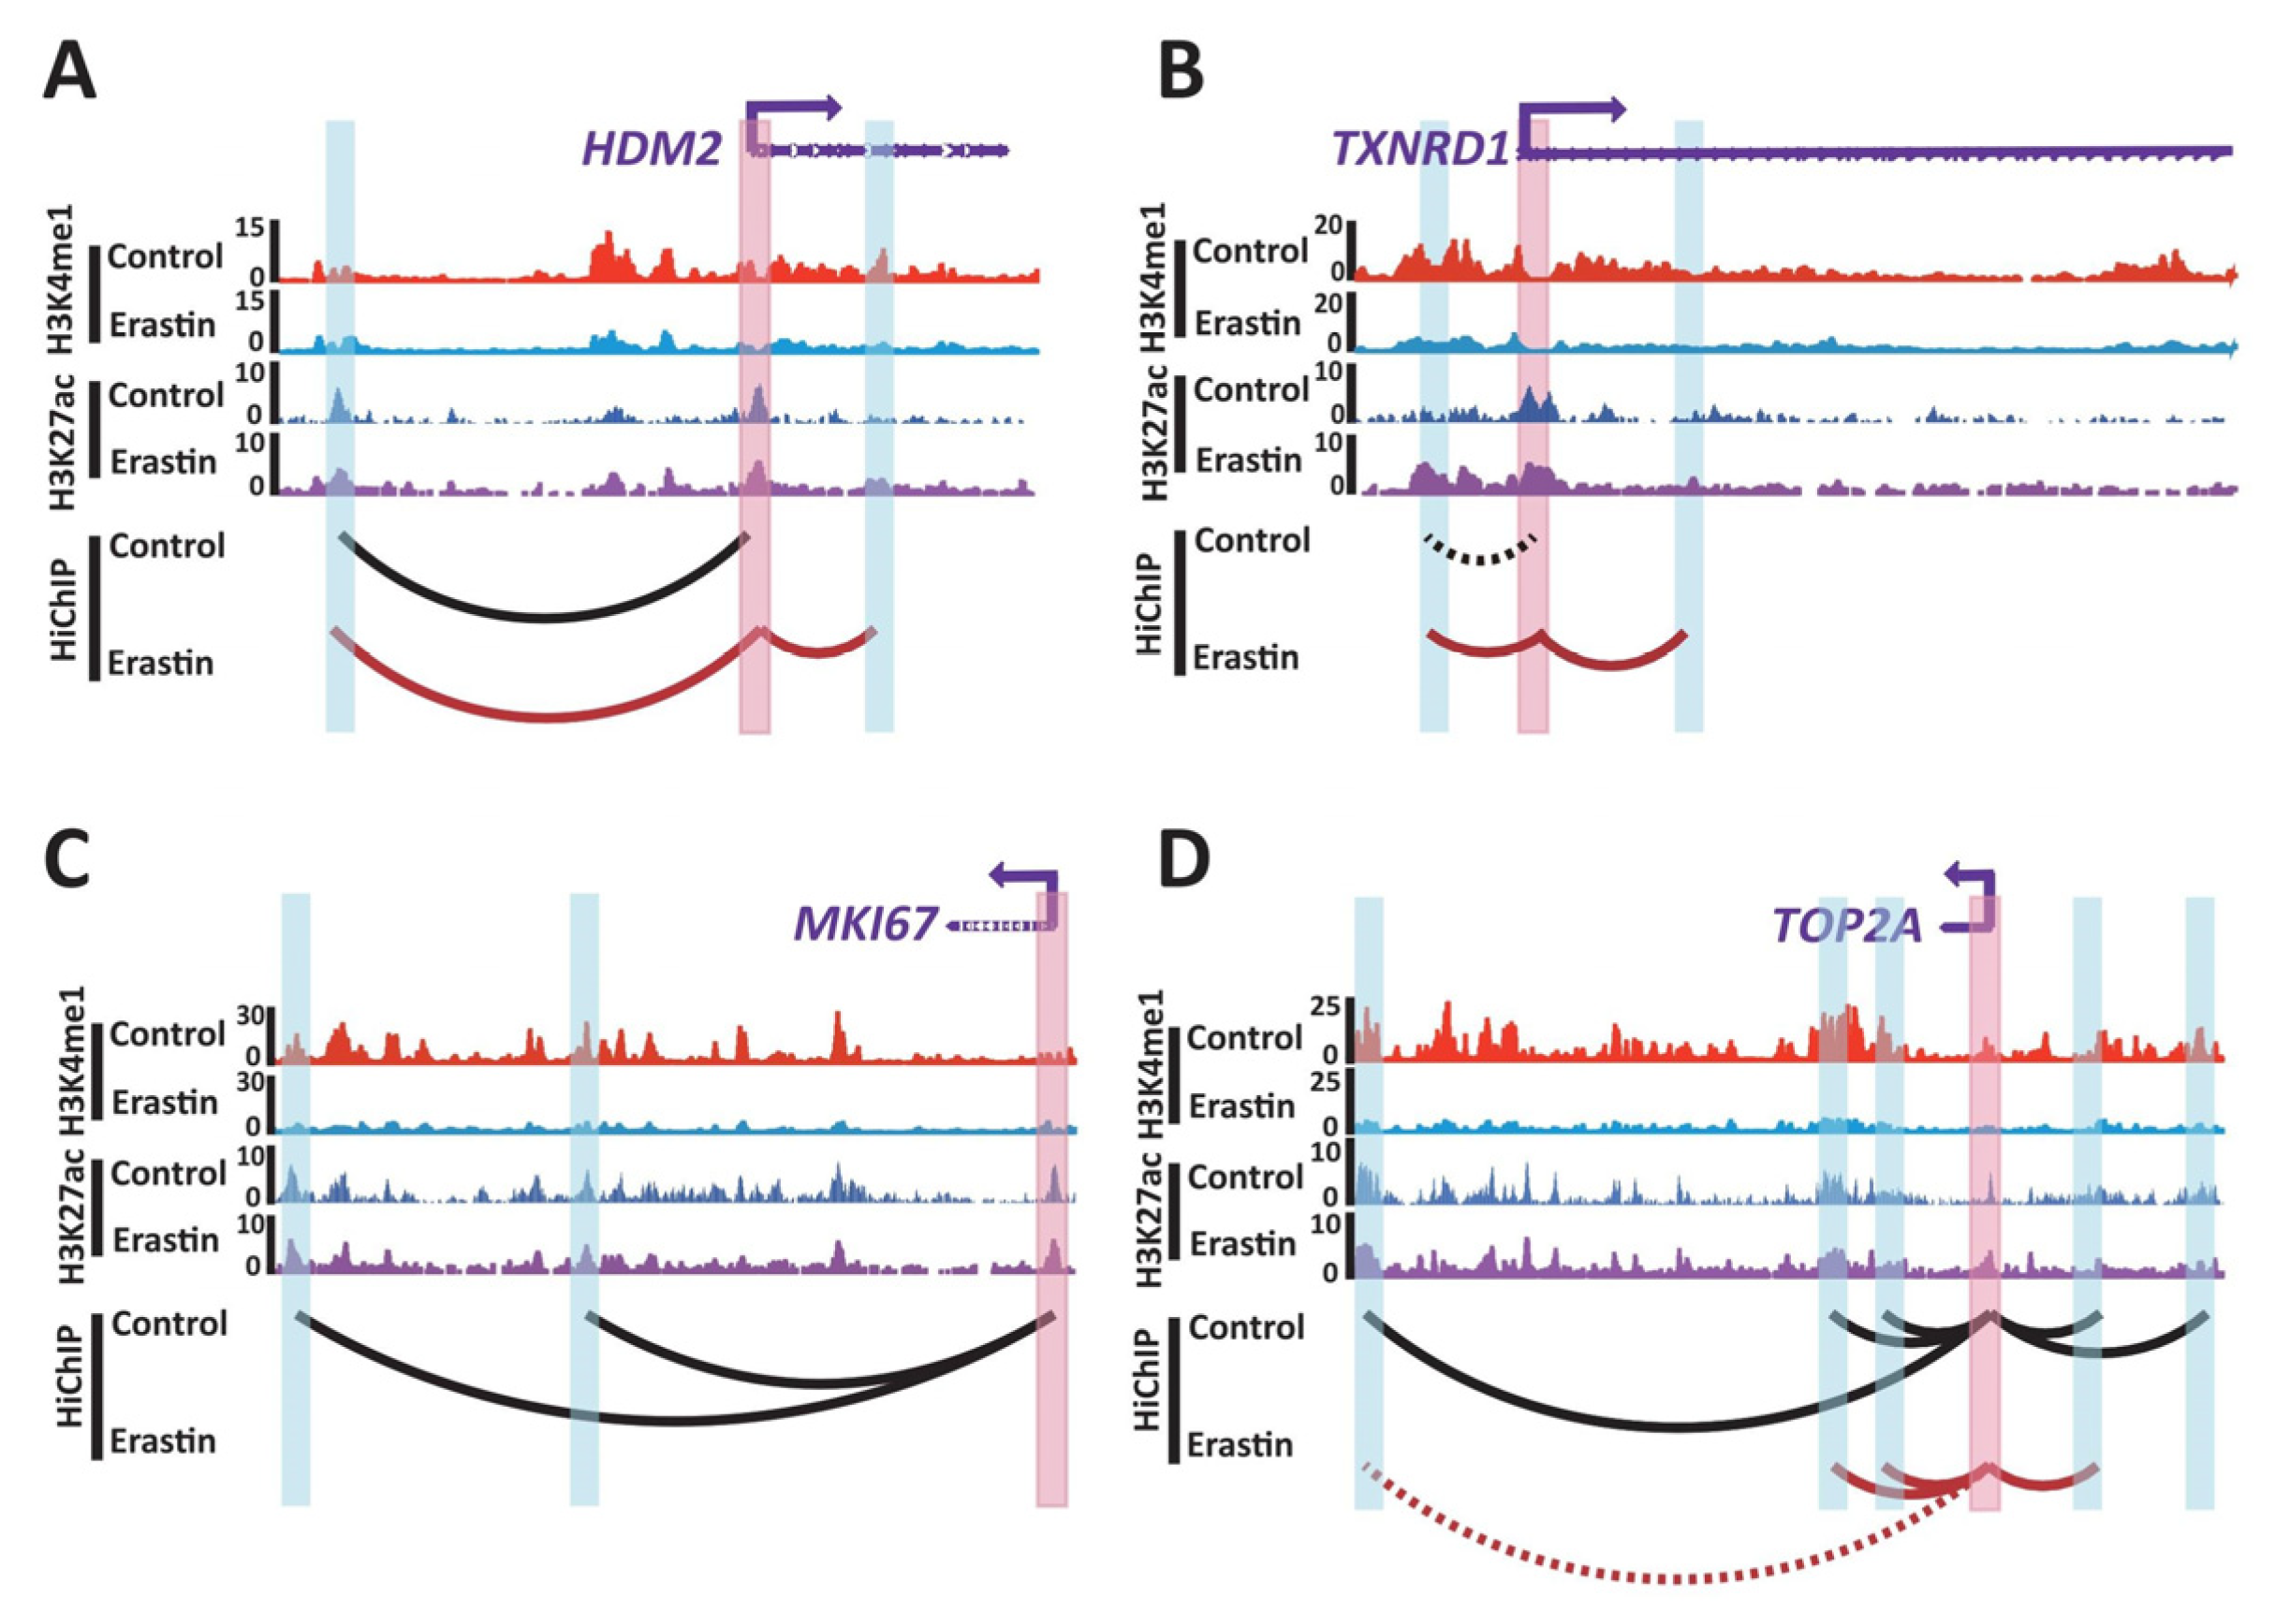
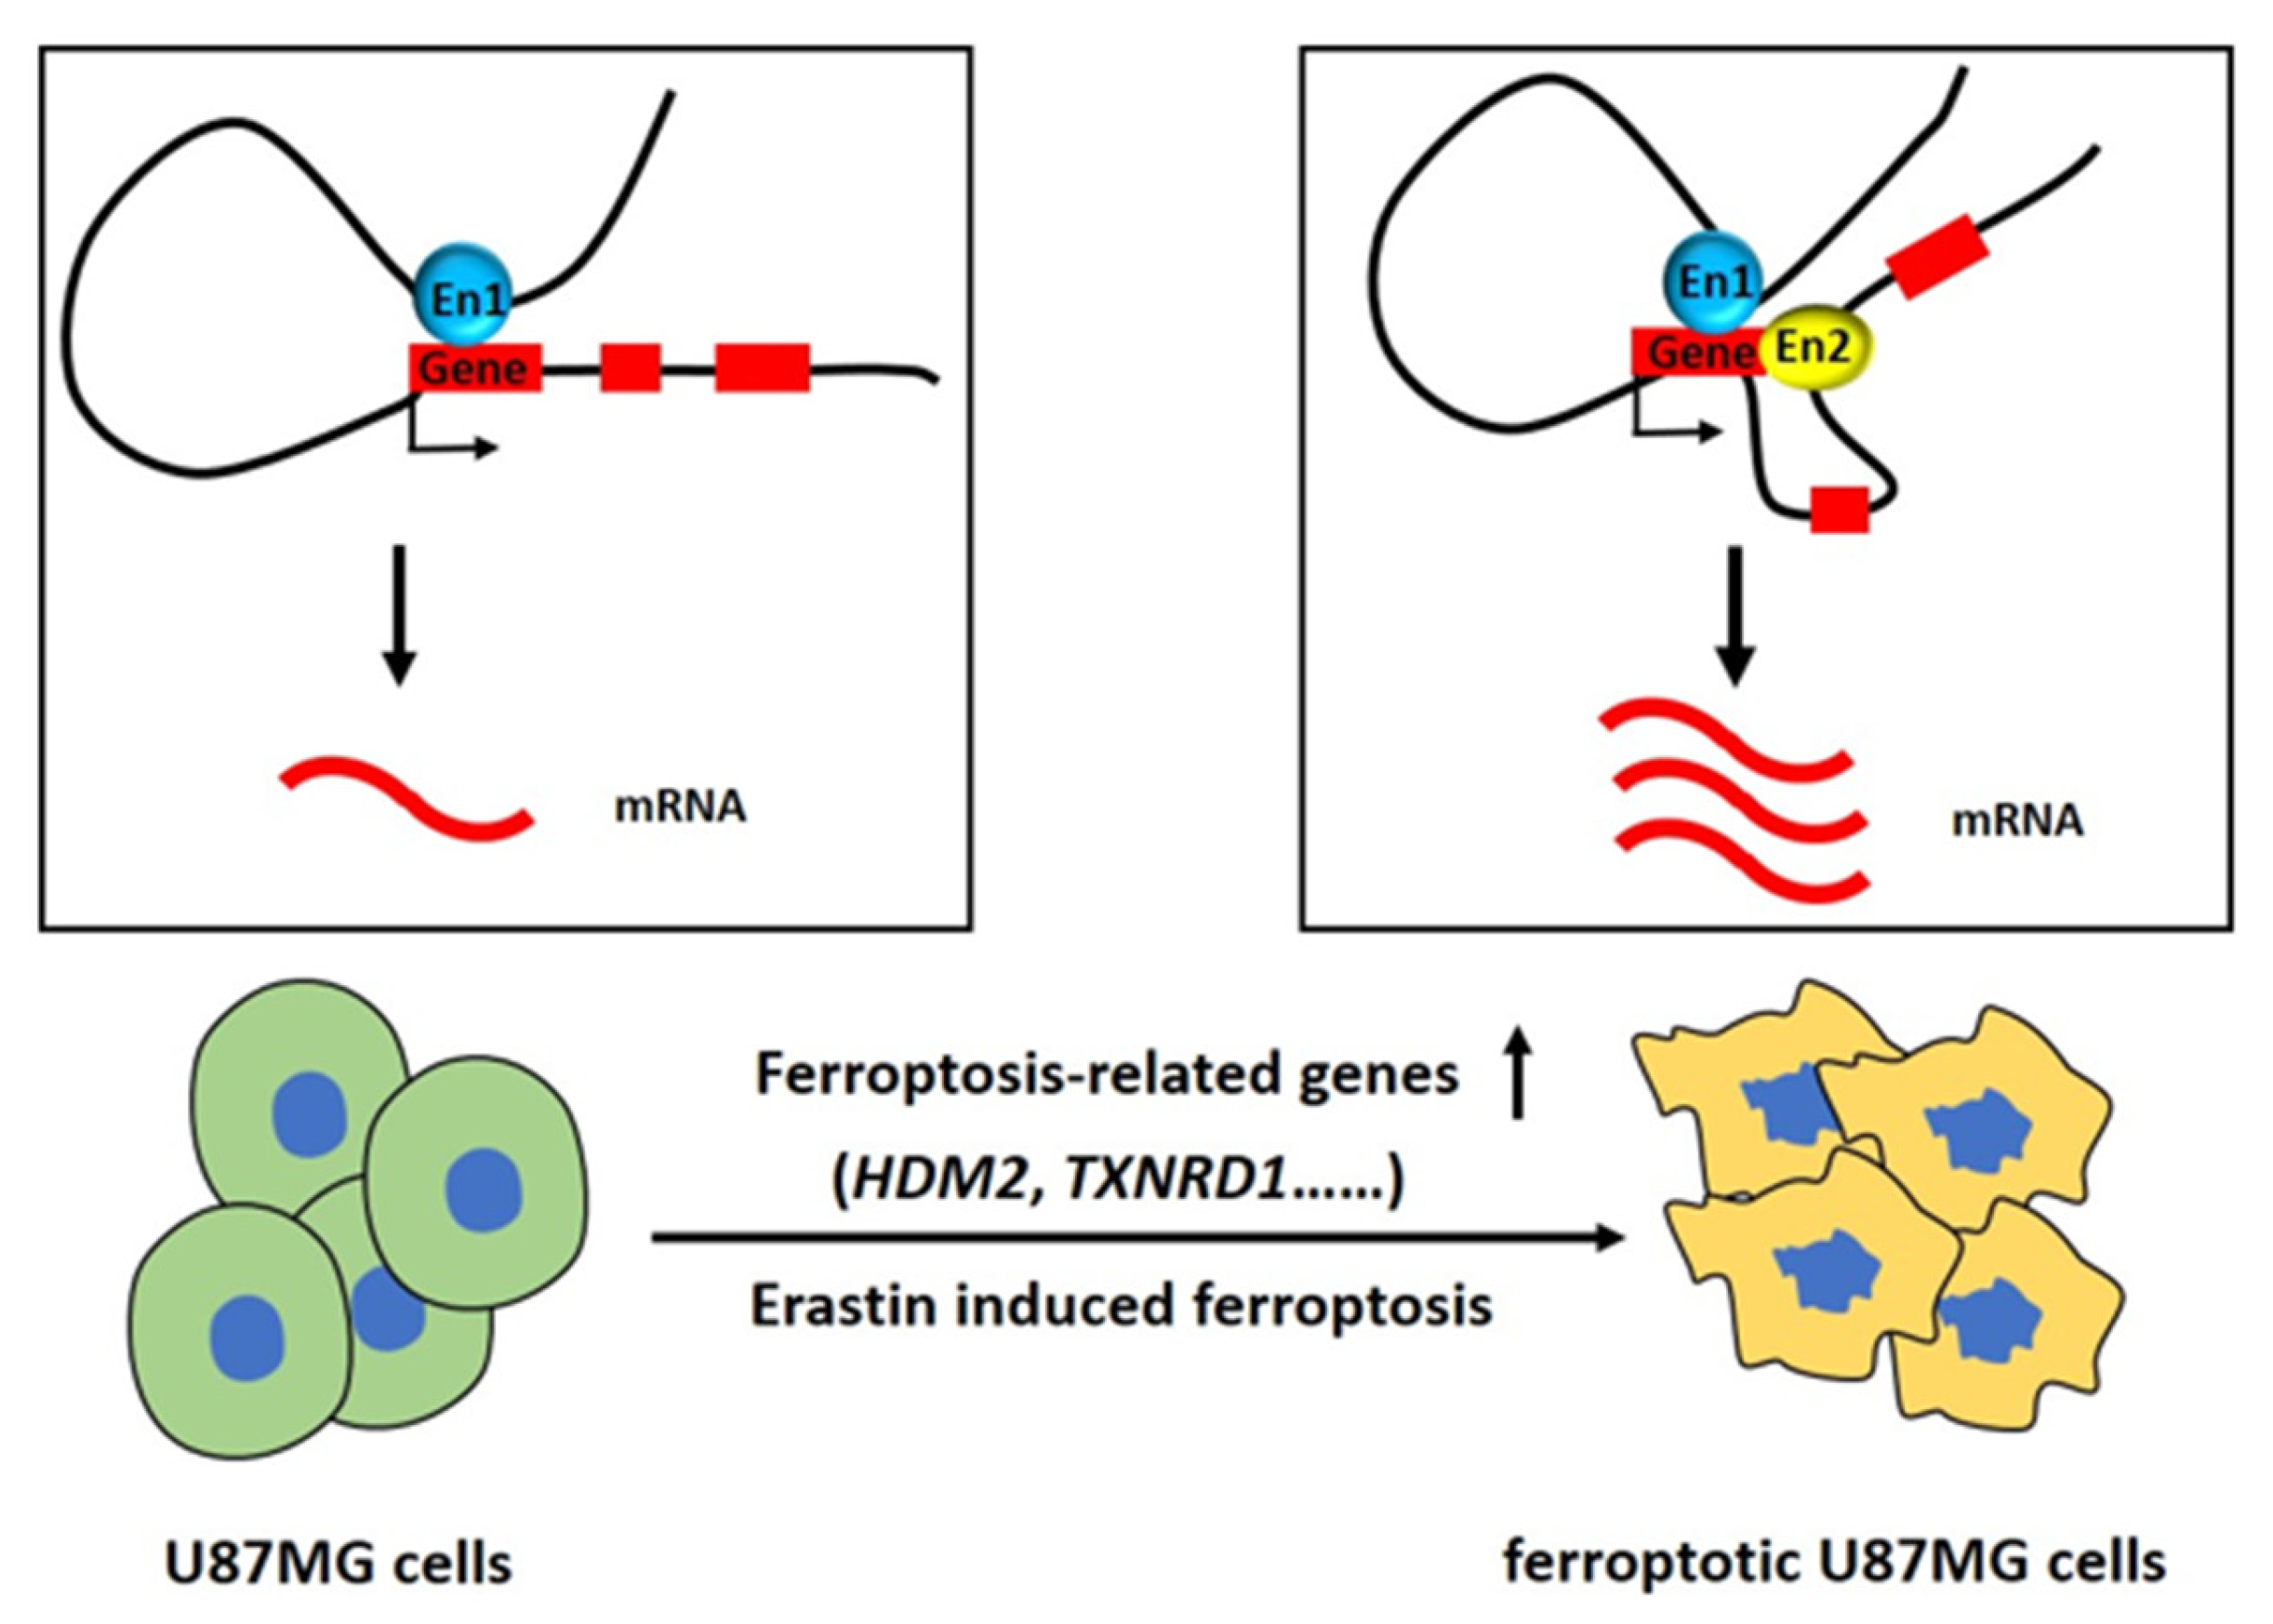
2.3. Transcriptome Change in Ferroptotic Glioblastoma Cells Is Associated with Changes of 3D Chromatin Structure

RNA-seq data indicated 917 genes were significantly upregulated (log2FC > 1; padj < 0.05) and 1422 genes were significantly downregulated (log2FC ≤ −1; padj < 0.05) in ferroptotic cells compared to control (Figure 4A). Gene ontology (GO) analysis of significantly upregulated gene revealed that positive regulation of apoptotic process, apoptotic process, regulation of autophagy and negative regulation of cell proliferation-related biological processes were enriched in ferroptotic glioblastoma cells (Figure 4B). These cell signaling pathways or biological processes are associated with ferroptosis [24,25,26]. GO analysis of significantly downregulated genes (log2FC ≤ −1, padj < 0.05) showed that the top pathway altered was cell division (Figure 4C). In addition, the Gene Set Enrichment Analysis (GSEA) indicated that the ferroptosis-related genes [27] are highly enriched in Erastin (10 μM, 72 h)-treated U87MG cells (Figure 4D).
Changes in chromatin loops that were identified by HiChIP were categorized as gained (increased loop number and/or interaction strength) loops or lost (decreased loop number and/or interaction strength) loops in Erastin (10 μM, 72 h)-treated U87MG cells compared with control, and these loops include promoter–promoter (P–P), enhancer–promoter (E–P) and enhancer–enhancer (E–E). In total, 10664 gained loops were identified by HiChIP in ferroptotic glioblastoma cells, including 5563 E–E, 4108 E–P, and 993 P–P (Figure 5A,B). And 15595 lost loops were identified in ferroptotic glioblastoma cells, including 10404 E–E, 4461 E–P, and 730 P–P (Figure 5A,B). In addition, more long-range (>20 kb) chromatin interaction loops were gained or lost in ferroptotic glioblastoma cells (Figure 5C,D), suggesting a significant change of long-range enhancer connectome in ferroptosis.
Combination analysis of RNA-seq and HiChIP data identified 162 genes that are significantly upregulated (log2FC > 1; padj < 0.05) in ferroptotic U87MG glioblastoma cells and have gained H3K27ac HiChIP interaction loops (interaction counts ≥ 5) compared to control (Figure 5E). GO analysis of these genes reveals that positive regulation of interleukin-17 production, intrinsic apoptotic signaling pathway in response to DNA damage by p53 class mediator-related biological processes were enriched (Figure 5F), which is associated with ferroptosis [28,29]. At the same time, 302 genes that were significantly downregulated (log2FC ≤ −1; padj < 0.05) in ferroptotic U87MG glioblastoma cells lost interaction loops (interaction counts ≥ 5) at their loci compared to control (Figure 5G). GO analysis of these downregulated genes showed cell proliferation-associated processes were enriched, like mitotic sister chromatid segregation, mitotic cell cycle, and cell division (Figure 5H). These data suggest transcriptome change in ferroptotic glioblastoma cells is associated with changes in 3D chromatin structures.
The genes that were significantly upregulated in Erastin (10 μM, 72 h)-treated U87MG cells and gained chromatin loops at their respective loci can be ranked by the padj value of the transcription fold change; among these, HDM2 and TXNRD1 emerged as the top two genes. Western blot was performed to validate the expression levels of HDM2 and TXNRD1 in control and U87MG glioblastoma cells that were treated with 10 μM Erastin for 72 h (Figure S2). HDM2 is a negative regulator of tumor suppressor p53 and binds to MDMX to facilitate ferroptosis in cells [30]. HiChIP data showed a new chromatin loop at HDM2 locus in Erastin (10 μM, 72 h)-treated U87MG cells, and RNA-seq data showed that HDM2 is significantly upregulated (log2FC = 2.44, padj = 2.91 × 10−239) in Erastin (10 μM, 72 h)-treated U87MG cells, suggesting function of the gained chromatin loop in regulation of HDM2 (Figure 5E and Figure 6A). TXNRD1 encodes thioredoxin reductase 1, which regulates cellular redox homeostasis [31]. TXNRD1 was reported to function in regulating the ferroptosis of liver cancer and chronic myeloid leukemia cells [32,33]. HiChIP data showed a chromatin loop that links a distal enhancer and promoter of TXNRD1 was strengthened in Erastin (10 μM, 72 h)-treated U87MG cells (Figure 6B), and a new chromatin loop that links an enhancer and promoter of TXNRD1 was identified in Erastin (10 μM, 72 h)-treated U87MG cells (Figure 6B). In addition, TXNRD1 was upregulated (log2FC = 2.04, padj = 1.26 × 10−216) compared to control (Figure 5E), which indicated that the gained chromatin loop is related to an increase of TXNRD1 expression. In addition, the genes that were significantly downregulated in Erastin (10 μM, 72 h)-treated U87MG cells and lost chromatin loops at their respective loci can be ranked by the padj value of the transcription fold change; among these, MKI67 and TOP2A emerged as the top two genes. MKI67 is a marker of cell proliferation that encodes the nuclear protein Ki67 [34]. HiChIP data showed that MKI67 locus lost two loops that link the MKI67 promoter and two distal enhancers in Erastin (10 μM, 72 h)-treated U87MG cells, and RNA-seq data showed that MKI67 is significantly downregulated (log2FC = −3.89, padj = 0) in Erastin (10 μM, 72 h)-treated U87MG cells (Figure 5G and Figure 6C). TOP2A encodes a nuclear enzyme that resolves entanglements and relieves the torsional stress of DNA double strands [35]. TOP2A is related to the cell cycle in embryonic stem cells [36]. A chromatin loop that links the TOP2A promoter and a distal enhancer was lost in Erastin (10 μM, 72 h)-treated U87MG cells, and another chromatin loop that links the distal enhancer and promoter of TOP2A was weakened (Figure 6D). TOP2A is also significantly downregulated (log2FC = −3.31, padj = 0) in Erastin-treated U87MG cells (Figure 5G). These data suggest the association of loss of chromatin loops and downregulation of MKI67 and TOP2A expressions.

3. Discussion

The 3D structure of chromatin is reported to play important roles in cell cycle, transcriptional activation, DNA replication, and cell differentiation [37,38,39]. Abnormal 3D chromatin structures and chromatin interactions were found in tumor cells and were reported to be related to cancer progression and other diseases [15,40,41]. Previous studies have shown that CTCF-s activates the expression of IFI6 by disrupting the 3D spatial conformation of classical CTCF in the IFI6 region and promoting the interaction between a distal enhancer and the promoter of IFI6, leading to apoptosis of HeLa-S3 cells [42]. Recently, several studies have reported that ferroptosis functions in cancer progression and treatment; however, the 3D gene regulation network in ferroptotic cancer cells that mediated by higher-order chromatin structures is not clear. Here in this study, H3K27ac HiChIP was performed and indicated a global change of enhancer-related 3D chromatin structures in ferroptotic glioblastoma cells and revealed that long-range chromatin loops were significantly alternated in ferroptosis. One hundred sixty-two genes that were significantly upregulated in ferroptotic glioblastoma cells correspond to the gain of chromatin loops at their respective loci, and 302 genes that were significantly downregulated in ferroptotic glioblastoma cells correspond to the loss of chromatin loops at their respective loci. These genes include genes that were reported to function in ferroptosis, like HDM2 and TXNRD1 (Figure 7). Data in this study suggest a new mechanism by which the change in the 3D chromatin structure in ferroptosis regulates gene expression and functions in glioblastoma cell ferroptosis.
This study focused on enhancer connectome that was induced by 3D chromatin structures. Enhancer–enhancer interactions were important to the regulation of gene expression in biological processes and diseases [43,44]. It has been shown that enhancer interactions in the short distance can ensure high expression of genes through the additive effects [45], and enhancer interactions over the long distance confer functional robustness of gene expression [46]. Recent studies showed that some enhancer interactions can form enhancer hubs, which are connected with key gene promoters and contribute to gene expression in Type 2 diabetes [47]. We noticed 5563 gained enhancer–enhancer interactions in ferroptotic glioblastoma cells (Figure 5A). These new E–E interactions may form enhancer hubs or important regulatory domains and regulate ferroptosis-related genes.
HDM2 is one of the target genes in the 3D gene regulation network. HDM2 binds to p53 and forms a complex to prevent p53 transcriptional activation. On the other hand, HDM2 is also an E3 ubiquitination ligase, which leads to the degradation of p53 through ubiquitination [48,49]. The HDM2-p53 hub is regulated by different cellular stress signals, and HDM2 is highly expressed in many types of tumors and is closely related to the proliferation, invasion, apoptosis, and chemotherapy resistance of tumor cells [50,51,52,53,54,55]. Prior studies have shown that HDM2 and MDMX antagonists combined with TMZ have better antitumor activity in experimental animals [56]. In addition, HDM2 was also reported to function in promoting tumor progression in a p53-dependent pathway in glioma cells [48,57,58]. There have been studies showing that HDM2, and likely the HDM2–MDMX complex, are able to increase the sensitivity of glioblastoma cells to ferroptosis [30]. HDM2 antagonist MEL23 can inhibit RSL3-induced cell death in the cells with high expression of HDM2 but cannot change the sensitivity of the cells with normal expression of HDM2 to ferroptosis or inhibit RSL3-induced cell death [30]. The function of HDM2 in glioma ferroptosis is related to the E3 ligase activity of the HDM2–MDMX complex. HDM2 and MDMX form complex and regulate lipids by altering the activity of PPARα, which may be a downstream target of E3 ligase activity of HDM2 [30]. Similar mechanisms may also exist in glioblastoma ferroptosis. In our study, HiChIP and RNA-seq results showed that the HDM2 promoter interacts with an enhancer by a new chromatin loop induced by glioblastoma ferroptosis (Figure 6A), and the expression of HDM2 is upregulated (Figure 5E), which suggests that change of chromatin loops induced change of HDM2 expression and then affected glioblastoma ferroptosis. In addition to HDM2, TXNRD1 is another target gene in the 3D gene regulation network; it is an important enzyme with extensive reducing activity in the thioredoxin system [59]. TXNRD1 is highly expressed in many tumors and is associated with the poor prognosis of tumors [60,61,62,63]. Our results showed that in ferroptotic glioblastoma cells, new enhancer–promoter loops might induce upregulation of TXNRD1 (Figure 5E and Figure 6B). However, previous studies have shown that the downregulation of TXNRD1 can promote the production of reactive oxygen species, thereby promoting ferroptosis in tumor cells [64]. We reckon that some rescue pathways may simultaneously work in ferroptotic glioblastoma cells, or complex functions of TXNRD1 in the regulation of ferroptosis work in different kinds of cells or at different cell stages.
Ferroptotic cell death is characterized by the accumulation of reactive oxygen species in cells and increased oxidative stress [65], and excessive reactive oxygen species in cells can affect many cell physiological processes, including cell cycle arrest, cell proliferation inhibition, and apoptosis [66,67,68,69]. Several studies have indicated that MKI67 and TOP2A are important genes involved in cell proliferation and cell cycle regulation [70,71,72,73]. HiChIP data in our study indicated attenuated interactions between promoters of MKI67 and TOP2A and enhancers (Figure 6C,D), and RNA-seq data showed downregulation of these two genes (Figure 5G). Downregulation of MKI67 and TOP2A is related to the decrease of cell proliferation [35,73,74,75], which is consistent with the phenotype of ferroptosis. Recent studies show that MKI67 and TOP2A were contained within a network of genes that are upregulated in NK-cell repertoires in patients with neutropenia, which is associated with apoptosis and cell cycle [71]. Though ferroptosis is mechanistically and morphologically different from apoptosis [76], genes known to be involved in apoptosis could also function in ferroptosis, such as TP53 [77,78]. However, the underlying mechanism of MKI67 and TOP2A involved in ferroptosis is currently not well known. It is not clear whether the downregulation of MKI67 and TOP2A are just induced by increased oxidative stress in ferroptotic glioblastoma cells or whether these two genes also take part in the regulation of ferroptosis. Though bioinformatic analyses suggest that TOP2A may be associated with ferroptosis [79,80], further studies are needed to figure out the whole gene regulation network that contains MKI67 and TOP2A in glioblastoma ferroptosis.
Prior studies reported that in p53 wild-type GBM cell line U87MG and p53-mutated GBM cell line U251, P62 plays a dual role in glioma ferroptosis [81], suggestive of different function mechanisms of ferroptosis due to the heterogeneity of glioma cells. In addition, previous studies reported that T98G cells were extremely responsive to Erastin, while U251MG was more resistant to ferroptosis [82]. These studies suggest that the mechanism of ferroptosis may vary in different cell lines. Our study reveals one of the regulation mechanisms in glioblastoma ferroptosis. Further studies are needed to investigate the function of 3D chromatin structures in ferroptosis in view of the heterogeneity of glioma cells.
Temozolomide (TMZ) is a first-line treatment drug for glioma, and a prior study revealed that TMZ inhibits glioma cell growth by inducing ferroptosis by regulating the expression of DMT1 [83], which indicates that the regulation of ferroptosis may affect the drug sensitivity of glioma cells. A recent study designed a nanoscale antibody vector, S-biAb/dEGCG@NPs, which effectively cleared GBM cells in mice by enhancing the effects of ferroptosis and enhancing immune checkpoint blocking (ICB) immunotherapy [84]. A nanodrug, Au (I)-based NIR-II ferrotoxin nanoparticles (TBTP Au NPs), was reported to induce ferroptosis of glioma cells and prolong the survival time of glioma-bearing mice [85]. In addition, ferroptosis was also reported to play an important role in the radiotherapy of glioma [86,87]. Ferroptosis is reported to be associated with various ions [88,89]. Studies of ion metabolism in ferroptosis indicate that ion channels may be a new therapeutic target in glioma [88,89,90,91]. These studies suggest targeting ferroptosis could be an alternative method to improve the poor clinical prognosis of glioma treatment. Our study reveals a new mechanism by which the 3D chromatin structure regulates gene expression in glioblastoma ferroptosis. Thus, specific enhancers or enhancer–promoter interactions may be new therapeutic targets in glioblastoma treatment. Curaxins were reported to target specific 3D chromatin structures in tumors and exert antitumor effects, which indicates the important significance of exploring drug targets based on the 3D structure of chromatin [92,93]. The technology of modification of 3D chromatin structures has been reported [94,95,96], which suggests targeting specific 3D chromatin structures or regulation elements to affect glioblastoma cell ferroptosis could be an alternative method to treat glioblastoma. The findings in this study are helpful in further exploring the mechanism of glioblastoma ferroptosis and discovering new therapeutic targets to treat glioblastoma.

4. Materials and Methods

4.1. Cell Culture

The glioblastoma cell line U87MG was obtained from the National Infrastructure of Cell Line Resource (Beijing, China). Glioblastoma cells were incubated at 37 °C in 90% humidity and 5% CO2 and cultured in DMEM (GIBCO), supplemented with 10% fetal bovine serum (BI) and 1% penicillin/streptomycin (GIBCO).

4.2. MTS Assay

Cell viability was measured using the MTS Assay Kit (Promega, Madison, WI, USA). Briefly, cells were cultured in 96-well plates at a density of 1500 cells/well in a growth medium for 12 h. Cells were subsequently incubated with ferroptosis-inducing compounds Erastin (MCE) at the indicated concentrations in a growth medium for an additional 24 h, 48 h, 72 h, and 96 h. In total, 20 μL (per 100 μL medium) of MTS reagent was added to each well, and absorbance was measured at 490 nm using a microplate reader.

4.3. Lipid Peroxidation Assay

The activity level of MDA was assayed following the protocol of the Lipid Peroxidation MDA Assay Kit (Beyotime, Shanghai, China). A total of 200 μL MDA working solution was added to 100 μL of supernatant. The mixture was heated to 100 °C for 15 min. After cooling to room temperature, the mixture was centrifuged at 1000× g for 10 min, and 200 μL of supernatant was detected at 532 nm by a microplate reader.

4.4. Glutathione and Iron Assay

The intracellular concentration of total GSH was assessed using a GSH Assay Kit (Beyotime, Shanghai, China) according to the manufacturer’s instructions. The content of iron in glioblastoma cells was measured using a Cell Ferrous Iron Colorimetric Assay Kit (Elabscience, Hubei, China) according to the manufacturer’s instructions.

4.5. Western Blot

Western blot was performed as previously described [97]. DMSO (control) and Erastin (10 μM, 72 h)-treated U87MG cells were collected and then lysed using RIPA lysis buffer (Solarbio, Beijing, China) with a 1× protease inhibitor cocktail (Sigma Aldrich, St. Louis, MO, USA). Protein concentration was measured using an Enhanced BCA Protein Assay Kit (Beyotime, Shanghai, China) according to manufacturing protocols. The samples were resolved by SDS-PAGE and then transferred to polyvinylidene difluoride (PVDF) membranes (Millipore). The primary antibodies were used as follows: HDM2 (MB67065), TXNRD1 (MB65551) from Bioworld, and β-actin (30101ES50) from YEASEN, and HRP-linked secondary antibodies (sc-516102) from Santa Cruz Biotechnology. Bands were detected by the ImageQuant LAS 4000 system with an enhanced chemiluminescence kit (Thermo Scientific Pierce, Waltham, MA, USA).

4.6. RNA-Seq

Total RNA was extracted from Erastin-induced glioblastoma cells and control cells using TRIzol according to the manufacturer’s protocol. RNA was sequenced by the Novogene. Clean reads were mapped to the Ensemble hg38 human genome using Hisat2 with default parameters. The number of reads mapped to genes was determined with htseq-count [98]. DEGs between treatment and control samples were identified with DEseq2. Genes were considered significantly altered with ∣log2 FC∣≥ 1 and padj < 0.05. Gene ontology (GO) analysis was carried out using the online tool DAVID (https://david.ncifcrf.gov/ accessed on 10 January 2023). GSEA analysis was performed using GSEA software version 4.3.2 [99].

4.7. ChIP-Seq

ChIP-seq assay was performed as previously described [100]. Cells were cross-linked with 1% formaldehyde at RT for 10 min and quenched in 125 mM glycine for 5 min. Cells were resuspended in SDS lysis buffer for 5 min and sonicated to generate DNA fragments averaging 100–500 bp in length. After centrifugation, chromatin fragments were immunoprecipitated with antibodies overnight (H3K27ac, H3K4me1, Abcam, Boston, MA, USA). The precipitated DNA and input DNA were purified and then sequenced. Bowtie2 was used to map ChIP-seq raw reads to the hg38 human reference genome. The MACS2 program was used to call peaks of ChIP-seq data with the corresponding input data as control with default parameters [101,102,103].

4.8. HiChIP

HiChIP was performed as previously described [10] using an antibody against H3K27ac (Abcam). Briefly, 1 × 10⁷ cells were cross-linked, and chromatin was digested using MboI restriction enzyme (NEB). Then, biotin-14-dATP was used to fill in the restriction fragment overhangs and mark the DNA ends. After ligation and sonication, the genomic DNA was incubated with H3K27ac antibody at 4 °C overnight. Immunocomplexes were captured by protein A magnetic beads. The beads were subsequently washed three times with low salt wash buffer, high salt wash buffer, and LiCl wash buffer. DNA was eluted with ddH2O and purified with AMPure XP Beads (Beckman Coulter Genetics, Danvers, MA, USA). Biotinylated DNA beads were captured by Streptavidin C-1. QIAseq FX DNA Library Kits (QIAGEN, Hilden, Germany) was used to generate the sequencing library according to the manufacturer’s protocol. The libraries were validated for size distribution of 300–700 bp using AMPure XP beads (Beckman Coulter Genetics, Danvers, MA, USA). The DNA was subjected to 2 × 150 bp paired-end sequencing. The respective paired-end reads were aligned to the hg38 genome by the HiC-Pro pipeline [104]. Default settings were used for the removal of duplicated reads, assignment to MboI restriction fragments, and filtering for valid interactions. For each cell type, we merged the valid read pairs of individual samples. Hichipper was applied to call loops with default parameters [105]. Reads between samples were normalized to the total number of valid reads. Loops with FDR < 0.05 and supported by at least 5 paired-end tags (PETS) were kept for further analysis. HiC-Pro was used to generate the HiChIP interaction maps [104]. HiChIP interaction maps were then visualized by JuicerBox software version 1.11.08 [106] at 50, 10, and 5 kb resolution as indicated.

4.9. Statistical Analyses

Data were analyzed by Student’s t-test. ** p < 0.01, *** p < 0.001.

5. Conclusions

In summary, our study shows a new mechanism of ferroptosis that enhancers regulate glioblastoma ferroptosis by 3D chromatin structure-mediated gene regulation networks.

Supplementary Materials

The following supporting information can be downloaded at: https://www.mdpi.com/article/10.3390/ijms241914945/s1.

Author Contributions

M.L.: Conceptualization, Methodology, Formal analysis, Validation, Investigation, Resources, Data curation, Writing—Original draft, Supervision, Writing—Review and editing, Visualization, Project administration; W.W.: Conceptualization, Methodology, Software, Formal analysis, Validation, Data curation, Writing—Review and editing, Visualization; H.Z.: Formal analysis, Data curation, Writing—Review and editing, Visualization; J.B.: Investigation, Resources; B.Z.: Investigation, Resources; T.S.: Investigation, Resources; G.S.: Investigation, Resources; Y.Z.: Investigation, Resources; S.F.: Investigation, Resources; X.H.: Investigation, Resources; B.C.: Investigation, Resources; Y.S.: Investigation, Resources; Z.Z.: Investigation, Resources; J.S.: Investigation, Resources; P.L.: Investigation, Resources; W.L.: Conceptualization, Formal analysis, Validation, Supervision, Writing—Original draft, Writing—Review and editing, Project administration, Funding acquisition; L.Z.: Conceptualization, Formal analysis, Validation, Supervision, Writing—Original draft, Writing—Review and Editing, Project administration, Funding acquisition. All authors have read and agreed to the published version of the manuscript.

Funding

This work was supported by the National Natural Science Foundation of China (Grant No. 32170598, 32130018); the National Key R&D Program of China (Grant No. 2020YFA803700); the Natural Science Foundation of Tianjin City of China (Grant No. 22JCYBJC00600, 20JCYBJC01070).

Institutional Review Board Statement

Not applicable.

Informed Consent Statement

Not applicable.

Data Availability Statement

RNA-seq and DNA-seq raw data used in this study have been deposited in the NCBI Gene Expression Omnibus (GEO) under accession number GSE236253.

Acknowledgments

We thank all members of our laboratory for many helpful discussions.

Conflicts of Interest

The authors declare no conflict of interest.

References

  1. Weller, M.; Wick, W.; Aldape, K.; Brada, M.; Berger, M.; Pfister, S.M.; Nishikawa, R.; Rosenthal, M.; Wen, P.Y.; Stupp, R.; et al. Glioma. Nat. Rev. Dis. Primers 2015, 1, 15017. [Google Scholar] [CrossRef] [PubMed]
  2. Koneru, T.; McCord, E.; Pawar, S.; Tatiparti, K.; Sau, S.; Iyer, A.K. Transferrin: Biology and Use in Receptor-Targeted Nanotherapy of Gliomas. ACS Omega 2021, 6, 8727–8733. [Google Scholar] [CrossRef]
  3. Reifenberger, G.; Wirsching, H.G.; Knobbe-Thomsen, C.B.; Weller, M. Advances in the molecular genetics of gliomas—Implications for classification and therapy. Nat. Rev. Clin. Oncol. 2017, 14, 434–452. [Google Scholar] [CrossRef]
  4. Dixon, S.J.; Lemberg, K.M.; Lamprecht, M.R.; Skouta, R.; Zaitsev, E.M.; Gleason, C.E.; Patel, D.N.; Bauer, A.J.; Cantley, A.M.; Yang, W.S.; et al. Ferroptosis: An iron-dependent form of nonapoptotic cell death. Cell 2012, 149, 1060–1072. [Google Scholar] [CrossRef] [PubMed]
  5. Chen, X.; Kang, R.; Kroemer, G.; Tang, D. Broadening horizons: The role of ferroptosis in cancer. Nat. Rev. Clin. Oncol. 2021, 18, 280–296. [Google Scholar] [CrossRef] [PubMed]
  6. Hassannia, B.; Vandenabeele, P.; Vanden Berghe, T. Targeting Ferroptosis to Iron Out Cancer. Cancer Cell 2019, 35, 830–849. [Google Scholar] [CrossRef]
  7. Mitre, A.O.; Florian, A.I.; Buruiana, A.; Boer, A.; Moldovan, I.; Soritau, O.; Florian, S.I.; Susman, S. Ferroptosis Involvement in Glioblastoma Treatment. Medicina 2022, 58, 319. [Google Scholar] [CrossRef]
  8. Belaghzal, H.; Dekker, J.; Gibcus, J.H. Hi-C 2.0: An optimized Hi-C procedure for high-resolution genome-wide mapping of chromosome conformation. Methods 2017, 123, 56–65. [Google Scholar] [CrossRef]
  9. Dekker, J.; Rippe, K.; Dekker, M.; Kleckner, N. Capturing chromosome conformation. Science 2002, 295, 1306–1311. [Google Scholar] [CrossRef]
  10. Mumbach, M.R.; Rubin, A.J.; Flynn, R.A.; Dai, C.; Khavari, P.A.; Greenleaf, W.J.; Chang, H.Y. HiChIP: Efficient and sensitive analysis of protein-directed genome architecture. Nat. Methods 2016, 13, 919–922. [Google Scholar] [CrossRef]
  11. Flavahan, W.A.; Drier, Y.; Liau, B.B.; Gillespie, S.M.; Venteicher, A.S.; Stemmer-Rachamimov, A.O.; Suvà, M.L.; Bernstein, B.E. Insulator dysfunction and oncogene activation in IDH mutant gliomas. Nature 2016, 529, 110–114. [Google Scholar] [CrossRef]
  12. Ahn, J.H.; Davis, E.S.; Daugird, T.A.; Zhao, S.; Quiroga, I.Y.; Uryu, H.; Li, J.; Storey, A.J.; Tsai, Y.H.; Keeley, D.P.; et al. Phase separation drives aberrant chromatin looping and cancer development. Nature 2021, 595, 591–595. [Google Scholar] [CrossRef] [PubMed]
  13. Xu, Z.; Lee, D.S.; Chandran, S.; Le, V.T.; Bump, R.; Yasis, J.; Dallarda, S.; Marcotte, S.; Clock, B.; Haghani, N.; et al. Structural variants drive context-dependent oncogene activation in cancer. Nature 2022, 612, 564–572. [Google Scholar] [CrossRef] [PubMed]
  14. Du, Y.; Gu, Z.; Li, Z.; Yuan, Z.; Zhao, Y.; Zheng, X.; Bo, X.; Chen, H.; Wang, C. Dynamic Interplay between Structural Variations and 3D Genome Organization in Pancreatic Cancer. Adv. Sci. 2022, 9, e2200818. [Google Scholar] [CrossRef]
  15. Debruyne, D.N.; Dries, R.; Sengupta, S.; Seruggia, D.; Gao, Y.; Sharma, B.; Huang, H.; Moreau, L.; McLane, M.; Day, D.S.; et al. BORIS promotes chromatin regulatory interactions in treatment-resistant cancer cells. Nature 2019, 572, 676–680. [Google Scholar] [CrossRef] [PubMed]
  16. Deng, S.; Feng, Y.; Pauklin, S. 3D chromatin architecture and transcription regulation in cancer. J. Hematol. Oncol. 2022, 15, 49. [Google Scholar] [CrossRef] [PubMed]
  17. Costa, I.; Barbosa, D.J.; Benfeito, S.; Silva, V.; Chavarria, D.; Borges, F.; Remião, F.; Silva, R. Molecular mechanisms of ferroptosis and their involvement in brain diseases. Pharmacol. Ther. 2023, 244, 108373. [Google Scholar] [CrossRef]
  18. Creyghton, M.P.; Cheng, A.W.; Welstead, G.G.; Kooistra, T.; Carey, B.W.; Steine, E.J.; Hanna, J.; Lodato, M.A.; Frampton, G.M.; Sharp, P.A.; et al. Histone H3K27ac separates active from poised enhancers and predicts developmental state. Proc. Natl. Acad. Sci. USA 2010, 107, 21931–21936. [Google Scholar] [CrossRef]
  19. Bogdanovic, O.; Fernandez-Miñán, A.; Tena, J.J.; de la Calle-Mustienes, E.; Hidalgo, C.; van Kruysbergen, I.; van Heeringen, S.J.; Veenstra, G.J.; Gómez-Skarmeta, J.L. Dynamics of enhancer chromatin signatures mark the transition from pluripotency to cell specification during embryogenesis. Genome Res. 2012, 22, 2043–2053. [Google Scholar] [CrossRef]
  20. Chen, X.; Song, X.; Li, J.; Zhang, R.; Yu, C.; Zhou, Z.; Liu, J.; Liao, S.; Klionsky, D.J.; Kroemer, G.; et al. Identification of HPCAL1 as a specific autophagy receptor involved in ferroptosis. Autophagy 2023, 19, 54–74. [Google Scholar] [CrossRef]
  21. Li, J.; Liu, J.; Xu, Y.; Wu, R.; Chen, X.; Song, X.; Zeh, H.; Kang, R.; Klionsky, D.J.; Wang, X.; et al. Tumor heterogeneity in autophagy-dependent ferroptosis. Autophagy 2021, 17, 3361–3374. [Google Scholar] [CrossRef] [PubMed]
  22. Liu, Y.; Wu, D.; Fu, Q.; Hao, S.; Gu, Y.; Zhao, W.; Chen, S.; Sheng, F.; Xu, Y.; Chen, Z.; et al. CHAC1 as a Novel Contributor of Ferroptosis in Retinal Pigment Epithelial Cells with Oxidative Damage. Int. J. Mol. Sci. 2023, 24, 1582. [Google Scholar] [CrossRef] [PubMed]
  23. Li, J.Y.; Ren, C.; Wang, L.X.; Yao, R.Q.; Dong, N.; Wu, Y.; Tian, Y.P.; Yao, Y.M. Sestrin2 protects dendrite cells against ferroptosis induced by sepsis. Cell Death Dis. 2021, 12, 834. [Google Scholar] [CrossRef] [PubMed]
  24. Dang, X.; Huan, X.; Du, X.; Chen, X.; Bi, M.; Yan, C.; Jiao, Q.; Jiang, H. Correlation of Ferroptosis and Other Types of Cell Death in Neurodegenerative Diseases. Neurosci. Bull. 2022, 38, 938–952. [Google Scholar] [CrossRef]
  25. Gao, M.; Monian, P.; Pan, Q.; Zhang, W.; Xiang, J.; Jiang, X. Ferroptosis is an autophagic cell death process. Cell Res. 2016, 26, 1021–1032. [Google Scholar] [CrossRef]
  26. Hou, W.; Xie, Y.; Song, X.; Sun, X.; Lotze, M.T.; Zeh, H.J., 3rd; Kang, R.; Tang, D. Autophagy promotes ferroptosis by degradation of ferritin. Autophagy 2016, 12, 1425–1428. [Google Scholar] [CrossRef]
  27. Zhuo, S.; Chen, Z.; Yang, Y.; Zhang, J.; Tang, J.; Yang, K. Clinical and Biological Significances of a Ferroptosis-Related Gene Signature in Glioma. Front. Oncol. 2020, 10, 590861. [Google Scholar] [CrossRef]
  28. Guo, B.; Zuo, Z.; Di, X.; Huang, Y.; Gong, G.; Xu, B.; Wang, L.; Zhang, X.; Liang, Z.; Hou, Y.; et al. Salidroside attenuates HALI via IL-17A-mediated ferroptosis of alveolar epithelial cells by regulating Act1-TRAF6-p38 MAPK pathway. Cell Commun. Signal. CCS 2022, 20, 183. [Google Scholar] [CrossRef]
  29. Panatta, E.; Zampieri, C.; Melino, G.; Amelio, I. Understanding p53 tumour suppressor network. Biol. Direct 2021, 16, 14. [Google Scholar] [CrossRef]
  30. Venkatesh, D.; O'Brien, N.A.; Zandkarimi, F.; Tong, D.R.; Stokes, M.E.; Dunn, D.E.; Kengmana, E.S.; Aron, A.T.; Klein, A.M.; Csuka, J.M.; et al. MDM2 and MDMX promote ferroptosis by PPARα-mediated lipid remodeling. Genes Dev. 2020, 34, 526–543. [Google Scholar] [CrossRef]
  31. Nguyen, P.; Awwad, R.T.; Smart, D.D.; Spitz, D.R.; Gius, D. Thioredoxin reductase as a novel molecular target for cancer therapy. Cancer Lett. 2006, 236, 164–174. [Google Scholar] [CrossRef] [PubMed]
  32. Yang, L.; Wang, H.; Yang, X.; Wu, Q.; An, P.; Jin, X.; Liu, W.; Huang, X.; Li, Y.; Yan, S.; et al. Auranofin mitigates systemic iron overload and induces ferroptosis via distinct mechanisms. Signal Transduct. Target. Ther. 2020, 5, 138. [Google Scholar] [CrossRef] [PubMed]
  33. Liu, S.; Wu, W.; Chen, Q.; Zheng, Z.; Jiang, X.; Xue, Y.; Lin, D. TXNRD1: A Key Regulator Involved in the Ferroptosis of CML Cells Induced by Cysteine Depletion In Vitro. Oxidative Med. Cell. Longev. 2021, 2021, 7674565. [Google Scholar] [CrossRef] [PubMed]
  34. Chen, X.; Zhang, M.; Gan, H.; Wang, H.; Lee, J.H.; Fang, D.; Kitange, G.J.; He, L.; Hu, Z.; Parney, I.F.; et al. A novel enhancer regulates MGMT expression and promotes temozolomide resistance in glioblastoma. Nat. Commun. 2018, 9, 2949. [Google Scholar] [CrossRef] [PubMed]
  35. Qin, S.; Yuan, Y.; Huang, X.; Tan, Z.; Hu, X.; Liu, H.; Pu, Y.; Ding, Y.Q.; Su, Z.; He, C. Topoisomerase IIA in adult NSCs regulates SVZ neurogenesis by transcriptional activation of Usp37. Nucleic Acids Res. 2022, 50, 9319–9338. [Google Scholar] [CrossRef]
  36. Thakurela, S.; Garding, A.; Jung, J.; Schübeler, D.; Burger, L.; Tiwari, V.K. Gene regulation and priming by topoisomerase IIα in embryonic stem cells. Nat. Commun. 2013, 4, 2478. [Google Scholar] [CrossRef]
  37. Zhang, Y.W.; Wang, M.B.; Li, S.C. SuperTAD: Robust detection of hierarchical topologically associated domains with optimized structural information. Genome Biol. 2021, 22, 45. [Google Scholar] [CrossRef]
  38. Li, L.X.; Zhou, J.X.; Wang, X.; Zhang, H.; Harris, P.C.; Calvet, J.P.; Li, X. Cross-talk between CDK4/6 and SMYD2 regulates gene transcription, tubulin methylation, and ciliogenesis. Sci. Adv. 2020, 6, eabb3154. [Google Scholar] [CrossRef]
  39. Wang, H.; Yang, J.; Zhang, Y.; Qian, J.; Wang, J. Reconstruct high-resolution 3D genome structures for diverse cell-types using FLAMINGO. Nat. Commun. 2022, 13, 2645. [Google Scholar] [CrossRef]
  40. Qian, Y.; Zhang, L.; Cai, M.; Li, H.; Xu, H.; Yang, H.; Zhao, Z.; Rhie, S.K.; Farnham, P.J.; Shi, J.; et al. The prostate cancer risk variant rs55958994 regulates multiple gene expression through extreme long-range chromatin interaction to control tumor progression. Sci. Adv. 2019, 5, eaaw6710. [Google Scholar] [CrossRef]
  41. Feng, Y.; Cai, L.; Hong, W.; Zhang, C.; Tan, N.; Wang, M.; Wang, C.; Liu, F.; Wang, X.; Ma, J.; et al. Rewiring of 3D Chromatin Topology Orchestrates Transcriptional Reprogramming and the Development of Human Dilated Cardiomyopathy. Circulation 2022, 145, 1663–1683. [Google Scholar] [CrossRef] [PubMed]
  42. Li, J.; Huang, K.; Hu, G.; Babarinde, I.A.; Li, Y.; Dong, X.; Chen, Y.S.; Shang, L.; Guo, W.; Wang, J.; et al. An alternative CTCF isoform antagonizes canonical CTCF occupancy and changes chromatin architecture to promote apoptosis. Nat. Commun. 2019, 10, 1535. [Google Scholar] [CrossRef] [PubMed]
  43. Lin, C.Y.; Erkek, S.; Tong, Y.; Yin, L.; Federation, A.J.; Zapatka, M.; Haldipur, P.; Kawauchi, D.; Risch, T.; Warnatz, H.J.; et al. Active medulloblastoma enhancers reveal subgroup-specific cellular origins. Nature 2016, 530, 57–62. [Google Scholar] [CrossRef] [PubMed]
  44. Ing-Simmons, E.; Seitan, V.C.; Faure, A.J.; Flicek, P.; Carroll, T.; Dekker, J.; Fisher, A.G.; Lenhard, B.; Merkenschlager, M. Spatial enhancer clustering and regulation of enhancer-proximal genes by cohesin. Genome Res. 2015, 25, 504–513. [Google Scholar] [CrossRef]
  45. Bahr, C.; von Paleske, L.; Uslu, V.V.; Remeseiro, S.; Takayama, N.; Ng, S.W.; Murison, A.; Langenfeld, K.; Petretich, M.; Scognamiglio, R.; et al. A Myc enhancer cluster regulates normal and leukaemic haematopoietic stem cell hierarchies. Nature 2018, 553, 515–520. [Google Scholar] [CrossRef] [PubMed]
  46. Lin, X.; Liu, Y.; Liu, S.; Zhu, X.; Wu, L.; Zhu, Y.; Zhao, D.; Xu, X.; Chemparathy, A.; Wang, H.; et al. Nested epistasis enhancer networks for robust genome regulation. Science 2022, 377, 1077–1085. [Google Scholar] [CrossRef]
  47. Miguel-Escalada, I.; Bonàs-Guarch, S.; Cebola, I.; Ponsa-Cobas, J.; Mendieta-Esteban, J.; Atla, G.; Javierre, B.M.; Rolando, D.M.Y.; Farabella, I.; Morgan, C.C.; et al. Human pancreatic islet three-dimensional chromatin architecture provides insights into the genetics of type 2 diabetes. Nat. Genet. 2019, 51, 1137–1148. [Google Scholar] [CrossRef]
  48. Lou, J.; Hao, Y.; Lin, K.; Lyu, Y.; Chen, M.; Wang, H.; Zou, D.; Jiang, X.; Wang, R.; Jin, D.; et al. Circular RNA CDR1as disrupts the p53/MDM2 complex to inhibit Gliomagenesis. Mol. Cancer 2020, 19, 138. [Google Scholar] [CrossRef]
  49. Levine, A.J. p53: 800 million years of evolution and 40 years of discovery. Nat. Rev. Cancer 2020, 20, 471–480. [Google Scholar] [CrossRef]
  50. Rayburn, E.R.; Ezell, S.J.; Zhang, R. Recent advances in validating MDM2 as a cancer target. Anti-Cancer Agents Med. Chem. 2009, 9, 882–903. [Google Scholar] [CrossRef]
  51. Rayburn, E.; Zhang, R.; He, J.; Wang, H. MDM2 and human malignancies: Expression, clinical pathology, prognostic markers, and implications for chemotherapy. Curr. Cancer Drug Targets 2005, 5, 27–41. [Google Scholar] [CrossRef] [PubMed]
  52. Karni-Schmidt, O.; Lokshin, M.; Prives, C. The Roles of MDM2 and MDMX in Cancer. Annu. Rev. Pathol. 2016, 11, 617–644. [Google Scholar] [CrossRef]
  53. Wade, M.; Li, Y.C.; Wahl, G.M. MDM2, MDMX and p53 in oncogenesis and cancer therapy. Nat. Rev. Cancer 2013, 13, 83–96. [Google Scholar] [CrossRef] [PubMed]
  54. Bohlman, S.; Manfredi, J.J. p53-independent effects of Mdm2. Sub-Cell. Biochem. 2014, 85, 235–246. [Google Scholar] [CrossRef]
  55. Nag, S.; Qin, J.; Srivenugopal, K.S.; Wang, M.; Zhang, R. The MDM2-p53 pathway revisited. J. Biomed. Res. 2013, 27, 254–271. [Google Scholar] [CrossRef]
  56. Chen, X.; Tai, L.; Gao, J.; Qian, J.; Zhang, M.; Li, B.; Xie, C.; Lu, L.; Lu, W.; Lu, W. A stapled peptide antagonist of MDM2 carried by polymeric micelles sensitizes glioblastoma to temozolomide treatment through p53 activation. J. Control. Release Off. J. Control. Release Soc. 2015, 218, 29–35. [Google Scholar] [CrossRef]
  57. Shi, C.; Rao, C.; Sun, C.; Yu, L.; Zhou, X.; Hua, D.; Wang, R.; Luo, W.; Jiang, Z.; Zhou, J.; et al. miR-29s function as tumor suppressors in gliomas by targeting TRAF4 and predict patient prognosis. Cell Death Dis. 2018, 9, 1078. [Google Scholar] [CrossRef]
  58. Jiang, Y.; Wang, Z.; Ying, C.; Hu, J.; Zeng, T.; Gao, L. FMR1/circCHAF1A/miR-211-5p/HOXC8 feedback loop regulates proliferation and tumorigenesis via MDM2-dependent p53 signaling in GSCs. Oncogene 2021, 40, 4094–4110. [Google Scholar] [CrossRef]
  59. Cheff, D.M.; Huang, C.; Scholzen, K.C.; Gencheva, R.; Ronzetti, M.H.; Cheng, Q.; Hall, M.D.; Arnér, E.S.J. The ferroptosis inducing compounds RSL3 and ML162 are not direct inhibitors of GPX4 but of TXNRD1. Redox Biol. 2023, 62, 102703. [Google Scholar] [CrossRef]
  60. Cadenas, C.; Franckenstein, D.; Schmidt, M.; Gehrmann, M.; Hermes, M.; Geppert, B.; Schormann, W.; Maccoux, L.J.; Schug, M.; Schumann, A.; et al. Role of thioredoxin reductase 1 and thioredoxin interacting protein in prognosis of breast cancer. Breast Cancer Res. BCR 2010, 12, R44. [Google Scholar] [CrossRef]
  61. Lincoln, D.T.; Ali Emadi, E.M.; Tonissen, K.F.; Clarke, F.M. The thioredoxin-thioredoxin reductase system: Over-expression in human cancer. Anticancer Res. 2003, 23, 2425–2433. [Google Scholar] [PubMed]
  62. Bhatia, M.; McGrath, K.L.; Di Trapani, G.; Charoentong, P.; Shah, F.; King, M.M.; Clarke, F.M.; Tonissen, K.F. The thioredoxin system in breast cancer cell invasion and migration. Redox Biol. 2016, 8, 68–78. [Google Scholar] [CrossRef]
  63. Leone, A.; Roca, M.S.; Ciardiello, C.; Costantini, S.; Budillon, A. Oxidative Stress Gene Expression Profile Correlates with Cancer Patient Poor Prognosis: Identification of Crucial Pathways Might Select Novel Therapeutic Approaches. Oxidative Med. Cell. Longev. 2017, 2017, 2597581. [Google Scholar] [CrossRef]
  64. Guo, W.; Wu, Z.; Chen, J.; Guo, S.; You, W.; Wang, S.; Ma, J.; Wang, H.; Wang, X.; Wang, H.; et al. Nanoparticle delivery of miR-21-3p sensitizes melanoma to anti-PD-1 immunotherapy by promoting ferroptosis. J. Immunother. Cancer 2022, 10, e004381. [Google Scholar] [CrossRef] [PubMed]
  65. Youssef, L.A.; Rebbaa, A.; Pampou, S.; Weisberg, S.P.; Stockwell, B.R.; Hod, E.A.; Spitalnik, S.L. Increased erythrophagocytosis induces ferroptosis in red pulp macrophages in a mouse model of transfusion. Blood 2018, 131, 2581–2593. [Google Scholar] [CrossRef] [PubMed]
  66. Koh, E.K.; Ryu, B.K.; Jeong, D.Y.; Bang, I.S.; Nam, M.H.; Chae, K.S. A 60-Hz sinusoidal magnetic field induces apoptosis of prostate cancer cells through reactive oxygen species. Int. J. Radiat. Biol. 2008, 84, 945–955. [Google Scholar] [CrossRef]
  67. Guachalla, L.M.; Rudolph, K.L. ROS induced DNA damage and checkpoint responses: Influences on aging? Cell Cycle 2010, 9, 4058–4060. [Google Scholar] [CrossRef]
  68. Ishikawa, K.; Takenaga, K.; Akimoto, M.; Koshikawa, N.; Yamaguchi, A.; Imanishi, H.; Nakada, K.; Honma, Y.; Hayashi, J. ROS-generating mitochondrial DNA mutations can regulate tumor cell metastasis. Science 2008, 320, 661–664. [Google Scholar] [CrossRef]
  69. He, L.; Lai, H.; Chen, T. Dual-function nanosystem for synergetic cancer chemo-/radiotherapy through ROS-mediated signaling pathways. Biomaterials 2015, 51, 30–42. [Google Scholar] [CrossRef]
  70. Chen, L.; Chou, C.L.; Knepper, M.A. Targeted Single-Cell RNA-seq Identifies Minority Cell Types of Kidney Distal Nephron. J. Am. Soc. Nephrol. 2021, 32, 886–896. [Google Scholar] [CrossRef]
  71. Sohlberg, E.; Pfefferle, A.; Heggernes Ask, E.; Tschan-Plessl, A.; Jacobs, B.; Netskar, H.; Lorenz, S.; Kanaya, M.; Kosugi-Kanaya, M.; Meinke, S.; et al. Perturbed NK-cell homeostasis associated with disease severity in chronic neutropenia. Blood 2022, 139, 704–716. [Google Scholar] [CrossRef] [PubMed]
  72. Lévy, P.; Vidaud, D.; Leroy, K.; Laurendeau, I.; Wechsler, J.; Bolasco, G.; Parfait, B.; Wolkenstein, P.; Vidaud, M.; Bièche, I. Molecular profiling of malignant peripheral nerve sheath tumors associated with neurofibromatosis type 1, based on large-scale real-time RT-PCR. Mol. Cancer 2004, 3, 20. [Google Scholar] [CrossRef] [PubMed]
  73. Pabla, S.; Conroy, J.M.; Nesline, M.K.; Glenn, S.T.; Papanicolau-Sengos, A.; Burgher, B.; Hagen, J.; Giamo, V.; Andreas, J.; Lenzo, F.L.; et al. Proliferative potential and resistance to immune checkpoint blockade in lung cancer patients. J. Immunother. Cancer 2019, 7, 27. [Google Scholar] [CrossRef] [PubMed]
  74. Zhou, H.; Gong, K.; Yang, Y.; Wu, Q.; Wang, Q.; Shen, Y.; Xie, L.; Gong, Y.; Liu, H.; Liu, J. MKI67 as a potential diagnostic biomarker in pulmonary hypertension. Front. Pediatr. 2022, 10, 1016889. [Google Scholar] [CrossRef] [PubMed]
  75. Hou, Y.Y.; Cao, W.W.; Li, L.; Li, S.P.; Liu, T.; Wan, H.Y.; Liu, M.; Li, X.; Tang, H. MicroRNA-519d targets MKi67 and suppresses cell growth in the hepatocellular carcinoma cell line QGY-7703. Cancer Lett. 2011, 307, 182–190. [Google Scholar] [CrossRef]
  76. Lei, G.; Zhuang, L.; Gan, B. Targeting ferroptosis as a vulnerability in cancer. Nat. Rev. Cancer 2022, 22, 381–396. [Google Scholar] [CrossRef]
  77. Jiang, L.; Kon, N.; Li, T.; Wang, S.J.; Su, T.; Hibshoosh, H.; Baer, R.; Gu, W. Ferroptosis as a p53-mediated activity during tumour suppression. Nature 2015, 520, 57–62. [Google Scholar] [CrossRef]
  78. Yu, Q. Restoring p53-mediated apoptosis in cancer cells: New opportunities for cancer therapy. Drug Resist. Updates Rev. Comment. Antimicrob. Anticancer Chemother. 2006, 9, 19–25. [Google Scholar] [CrossRef]
  79. Su, W.; Huang, B.; Zhang, Q.; Han, W.; An, L.; Guan, Y.; Ji, J.; Yu, D. Exploring Potential Biomarkers, Ferroptosis Mechanisms, and Therapeutic Targets Associated with Cutaneous Squamous Cell Carcinoma via Integrated Transcriptomic Analysis. J. Healthc. Eng. 2022, 2022, 3524022. [Google Scholar] [CrossRef]
  80. Li, C.; Cui, X.; Li, Y.; Guo, D.; He, S. Identification of ferroptosis and drug resistance related hub genes to predict the prognosis in Hepatocellular Carcinoma. Sci. Rep. 2023, 13, 8681. [Google Scholar] [CrossRef]
  81. Yuan, F.; Sun, Q.; Zhang, S.; Ye, L.; Xu, Y.; Deng, G.; Xu, Z.; Zhang, S.; Liu, B.; Chen, Q. The dual role of p62 in ferroptosis of glioblastoma according to p53 status. Cell Biosci. 2022, 12, 20. [Google Scholar] [CrossRef] [PubMed]
  82. de Souza, I.; Monteiro, L.K.S.; Guedes, C.B.; Silva, M.M.; Andrade-Tomaz, M.; Contieri, B.; Latancia, M.T.; Mendes, D.; Porchia, B.; Lazarini, M.; et al. High levels of NRF2 sensitize temozolomide-resistant glioblastoma cells to ferroptosis via ABCC1/MRP1 upregulation. Cell Death Dis. 2022, 13, 591. [Google Scholar] [CrossRef] [PubMed]
  83. Song, Q.; Peng, S.; Sun, Z.; Heng, X.; Zhu, X. Temozolomide Drives Ferroptosis via a DMT1-Dependent Pathway in Glioblastoma Cells. Yonsei Med. J. 2021, 62, 843–849. [Google Scholar] [CrossRef] [PubMed]
  84. Fan, R.; Chen, C.; Mu, M.; Chuan, D.; Liu, H.; Hou, H.; Huang, J.; Tong, A.; Guo, G.; Xu, J. Engineering MMP-2 Activated Nanoparticles Carrying B7-H3 Bispecific Antibodies for Ferroptosis-Enhanced Glioblastoma Immunotherapy. ACS Nano 2023, 17, 9126–9139. [Google Scholar] [CrossRef]
  85. Zhang, J.; Han, L.; Wu, H.; Zhong, Y.; Shangguan, P.; Liu, Y.; He, M.; Sun, H.; Song, C.; Wang, X.; et al. A Brain-Targeting NIR-II Ferroptosis System: Effective Visualization and Oncotherapy for Orthotopic Glioblastoma. Adv. Sci. 2023, 10, e2206333. [Google Scholar] [CrossRef]
  86. Lang, X.; Green, M.D.; Wang, W.; Yu, J.; Choi, J.E.; Jiang, L.; Liao, P.; Zhou, J.; Zhang, Q.; Dow, A.; et al. Radiotherapy and Immunotherapy Promote Tumoral Lipid Oxidation and Ferroptosis via Synergistic Repression of SLC7A11. Cancer Discov. 2019, 9, 1673–1685. [Google Scholar] [CrossRef]
  87. Lei, G.; Zhang, Y.; Koppula, P.; Liu, X.; Zhang, J.; Lin, S.H.; Ajani, J.A.; Xiao, Q.; Liao, Z.; Wang, H.; et al. The role of ferroptosis in ionizing radiation-induced cell death and tumor suppression. Cell Res. 2020, 30, 146–162. [Google Scholar] [CrossRef]
  88. Ke, K.; Li, L.; Lu, C.; Zhu, Q.; Wang, Y.; Mou, Y.; Wang, H.; Jin, W. The crosstalk effect between ferrous and other ions metabolism in ferroptosis for therapy of cancer. Front. Oncol. 2022, 12, 916082. [Google Scholar] [CrossRef]
  89. Kim, Y.J.; Hyun, J. Mechanosensitive ion channels in apoptosis and ferroptosis: Focusing on the role of Piezo1. BMB Rep. 2023, 56, 145–152. [Google Scholar] [CrossRef]
  90. Zhao, Y.; Li, Y.; Zhang, R.; Wang, F.; Wang, T.; Jiao, Y. The Role of Erastin in Ferroptosis and Its Prospects in Cancer Therapy. OncoTargets Ther. 2020, 13, 5429–5441. [Google Scholar] [CrossRef]
  91. Brandalise, F.; Ratto, D.; Leone, R.; Olivero, F.; Roda, E.; Locatelli, C.A.; Grazia Bottone, M.; Rossi, P. Deeper and Deeper on the Role of BK and Kir4.1 Channels in Glioblastoma Invasiveness: A Novel Summative Mechanism? Front. Neurosci. 2020, 14, 595664. [Google Scholar] [CrossRef] [PubMed]
  92. Kantidze, O.L.; Gurova, K.V.; Studitsky, V.M.; Razin, S.V. The 3D Genome as a Target for Anticancer Therapy. Trends Mol. Med. 2020, 26, 141–149. [Google Scholar] [CrossRef] [PubMed]
  93. Yamamoto, E.; Iwanaga, M. Comparison of bacteria in the tympanic cavity and the mastoid antrum in chronic otitis media. Am. J. Otolaryngol. 1986, 7, 298–301. [Google Scholar] [CrossRef]
  94. Morgan, S.L.; Mariano, N.C.; Bermudez, A.; Arruda, N.L.; Wu, F.; Luo, Y.; Shankar, G.; Jia, L.; Chen, H.; Hu, J.F.; et al. Manipulation of nuclear architecture through CRISPR-mediated chromosomal looping. Nat. Commun. 2017, 8, 15993. [Google Scholar] [CrossRef] [PubMed]
  95. Deng, W.; Rupon, J.W.; Krivega, I.; Breda, L.; Motta, I.; Jahn, K.S.; Reik, A.; Gregory, P.D.; Rivella, S.; Dean, A.; et al. Reactivation of developmentally silenced globin genes by forced chromatin looping. Cell 2014, 158, 849–860. [Google Scholar] [CrossRef] [PubMed]
  96. Deng, W.; Lee, J.; Wang, H.; Miller, J.; Reik, A.; Gregory, P.D.; Dean, A.; Blobel, G.A. Controlling long-range genomic interactions at a native locus by targeted tethering of a looping factor. Cell 2012, 149, 1233–1244. [Google Scholar] [CrossRef] [PubMed]
  97. Zhao, T.; Cai, M.; Liu, M.; Su, G.; An, D.; Moon, B.; Lyu, G.; Si, Y.; Chen, L.; Lu, W. lncRNA 5430416N02Rik Promotes the Proliferation of Mouse Embryonic Stem Cells by Activating Mid1 Expression through 3D Chromatin Architecture. Stem Cell Rep. 2020, 14, 493–505. [Google Scholar] [CrossRef]
  98. Anders, S.; Pyl, P.T.; Huber, W. HTSeq--a Python framework to work with high-throughput sequencing data. Bioinform. 2015, 31, 166–169. [Google Scholar] [CrossRef]
  99. Mootha, V.K.; Lindgren, C.M.; Eriksson, K.F.; Subramanian, A.; Sihag, S.; Lehar, J.; Puigserver, P.; Carlsson, E.; Ridderstråle, M.; Laurila, E.; et al. PGC-1alpha-responsive genes involved in oxidative phosphorylation are coordinately downregulated in human diabetes. Nat. Genet. 2003, 34, 267–273. [Google Scholar] [CrossRef]
  100. Bi, J.; Wang, W.; Zhang, M.; Zhang, B.; Liu, M.; Su, G.; Chen, F.; Chen, B.; Shi, T.; Zheng, Y.; et al. KLF4 inhibits early neural differentiation of ESCs by coordinating specific 3D chromatin structure. Nucleic Acids Res. 2022, 50, 12235–12250. [Google Scholar] [CrossRef]
  101. Grytten, I.; Rand, K.D.; Nederbragt, A.J.; Storvik, G.O.; Glad, I.K.; Sandve, G.K. Graph Peak Caller: Calling ChIP-seq peaks on graph-based reference genomes. PLoS Comput. Biol. 2019, 15, e1006731. [Google Scholar] [CrossRef] [PubMed]
  102. Zhang, Y.; Liu, T.; Meyer, C.A.; Eeckhoute, J.; Johnson, D.S.; Bernstein, B.E.; Nusbaum, C.; Myers, R.M.; Brown, M.; Li, W.; et al. Model-based analysis of ChIP-Seq (MACS). Genome Biol. 2008, 9, R137. [Google Scholar] [CrossRef] [PubMed]
  103. Li, H.; Handsaker, B.; Wysoker, A.; Fennell, T.; Ruan, J.; Homer, N.; Marth, G.; Abecasis, G.; Durbin, R. The Sequence Alignment/Map format and SAMtools. Bioinform. 2009, 25, 2078–2079. [Google Scholar] [CrossRef]
  104. Servant, N.; Varoquaux, N.; Lajoie, B.R.; Viara, E.; Chen, C.J.; Vert, J.P.; Heard, E.; Dekker, J.; Barillot, E. HiC-Pro: An optimized and flexible pipeline for Hi-C data processing. Genome Biol. 2015, 16, 259. [Google Scholar] [CrossRef]
  105. Lareau, C.A.; Aryee, M.J. hichipper: A preprocessing pipeline for calling DNA loops from HiChIP data. Nat. Methods 2018, 15, 155–156. [Google Scholar] [CrossRef]
  106. Robinson, J.T.; Turner, D.; Durand, N.C.; Thorvaldsdóttir, H.; Mesirov, J.P.; Aiden, E.L. Juicebox.js Provides a Cloud-Based Visualization System for Hi-C Data. Cell Syst. 2018, 6, 256–258.e251. [Google Scholar] [CrossRef] [PubMed]
Figure 1. Distribution of active enhancers in ferroptotic glioblastoma cells. (A) Cell viability of U87MG treated with 0, 5, 10, 15, and 20 μM Erastin for 72 h, compared to control (blue line). Data represent means ± S.E.M. of three independent experiments. (B) Cell viability of U87MG that were treated with 10 μM Erastin for 0 h, 24 h, 48 h, 72 h, and 96 h, compared to control (red line). Data represent means ± S.E.M. of three independent experiments. (CE) MDA assay, GSH assay, and ferrous iron assay indicate an increase of MDA (C), a decrease of GSH (D), and an accumulation of intracellular Fe2+ (E) in U87MG cells that were treated with 10 μM Erastin for 72 h. MDA, malondialdehyde; GSH, glutathione. Data represent means ± S.E.M. of three independent experiments. ** p < 0.01, *** p < 0.001, compared to control. (F) Pie chart showing the genome-wide distribution of active enhancer markers (H3K27ac) in U87MG and Erastin (10 μM, 72 h)-treated U87MG cells. (G) Heatmap showing H3K27ac ChIP-seq signal enrichment around TSS site in U87MG and Erastin-treated U87MG cells.
Ijms 24 14945 g001
Figure 2. Changes in 3D chromatin structures in glioblastoma cell ferroptosis. (A,B) HiChIP heatmaps at a resolution of 50, 10, and 5 kb around MAP1LC3B (A) and CHAC1 (B) loci. Dotted squares indicate regions with increased chromatin interactions in Erastin (10 μM, 72 h)-treated U87MG glioblastoma cells compared to control.
Ijms 24 14945 g002
Figure 3. HiChIP identifies the change of 3D chromatin structure in glioblastoma cell ferroptosis. (A,B) The numbers of EEI, EPI, and PPI in control U87MG cells (A) and Erastin (10 μM, 72 h)-treated U87MG cells (B). (C) Percentages of EEI, EPI, and PPI in control U87MG cells and Erastin (10 μM, 72 h)-treated U87MG cells. (D) Median distances of EEI, EPI, and PPI in control U87MG cells and Erastin (10 μM, 72 h)-treated U87MG cells. EEI: enhancer–enhancer interaction, EPI: enhancer–promoter interaction, PPI: promoter–promoter interaction.
Ijms 24 14945 g003
Figure 4. Transcriptome change in ferroptotic glioblastoma cells. (A) Comparison of gene expression in control U87MG cells (Control_1 and Control_2) and Erastin (10 μM, 72 h)-treated U87MG cells (Erastin_1 and Erastin_2). Heatmap shows clustering of differentially expressed genes in control U87MG cells and Erastin (10 μM, 72 h)-treated U87MG cells. (B) GO analysis of genes significantly upregulated in Erastin (10 μM, 72 h)-treated U87MG cells compared to control U87MG cells (log2FC > 1; padj < 0.05) (dark red color). (C) GO analysis of genes significantly downregulated in Erastin (10 μM, 72 h)-treated U87MG cells compared to control U87MG cells (log2FC ≤ −1 and padj < 0.05) (blue color). (D) Gene Set Enrichment Analysis (GSEA) of genes differentially expressed in control U87MG cells V.S. Erastin (10 μM, 72 h)-treated U87MG cells among genes associated with ferroptosis. The green curve represents the enrichment score curve in GSEA.
Ijms 24 14945 g004
Figure 5. Transcriptome change in ferroptotic glioblastoma cells is associated with changes in 3D chromatin structures. (A) The numbers of EEI, EPI, and PPI of “gained” and “lost” chromatin loops in U87MG cells that were treated with Erastin (10 μM, 72 h). (B) Percentages of EEI, EPI, and PPI in all “gained” and “lost” loops in U87MG cells that were treated with Erastin (10 μM, 72 h). (C) Median distances of “gained” chromatin loops in U87MG cells that were treated with Erastin (10 μM, 72 h). “In number” indicates gained chromatin loops that increased in loop number, and “in strength” indicates gained chromatin loops that increased in interaction strength. (D) Median distances of “lost” chromatin loops in U87MG cells that were treated with Erastin (10 μM, 72 h). “In number” indicates lost chromatin loops that decreased in loop number, and “in strength” indicates lost chromatin loops that decreased in interaction strength. (E) Comparison of gene expression in control U87MG cells (Control_1 and Control_2) and Erastin (10 μM, 72 h)-treated U87MG cells (Erastin_1 and Erastin_2). Heatmap shows clustering of “gained” chromatin loop-associated upregulated genes (log2FC > 1; padj < 0.05) in control U87MG cells and Erastin (10 μM, 72 h)-treated U87MG cells. (F) GO analysis of “gained” chromatin loop-associated upregulated genes (log2FC > 1; padj < 0.05) in Erastin (10 μM, 72 h)-treated U87MG cells compared to control U87MG cells (dark red color). (G) Comparison of gene expression in control U87MG cells (Control_1 and Control_2) and Erastin (10 μM, 72 h)-treated U87MG cells (Erastin_1 and Erastin_2). Heatmap shows clustering of “lost” chromatin loop-associated downregulated genes (log2FC ≤ −1 and padj < 0.05) in control U87MG cells and Erastin (10 μM, 72 h)-treated U87MG cells. (H) GO analysis of “lost” chromatin loop-associated downregulated genes (log2FC ≤ −1 and padj < 0.05) in Erastin (10 μM, 72 h)-treated U87MG cells compared to control U87MG cells (blue color).
Ijms 24 14945 g005
Figure 6. Genes that were regulated by 3D chromatin structures in glioblastoma ferroptosis. (AD) H3K4me1 and H3K27ac enrichment for control U87MG cells and U87MG cells that were treated with Erastin (10 μM, 72 h), as well as HiChIP interaction loops between promoters of HDM2 (A), TXNRD1 (B), MKI67 (C), and TOP2A (D) and enhancers. Promoters are shaded in red; enhancers are shaded in blue. Black curves indicate chromatin interaction loops in control U87MG cells, and red curves indicate chromatin interaction loops in U87MG cells that were treated with Erastin (10 μM, 72 h). Black dashed curves indicate weaker chromatin interactions in control U87MG cells compared to U87MG cells that were treated with Erastin (10 μM, 72 h). Red dashed curves indicate weaker chromatin interactions in U87MG cells that were treated with Erastin (10 μM, 72 h) compared to control. The red track is H3K4me1 ChIP-seq signal from control U87MG cells. The light blue track is H3K4me1 ChIP-seq signal from U87MG cells that were treated with Erastin (10 μM, 72 h). The blue track is H3K27ac ChIP-seq signal from control U87MG cells. The purple track is H3K27ac ChIP-seq signal from U87MG cells that were treated with Erastin (10 μM, 72 h).
Ijms 24 14945 g006
Figure 7. Schematics showed that some ferroptosis-related genes were upregulated and gained chromatin interaction loops between their respective loci and enhancers during Erastin-induced ferroptosis in glioblastoma. En: Enhancer. Blue and yellow rounds represent enhancers, red square represents ferroptosis-related gene, “↓” in the boxes represents transcription, “↑” below the boxes represents up-regulated expression.
Ijms 24 14945 g007
Disclaimer/Publisher’s Note: The statements, opinions and data contained in all publications are solely those of the individual author(s) and contributor(s) and not of MDPI and/or the editor(s). MDPI and/or the editor(s) disclaim responsibility for any injury to people or property resulting from any ideas, methods, instructions or products referred to in the content.

