Article

Proteomics Investigation of the Impact of the Enterococcus faecalis Secretome on MCF-7 Tumor Cells

by
Moudi A. Alwehaibi
1,2,
Mysoon M. Al-Ansari
1,*,
Assim A. Alfadda
2,3,
Reem Al-Malki
1,
Afshan Masood
2,
Anas M. Abdel Rahman
4,5 and
Hicham Benabdelkamel
2,*
1
Department of Botany and Microbiology, College of Science, King Saud University, Riyadh 11451, Saudi Arabia
2
Proteomics Resource Unit, Obesity Research Center, College of Medicine, King Saud University, Riyadh 11461, Saudi Arabia
3
Department of Medicine, College of Medicine and King Saud Medical City, King Saud University, Riyadh 11451, Saudi Arabia
4
Metabolomics Section, Department of Clinical Genomics, Center for Genome Medicine, King Faisal Specialist Hospital and Research Centre (KFSHRC), Riyadh 11211, Saudi Arabia
5
Department of Biochemistry and Molecular Medicine, College of Medicine, Alfaisal University, Riyadh 11533, Saudi Arabia
*
Authors to whom correspondence should be addressed.
Int. J. Mol. Sci. 2023, 24(19), 14937; https://doi.org/10.3390/ijms241914937
Submission received: 3 September 2023 / Revised: 2 October 2023 / Accepted: 3 October 2023 / Published: 5 October 2023
(This article belongs to the Special Issue Microbial Omics)

Abstract

:
Breast cancer is the most prevalent form of cancer among women. The microenvironment of a cancer tumor is surrounded by various cells, including the microbiota. An imbalance between microbes and their host may contribute to the development and spread of breast cancer. Therefore, the objective of this study is to investigate the influence of Enterococcus faecalis on a breast cancer cell line (MCF-7) to mimic the luminal A subtype of breast cancer, using an untargeted proteomics approach to analyze the proteomic profiles of breast cancer cells after their treatment with E. faecalis in order to understand the microbiome and its role in the development of cancer. The breast cancer cell line MCF-7 was cultured and then treated with a 10% bacterial supernatant at two time points (24 h and 48 h) at 37 °C in a humidified incubator with 5% CO2. Proteins were then extracted and separated using two-dimensional difference (2D-DIGE) gel electrophoresis, and the statistically significant proteins (p-value < 0.05, fold change > 1.5) were identified via matrix-assisted laser desorption/ionization–time-of-flight mass spectrometry (MALDI-TOF-MS). The protein fingerprints showed a differential protein expression pattern in the cells treated with E. faecalis for 24 and 48 h compared with the control. We found 58 statistically significant proteins changes in the MCF-7 breast cancer cells affected by E. faecalis. Kilin and transgelin were upregulated after 24 h of treatment and could be used as diagnostic and prognostic markers for breast cancer. In addition, another protein involved in the inhibition of cell proliferation was coiled-coil domain-containing protein 154. The protein markers identified in this study may serve as possible biomarkers for breast cancer progression. This promotes their future uses as important therapeutic goals in the treatment and diagnosis of cancer and increases our understanding of the breast microbiome and its role in the development of cancer.

1. Introduction

Cancer is a major health concern and the second leading cause of death worldwide; it is a multifactorial disease caused by genetics or environmental factors that lead to uncontrollable cell division. Cancer affects multiple organs and tissues such as the liver, lung and breast [1]. Breast cancer (BC) is the most frequent cancer among females worldwide, with a high mortality rate [2]. Nearly one in eight women are diagnosed with breast cancer in their lifetime, as reported by the American Cancer Society [3]. Breast cancer’s biological and clinical behavior varies from patient to patient, making it difficult to predict disease evolution and patient outcomes. Therefore, biomarkers are required to assist clinicians in selecting the best treatment for each patient. Various studies on breast cancer have also determined that almost all cancers release their components into circulation. Cancer cells can release microvesicles called extracellular vesicles (EVs) or exosomes into the extracellular environment. These vesicles play an important role in cell-to-cell communication by transferring proteins, nucleic acids, and lipids from one cell to another [4].
The tumor microenvironment (TME) comprises various components, including cancer cells and host stromal cells, all of which are embedded in the extracellular matrix. The TME plays an influential role in tumor progression and invasion by affecting the biological behaviors of cancer cells, such as cell-to-cell communication and evading the immune response [1,5,6,7,8,9]. The microenvironment also contains a variety of microbiota. Microbiota are defined as microorganisms that live symbiotically in different regions of the body and play significant roles in human health. Dysbiosis of microbiota may lead to systemic disease and inflammation. Changes in a distinct microbiome may contribute to the development of cancer and affect tumor growth [10,11,12,13,14]. Breast tumors have demonstrated the presence of unique bacterial populations compared to the microbiome surrounding normal mammary gland tissue. Several studies have found a greater degree of bacterial colonization in women with breast cancer, including Bacillus, Enterobacteriaceae, Staphylococcus, Fusobacterium, Atopobium, Gluconacetobacter, Hydrogenophaga and Lactobacillus [6,12,13].
Enterococcus faecalis is one of the most common Enterococcaceae species found in the human gut and urogenital tract. Conversely, a few studies found that the metabolites produced by E. faecalis have an apoptotic effect against different cancer cell lines and could be used as alternative pharmaceutical substances. The functional properties of potent anticancer chemicals (protein compounds) and the mechanisms through which E. faecalis promotes the initiation and progression of cancer remain unknown. They should be properly researched [15,16].
A proteomics analysis is the study of proteins and represents one of the most important disciplines that provides high-throughput insight into the mechanisms of biological processes. Mass spectrometry (MS)-based proteomics technology is currently used for the identification of disease-specific biomarkers by profiling protein signatures over a wide dynamic range [17]. Differential analyses of cancerous and non-cancerous breast cell line proteomes may provide valuable proof of new proteins related to the progression of breast cancer. They also contribute to a better understanding of microbes and their molecular effects. Ultimately, the investigation of cancer and the outcomes of bacterial biomarkers may assist in disease diagnosis and could be used in the future as promising therapeutic targets [18,19,20,21]. A recent study hypothesized that the normal microbiome of the breast influences breast cancer metabolism. The study tested the Escherichia coli secretome to profile the most significant bacterial metabolites in the MDA-MB-231 breast cancer cell line, using liquid chromatography–mass spectrometry. The findings were the first to reveal that the E. coli secretome modulates the energy metabolism of BC cells and that the secretion of metabolic molecules could alter the metabolism of BC cells to maintain their survival [22].
Using 2D-DIGE and MALDI-TOF-MS, this study focused on proteomics changes in the breast cancer cell line MCF-7 which were influenced by the signaling crosstalk of Enterococcus faecalis. In addition, the identification of biomarkers of the Enterococcus faecalis secretome may provide a new line of investigation for gaining further insights into disease diagnosis, and these biomarkers could be used in the future as promising therapeutic targets that are significant in the treatment and diagnosis of cancer, using Enterococcus faecalis as a conventional method for cancer therapy.

2. Results

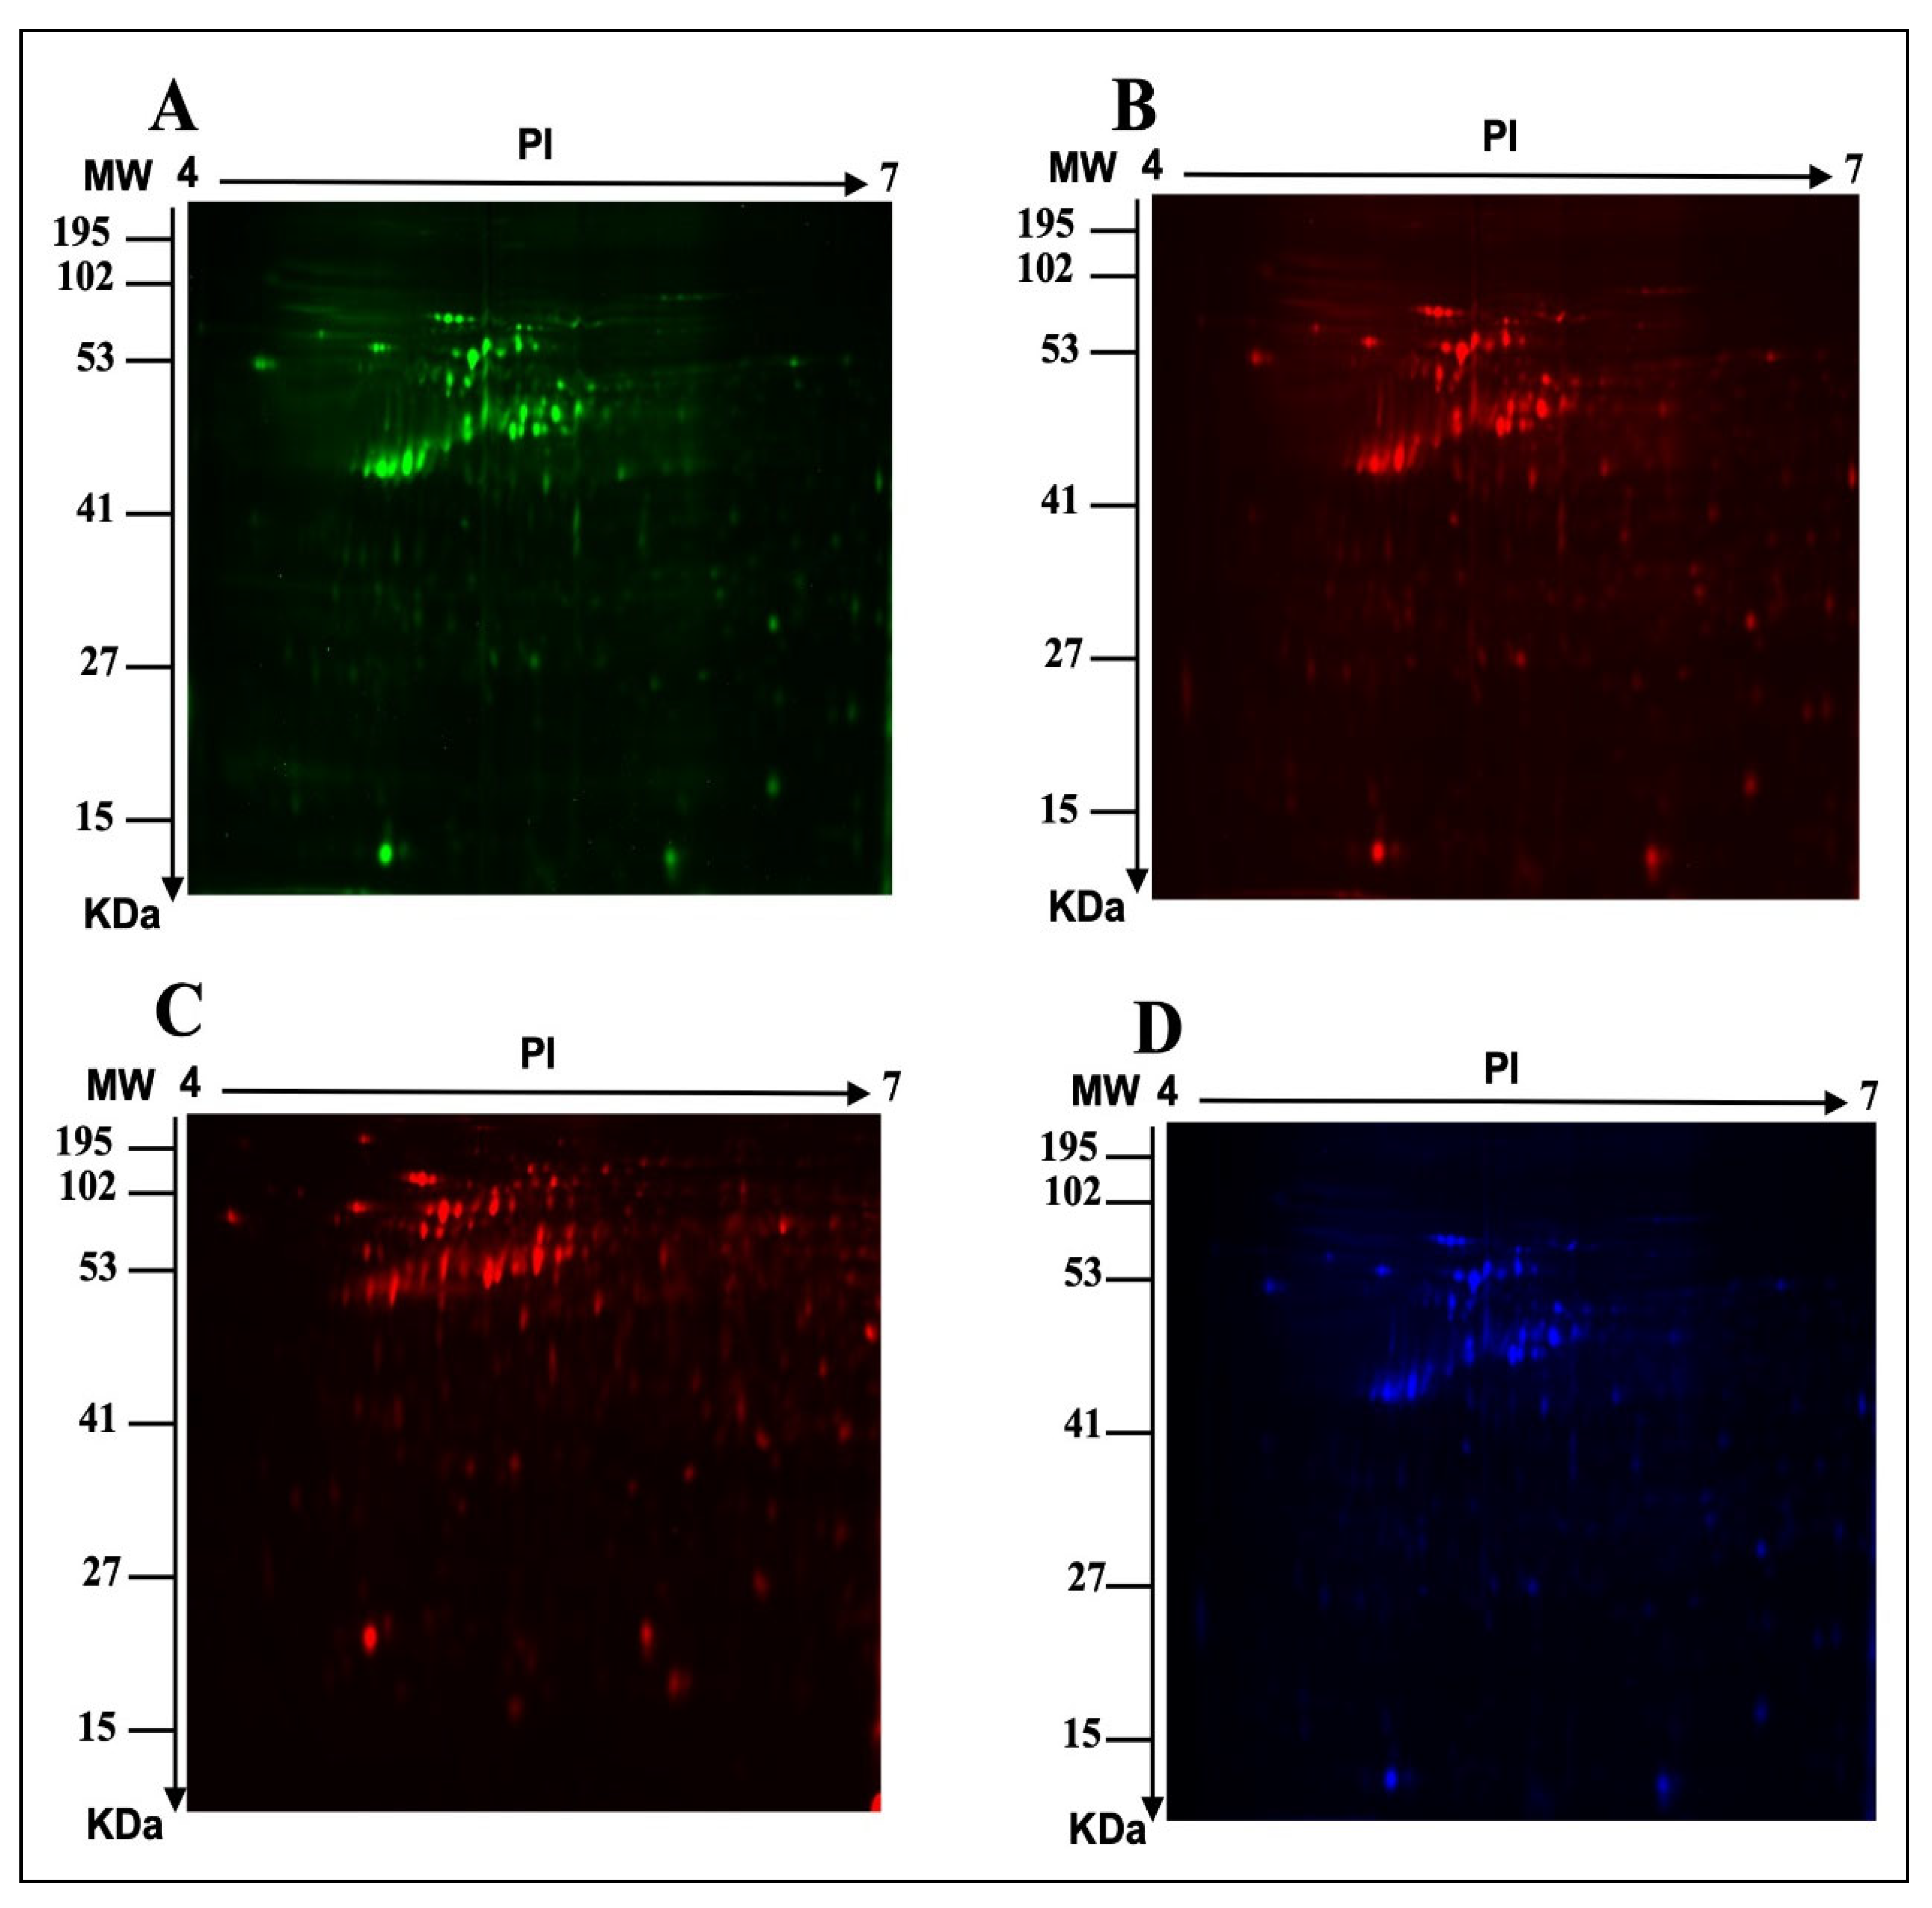
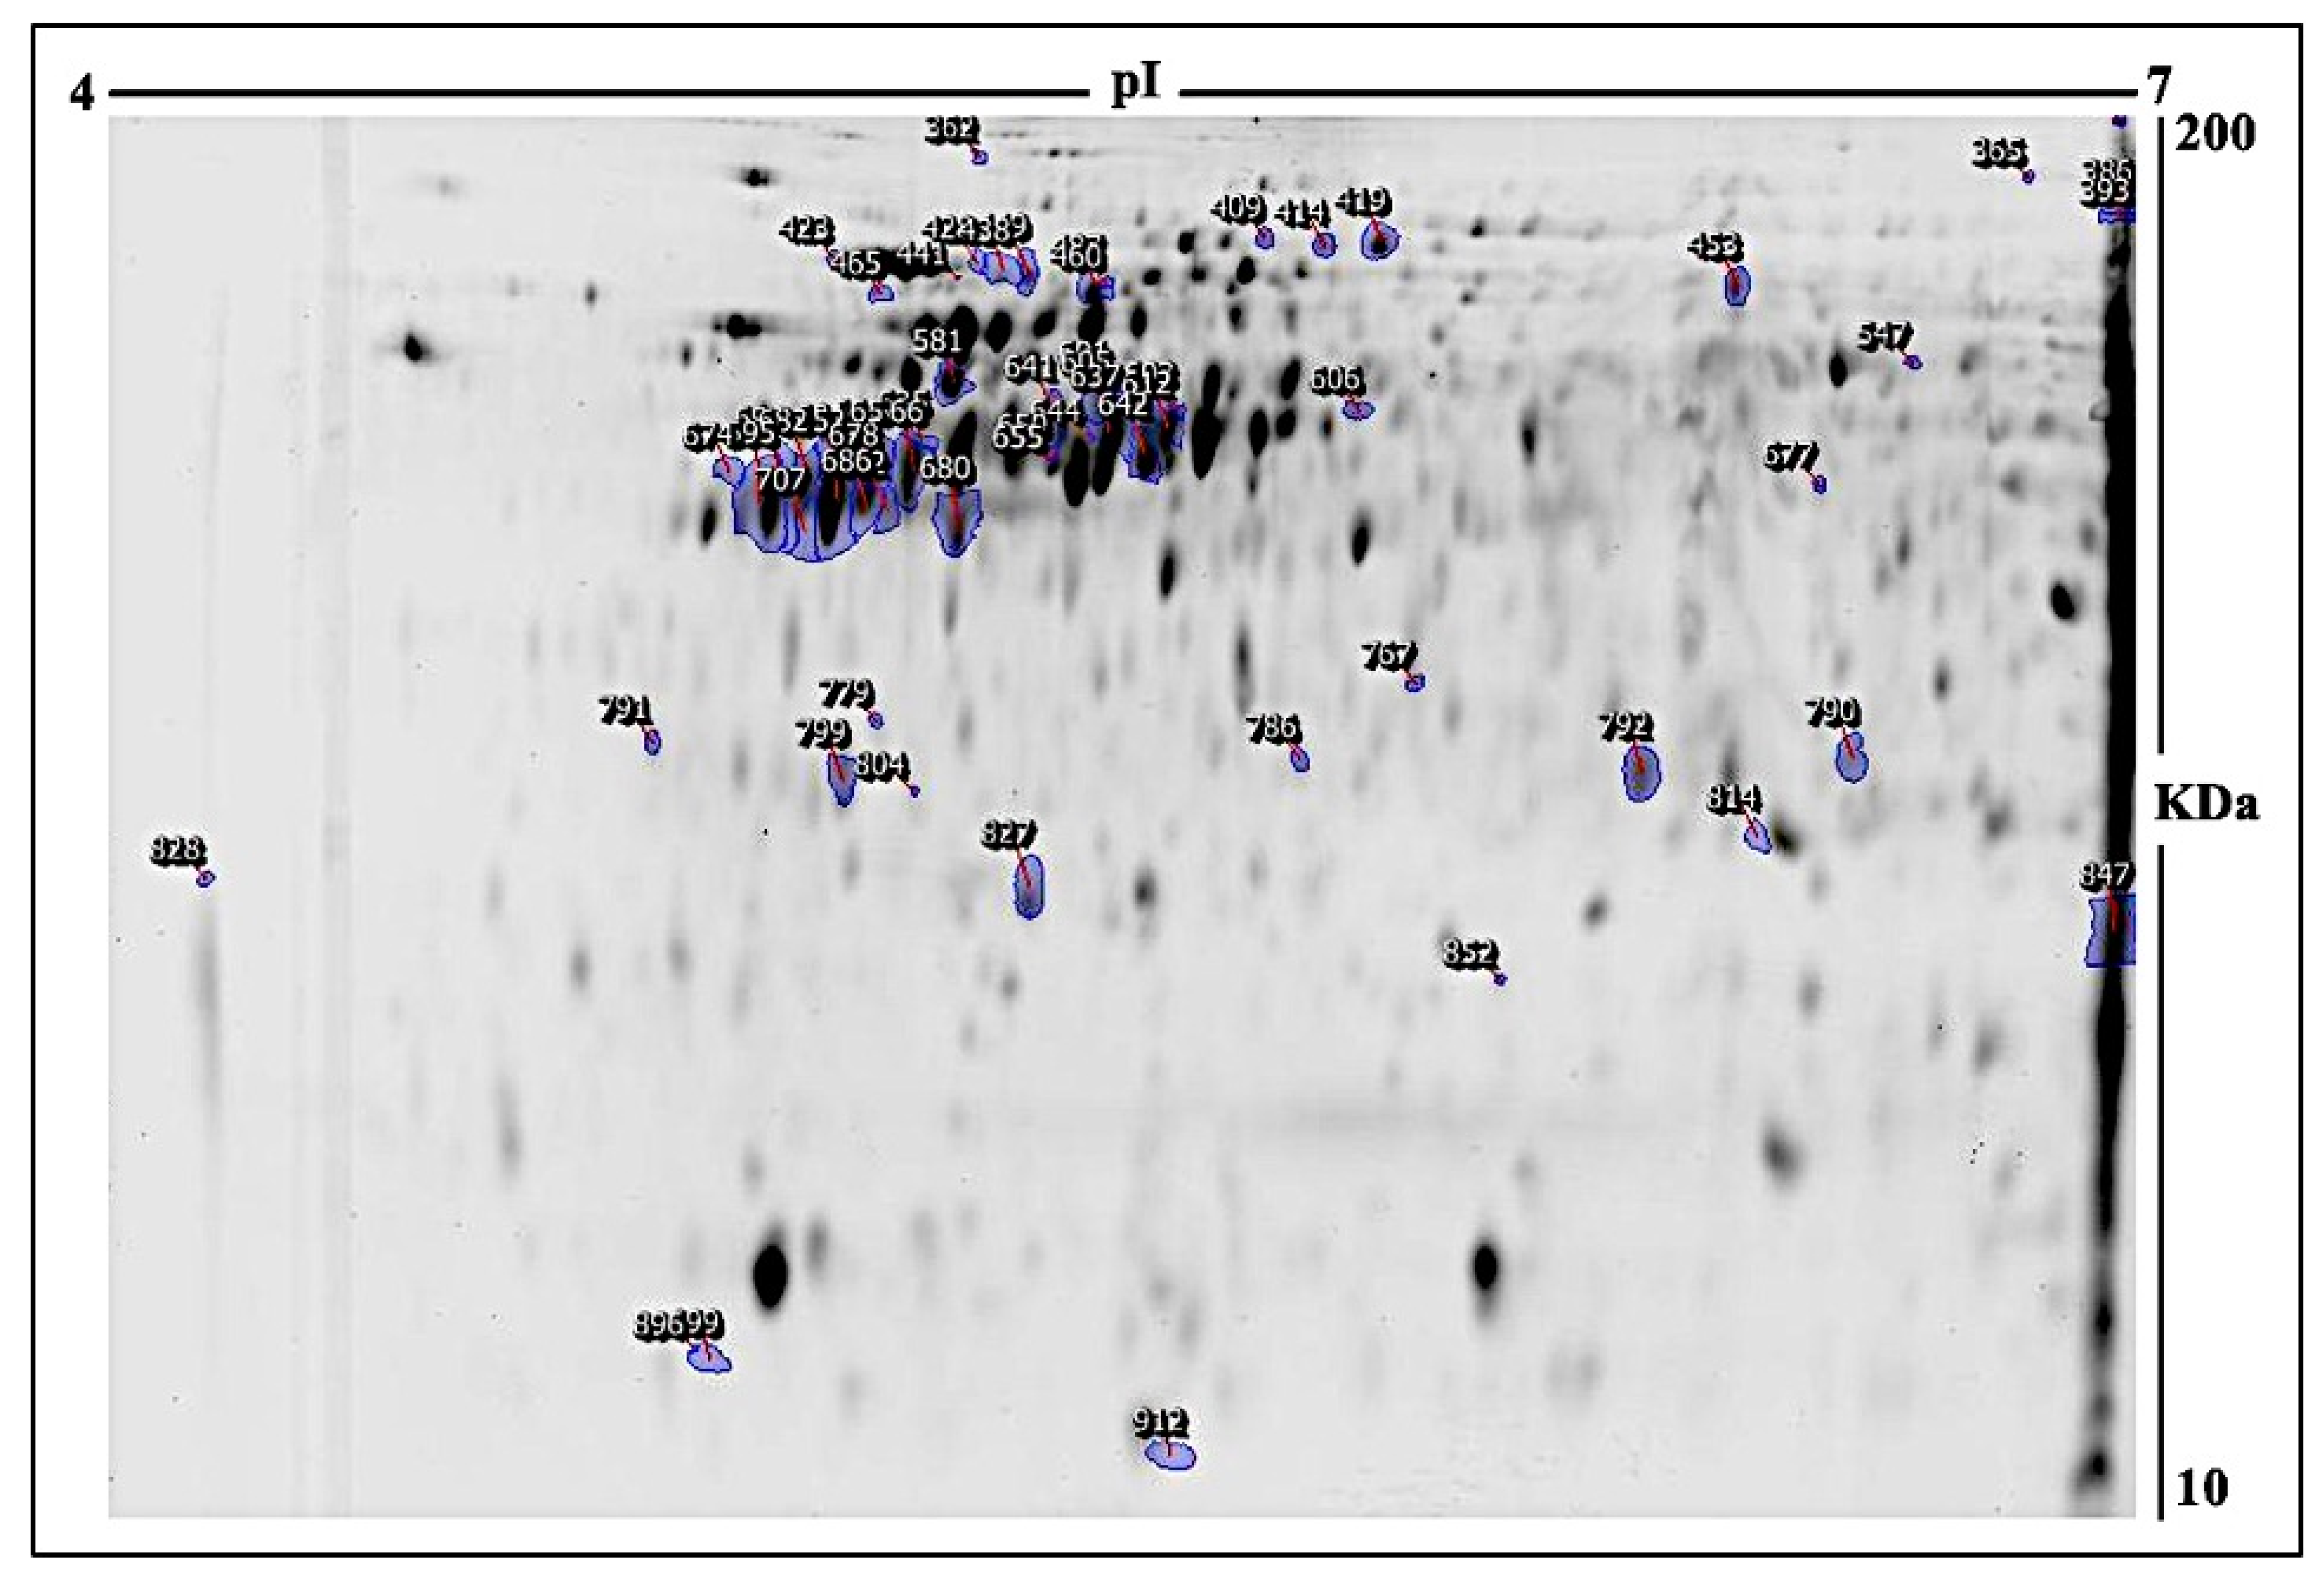
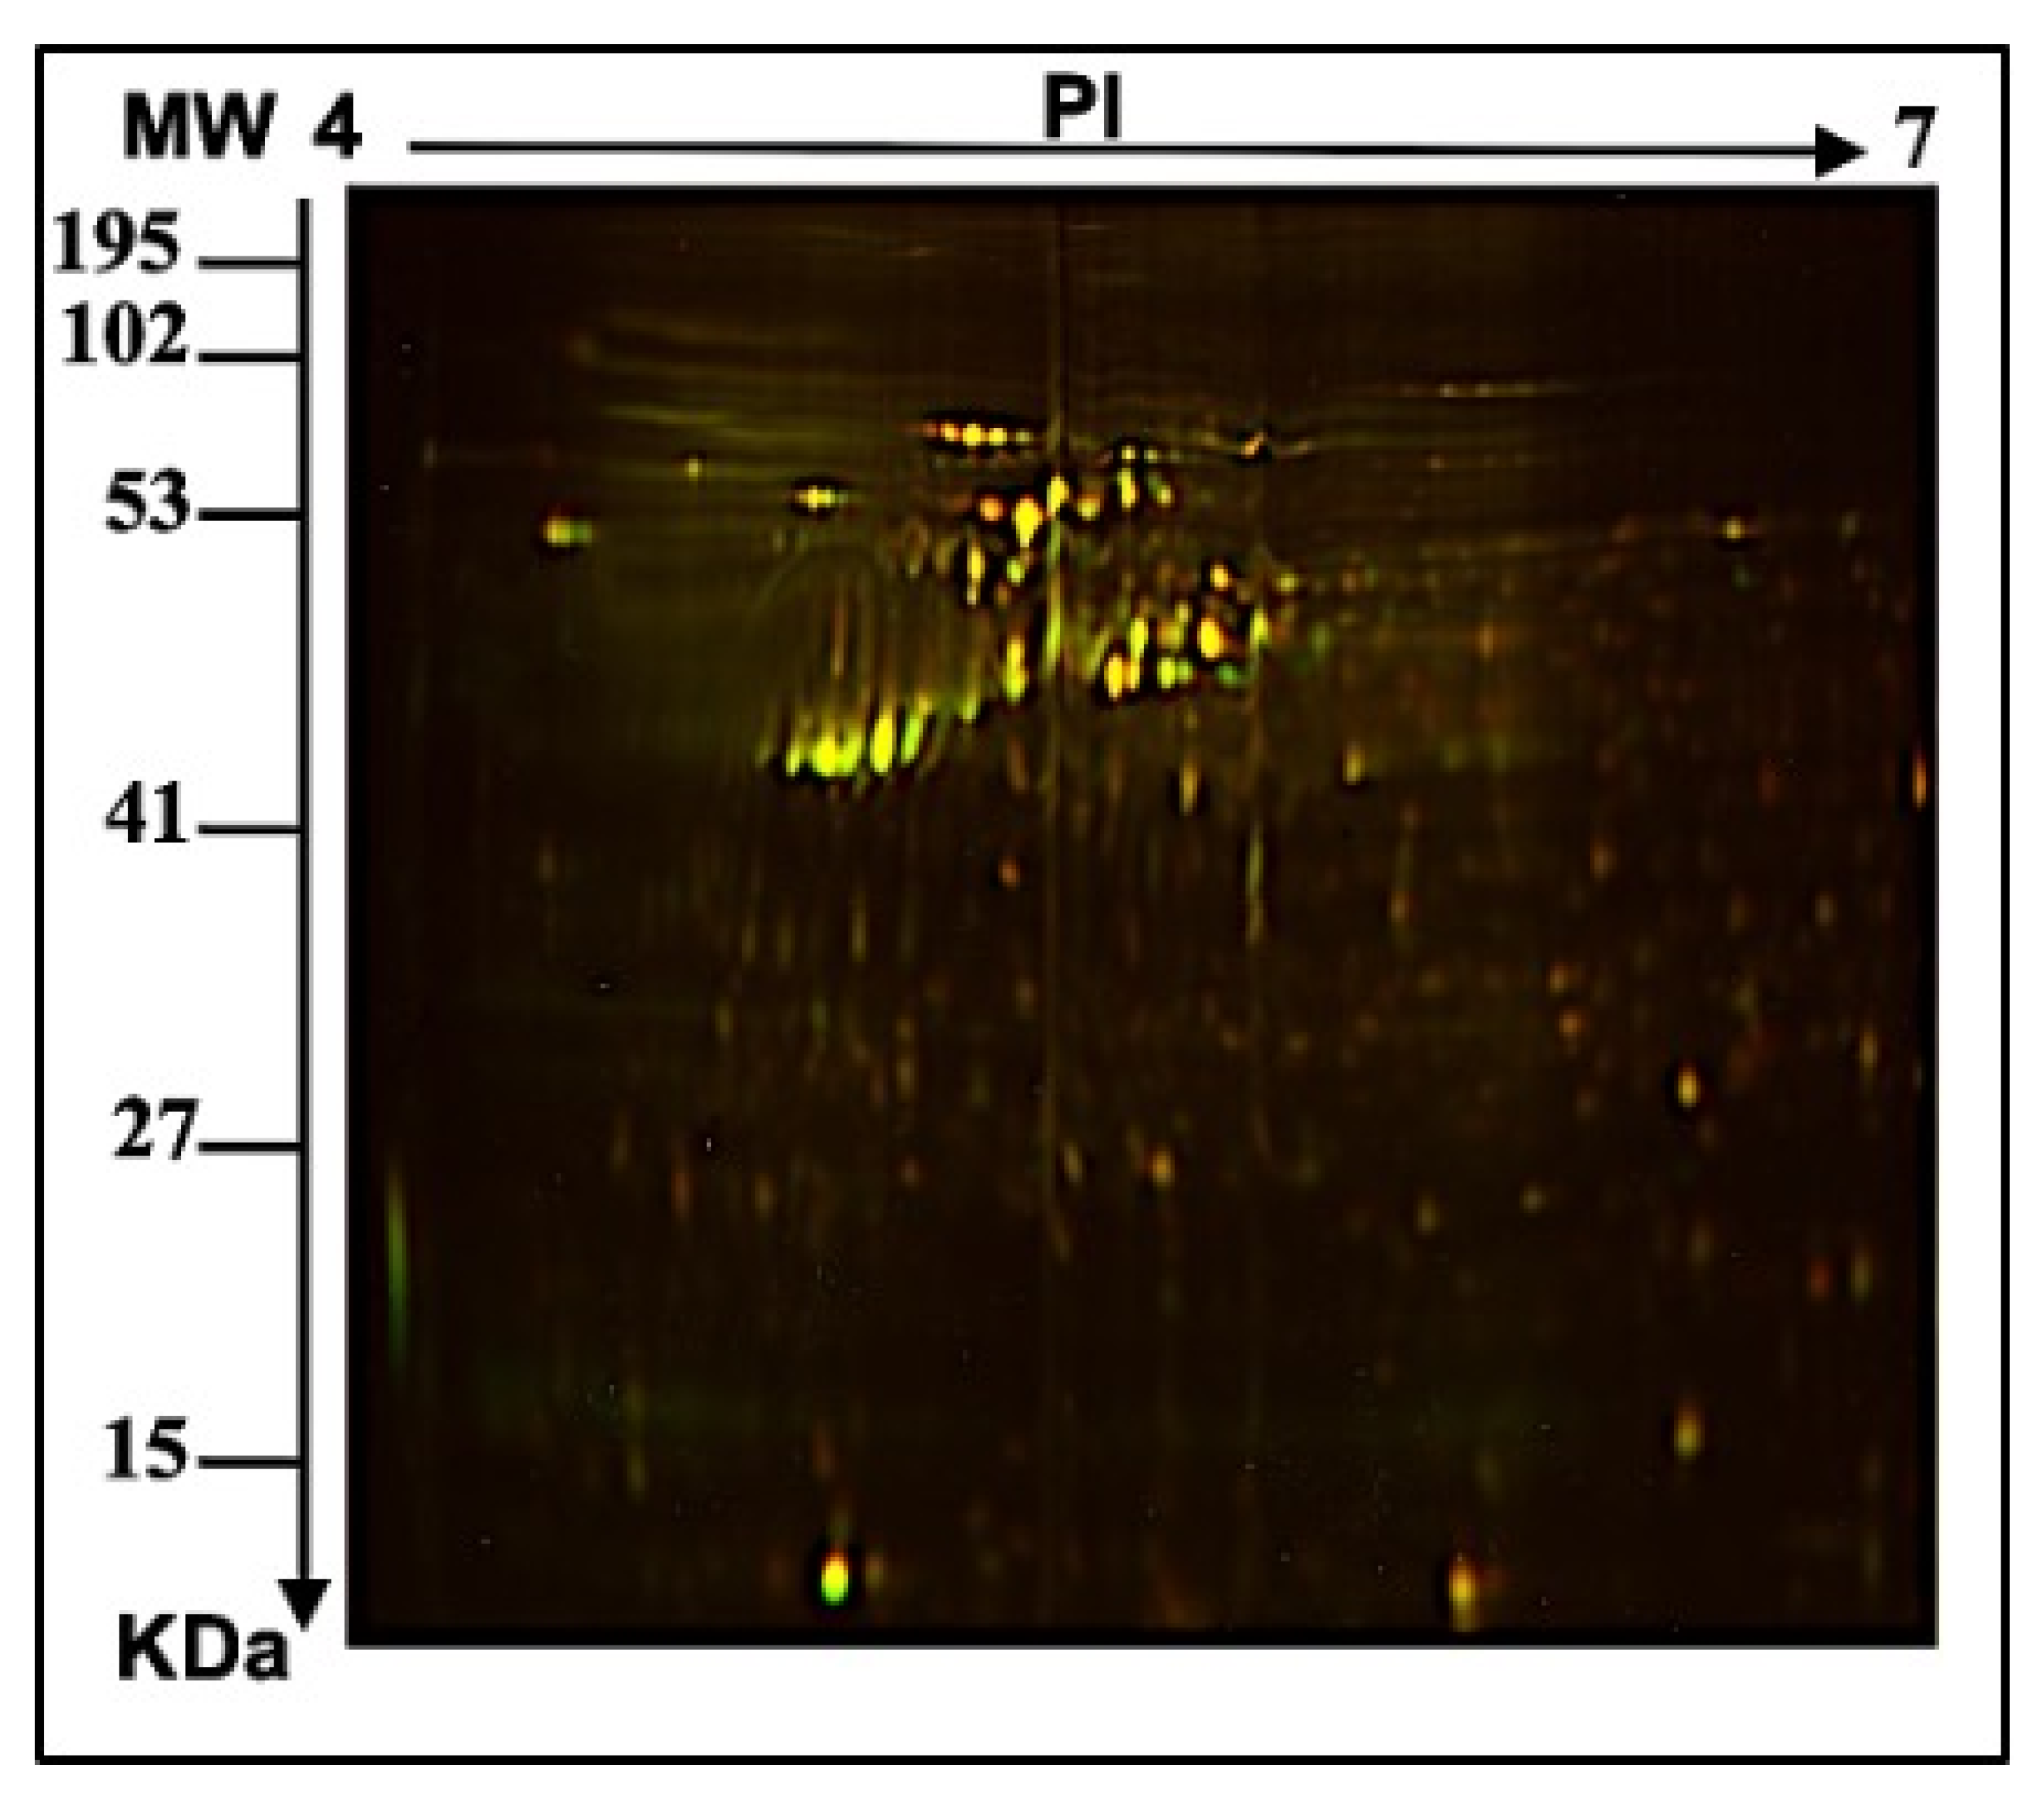
2.1. E. faecalis Supernatant Effects the Expression of MCF-7 Cell Line Proteins

To study the role of bacterial microbiota in the protein profile of MCF-7 cells, an E. faecalis supernatant was used as a part of the breast microbiome to test the indirect effect on the MCF-7 breast cell line. To perform a proteomic analysis using 2D-DIGE and MALDI-TOF-MS for fluorescent protein profiling, the samples were labeled with Cy3 (Ctrl), treated with E. faecalis for 24 h and 48 h, and labeled with Cy5, and the pooled internal control was labeled with Cy2 (Figure 1A, Figure 1B, Figure 1C, Figure 1D respectively). Figure 2 shows the merged 2D-DIGE gels of the 24 h, 48 h, and Ctrl samples. Therefore, using an ANOVA (p ≤ 0.05; fold-change ≥ 1.5), Figure 3 shows that the expression of 58 out of 66 proteins was significantly dysregulated in the 24 h and 48 h treated cells when compared to the control. Across five proteomic gels, the normalization and quantitative differential analysis of protein levels were attained using the internal standard Cy2 labeling.
Therefore, PMFs successfully identified 66 of the total protein spots excised from the preparative gel via MALDI-TOF mass spectrometry, which expressed 58 spots as unique protein sequences which were matched to entries in the SWISS-PROT database with high confidence scores via Mascot (Table 1). the sequence coverage of the proteins identified via PMFs ranged from 11% to 83%. Figure 3 shows that some variants of the same protein were found at different locations in the preparative gel. Table 1 shows that among the 24 h treated samples, 33 protein spots were significantly upregulated, 12 were downregulated, and 13 were non-significant when compared to the experimental control. Moreover, 16 protein spots were significantly upregulated, 15 were downregulated, and 27 were non-significant in the samples treated for 48 h compared to the control subjects. Among the 33 functional proteins upregulated after 24 h, nitric oxide synthase (upregulated 1.5-fold; p = 0.003) and transgelin (upregulated 1.5-fol;, p = 0.004) may have important roles in the progression of BC. In addition, within 48 h, the dysregulation of several proteins such as ATP-dependent RNA helicase DDX3X (downregulated −1.5-fold; p = 0.06), ATP synthase subunit alpha mitochondrial (downregulated −1.5-fold; p = 0.06), and ATP synthase subunit beta mitochondrial (up 1.5-fold; p = 0.02) may play roles as biomarkers of cancer progression and metastasis. Among the identified proteins, Actin, cytoplasmic 2, 60 kDa heat shock protein, mitochondrial, and AN1-type zinc finger protein 3 were found in more than one spot on the gels, which could be associated with post-translational modifications, cleavage via enzymes, or the presence of different protein species. Thus, the MCF-7 cell line was indirectly affected by the E. faecalis supernatant, as shown via the dysregulation of protein expression.

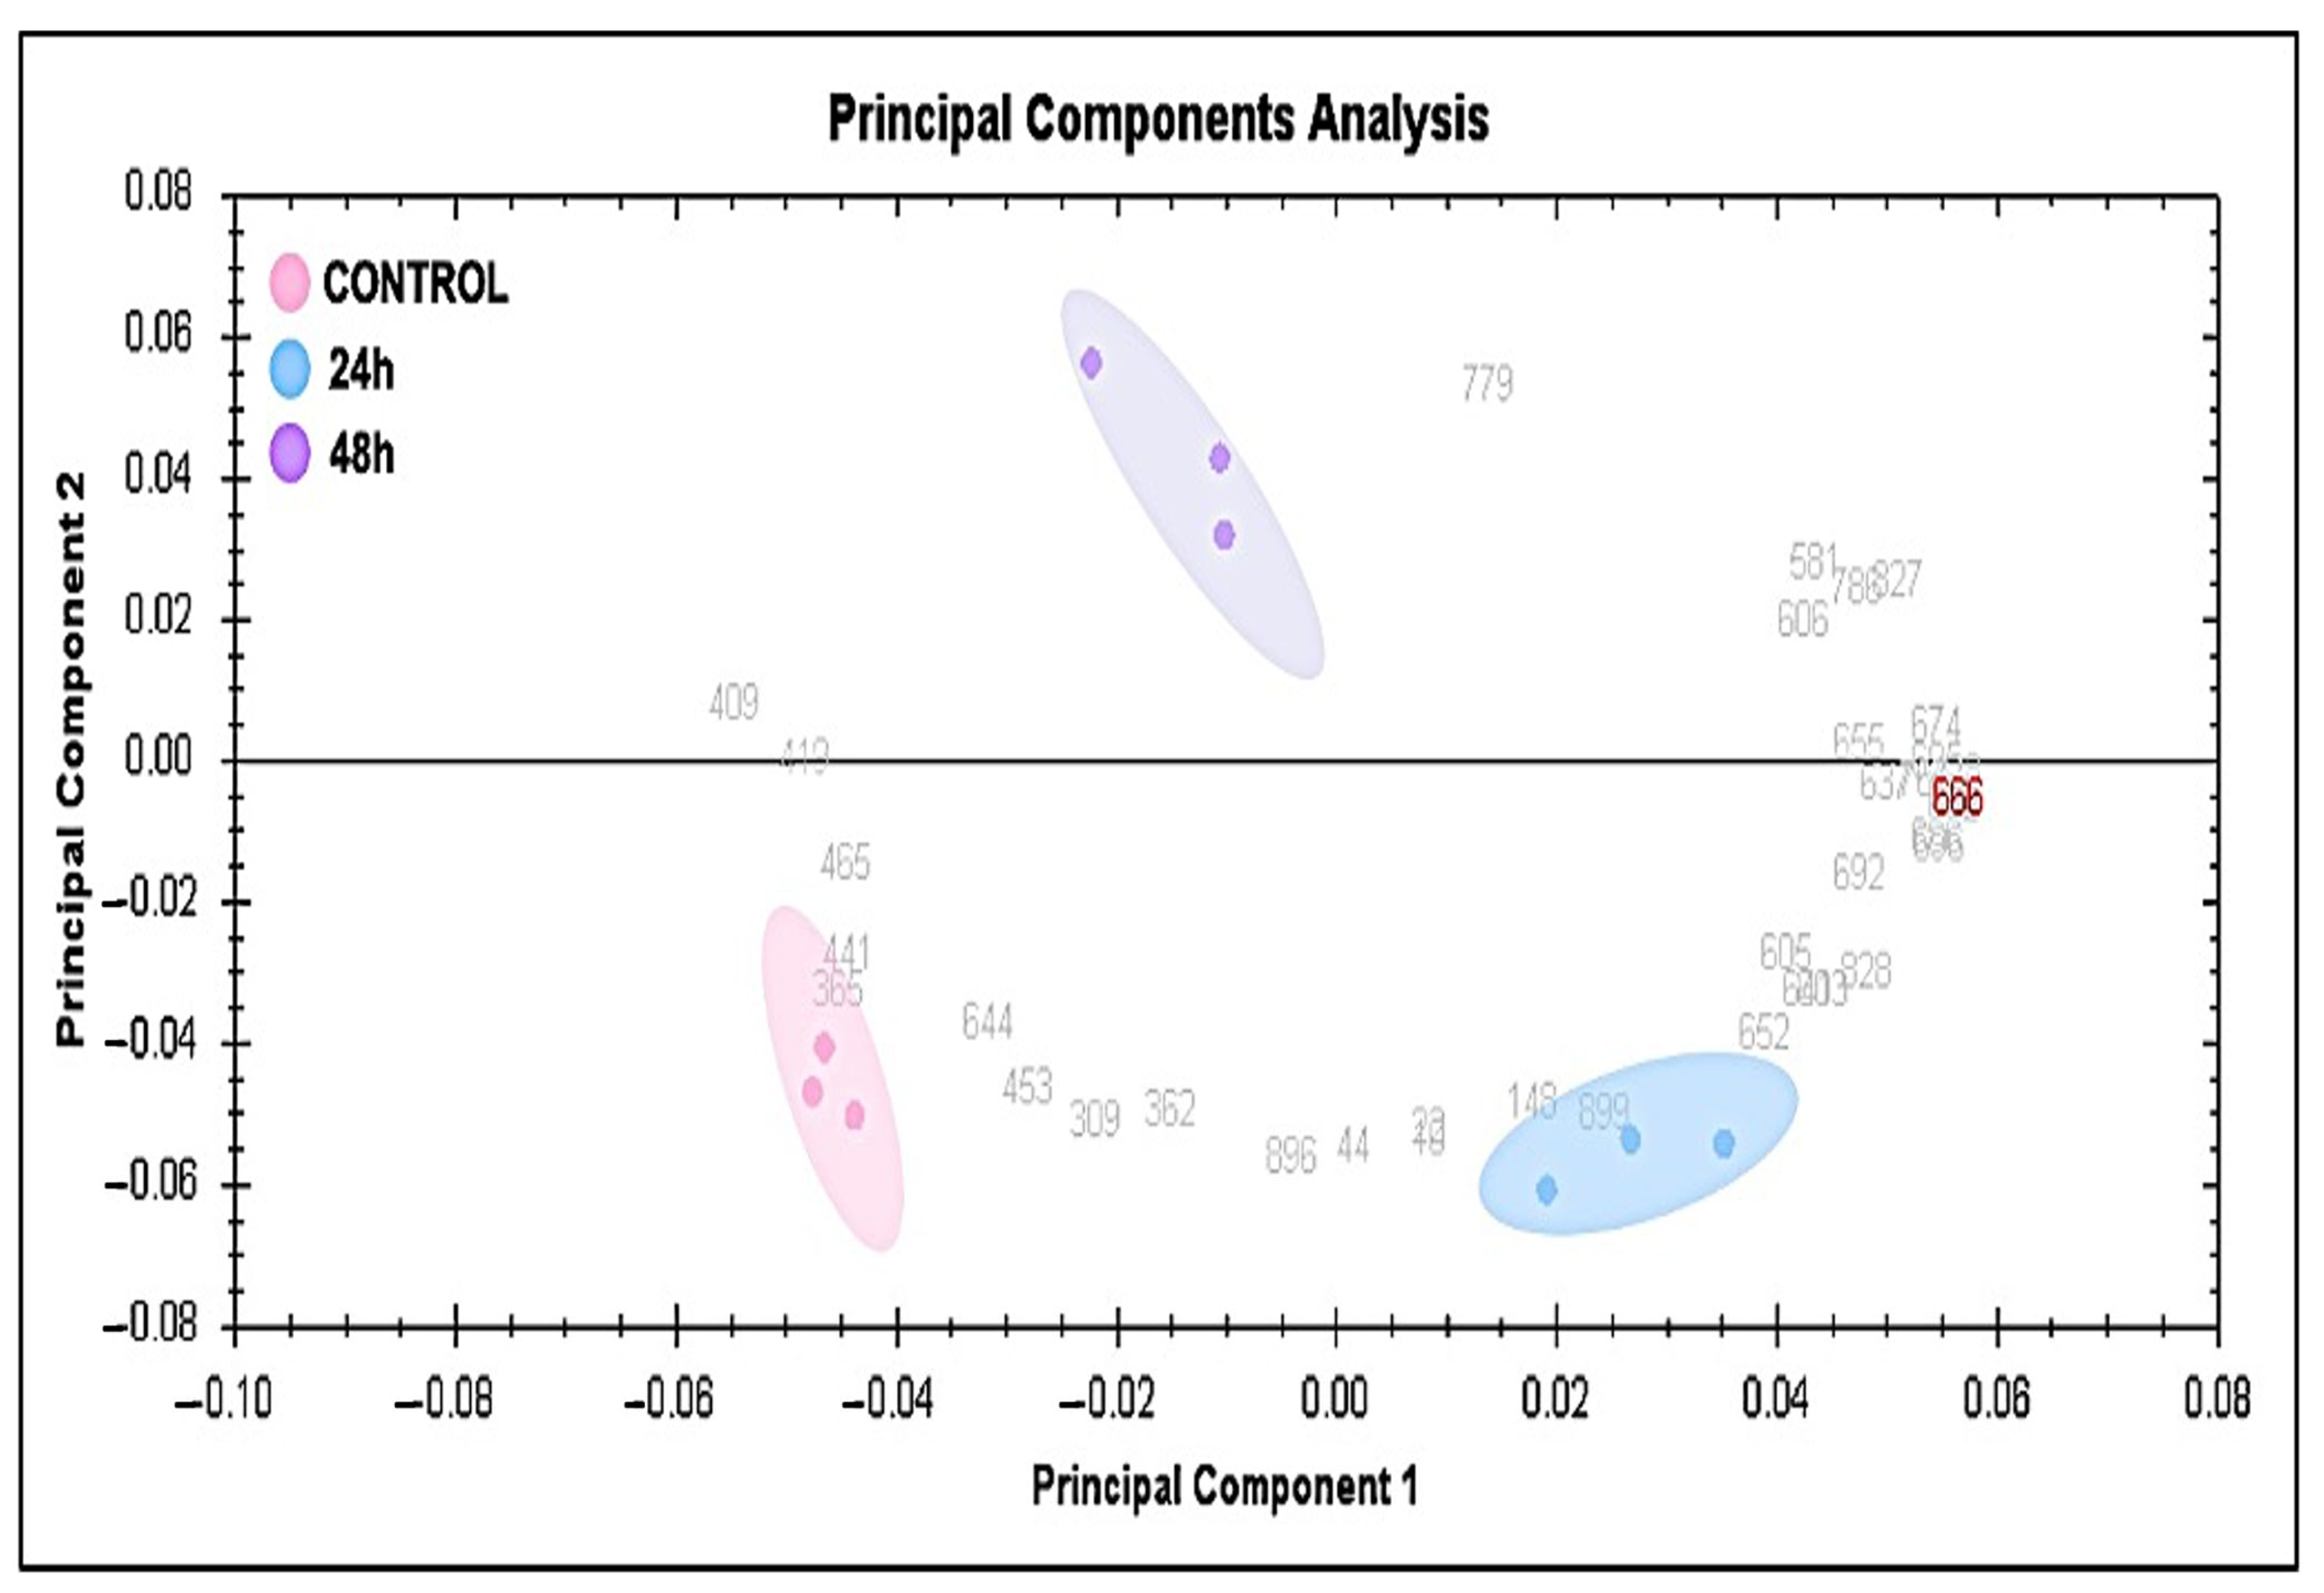
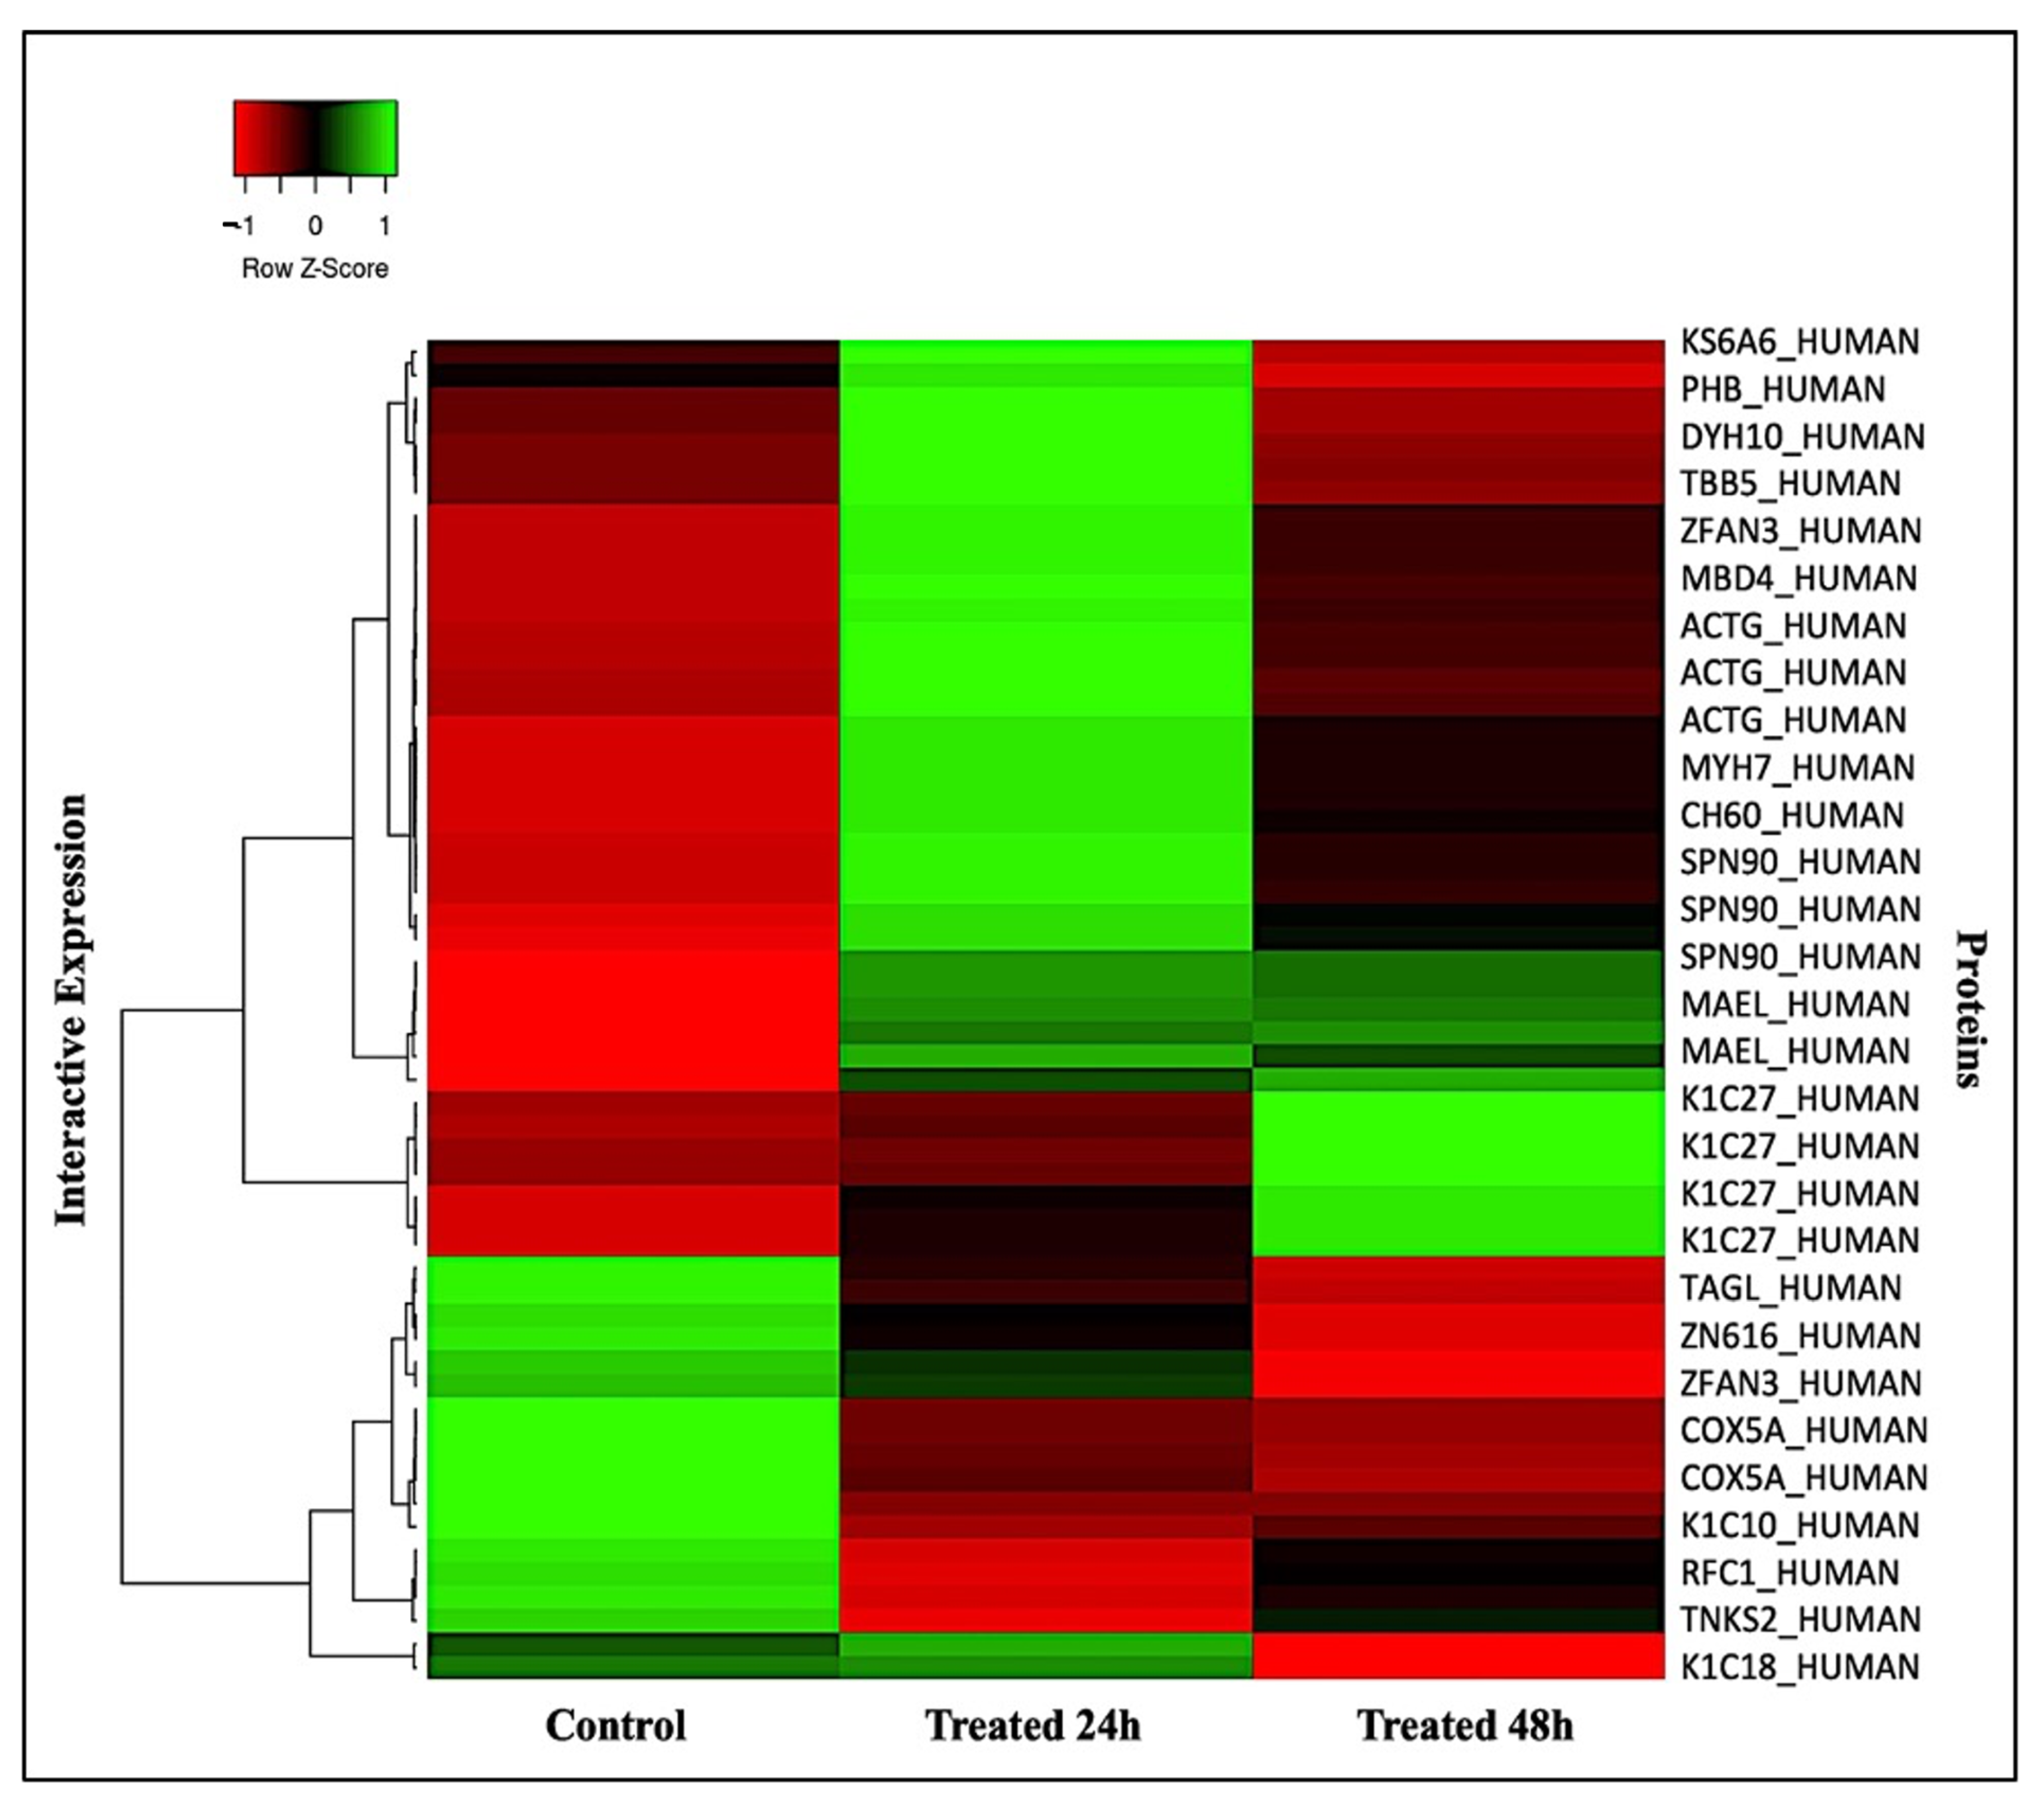
2.2. Principal Component, Cluster Analysis, and Heatmap of Significant Proteins

Subsequently, a multivariate analysis of the protein abundance data was performed using the Progenesis Same Spots software. The gel images were grouped such that nine samples from the control and the groups treated for 24 h and for 48 h formed three groups. The data were filtered so that only the 58 spot features exhibiting statistically significant (ANOVA, p ≤ 0.05) changes in abundance which were present on all gel images and identified via MS were considered. Figure 4 shows that the samples were colored according to their group, and score plots were obtained for all three study groups, taking 50.30% as the cut-off score. A principal component analysis (PCA) revealed that the three groups clustered distinctly from one another based on different time points. The PCA model demonstrated that the Ctrl group, the group treated for 24 h, and the group treated for 48 h clustered in a two-dimensional score plot, indicating that the proteomics profiles were significantly different between these three groups. Simultaneously, a hierarchical clustering analysis of abundant spots showed clusters of different expression patterns (Figure S1A,C). The clustering pattern demonstrates that the changes in the protein intensity of selected spots treated for 24 h and 48 h compared to the control samples were significantly different (Figure S1B,D). Moreover, Figure 5 displays all the significant proteins identified via MALDI- TOF-MS which were used to create a heatmap using the average of normalized values. Shades of red indicate high levels of expression and shades of green indicate low levels of expression. When comparing the experimental control to the samples treated for 24 h and 48 h, the heatmap revealed that the most recognized proteins had upregulated expression patterns. Therefore, the proteomic profiles of the significant proteins were significantly different among the three groups.

2.3. Bioinformatics Analysis

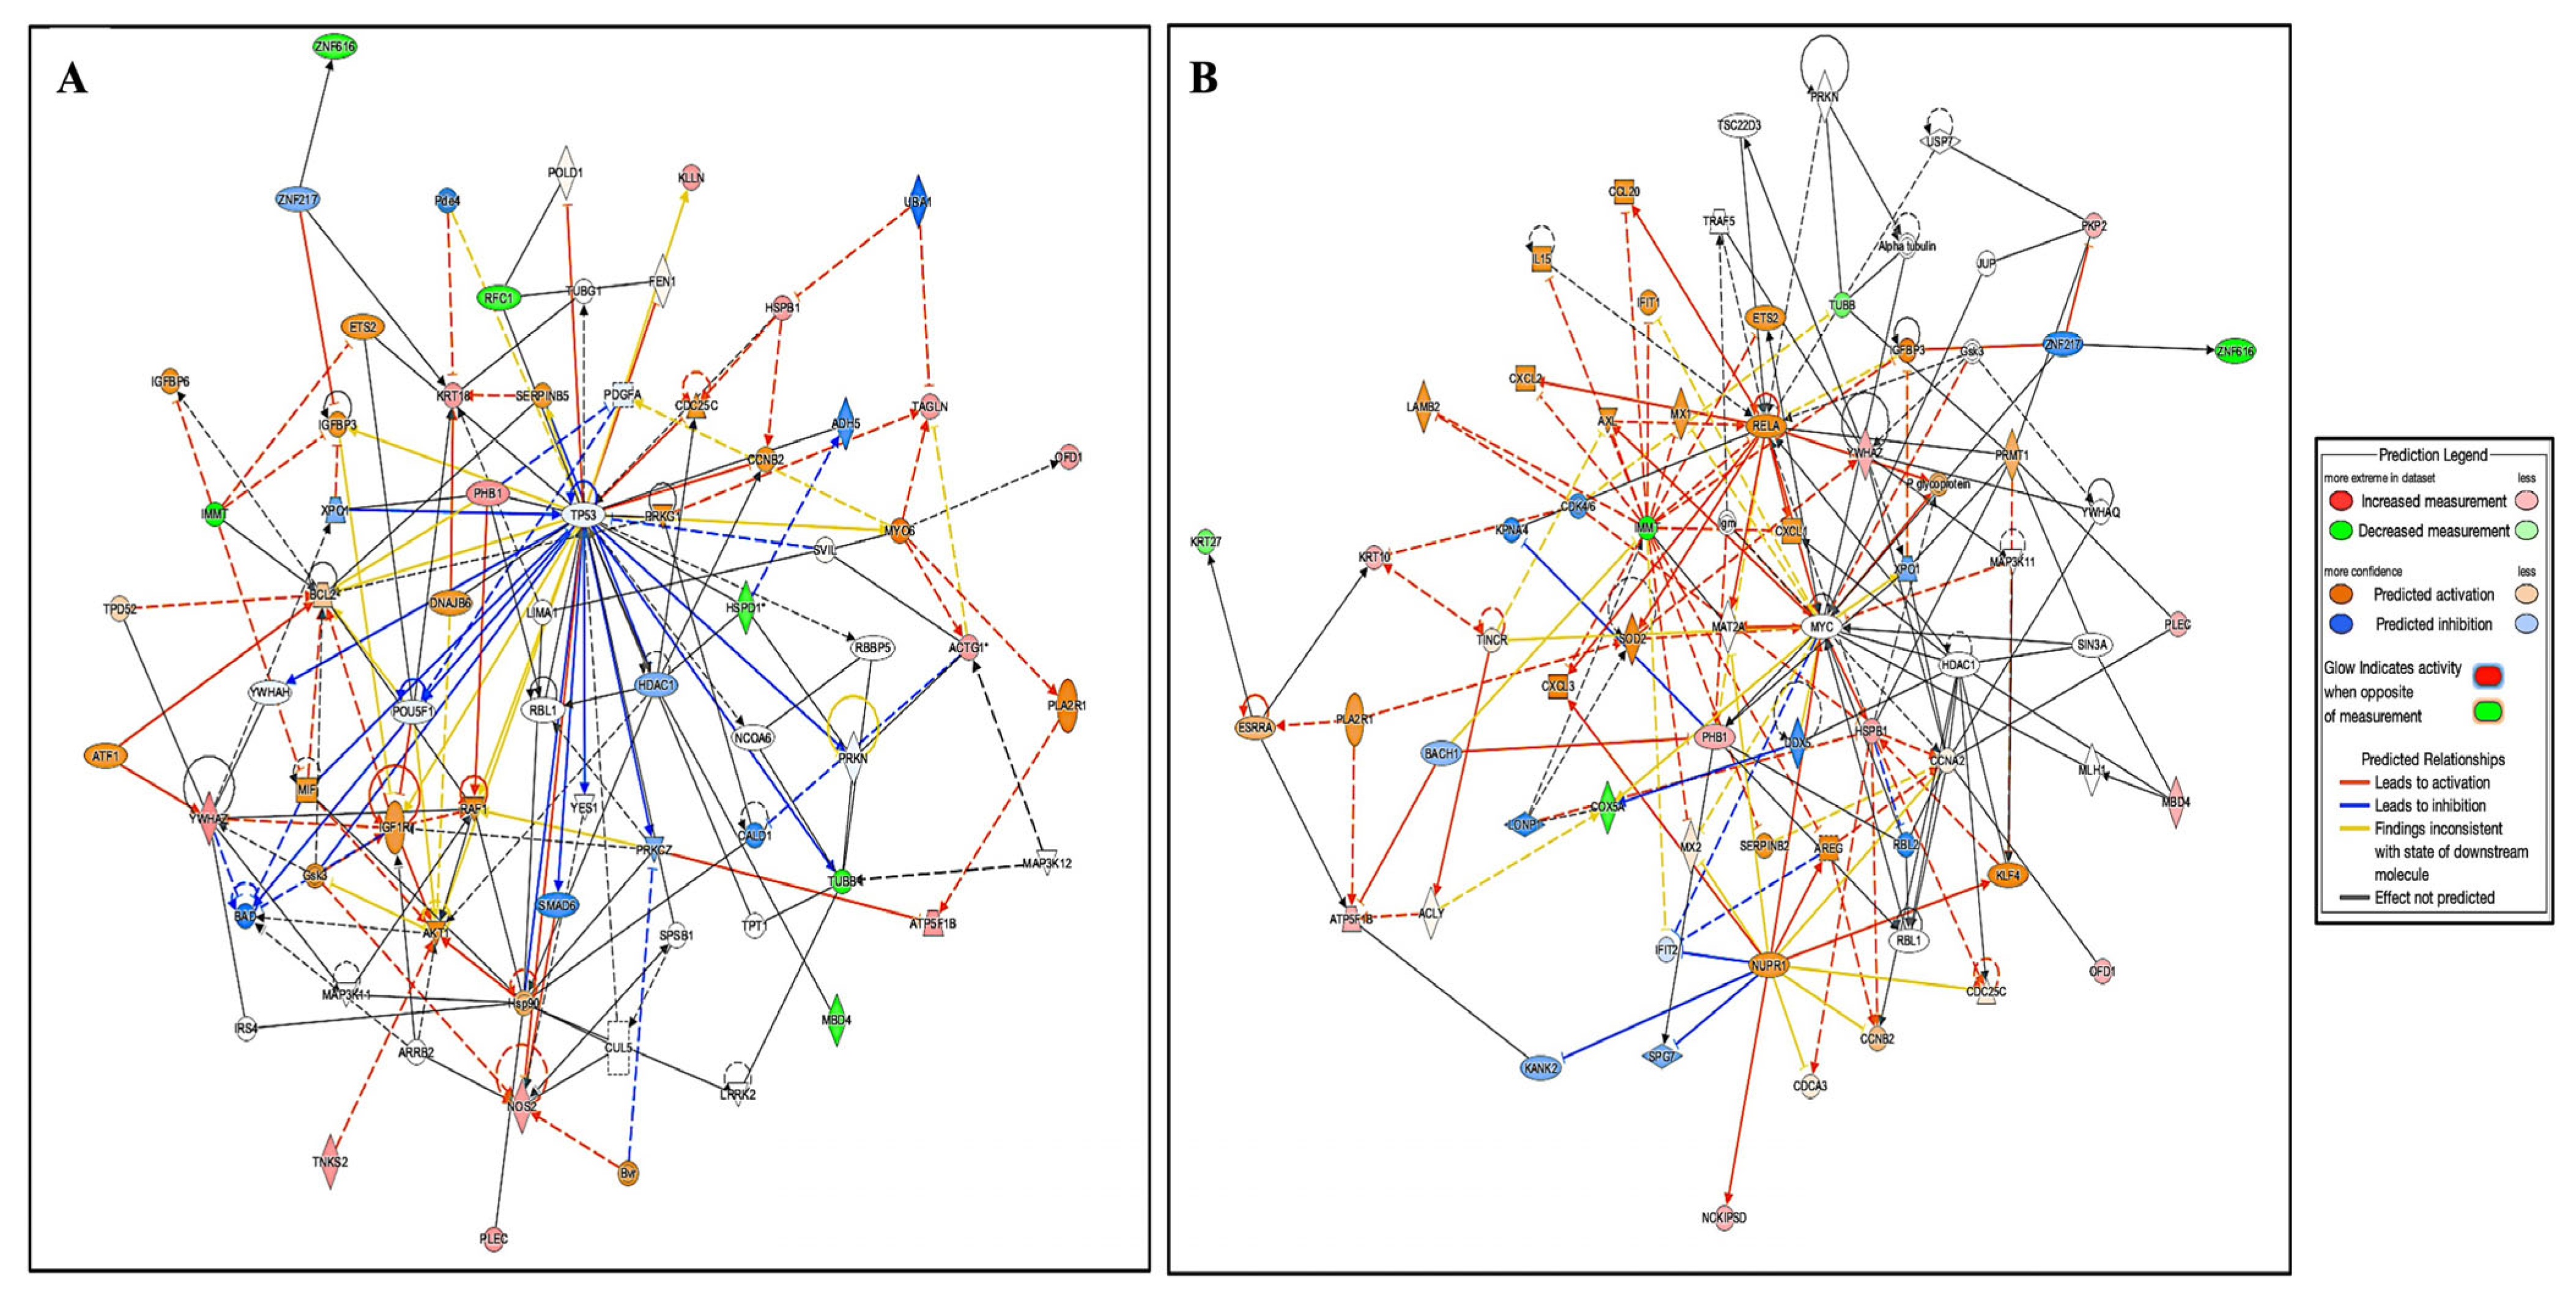
2.3.1. Interactions of Identified Proteins and Network Connectivity Mapping Using Ingenuity Pathway Analysis (IPA)

A bioinformatics analysis using IPA was performed for all 58 proteins that were differentially dysregulated between the cells treated with E. faecalis for 24 h and 48 h compared to the Ctrl. The analysis revealed that the proteins interacted directly or indirectly via protein networks following treatment with E. faecalis for 24 h/control (Figure 6A) and 69 proteins following treatment with E. faecalis for 48 h/control (Figure 6B). To construct a protein–protein interaction network, the software computes a score based on the best fit from the input dataset and the biological functions database. The resulting network is enriched for proteins with interactions in which the interacting proteins are represented by nodes and a line denotes their biological relationships. Protein interaction networks were identified for the proteins exhibiting differential expression profiles in the cells treated with E. faecalis for 24 h/control. The proposed highest interaction network pathway (score = 37) was related to cancer, organismal injury and abnormalities, and reproductive system disease (Figure 6A). As shown in Figure S2A, the canonical pathways were sorted by decreasing (p-value) enrichment. Death Receptor Signaling (p-value: 4.33 × 10⁻⁴; overlap: 3.2%), the MSP-RON signaling pathway (p-value: 3.67 × 10⁻³; overlap: 3.4%), ILK signaling (p-value: 3.58 × 10⁻³; overlap: 1.5%), the Glycerol-3-phosphate shuttle (p-value: 3.15 × 10⁻³; overlap: 50%), and Base Excision Repair (BER) (p-value: 2.18 × 10⁻³; overlap: 4.5%) pathway the five most interesting enriched canonical pathways. Moreover, In Figure 6B, 69 interaction networks were identified for proteins exhibiting differential expression profiles. The network pathway with the highest score (score = 34) was related to cell death and survival, cellular developmental, and cellular growth and proliferation. the canonical pathways were sorted by decreasing the log (p-value) of enrichment, such as 14-3-3-mediated signaling (p-value: 6.35 × 10⁻³; overlap: 1.6%), oxidative phosphorylation (p-value: 4.54 × 10⁻³; overlap: 1.9%), ERK/MAPK signaling (p-value: 1.76 × 10⁻²; overlap: 0.9%), glucocorticoid receptor signaling (p-value: 1.41 × 10⁻²; overlap: 0.6%), and mitochondrial dysfunction (p-value: 1.07 × 10⁻²; overlap: 1.2%), as shown in Figure S2B. A network pathway analysis was conducted to gain insight into the molecular mechanisms of the differentially expressed proteins through biological function annotations, protein–protein interaction networks, and the discovery of potential biomarkers (Figure 7).

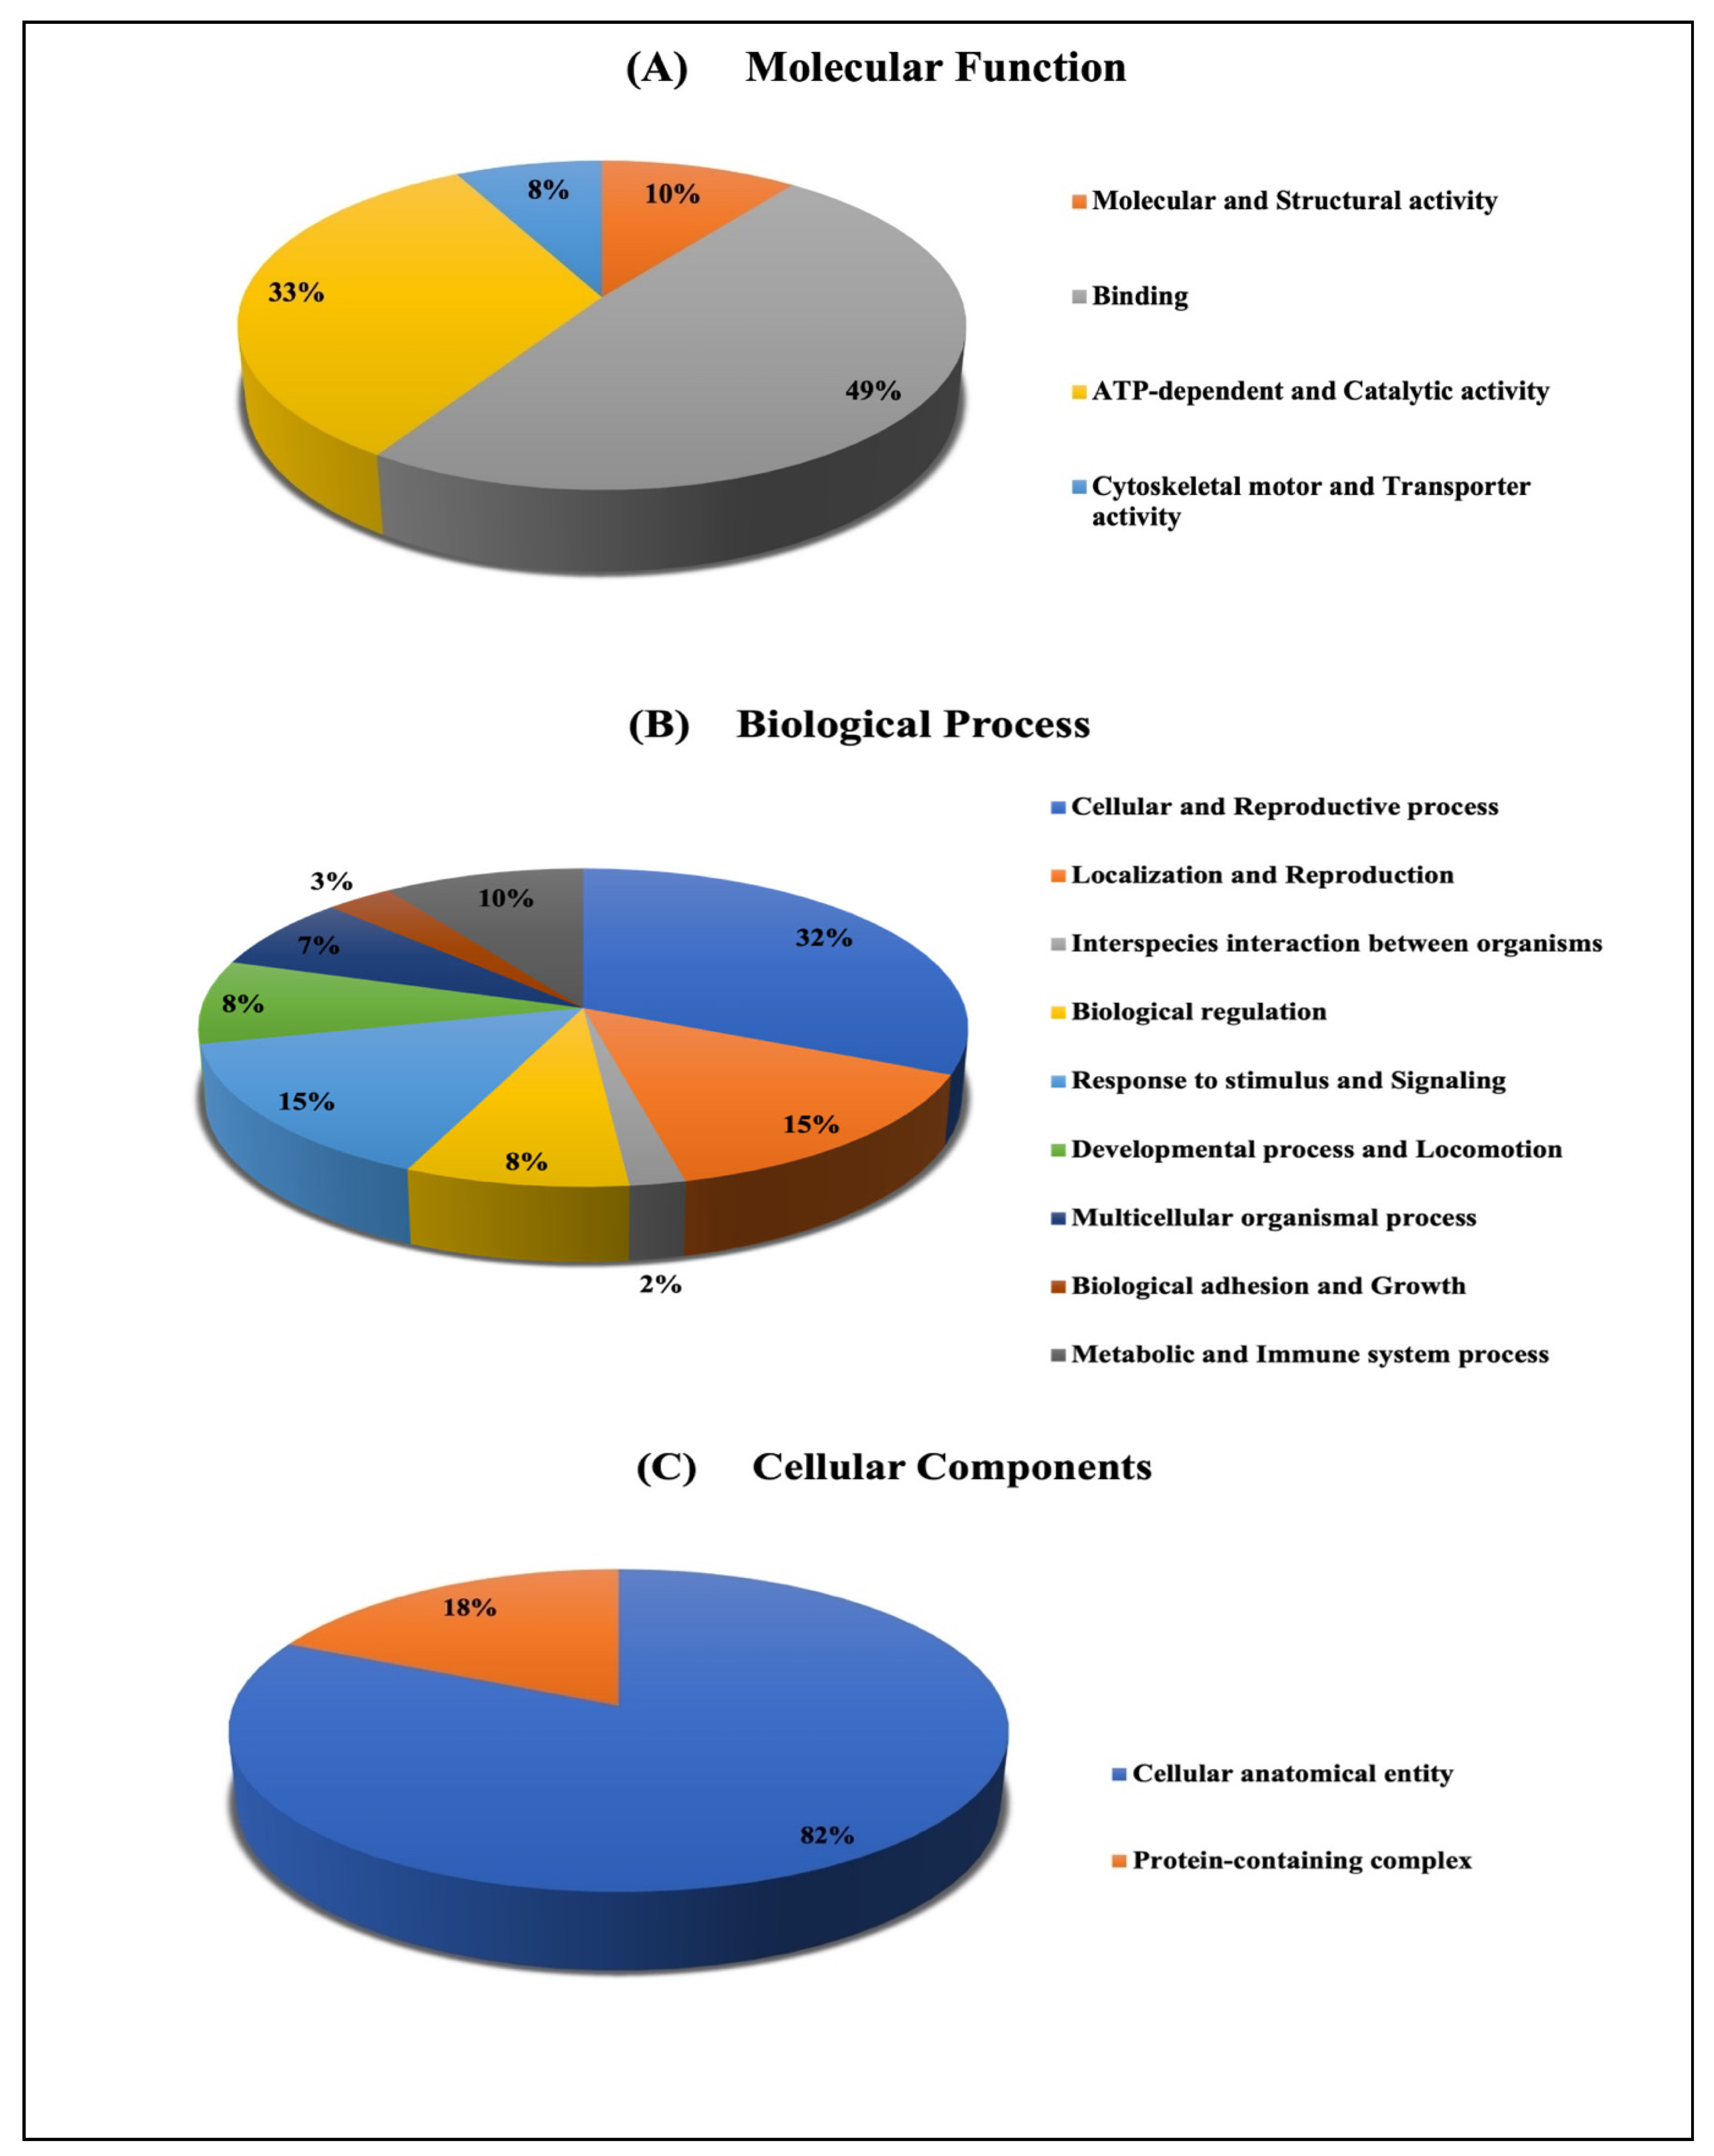
2.3.2. Classification of Key Proteins Based on Function

For the classification of the identified proteins according to their molecular function (Figure 4) and biological function, the Protein Analysis Through Evolutionary Relationships (PANTHER) system was used (Figure 7). The functional categories showed most of the differentially expressed proteins among the up- and downregulated proteins between those treated with E. faecalis for 24 h compared to the control group and those treated with E. faecalis for 48 h compared to the control groups. The molecular function determination showed multiple protein activities, including molecular and structural activities, binding activity, ATP-dependent activity, catalytic activity, cytoskeletal activity, and transporter activity (Figure 7A). Additionally, most of the identified proteins were involved in biological processes such as cellular and reproductive processes, localization, and reproduction, interspecies interactions between organisms, biological regulation and adhesion, response to stimulus, and signaling. This was followed by developmental processes, locomotion, multicellular organismal processes, biological adhesion and growth, and metabolic and immune system processes (Figure 7B). In terms of biological activities, most of the proteins were found to be involved in cellular components, for instance, the cellular anatomical entity and protein-containing complex (Figure 7C).

3. Materials and Methods

3.1. Cell and Bacterial Culture

3.1.1. Cells and Cell Culture

The cell line was obtained from the King Faisal Specialist Hospital & Research Centre. The epithelial breast cancer cell line (MCF-7) is characterized as estrogen/progesterone-positive and human epidermal growth factor receptor 2 (HER2)-negative. The cell line was cultured (1 × 10⁶ cells/mL) in plates (100 × 20 mm) using Dulbecco’s Modified Eagle’s Medium/Nutrient Mixture F-12 Ham (DMEM/F-12) as a complete medium mixed with 10% Fetal Bovine Serum (FBS), 1% L-glutamine, and 1% penicillin/streptomycin, following the manufacturer’s instructions. The cells were then incubated at 37 °C in a humidified incubator with 5% CO2 until they reached 80% confluency. The cells were then washed with Phosphate-Buffered Saline (PBS) and treated with an Enterococcus faecalis supernatant (explained below) [23,24].

3.1.2. Bacterial Culture and Preparation

Enterococcus faecalis (ATCC 29212) were grown in a Luria–Bertani (LB) broth medium and incubated at 37 °C for 24 h. The optical density (OD) of the bacterial culture was measured using a spectrophotometer (Libra S22, Biochrom Ltd., Cambridge, UK) after 24 h at a wavelength of 600 nm. The supernatant was collected after centrifugation, filtered through a 0.2 μm filter, and stored at −80 °C for further use [25,26,27]. The collected media were evaluated using the re-culture protocol to prevent potential live bacteria in the supernatant from contaminating the cell lines.

3.1.3. Indirect Bacterial Effect Using SF-CM Media on MCF-7 Cells

To investigate the indirect bacterial effect on MCF-7 cells, the cells were cultured in serum-free conditioned medium (SF-CM) (DMEM/F-12, supplemented with 0.5% FBS, 1% L-glutamine and 1% penicillin/streptomycin) for 24 h at 37 °C in 5% CO2. Next, 10% of the bacterial supernatant was mixed with each cell culture (1 × 10⁶), and non-treated cells were used as controls. The cells were incubated at 37 °C in 5% CO2 for different time periods (24 h and 48 h). Following incubation, the cells were collected using ice-cold PBS and a cell scraper (280 mm), centrifuged, and stored at −80 °C for further use, as previously described [28,29].

3.2. Proteomic Analysis

3.2.1. Protein Extraction

To perform a proteomic analysis of our samples, 50 µg of protein was extracted as previously described [19,20]. Briefly, the cells (5 million cells) were resuspended in lysis buffer (1.5 mL of a 30 mM Tris buffer with a pH of 8.8 containing 7 M urea, 2 M thiourea, 2% 3-[(3-cholamidopropyl) dimethylammonio]-1-propanesulfonate (CHAPS), and 1× protease inhibitor mix). The samples were gently rocked (20 min; room temperature) and then sonicated (30% pulse; two intervals of 1 min each separated by a 1 min gap). Then, 50 mM of dithiothreitol (DTT) was added, and the protein extracts were centrifuged (20,000× g; 40 min, 4 °C). Contaminants were removed, and the supernatants were cleaned via precipitation, using a 2D clean-up kit according to the manufacturer’s protocol (GE Healthcare, Danderyd, Sweden) [17,30].

3.2.2. Protein Labeling with Cyanine Dyes

The protein pellets were solubilized in a labeling buffer (7 M urea, 2 M thiourea, 30 mM Tris (hydroxymethyl) aminomethane hydrochloride (Tris–HCl), and 4% CHAPS at a pH of 8.5). Using centrifugation, the insoluble material was pelleted at 12,000× g at room temperature for 5 min, after which the protein concentrations were determined in triplicate using the 2D-Quana kit (GE Healthcare, Danderyd, Sweden), and the pH was adjusted to 8.5 using NaOH (100 mM). The proteins were labeled using 400 pmol of CyDye™ DIGE Fluor dyes (GE Healthcare, Danderyd, Sweden) in 1 µL of N,N-dimethylformamide (DMF) and mixed with samples containing 50 µg of protein. The samples were then incubated on ice for 30 min in the dark. The labeling reaction was terminated by adding 1 µL of 10 mM lysine. Each sample was labeled with a fluorophore, either Cy3 or Cy5. A pool containing equal amounts of protein from each sample in the experiment was labeled with Cy2 and served as an internal standard [17,30].

3.2.3. Two-Dimensional (2D) Electrophoresis, Image Scanning, and Preparative Gel

For the first dimension of separation, nine dry strips of Immobiline strips (measuring 24 cm and at a pH of 3–11; GE Healthcare, Danderyd, Sweden) were passively rehydrated (30 V; 12 h), followed by isoelectric focusing using an Ettan IPGphor IEF unit (GE Healthcare, Danderyd, Sweden). The focusing was performed at 20 °C, with 50 µA per strip. After the first dimension, the strips were equilibrated and separated on 12.5% SDS-PAGE gels using an Ettan Dalt Six device (GE Healthcare, Danderyd, Sweden). The gels were then scanned using a Sapphire Biomolecular Imager (Azure Bio systems, Dublin, OH, USA), and digitalization was performed using the image analysis software Sapphire Capture system (Azure Biosystems, Dublin, OH, USA). Preparative gels were prepared using the total protein (1 mg) obtained from a pool of equal protein amounts. The gels were then stained using Colloidal Coomassie Blue, as described previously [17,30,31].

3.2.4. Statistical Analysis

Progenesis SameSpots software (version 3.3, Nonlinear Dynamics Ltd., Newcastle, UK) was used to analyze the 2D-DIGE gel images via an automated spot-detection method. The analysis included a comparison of the samples. Moreover, to detect all spots across all gels, an automatic analysis was performed, and each selected spot was verified and manually edited wherever necessary. Normalized volumes were used to identify differentially expressed spots. Statistical significance was set at a cut-off ratio of ≥1.5-fold. Each experiment was performed in triplicate.

3.2.5. Protein Identification via Matrix-Assisted Laser Desorption/Ionization–Time-of-Flight Mass Spectrometry (MALDI-TOF-MS)

The Coomassie-Blue-stained gel spots were excised manually, washed, and digested according to a previously described protocol [17,30]. Finally, 0.8 μL of a mixture of tryptic peptides derived from each protein was spotted onto a MALDI target (384 MTP Anchorchip; 800 μm Anchorchip; Bruker Daltonics, Bremen, Germany). Spectra were acquired using a MALDI-TOF MS (UltraFlexTrem, Bruker Daltonics, Germany) device in the positive mode (target voltage—25 kV; pulsed ion extraction voltage—20 kV). The reflector voltage was set to 21 kV, and the detector voltage was set to 17 kV. The peptide mass fingerprints (PMFs) were calibrated against a standard mixture by assigning appropriate mono-isotopic masses to the peaks as follows: bradykinin (1–7), m/z 757.399; angiotensin I, m/z 1296.685; angiotensin II, m/z 1046.54; rennin-substrate, m/z 1758.93; ACTH clip (1–17), m/z 2093.086; and somatostatin, m/z 3147.471 (peptide calibration standard II, Bruker Daltonics, Germany). The MS spectra were recorded automatically across the mass range of m/z 700–3000, and the spectra were typically the sum of 400 laser shots. The PMFs were processed using Flex AnalysisTM software (version 2.4, Bruker Daltonics, Germany), and sophisticated numerical annotation procedure (SNAP) algorithms were used for peak detection (S/N—3; maximum number of peaks— 100; quality factor threshold—30). The MS data were interpreted using BioTools v3.2 (Bruker Daltonics, Germany), together with the Mascot search algorithm (version 2.0.04 updated 09/05/2020; Matrix Science Ltd., London, UK). The Mascot parameters were as follows: fixed cysteine modification with propionamide, variable modification due to methionine oxidation, one missed cleavage site (i.e., in the case of incomplete trypsin hydrolysis), and a mass tolerance of 100 ppm. Identified proteins were accepted as correct if they showed a Mascot score greater than 56 and p < 0.05, sequence coverage of at least 20%, and a minimum of four matched peptides. Not all spots of interest could be identified because some proteins were low in abundance and did not yield sufficiently intense mass fingerprints, whereas others were mixtures of multiple proteins [30,32,33].

3.2.6. Principal Component Analysis, Cluster Analysis, and Heatmap

Progenesis SameSpots software (version 3.3, Nonlinear Dynamics, Newcastle upon Tyne, UK) was used to analyze the principal components at (p ≤ 0.05 by ANOVA). The software was also used to study the different hierarchical clustering and expression profiles of the samples. A heatmap was created by taking the average of the values normalized to each spot of significant proteins. The expression-based heat map tool is available on a web server (http://heatmapper.ca/, accessed on 15 May 2023).

3.2.7. Bioinformatics Analysis

Analyses of protein interaction networks and the functions of the identified proteins were performed using Ingenuity pathway analysis (IPA) version 9.0 (Ingenuity Systems, Redwood City, CA, USA). The IPA software maps Uniport IDs into the ingenuity knowledge base, which is the largest manually curated resource combining information from all published scientific studies. This software assists in determining functions and pathways that are strongly correlated with the MS-generated protein list by overlaying the experimental expression data onto networks constructed from published interactions. Additionally, the identified proteins were classified into different categories according to their molecular function and biological function, using the PANTHER (protein analysis through evolutionary relationships) classification system (http://www.pantherdb.org, accessed on 20 May 2023) [17,30].

4. Discussion

Enterococcus faecalis is one of the most common types of Enterococcaceae found in the human microbiota. Several studies have shown that an imbalance in microbial collection may lead to cancer and tumor growth. According to a recent study, E. faecalis has the potential to suppress proliferation and induce the apoptosis of MCF-7 cells in vitro and can be used as a target for the prevention and treatment of breast cancer [34]. However, the functional analysis of and mechanism through which E. faecalis stimulates initiation and progression remain unclear and should be investigated properly. Several proteomic studies have been conducted to identify BC biomarkers and the stages of BC progression. However, these studies were unable to clearly define the relationship between BC and the role of microbiotic proteins in the progression or regression of BC. A deeper understanding of the possible underlying molecular pathways is important for the development of reliable diagnostic and prognostic biomarkers for BC. To the best of our knowledge, this study is the first to investigate an untargeted proteomic approach using 2D-DIGE coupled with MALDI-TOF mass spectrometry and a bioinformatics analysis to study the proteomic profiles of BC after treatment with E. faecalis.

4.1. Significant Upregulated and Downregulated Proteins in the Samples Treated for 24 and 48 h

The proteomics analysis yielded protein fingerprints displaying a pattern of differentially expressed proteins in the cells treated with E. faecalis for 24 h and 48 h compared to the experimental control. This study found 58 statistically significant proteins, 45 of which proteins (33 upregulated and 12 downregulated) were differentially expressed in the group treated for 24 h compared to the control group, whereas 31 proteins (16 upregulated and 15 downregulated) were differentially expressed in the group treated for 48 h compared to the control group. This illustrates the downregulation and non-significant presence of pericentrin and keratin type I cytoskeletal 27 proteins, which are responsible for cell cycle progression. Conversely, as previously demonstrated, there was an increase in 14-3-3 protein expression in the breast cancer epithelia compared to the adjacent normal epithelia. This agrees with our results, which showed elevated levels of expression in both groups compared to the control. This protein has been linked to a variety of biological processes including cell cycle progression, proliferation, and apoptosis [35].
Furthermore, in this study, several proteins were found to be upregulated in the cells treated with E. faecalis for 24 h compared to the control and then downregulated after treatment for 48 h, which may have been due to protein degradation. Keratin type I cytoskeletal 18 and nitric-oxide-synthase-inducible proteins were detected. Both proteins are involved in inflammation, such as interleukin-6 (IL-6) and interleukin-8 (IL-8). These inflammatory mediators have been shown to be associated with a high risk of the metastatic progression of breast cancer, as reported in [5,9,23]. Killin is a DNA-binding protein which is involved in cell-cycle arrest and is regulated via p53 oncogenes. A previous study suggested that the killin gene could be used as a diagnostic marker for patients with an increased lifetime risk of developing breast and thyroid cancers [36]. Likewise, transgelin is an actin-binding protein that alters the shape and structure of the cytoskeleton. Hence, the loss of transgelin gene expression might be an essential step in the development of tumors and a diagnostic indicator for breast and colon cancer [37,38]. Moreover, poly [ADP-ribose] polymerase tankyrase-2 (TNKS-2) belongs to a large family of structurally and functionally diverse proteins. Wnt signaling and apoptosis are two of the many biological activities regulated by TNKS-2. TNKS proteins are recognized by RNF146, which mediates subsequent protein degradation [39]. In addition to another protein called small heat shock protein (HSPB1), which functions as a molecular chaperone, it probably maintains denatured proteins in a folding-competent state.
Another tumor suppressor protein, coiled-coil domain-containing protein 154 (CCDC154), was found to be upregulated after 24 h of treatment with E. faecalis. The overexpression of CCDC154 significantly inhibited cell proliferation and tumor cell growth. Instead of enhancing apoptosis, CCDC154 can suppress cell growth by inducing G2/M arrest. The G2/M cell cycle arrest is a checkpoint responsible for preventing any cells with damaged DNA from lasting. These data suggest that CCDC154 is a novel cell-cycle modulator as well as a potential tumor suppressor [40]. Furthermore, the ATP-dependent RNA helicase DDX3X is a member of the DEAD-box family of RNA helicases. Several studies have shown that DDX3X is a biomarker for good prognosis in cancers. In our study, it appeared poorly in BC after 48 h of treatment with E. faecalis, and the aberrant expression of DDX3X has poor clinical outcomes in different cancers, including breast cancer. DDX3X is also known to be involved in modulating tumor proliferation, migration, invasion, and drug resistance in many types of cancer [41,42].

4.2. Functions and Interactions of Identified Proteins

Similarly, two significant proteins that could be used as cancer biomarkers were mitochondrial ATP synthases. Similar to the results of the PANTHER analysis in this study, the expressed proteins have 33% ATP-dependent molecular function activity. ATPase is a multi-subunit enzyme complex (α, β) located in the inner mitochondrial membrane and is essential for oxidative phosphorylation under physiological conditions. According to our results, ATP subunit β was elevated in both groups when compared to the control, whereas ATP subunit α was decreased in both groups. Overall, the down- or upregulation of the ATP synthase subunit appears to be part of cancer adaptation via the desensitization of cells to permeability transition and cell death. In various cancer models, ATP synthase activity is correlated with tumor growth, proliferation, and metastatic behavior [37]. However, it may also stimulate apoptosis [43,44]. Various studies have highlighted this enzyme as a novel target that needs to be further characterized for anti-cancer strategies [43,44,45]. At the protein pathway level, this study observed that the incensement of the ATP synthase catalytic subunit plays a role in promoting oxidative phosphorylation. According to our IPA conical pathway results, oxidative phosphorylation (OXPHOS) was detected with a p-value of 4.54 × 10⁻³. In cancer tumors and cells, the OXPHOS pathway can be recognized as a target for the development of novel anticancer therapies. This pathway can be targeted by small-molecule inhibitors that can inhibit metabolism and induce oxidative damage and cancer cell death [43,46,47]. Interestingly, the ATP α synthase subunit can bind to the bacterial siderophore enterobactin, which is found in human microbiota and promotes the mitochondrial accumulation of enterobactin-derived iron ions. Enterobactin is almost exclusively produced by enterobacteria to scavenge iron from the environment. The scavenging role of enterobactin is expected to have a negative impact on certain cellular processes in the host given that siderophores are key virulence mediators of pathogens [48].
Through biological function annotations, protein–protein interaction networks, and the identification of novel biomarkers, an IPA was utilized for a network pathway analysis to obtain insights into the molecular processes of differentially expressed proteins. A conical pathway analysis showed that the cluster of proteins differentially expressed between treatment with E. faecalis for 24 h versus the Ctrl identified the dysregulation of the death receptor signaling pathway, MSP-RON signaling pathway, ILK signaling, glycerol-3-phosphate shuttle, and BER pathway. In contrast, a network analysis of the group treated for 48 h compared to the Ctrl showed the involvement of 14-3-3-mediated signaling, oxidative phosphorylation, ERK/MAPK signaling, glucocorticoid receptor signaling, and mitochondrial dysfunction. It has been reported that the over-activation of ERK/MAPK plays an essential role in cell apoptosis and invasion; however, its activation may also increase cell apoptosis or the pro-oncogenic entry of other signals in breast and pancreatic cancers. The ERK/MAPK conical pathway signaling demonstrates both oncogene and tumor suppressor effects depending on the TME [41,49,50]. Similarly, the overexpression of ILK signaling has been observed to play an important role in biological processes associated with tumorigenesis, including the cell proliferation and growth of cancer cells [51].
Treatment with E. faecalis could be considered in the future for the inhibition of tumor cell growth and to induce apoptosis in patients with breast cancer similar what was observed in the breast cancer cell line. Moreover, the results of this study can be used clinically as potential biomarkers for disease prognosis.

5. Conclusions

In conclusion, the current study provides a new understanding of the molecular function of the effects of E. faecalis on breast cancer. Treatment with E. faecalis may induce apoptosis and inhibit tumor growth in a breast cancer cell line. The panels of protein markers identified in this study could be considered potential biomarkers of interest for the diagnosis of breast cancer. Further investigations are required into their utilization as therapeutic targets and prognostic markers. In addition to the vast number of potential connections between the microbiome and various breast diseases, we also sought to better understand the microbiome in the context of the prognosis and treatment of breast disease.

Supplementary Materials

The following supporting information can be downloaded at: https://www.mdpi.com/article/10.3390/ijms241914937/s1, Figure S1: Expression profiles; Figure S2: Conical pathways; Figure S3: Study workflow.

Author Contributions

M.M.A.-A., H.B. and M.A.A. conceived and designed the study; H.B., M.A.A., A.M. and A.A.A. performed the proteomic lab work; H.B., M.A.A., M.M.A.-A., R.A.-M., A.A.A. and A.M.A.R., conducted the data analysis and wrote the manuscript. All authors have read and agreed to the published version of the manuscript.

Funding

The Deputyship for Research and Innovation, “Ministry of Education” in Saudi Arabia provided funding for this research work through project no. IFKSUOR3-2-2.

Institutional Review Board Statement

Not applicable.

Informed Consent Statement

Not applicable.

Data Availability Statement

Upon reasonable request, the datasets used and/or analyzed in this study are available from the corresponding author.

Acknowledgments

The authors extend their appreciation to the Deputyship for Research and Innovation, “Ministry of Education”, in Saudi Arabia for funding this research work through project no. IFKSUOR3-2-2.

Conflicts of Interest

The authors declare no conflict of interest.

References

  1. Pleasance, E. Pan-cancer analysis of whole genomes. Nature 2020, 578, 82–93. [Google Scholar]
  2. Yang, S.-S.; Ma, S.; Dou, H.; Liu, F.; Zhang, S.-Y.; Jiang, C.; Xiao, M.; Huang, Y.-X. Breast cancer-derived exosomes regulate cell invasion and metastasis in breast cancer via miR-146a to activate cancer associated fibroblasts in tumor microenvironment. Exp. Cell Res. 2020, 391, 111983. [Google Scholar] [CrossRef] [PubMed]
  3. Chopra, S. Eleri Lloyd Davies. Breast Cancer. Med. 2020, 48, 113–118. [Google Scholar]
  4. Rontogianni, S.; Synadaki, E.; Li, B.; Liefaard, M.C.; Lips, E.H.; Wesseling, J.; Wu, W.; Altelaar, M. Proteomic profiling of extracellular vesicles allows for human breast cancer subtyping. Commun. Biol. 2019, 2, 325. [Google Scholar] [CrossRef] [PubMed]
  5. Veyssière, H.; Bidet, Y.; Penault-Llorca, F.; Radosevic-Robin, N.; Durando, X. Circulating proteins as predictive and prognostic biomarkers in breast cancer. Clin. Proteom. 2022, 19, 25. [Google Scholar] [CrossRef] [PubMed]
  6. Al-Ansari, M.M.; AlMalki, R.H.; Dahabiyeh, L.A.; Abdel Rahman, A.M. Metabolomics-microbiome crosstalk in the breast cancer microenvironment. Metabolites 2021, 11, 758. [Google Scholar] [CrossRef]
  7. Wang, B.; Xi, C.; Liu, M.; Sun, H.; Liu, S.; Song, L.; Kang, H. Breast fibroblasts in both cancer and normal tissues induce phenotypic transformation of breast cancer stem cells: A preliminary study. PeerJ 2018, 6, e4805. [Google Scholar] [CrossRef]
  8. Erdogan, B.; Webb, D.J. Cancer-associated fibroblasts modulate growth factor signaling and extracellular matrix remodeling to regulate tumor metastasis. Biochem. Soc. Trans. 2017, 45, 229–236. [Google Scholar] [CrossRef]
  9. Eiro, N.; González, L.; Martínez-Ordoñez, A.; Fernandez-Garcia, B.; González, L.O.; Cid, S.; Dominguez, F.; Perez-Fernandez, R.; Vizoso, F.J. Cancer-associated fibroblasts affect breast cancer cell gene expression, invasion and angiogenesis. Cell. Oncol. 2018, 41, 369–378. [Google Scholar] [CrossRef]
  10. Thompson, K.J.; Ingle, J.N.; Tang, X.; Chia, N.; Jeraldo, P.R.; Walther-Antonio, M.R.; Kandimalla, K.K.; Johnson, S.; Yao, J.Z.; Harrington, S.C. A comprehensive analysis of breast cancer microbiota and host gene expression. PLoS ONE 2017, 12, e0188873. [Google Scholar] [CrossRef]
  11. Fernández, M.F.; Reina-Pérez, I.; Astorga, J.M.; Rodríguez-Carrillo, A.; Plaza-Díaz, J.; Fontana, L. Breast cancer and its relationship with the microbiota. Int. J. Environ. Res. Public Health 2018, 15, 1747. [Google Scholar] [CrossRef] [PubMed]
  12. Urbaniak, C.; Gloor, G.B.; Brackstone, M.; Scott, L.; Tangney, M.; Reid, G. The microbiota of breast tissue and its association with breast cancer. Appl. Environ. Microbiol. 2016, 82, 5039–5048. [Google Scholar] [CrossRef] [PubMed]
  13. Hieken, T.J.; Chen, J.; Hoskin, T.L.; Walther-Antonio, M.; Johnson, S.; Ramaker, S.; Xiao, J.; Radisky, D.C.; Knutson, K.L.; Kalari, K.R. The microbiome of aseptically collected human breast tissue in benign and malignant disease. Sci. Rep. 2016, 6, 30751. [Google Scholar] [CrossRef] [PubMed]
  14. Banerjee, S.; Tian, T.; Wei, Z.; Shih, N.; Feldman, M.D.; Peck, K.N.; DeMichele, A.M.; Alwine, J.C.; Robertson, E.S. Distinct microbial signatures associated with different breast cancer types. Front. Microbiol. 2018, 9, 951. [Google Scholar] [CrossRef] [PubMed]
  15. Bøhle, L.A.; Riaz, T.; Egge-Jacobsen, W.; Skaugen, M.; Busk, Ø.L.; Eijsink, V.G.; Mathiesen, G. Identification of surface proteins in Enterococcus faecalis V583. BMC Genom. 2011, 12, 135. [Google Scholar] [CrossRef]
  16. Nami, Y.; Abdullah, N.; Haghshenas, B.; Radiah, D.; Rosli, R.; Yari Khosroushahi, A. A newly isolated probiotic Enterococcus faecalis strain from vagina microbiota enhances apoptosis of human cancer cells. J. Appl. Microbiol. 2014, 117, 498–508. [Google Scholar] [CrossRef]
  17. Alfadda, A.A.; Masood, A.; Al-Naami, M.Y.; Chaurand, P.; Benabdelkamel, H. A proteomics based approach reveals differential regulation of visceral adipose tissue proteins between metabolically healthy and unhealthy obese patients. Mol. Cells 2017, 40, 685. [Google Scholar]
  18. Zhou, J.; Wang, W.; Xie, Y.; Zhao, Y.; Chen, X.; Xu, W.; Wang, Y.; Guan, Z. Proteomics-based identification and analysis of proteins associated with Helicobacter pylori in gastric cancer. PLoS ONE 2016, 11, e0146521. [Google Scholar] [CrossRef]
  19. Risha, Y.; Minic, Z.; Ghobadloo, S.M.; Berezovski, M.V. The proteomic analysis of breast cell line exosomes reveals disease patterns and potential biomarkers. Sci. Rep. 2020, 10, 13572. [Google Scholar] [CrossRef]
  20. Benabdelkamel, H.; Rafiullah, M.; Masood, A.; Alsaif, A.; Musambil, M.; Alfadda, A.A. Proteomic profiling of thyroid tissue in patients with obesity and benign diffuse goiter. Front. Endocrinol. 2022, 13, 923465. [Google Scholar] [CrossRef]
  21. Kuczynski, J.; Lauber, C.L.; Walters, W.A.; Parfrey, L.W.; Clemente, J.C.; Gevers, D.; Knight, R. Experimental and analytical tools for studying the human microbiome. Nat. Rev. Genet. 2012, 13, 47–58. [Google Scholar] [CrossRef]
  22. AlMalki, R.H.; Sebaa, R.; Al-Ansari, M.M.; Al-Alwan, M.; Alwehaibi, M.A.; Rahman, A.M.A.E. E. coli Secretome Metabolically Modulates MDA-MB-231 Breast Cancer Cells’ Energy Metabolism. Int. J. Mol. Sci. 2023, 24, 4219. [Google Scholar] [CrossRef]
  23. Al-Ansari, M.M.; Aboussekhra, A. miR-146b-5p mediates p16-dependent repression of IL-6 and suppresses paracrine procarcinogenic effects of breast stromal fibroblasts. Oncotarget 2015, 6, 30006. [Google Scholar] [CrossRef]
  24. Alghanem, B.; Ali, R.; Nehdi, A.; Al Zahrani, H.; Altolayyan, A.; Shaibah, H.; Baz, O.; Alhallaj, A.; Moresco, J.J.; Diedrich, J.K. Proteomics Profiling of KAIMRC1 in Comparison to MDA-MB231 and MCF-7. Int. J. Mol. Sci. 2020, 21, 4328. [Google Scholar] [CrossRef]
  25. Rabiei, P.; Mohabatkar, H.; Behbahani, M. Studying the effects of several heat-inactivated bacteria on colon and breast cancer cells. Mol. Biol. Res. Commun. 2019, 8, 91. [Google Scholar]
  26. Bermudez-Brito, M.; Munoz-Quezada, S.; Gomez-Llorente, C.; Matencio, E.; Bernal, M.J.; Romero, F.; Gil, A. Cell-free culture supernatant of Bifidobacterium breve CNCM I-4035 decreases pro-inflammatory cytokines in human dendritic cells challenged with Salmonella typhi through TLR activation. PLoS ONE 2013, 8, e59370. [Google Scholar] [CrossRef] [PubMed]
  27. Kouitcheu Mabeku, L.B.; Ngue, S.; Bonsou Nguemo, I.; Leundji, H. Potential of selected lactic acid bacteria from Theobroma cacao fermented fruit juice and cell-free supernatants from cultures as inhibitors of Helicobacter pylori and as good probiotic. BMC Res. Notes 2020, 13, 64. [Google Scholar] [CrossRef] [PubMed]
  28. Chiba, A.; Bawaneh, A.; Velazquez, C.; Clear, K.Y.; Wilson, A.S.; Howard-McNatt, M.; Levine, E.A.; Levi-Polyachenko, N.; Yates-Alston, S.A.; Diggle, S.P. Neoadjuvant chemotherapy shifts breast tumor microbiota populations to regulate drug responsiveness and the development of metastasis. Mol. Cancer Res. 2020, 18, 130–139. [Google Scholar] [CrossRef] [PubMed]
  29. Al-Ansari, M.M.; Al-Saif, M.; Arafah, M.; Eldali, A.M.; Tulbah, A.; Al-Tweigeri, T.; Semlali, A.; Khabar, K.S.; Aboussekhra, A. Clinical and functional significance of tumor/stromal ATR expression in breast cancer patients. Breast Cancer Res. 2020, 22, 49. [Google Scholar] [CrossRef] [PubMed]
  30. Benabdelkamel, H.; Masood, A.; Almidani, G.M.; Alsadhan, A.A.; Bassas, A.F.; Duncan, M.W.; Alfadda, A.A. Mature adipocyte proteome reveals differentially altered protein abundances between lean, overweight and morbidly obese human subjects. Mol. Cell. Endocrinol. 2015, 401, 142–154. [Google Scholar] [CrossRef]
  31. Shevchenko, A.; Wilm, M.; Vorm, O.; Mann, M. Mass spectrometric sequencing of proteins from silver-stained polyacrylamide gels. Anal. Chem. 1996, 68, 850–858. [Google Scholar] [CrossRef] [PubMed]
  32. Masood, A.; Benabdelkamel, H.; Ekhzaimy, A.A.; Alfadda, A.A. Plasma-based proteomics profiling of patients with hyperthyroidism after antithyroid treatment. Molecules 2020, 25, 2831. [Google Scholar] [CrossRef]
  33. Benabdelkamel, H.; Masood, A.; Okla, M.; Al-Naami, M.Y.; Alfadda, A.A. A proteomics-based approach reveals differential regulation of urine proteins between metabolically healthy and unhealthy obese patients. Int. J. Mol. Sci. 2019, 20, 4905. [Google Scholar] [CrossRef] [PubMed]
  34. Hassan, Z.; Mustafa, S.; Rahim, R.A.; Isa, N.M. Anti-breast cancer effects of live, heat-killed and cytoplasmic fractions of Enterococcus faecalis and Staphylococcus hominis isolated from human breast milk. Vitr. Cell. Dev. Biol.-Anim. 2016, 52, 337–348. [Google Scholar] [CrossRef]
  35. Hudelist, G.; Singer, C.F.; Pischinger, K.I.; Kaserer, K.; Manavi, M.; Kubista, E.; Czerwenka, K.F. Proteomic analysis in human breast cancer: Identification of a characteristic protein expression profile of malignant breast epithelium. Proteomics 2006, 6, 1989–2002. [Google Scholar] [CrossRef] [PubMed]
  36. Ng, E.K.; Shin, V.Y.; Leung, C.P.; Chan, V.W.; Law, F.B.; Siu, M.T.; Lang, B.H.; Ma, E.S.; Kwong, A. Elevation of methylated DNA in KILLIN/PTEN in the plasma of patients with thyroid and/or breast cancer. OncoTargets Ther. 2014, 7, 2085–2092. [Google Scholar]
  37. Akkour, K.; Alanazi, I.O.; Alfadda, A.A.; Alhalal, H.; Masood, A.; Musambil, M.; Rahman, A.M.A.; Alwehaibi, M.A.; Arafah, M.; Bassi, A. Tissue-Based Proteomic Profiling in Patients with Hyperplasia and Endometrial Cancer. Cells 2022, 11, 2119. [Google Scholar] [CrossRef]
  38. Shields, J.M.; Rogers-Graham, K.; Der, C.J. Loss of transgelin in breast and colon tumors and in RIE-1 cells by Ras deregulation of gene expression through Raf-independent pathways. J. Biol. Chem. 2002, 277, 9790–9799. [Google Scholar] [CrossRef]
  39. Eisemann, T.; Pascal, J.M. Poly (ADP-ribose) polymerase enzymes and the maintenance of genome integrity. Cell. Mol. Life Sci. 2020, 77, 19–33. [Google Scholar] [CrossRef]
  40. Liao, W.; Zhao, R.; Lu, L.; Zhang, R.; Zou, J.; Xu, T.; Wu, C.; Tang, J.; Deng, Y.; Lu, X. Overexpression of a novel osteopetrosis-related gene CCDC154 suppresses cell proliferation by inducing G2/M arrest. Cell Cycle 2012, 11, 3270–3279. [Google Scholar] [CrossRef]
  41. Liu, R.; Liu, T.; Wei, W.; Guo, K.; Yang, N.; Tian, S.; Zhu, J.; Liu, Y.; Zhou, W.; Yang, H. Novel interacting proteins identified by tandem affinity purification coupled to nano LC–MS/MS interact with ribosomal S6 protein kinase 4 (RSK4) and its variant protein (RSK4m). Int. J. Biol. Macromol. 2017, 96, 421–428. [Google Scholar] [CrossRef] [PubMed]
  42. Lin, T.-C. DDX3X multifunctionally modulates tumor progression and serves as a prognostic indicator to predict cancer outcomes. Int. J. Mol. Sci. 2019, 21, 281. [Google Scholar] [CrossRef] [PubMed]
  43. Galber, C.; Acosta, M.J.; Minervini, G.; Giorgio, V. The role of mitochondrial ATP synthase in cancer. Biol. Chem. 2020, 401, 1199–1214. [Google Scholar] [CrossRef]
  44. Wang, T.; Ma, F.; Qian, H.-L. Defueling the cancer: ATP synthase as an emerging target in cancer therapy. Mol. Ther.-Oncolytics 2021, 23, 82–95. [Google Scholar] [CrossRef] [PubMed]
  45. Speransky, S.; Serafini, P.; Caroli, J.; Bicciato, S.; Lippman, M.; Bishopric, N. A novel RNA aptamer identifies plasma membrane ATP synthase beta subunit as an early marker and therapeutic target in aggressive cancer. Breast Cancer Res. Treat. 2019, 176, 271–289. [Google Scholar] [CrossRef] [PubMed]
  46. Nayak, A.P.; Kapur, A.; Barroilhet, L.; Patankar, M.S. Oxidative phosphorylation: A target for novel therapeutic strategies against ovarian cancer. Cancers 2018, 10, 337. [Google Scholar] [CrossRef]
  47. Huang, Y.-J.; Jan, Y.-H.; Chang, Y.-C.; Tsai, H.-F.; Wu, A.T.; Chen, C.-L.; Hsiao, M. ATP synthase subunit epsilon overexpression promotes metastasis by modulating AMPK signaling to induce epithelial-to-mesenchymal transition and is a poor prognostic marker in colorectal cancer patients. J. Clin. Med. 2019, 8, 1070. [Google Scholar] [CrossRef]
  48. Qi, B.; Han, M. Microbial siderophore enterobactin promotes mitochondrial iron uptake and development of the host via interaction with ATP synthase. Cell 2018, 175, 571–582.e11. [Google Scholar] [CrossRef]
  49. Lee, K.Y.; Bignone, P.A.; Ganesan, T.S. p90 Ribosomal S6 kinases-eclectic members of the human kinome. Signal Transduct. 2007, 7, 225–239. [Google Scholar] [CrossRef]
  50. Yun, C.W.; Kim, H.J.; Lim, J.H.; Lee, S.H. Heat shock proteins: Agents of cancer development and therapeutic targets in anti-cancer therapy. Cells 2019, 9, 60. [Google Scholar] [CrossRef]
  51. Qu, Y.; Hao, C.; Xu, J.; Cheng, Z.; Wang, W.; Liu, H. ILK promotes cell proliferation in breast cancer cells by activating the PI3K/Akt pathway. Mol. Med. Rep. 2017, 16, 5036–5042. [Google Scholar] [CrossRef]
Figure 1. Representative fluorescent proteins of two-dimensional difference in gel electrophoresis (2D-DIGE). (A) Control, consisting of non-treated MCF-7 cells labeled with Cy3, (B) MCF-7 cells treated with E. faecalis for 24 h and labeled with Cy5, (C) MCF-7 cells treated for 48 h and labeled with Cy5, and (D) pooled internal control labeled with Cy2.
Ijms 24 14937 g001
Figure 2. Merged 2D-DIGE gels of all samples. Fluorescent protein demonstrative of the two-dimensional difference in gel electrophoresis (2D-DIGE) in merged images labeled with Cy3, Cy5, and Cy2.
Ijms 24 14937 g002
Figure 3. Indicated protein spots. A representative 2D-DIGE gel with numbered spots indicating differentially abundant proteins (defined as a fold change ≥ 1.5, p ≤ 0.05) treated with E. faecalis for 24 or 48 h compared to the control, identified via matrix-assisted laser desorption/ionization–time-of-flight mass spectrometry (MALDI-TOF-MS). MW—protein molecular weight; pI—isoelectric point.
Ijms 24 14937 g003
Figure 4. Principal component analysis of the proteomic dataset. Pink dots represent control samples, blue dots represent treated MCF-7 cells after 24 h, and purple dots indicate treated MCF-7 cells after 48 h. This explained 50.30% of the selected spot variability values. Colored dots and numbers indicate the gels and spots, respectively.
Ijms 24 14937 g004
Figure 5. Heatmap representation of the differentially expressed protein spots. Interactive protein expression in treated MCF-7 cells (24 h and 48 h) and their relative control.
Ijms 24 14937 g005
Figure 6. Protein interaction analysis and biological pathways related to significantly identified proteins. The most enriched interaction network of differentially expressed proteins between different groups. (A) Interaction network of differentially expressed proteins in cells treated with E. faecalis for 24 h compared with the control. The central nodes of the pathway related to TP53, HDAC 1, and BAD signaling were found to be dysregulated between the two states. The highest interaction network pathway (score = 37). Red nodes indicate upregulated proteins; green nodes indicate downregulated proteins; uncolored nodes were proposed via an IPA. Solid lines indicate direct molecular interactions, and dashed lines represent indirect interactions. (B) Interaction network of differentially expressed proteins in cells treated with E. faecalis for 48 h compared to the control. The central nodes of the pathway related to HSPB1, RELA, and P glycoprotein signaling were found to be upregulated between the two states. The highest interaction network pathway (score = 34).
Ijms 24 14937 g006
Figure 7. Comparative depiction of the differentially abundant proteins, categorized into groups according to their molecular function (A), biological process (B), and (C) proteins, according to their cellular components in the groups treated for 24 h and 48 h compared to the control.
Ijms 24 14937 g007
Table 1. Proteins identified to show changes in abundance after the treatment with E. faecalis for 24 h and 48 h compared to the control. Different values for the average ratio between the two states, with their corresponding levels of fold change and one-way ANOVA (p ≤ 0.05) using 2D-DIGE (analysis type: MALDI-TOF; database: SwissProt; taxonomy: homospines).
#Spot No aProtein NameMASCOT IDRatio 24/C bExp cRatio 48/C bExp cp Value d
1309Zinc finger protein 616ZN616_HUMAN−1.5DOWN−2.7DOWN0.003
2641Nitric oxide synthase, inducibleNOS2_HUMAN1.5UP−1NS0.003
3652TransgelinTAGL_HUMAN1.5UP−1.1NS0.004
4644Tektin-2TEKT2_HUMAN−1.5DOWN−1.9DOWN0.004
5827Egl nine homolog 1EGLN1_HUMAN1.2NS1.2NS0.01
6682Dynein axonemal heavy chain 10DYH10_HUMAN1.7UP1.2NS0.01
7828Twinfilin-2TWF2_HUMAN3.2UP−1.1NS0.01
8899Spectrin beta chain, non-erythrocytic 5SPTN5_HUMAN1.2NS−1.2NS0.01
9655Keratin, type I cytoskeletal 18K1C18_HUMAN1.5UP1.2NS0.01
10896Cytochrome c oxidase subunit 5A, mitochondrialCOX5A_HUMAN−1NS−1.9DOWN0.01
11365MICOS complex subunit MIC60MIC60_HUMAN−2.1DOWN−2.4DOWN0.01
12428Coiled-coil domain-containing protein 154CC154_HUMAN2UP1.4NS0.01
13606PlectinPLEC1_HUMAN1.5UP1.5UP0.02
14686Zinc finger protein 600ZN600_HUMAN1.8UP1.2NS0.02
15692Putative uncharacterized protein encoded by LINC02694CO053_HUMAN1.6UP1.2NS0.02
16674Centriole and centriolar satellite protein OFD1OFD1_HUMAN1.5UP1.5UP0.02
17696Protein maelstrom homologMAEL_HUMAN1.6UP1.1NS0.02
18786Prohibitin 1PHB_HUMAN1.6UP1.6UP0.02
19603Microtubule-associated protein 6MAP6_HUMAN1.5UP−1.1NS0.02
20767Cartilage matrix proteinMATN1_HUMAN1.5UP1.2NS0.02
21581ATP synthase subunit beta, mitochondrialATPB_HUMAN1.5UP1.5UP0.02
22779Keratin, type I cytoskeletal 10K1C10_HUMAN1.1NS1.5UP0.03
23465Tubulin beta chainTBB5_HUMAN−1.5DOWN−1.5DOWN0.03
24605Poly [ADP-ribose] polymerase tankyrase-2TNKS2_HUMAN1.6UP−1DOWN0.03
25409Replication factor C subunit 1RFC1_HUMAN−1.5DOWN−1NS0.03
2641960 kDa heat shock protein, mitochondrialCH60_HUMAN−1.5DOWN−1.2NS0.03
27453Ankyrin repeat domain-containing protein 6ANKR6_HUMAN−1.5DOWN−1.9DOWN0.03
28695AN1-type zinc finger protein 3ZFAN3_HUMAN1.7UP1.2NS0.04
29362AN1-type zinc finger protein 3ZFAN3_HUMAN−1.1NS−1.7DOWN0.04
30637Actin, cytoplasmic 2ACTG_HUMAN1.5UP1.2NS0.04
3179114-3-3 protein zeta/delta1433Z_HUMAN1.8UP1.6UP0.04
32678N-acyl-aromatic-L-amino acid amidohydrolase (carboxylate-forming)ACY3_HUMAN1.7UP1.1NS0.04
33386Dynein axonemal heavy chain 9DYH9_HUMAN−1.5DOWN−1.7DOWN0.04
34677Forkhead-associated domain-containing protein 1FHAD1_HUMAN1.2NS2.3UP0.05
35847Keratin, type I cytoskeletal 27K1C27_HUMAN−1.2NS−1.5DOWN0.05
36680Plakophilin-2PKP2_HUMAN−1NS1.5UP0.05
37601Methyl-CpG-binding domain protein 4MBD4_HUMAN−1.5DOWN1.5UP0.05
38665Ribosomal protein S6 kinase alpha-6KS6A6_HUMAN1.5UP1.1NS0.05
39642Glycerol-3-phosphate dehydrogenase, mitochondrialGPDM_HUMAN1.5UP−1.1NS0.05
40814Heat shock protein beta-1HSPB1_HUMAN1.5UP1.8UP0.05
41612Actin, cytoplasmic 2ACTG_HUMAN1.5UP1.2NS0.05
42691KillinKILIN_HUMAN1.5UP1.1NS0.05
43799NCK-interacting protein with SH3 domainSPN90_HUMAN1.1NS1.5UP0.05
44449Protein tyrosine phosphatase domain-containing protein 1PTPC1_HUMAN1.5UP1.1NS0.05
45707Retinol dehydrogenase 13RDH13_HUMAN1.8UP1.2NS0.05
46414PericentrinPCNT_HUMAN−1.5DOWN−1.2NS0.05
47334SciellinSCEL_HUMAN−1.2NS−2.3DOWN0.05
48423Protein disulfide-isomerasePDIA1_HUMAN2.3UP4UP0.05
49460Myosin-7MYH7_HUMAN−1.6DOWN−1.8DOWN0.05
5080428S ribosomal protein S18c, mitochondrialRT18C_HUMAN2UP1.5UP0.05
51393ATP synthase subunit alpha, mitochondrialATPA_HUMAN−1.6DOWN−1.5DOWN0.05
52438AN1-type zinc finger protein 3ZFAN3_HUMAN1.5UP1.2NS0.05
53912ATP-dependent RNA helicase DDX3XDDX3X_HUMAN1.1NS−1.5DOWN0.05
5454760 kDa heat shock protein, mitochondrialCH60_HUMAN1.1NS1.5UP0.05
55790Probable ATP-dependent RNA helicase DDX60DDX60_HUMAN1.5UP1.6UP0.05
56792Myosin-13MYH13_HUMAN1.5UP1.8UP0.05
5748760 kDa heat shock protein, mitochondrialCH60_HUMAN−1.3DOWN−1.3DOWN0.05
58635Myosin-4MYH4_HUMAN1.5UP1.2NS0.05
a Protein accession number for the SWISSPROT Database. b Ratio between the groups, UP = upregulation; Down = downregulation; NS = non-significant. c Protein expression between the groups. d p-Value (ANOVA).
Disclaimer/Publisher’s Note: The statements, opinions and data contained in all publications are solely those of the individual author(s) and contributor(s) and not of MDPI and/or the editor(s). MDPI and/or the editor(s) disclaim responsibility for any injury to people or property resulting from any ideas, methods, instructions or products referred to in the content.

