
The Effect of Glucose on the Interaction of Bisphenol A and Bovine Hemoglobin Characterized by Spectroscopic and Molecular Docking Techniques

Abstract
:1. Introduction
2. Results and Discussion
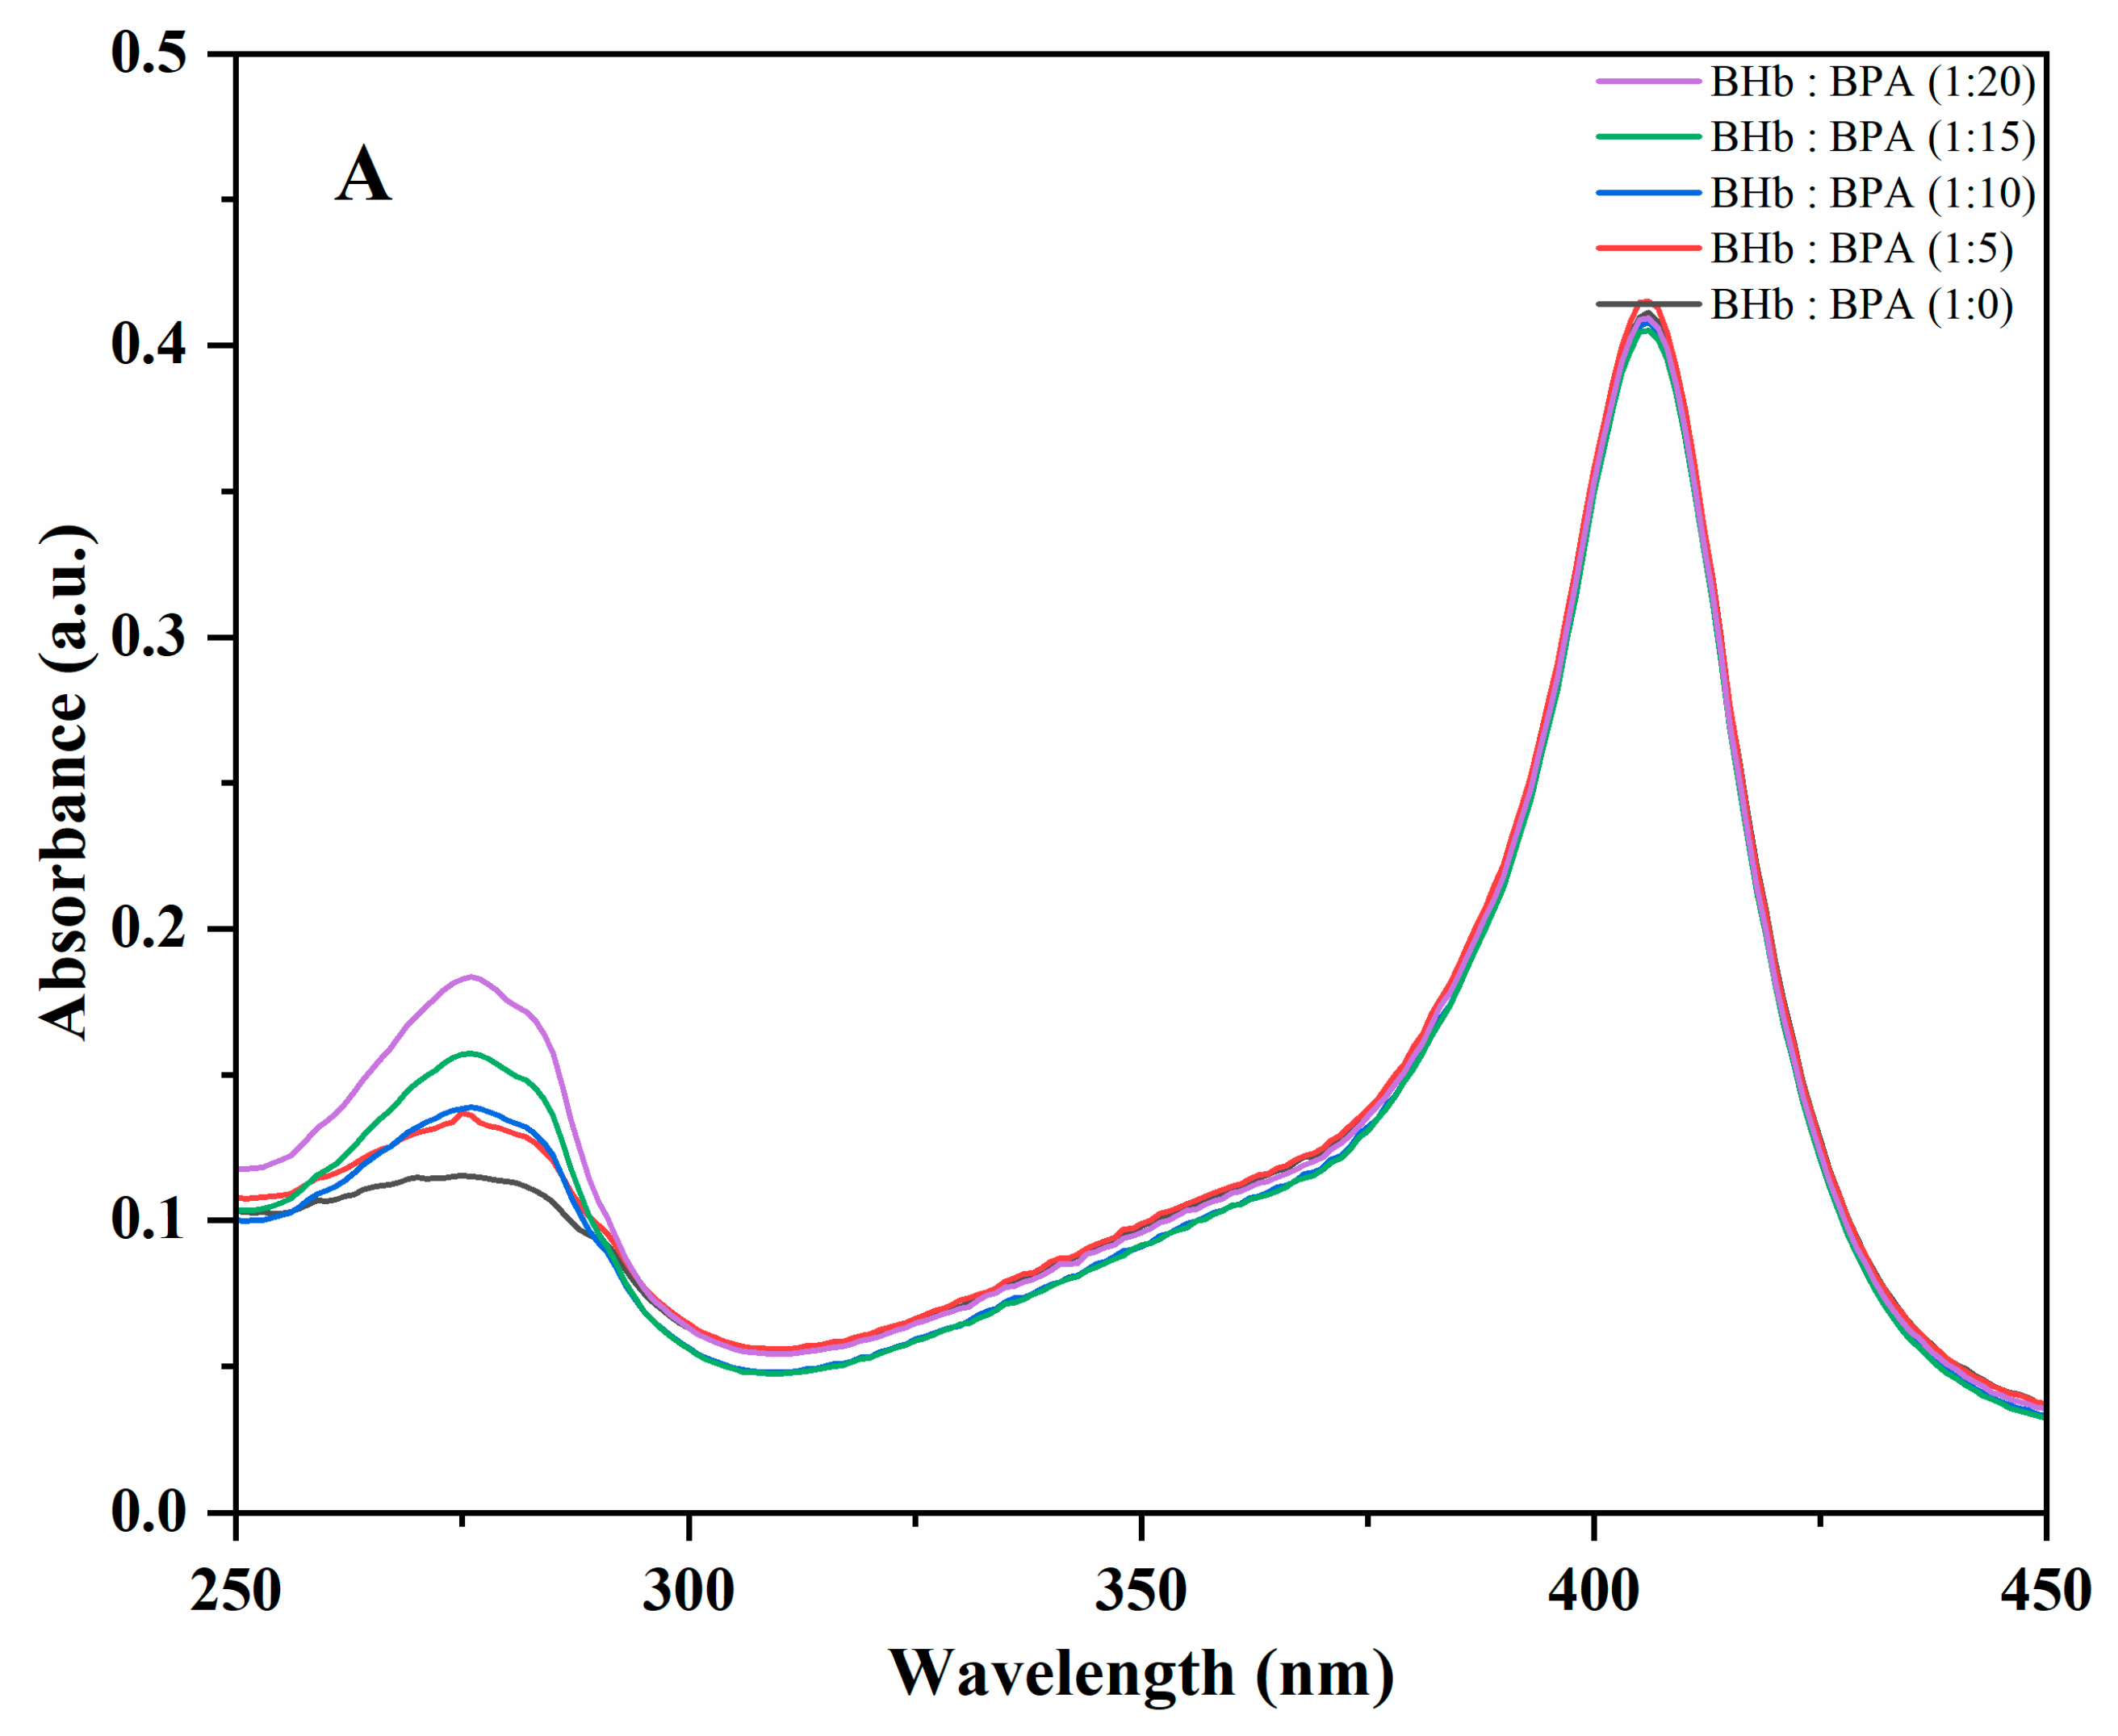
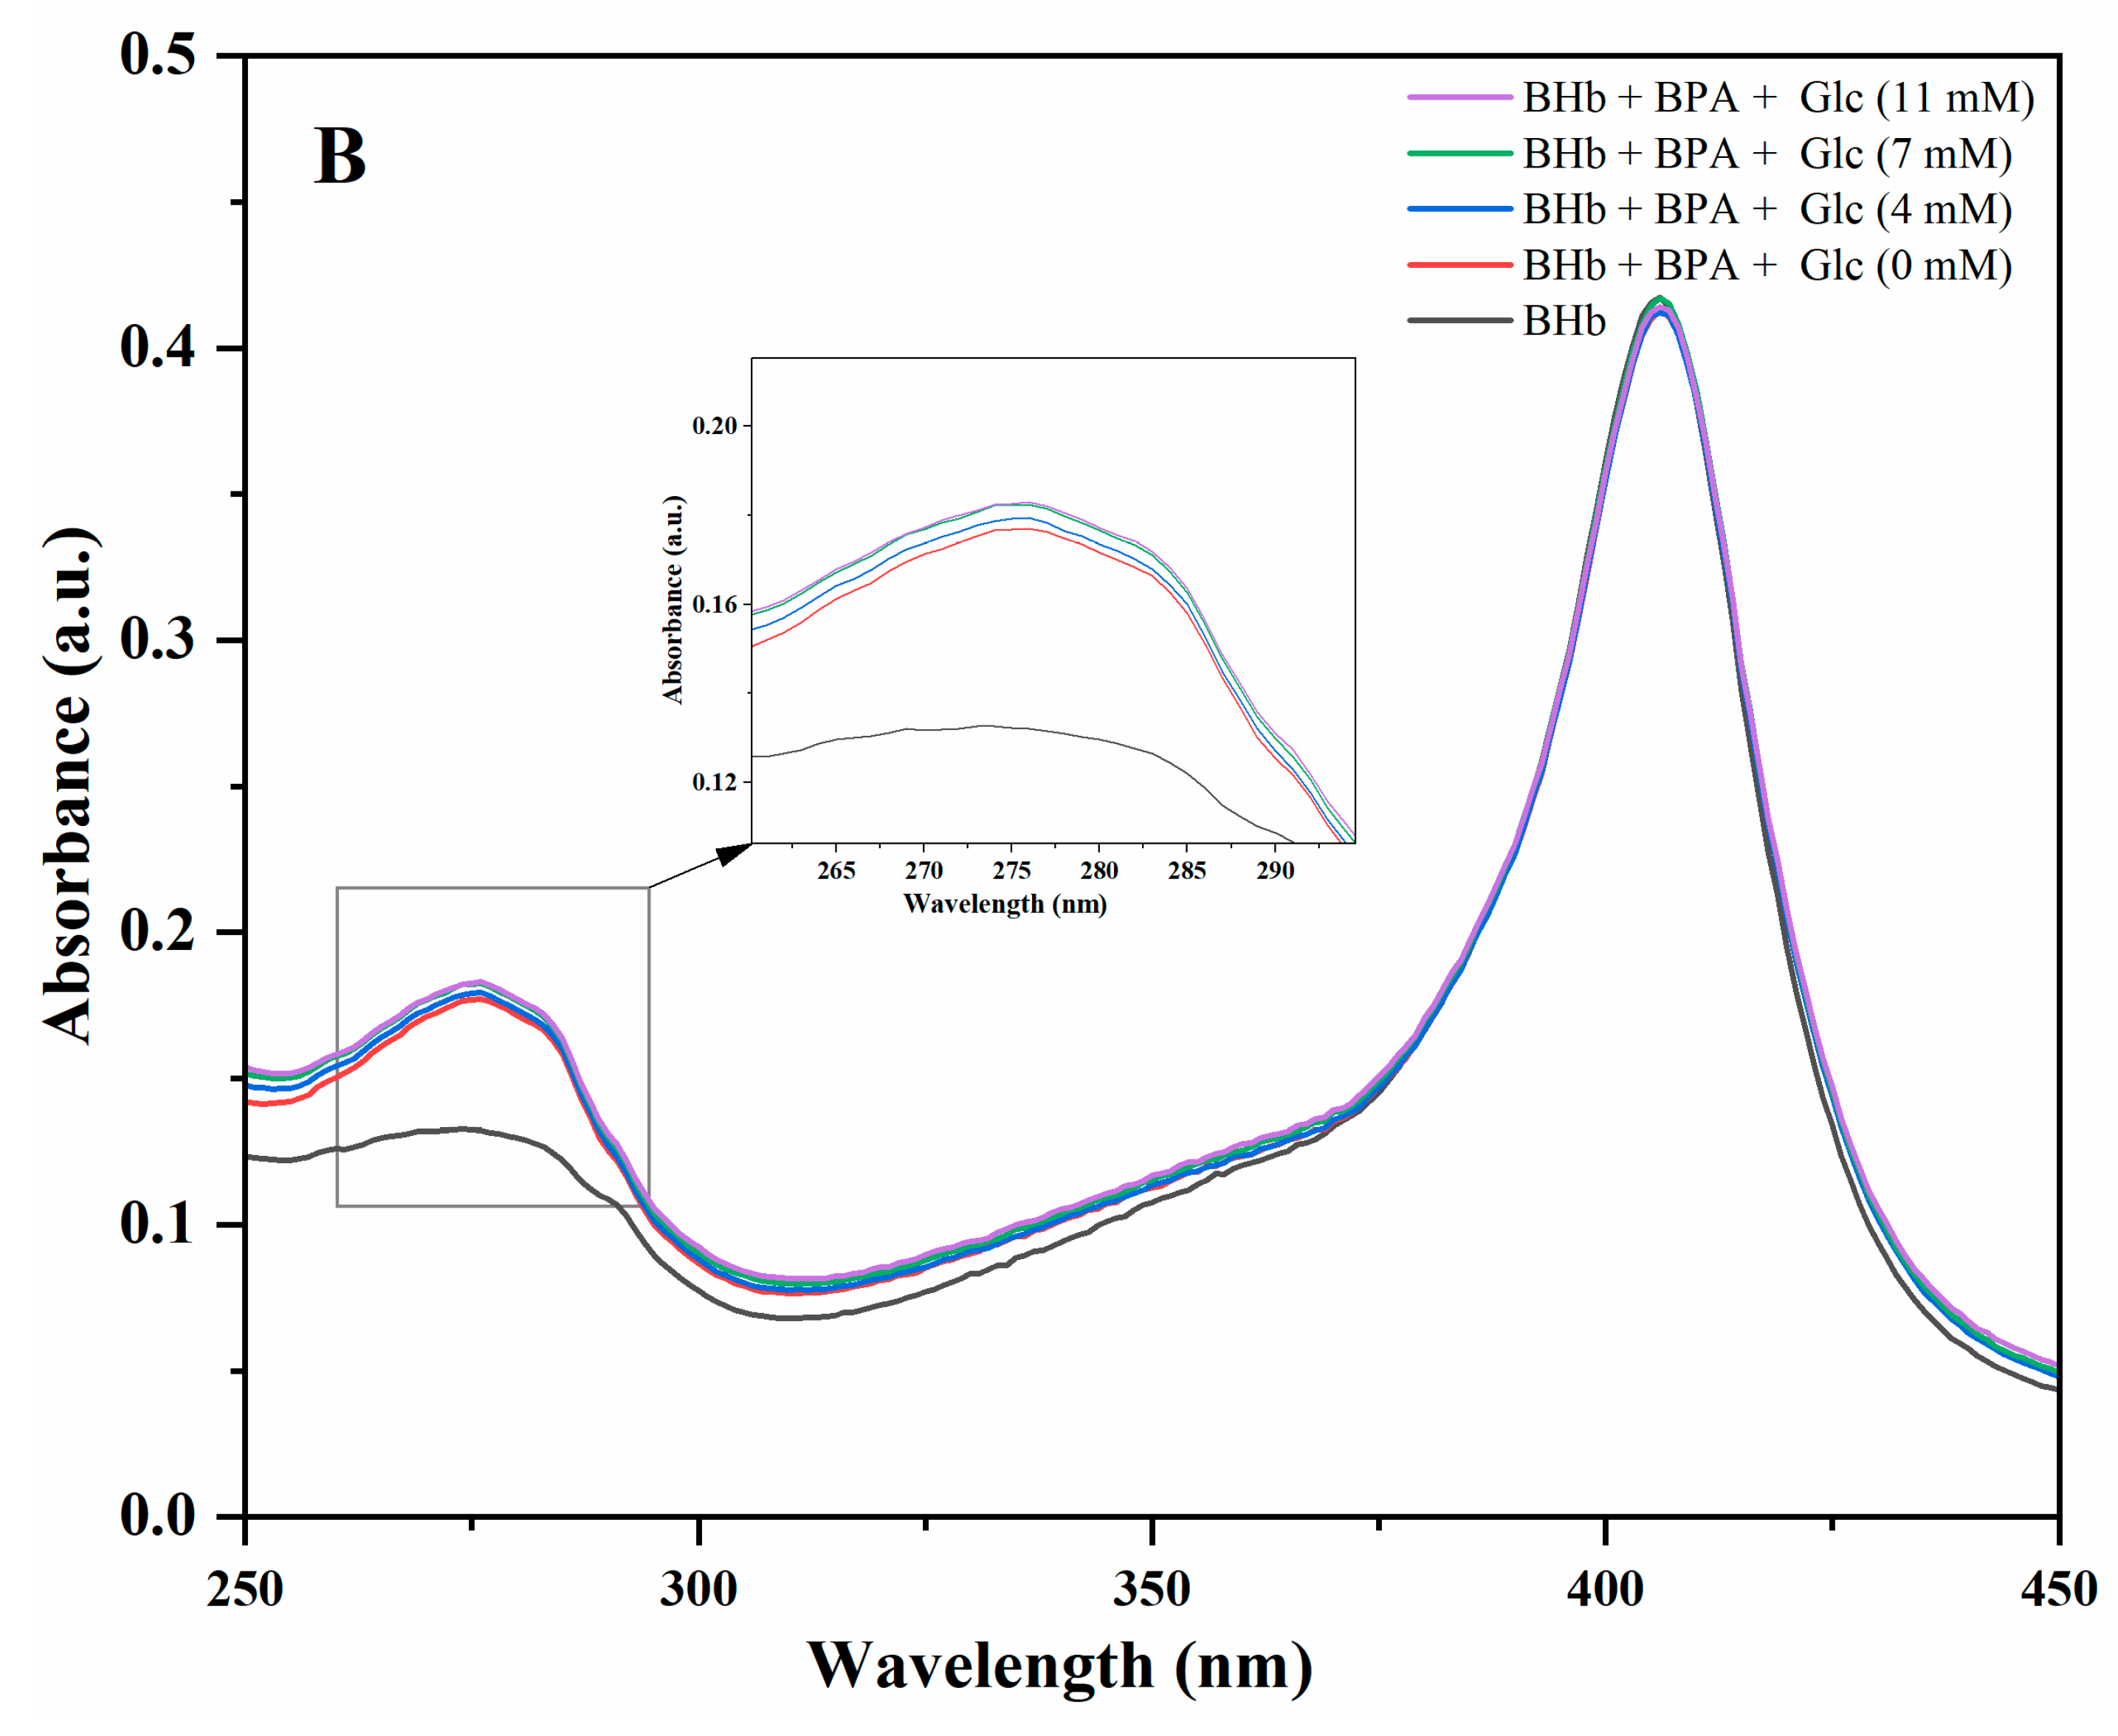
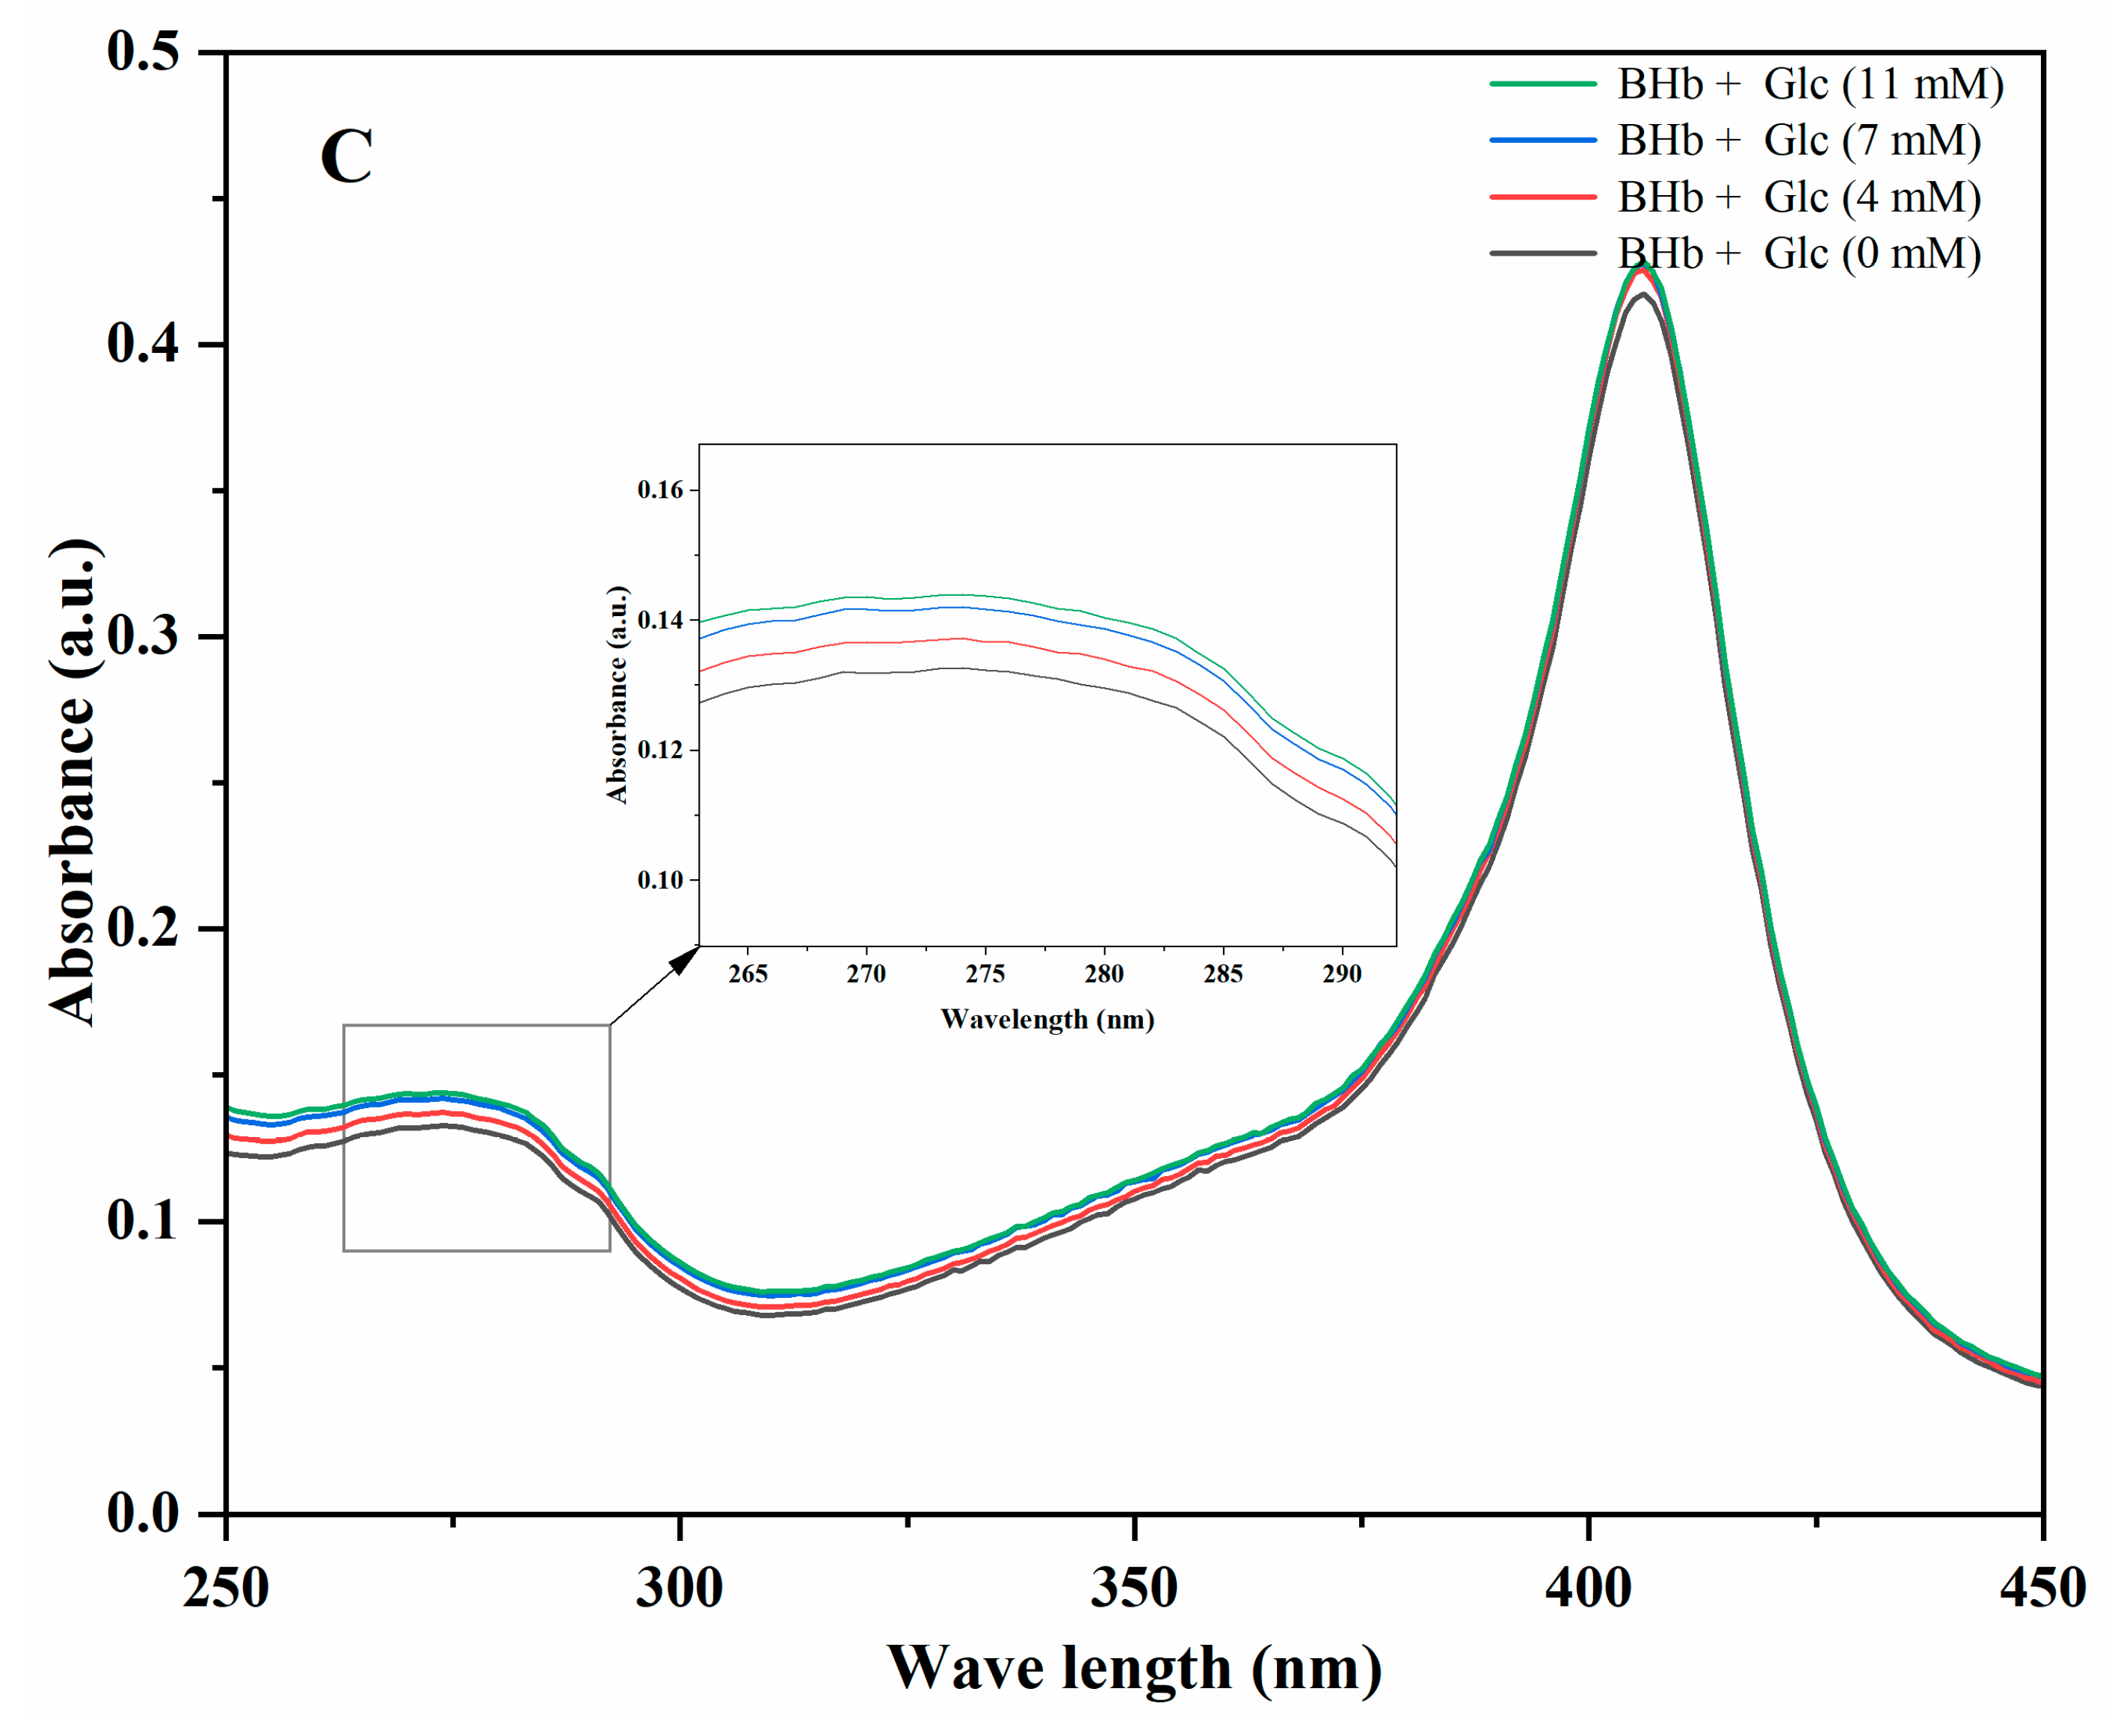
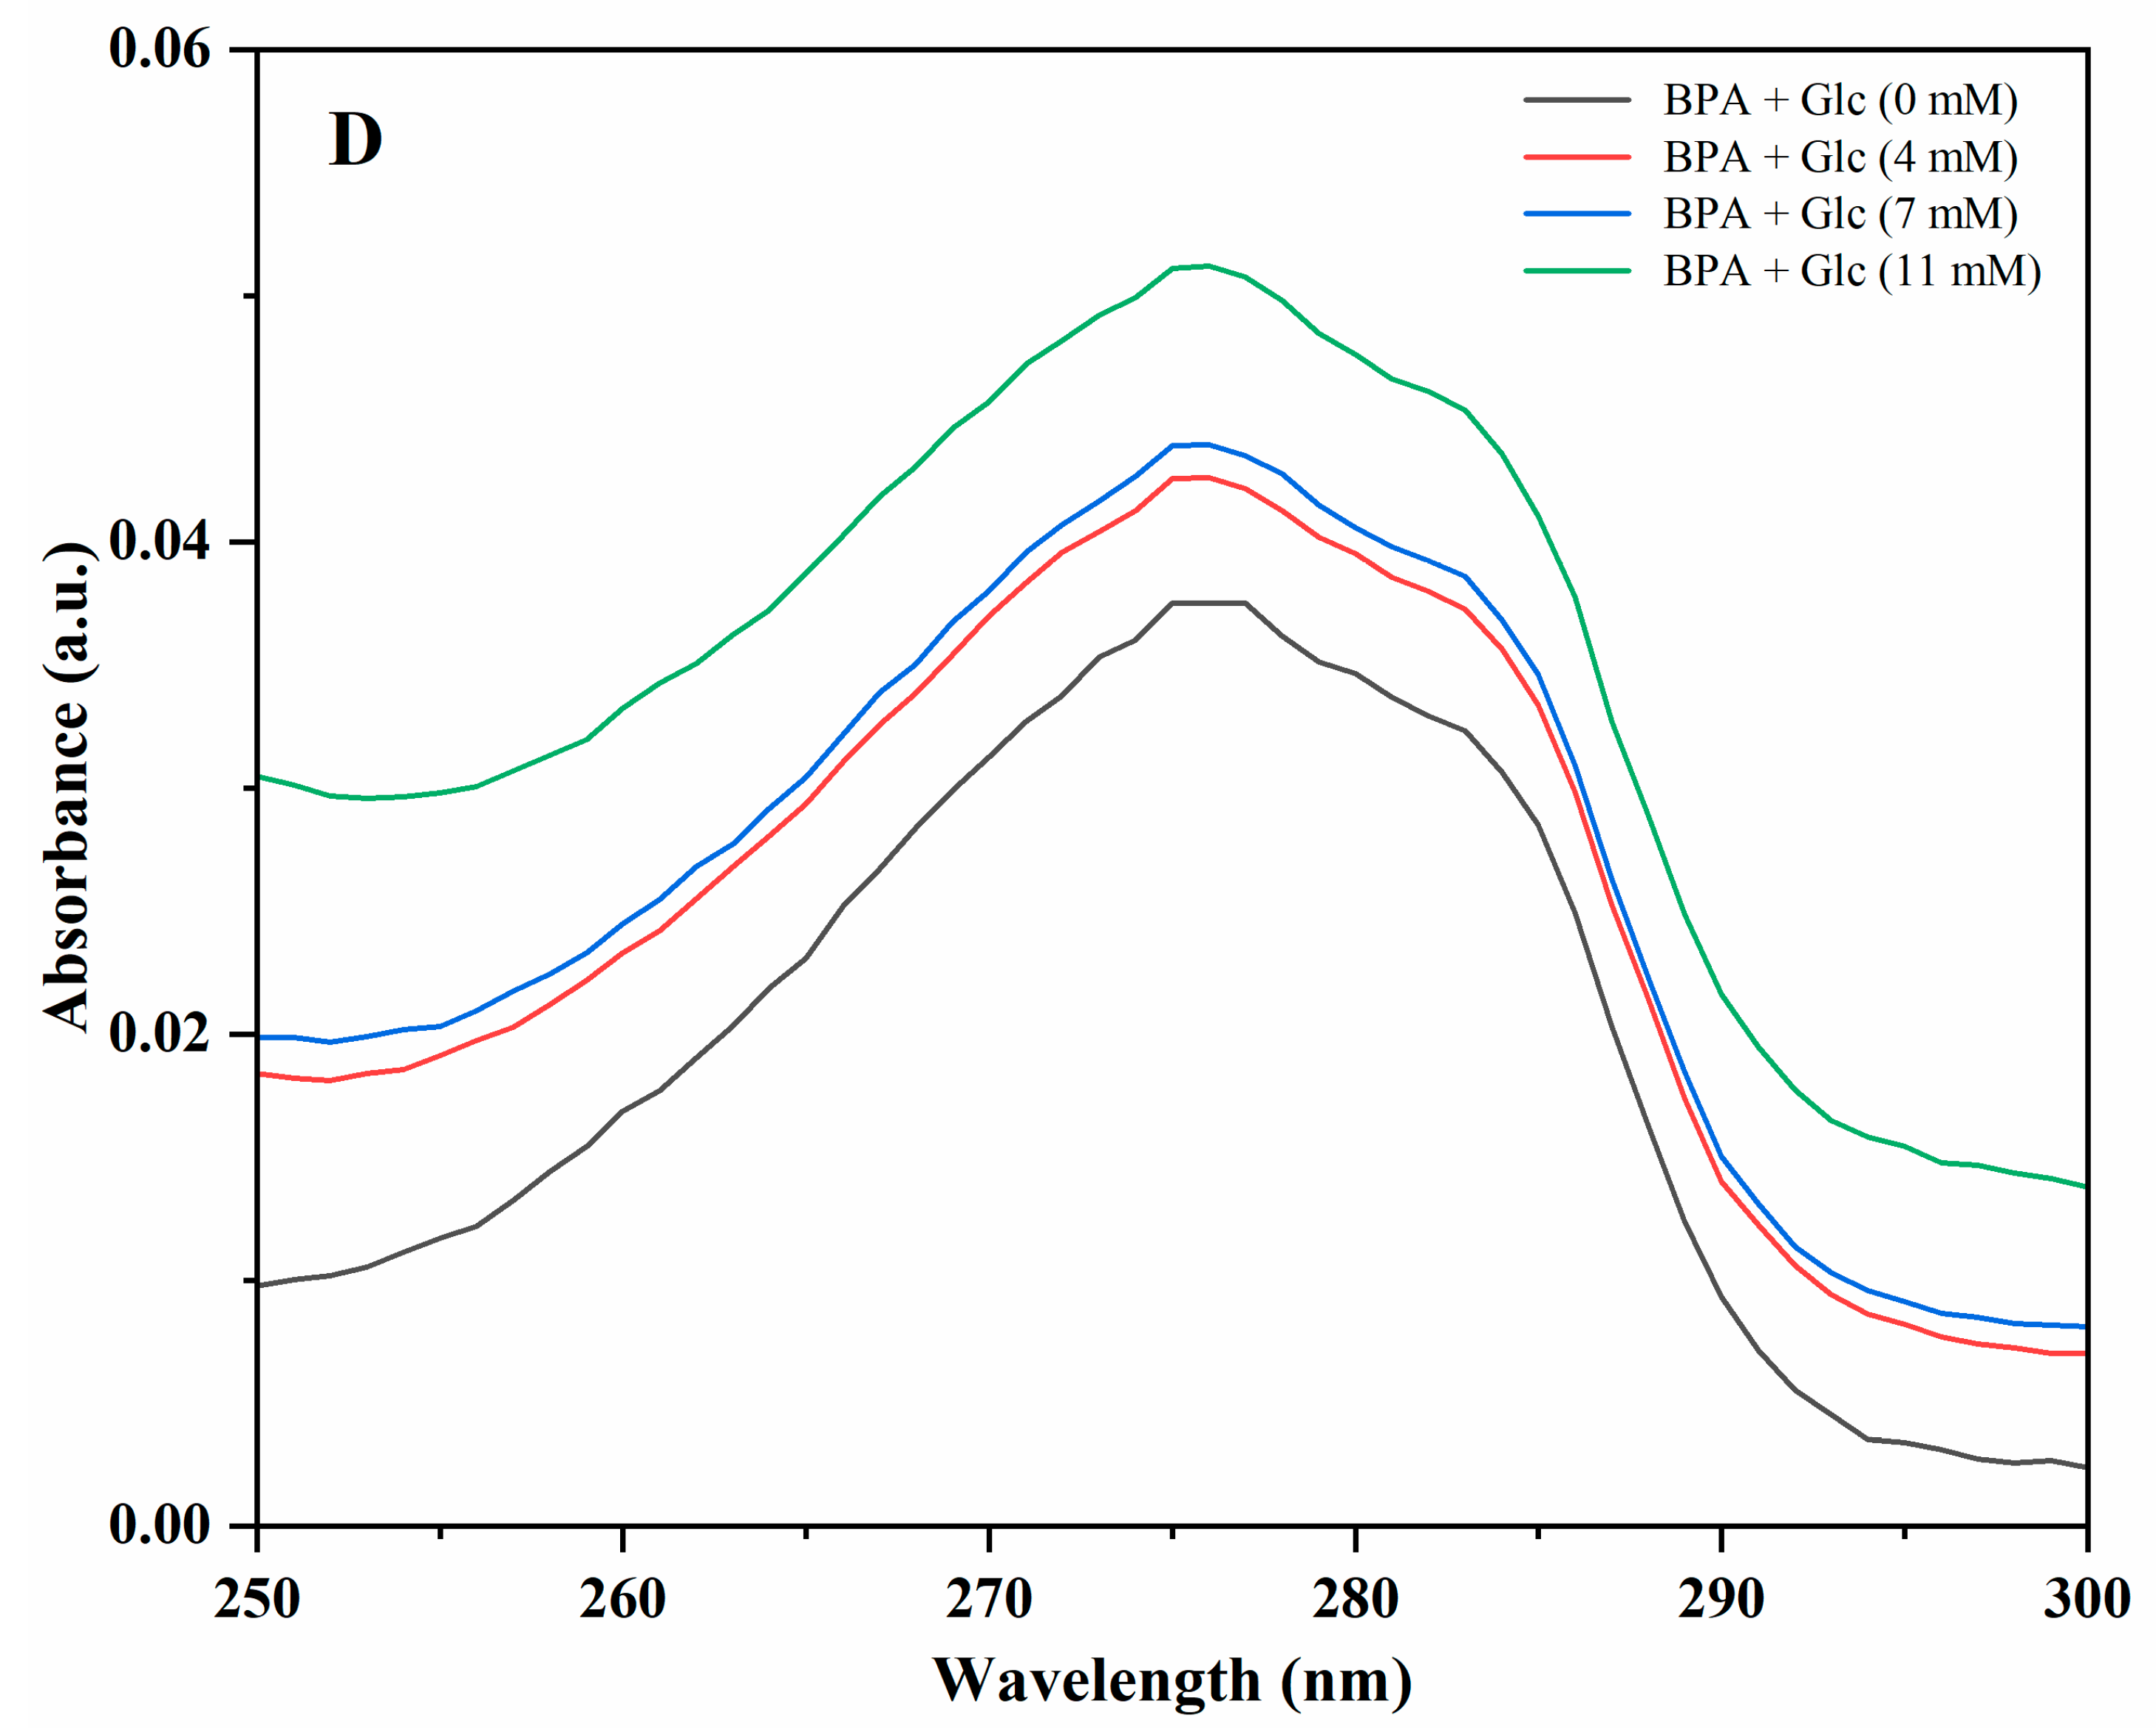
2.1. Absorption Spectroscopy
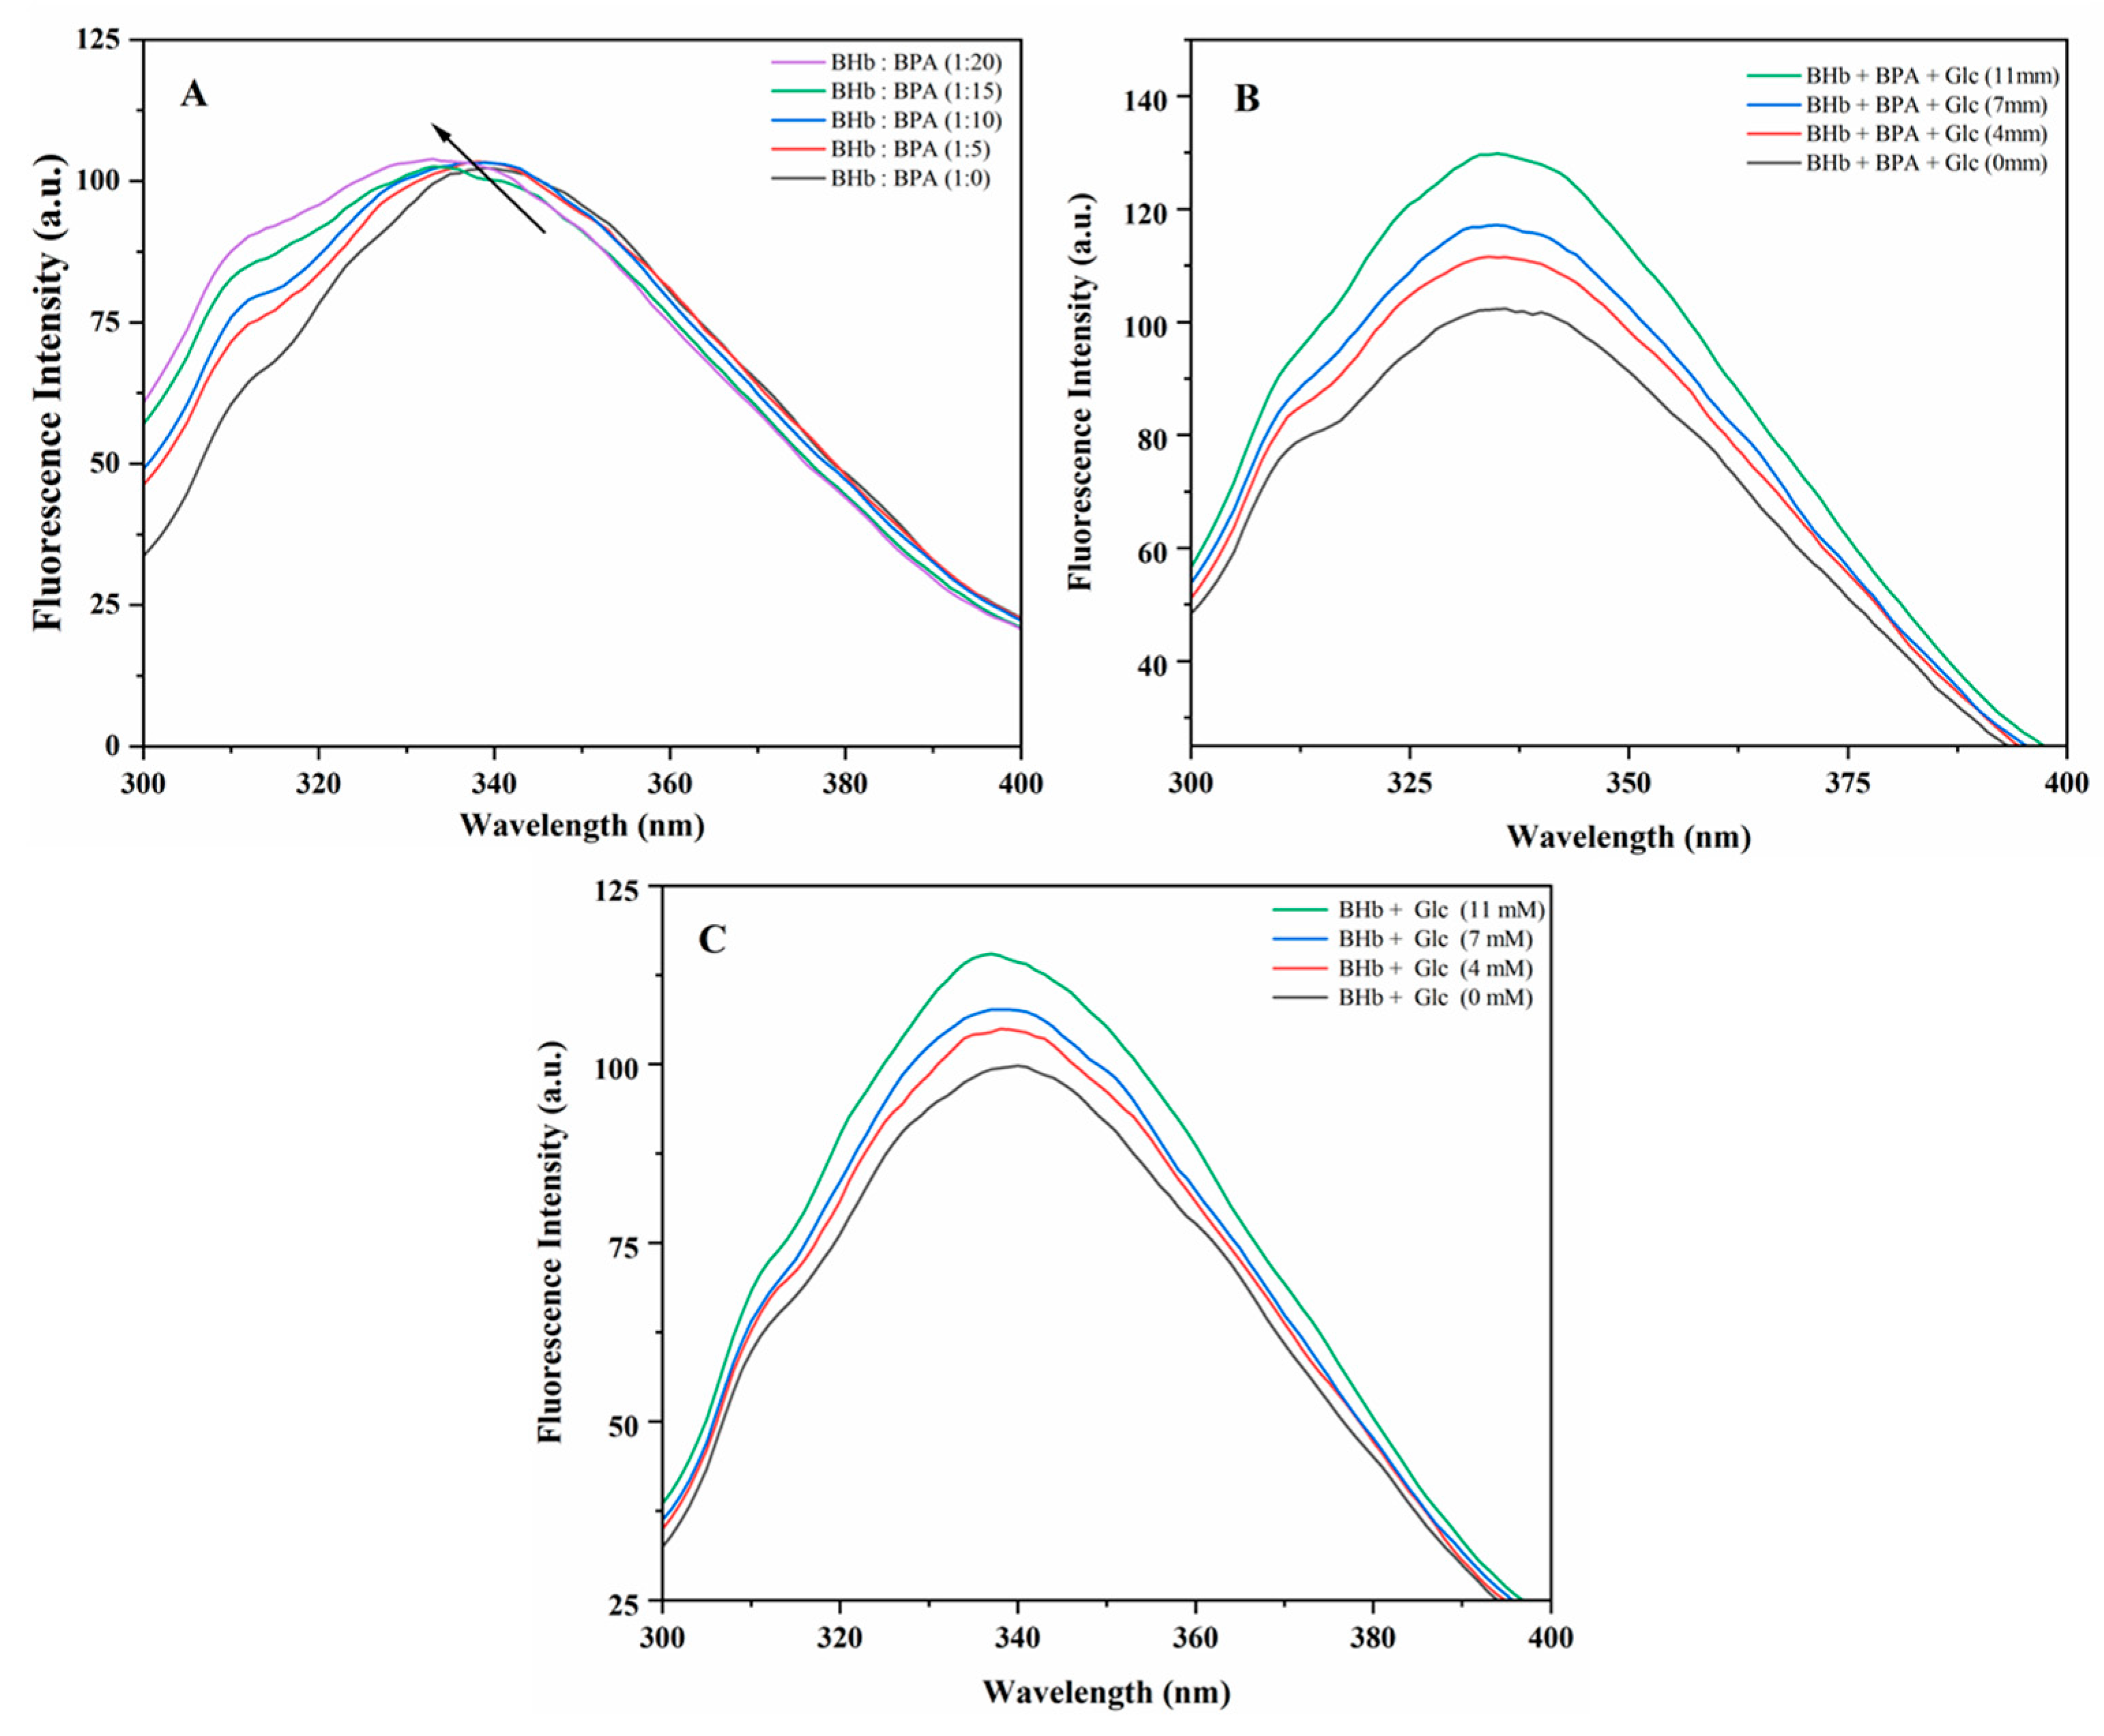
2.2. Steady-State Fluorescence
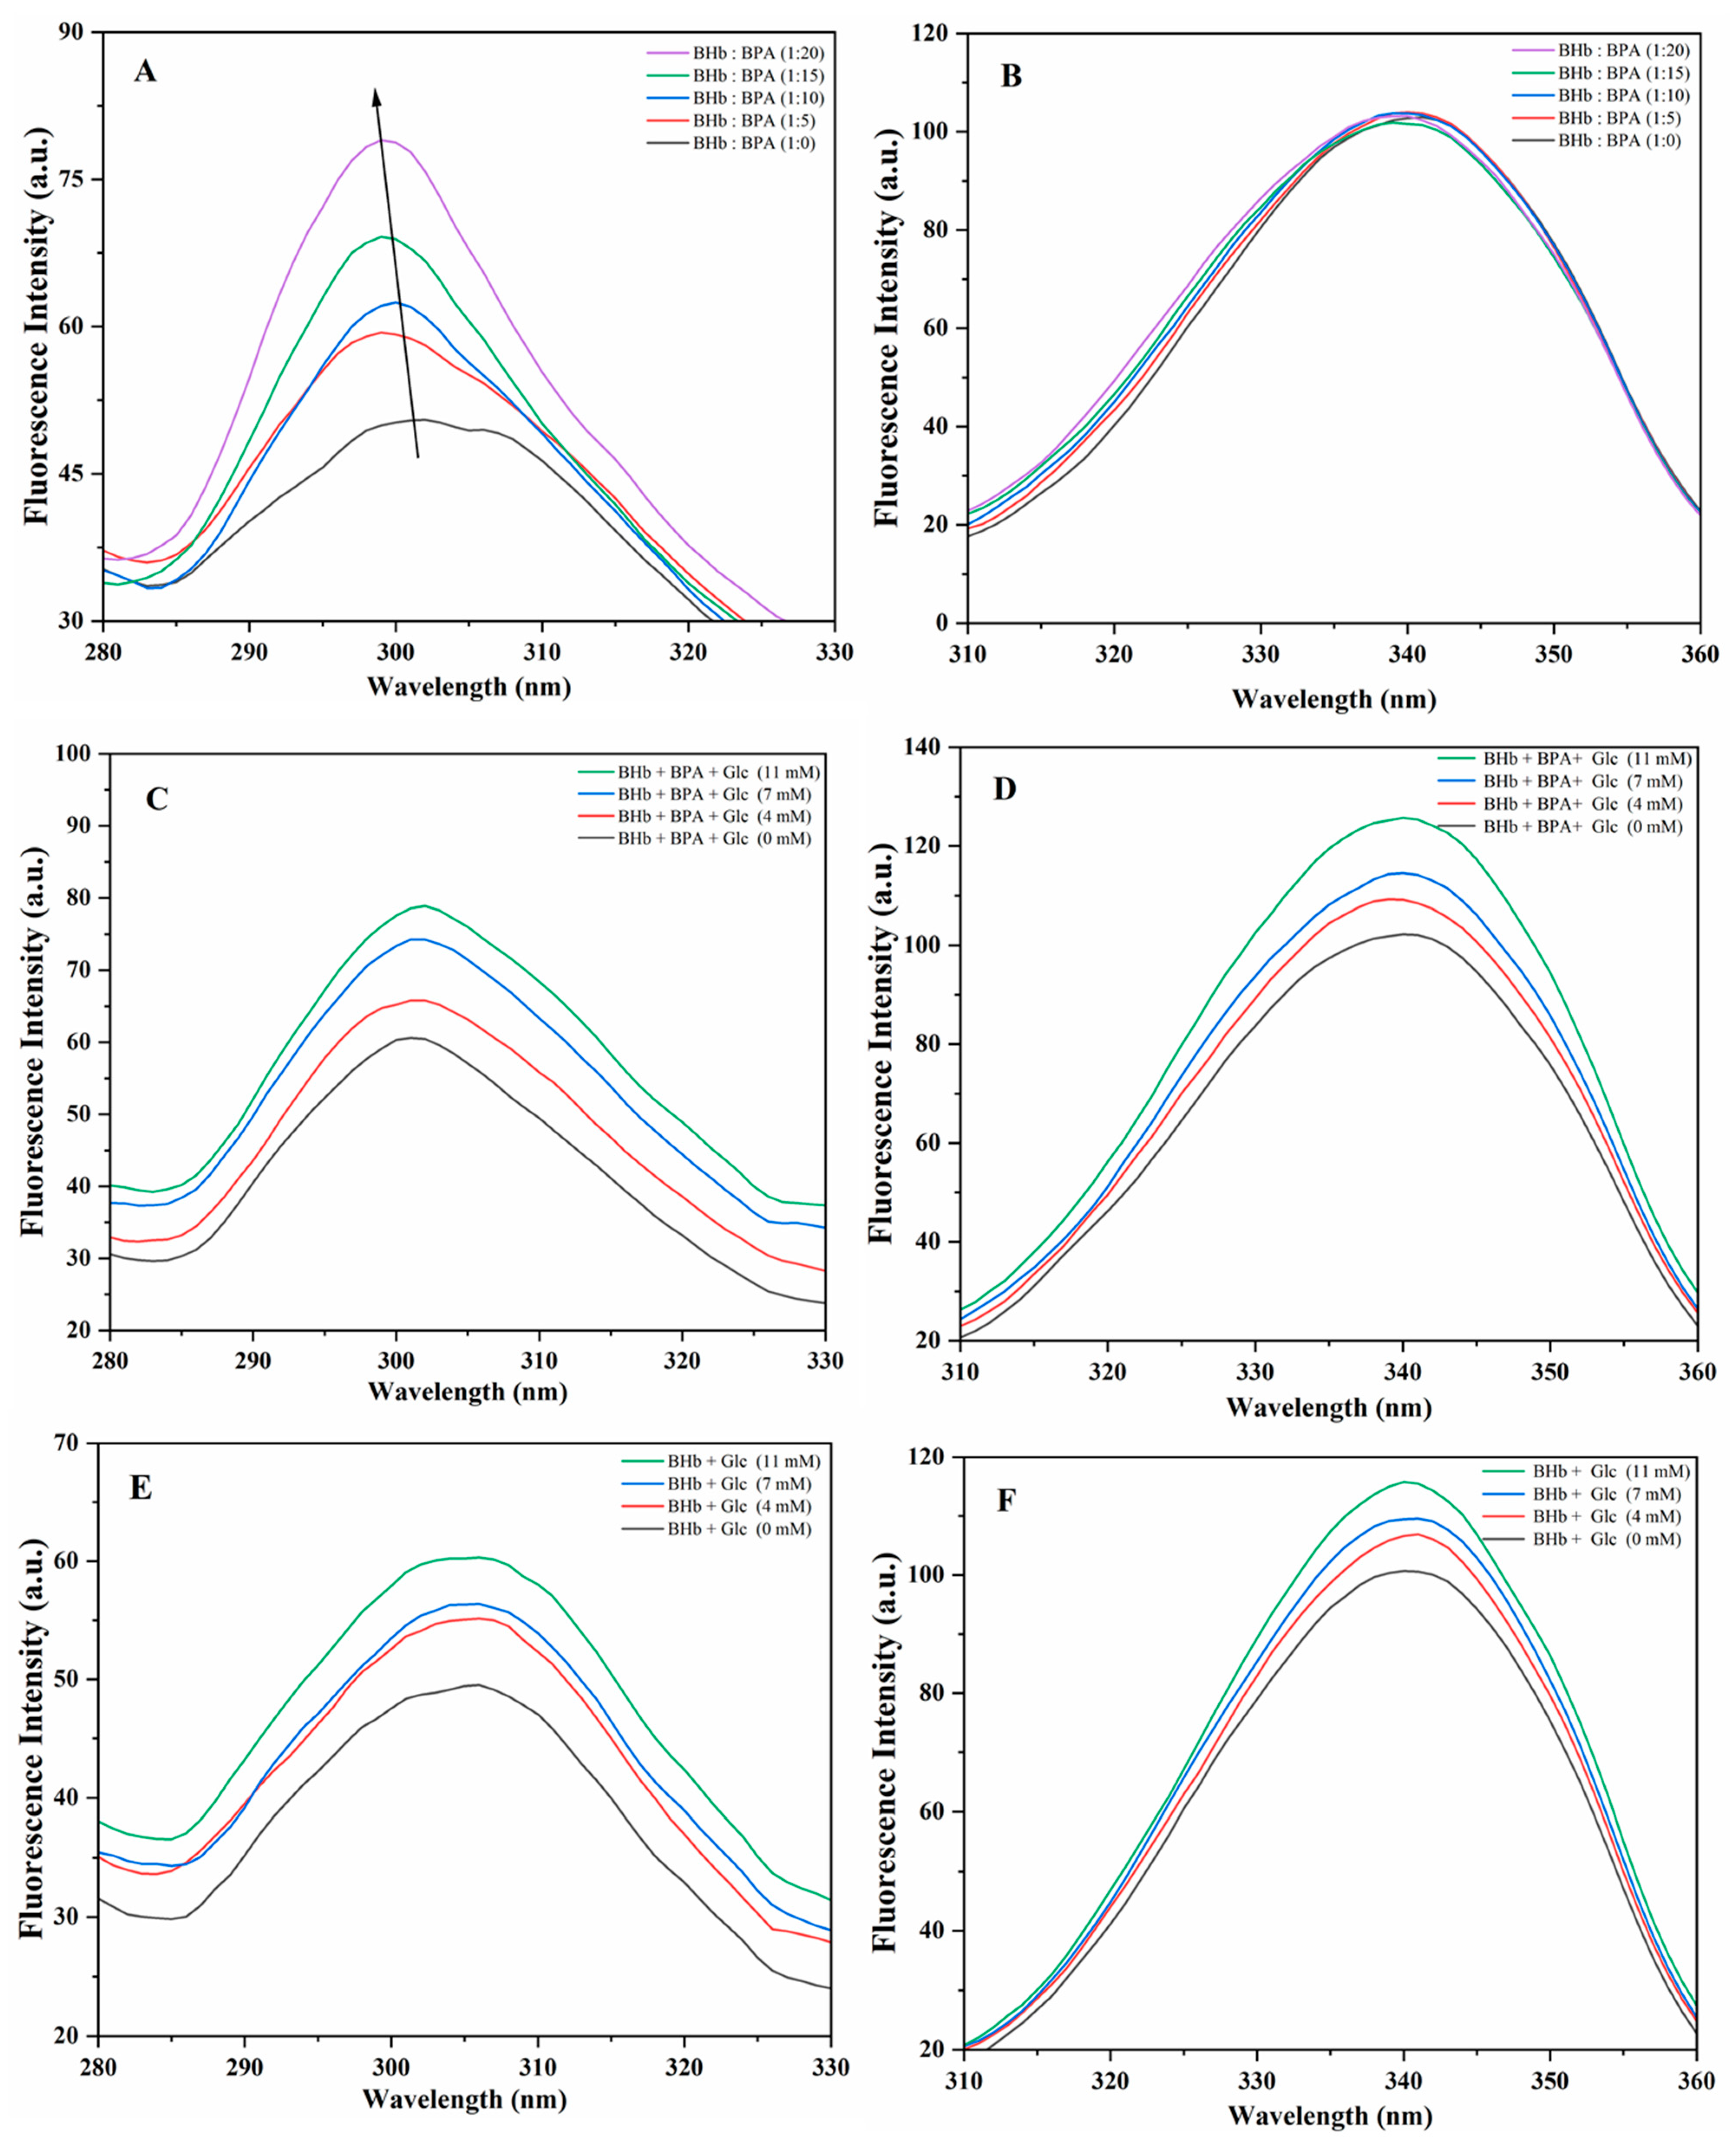
2.3. Synchronized Fluorescence Spectroscopy
2.4. Circular Dichroism

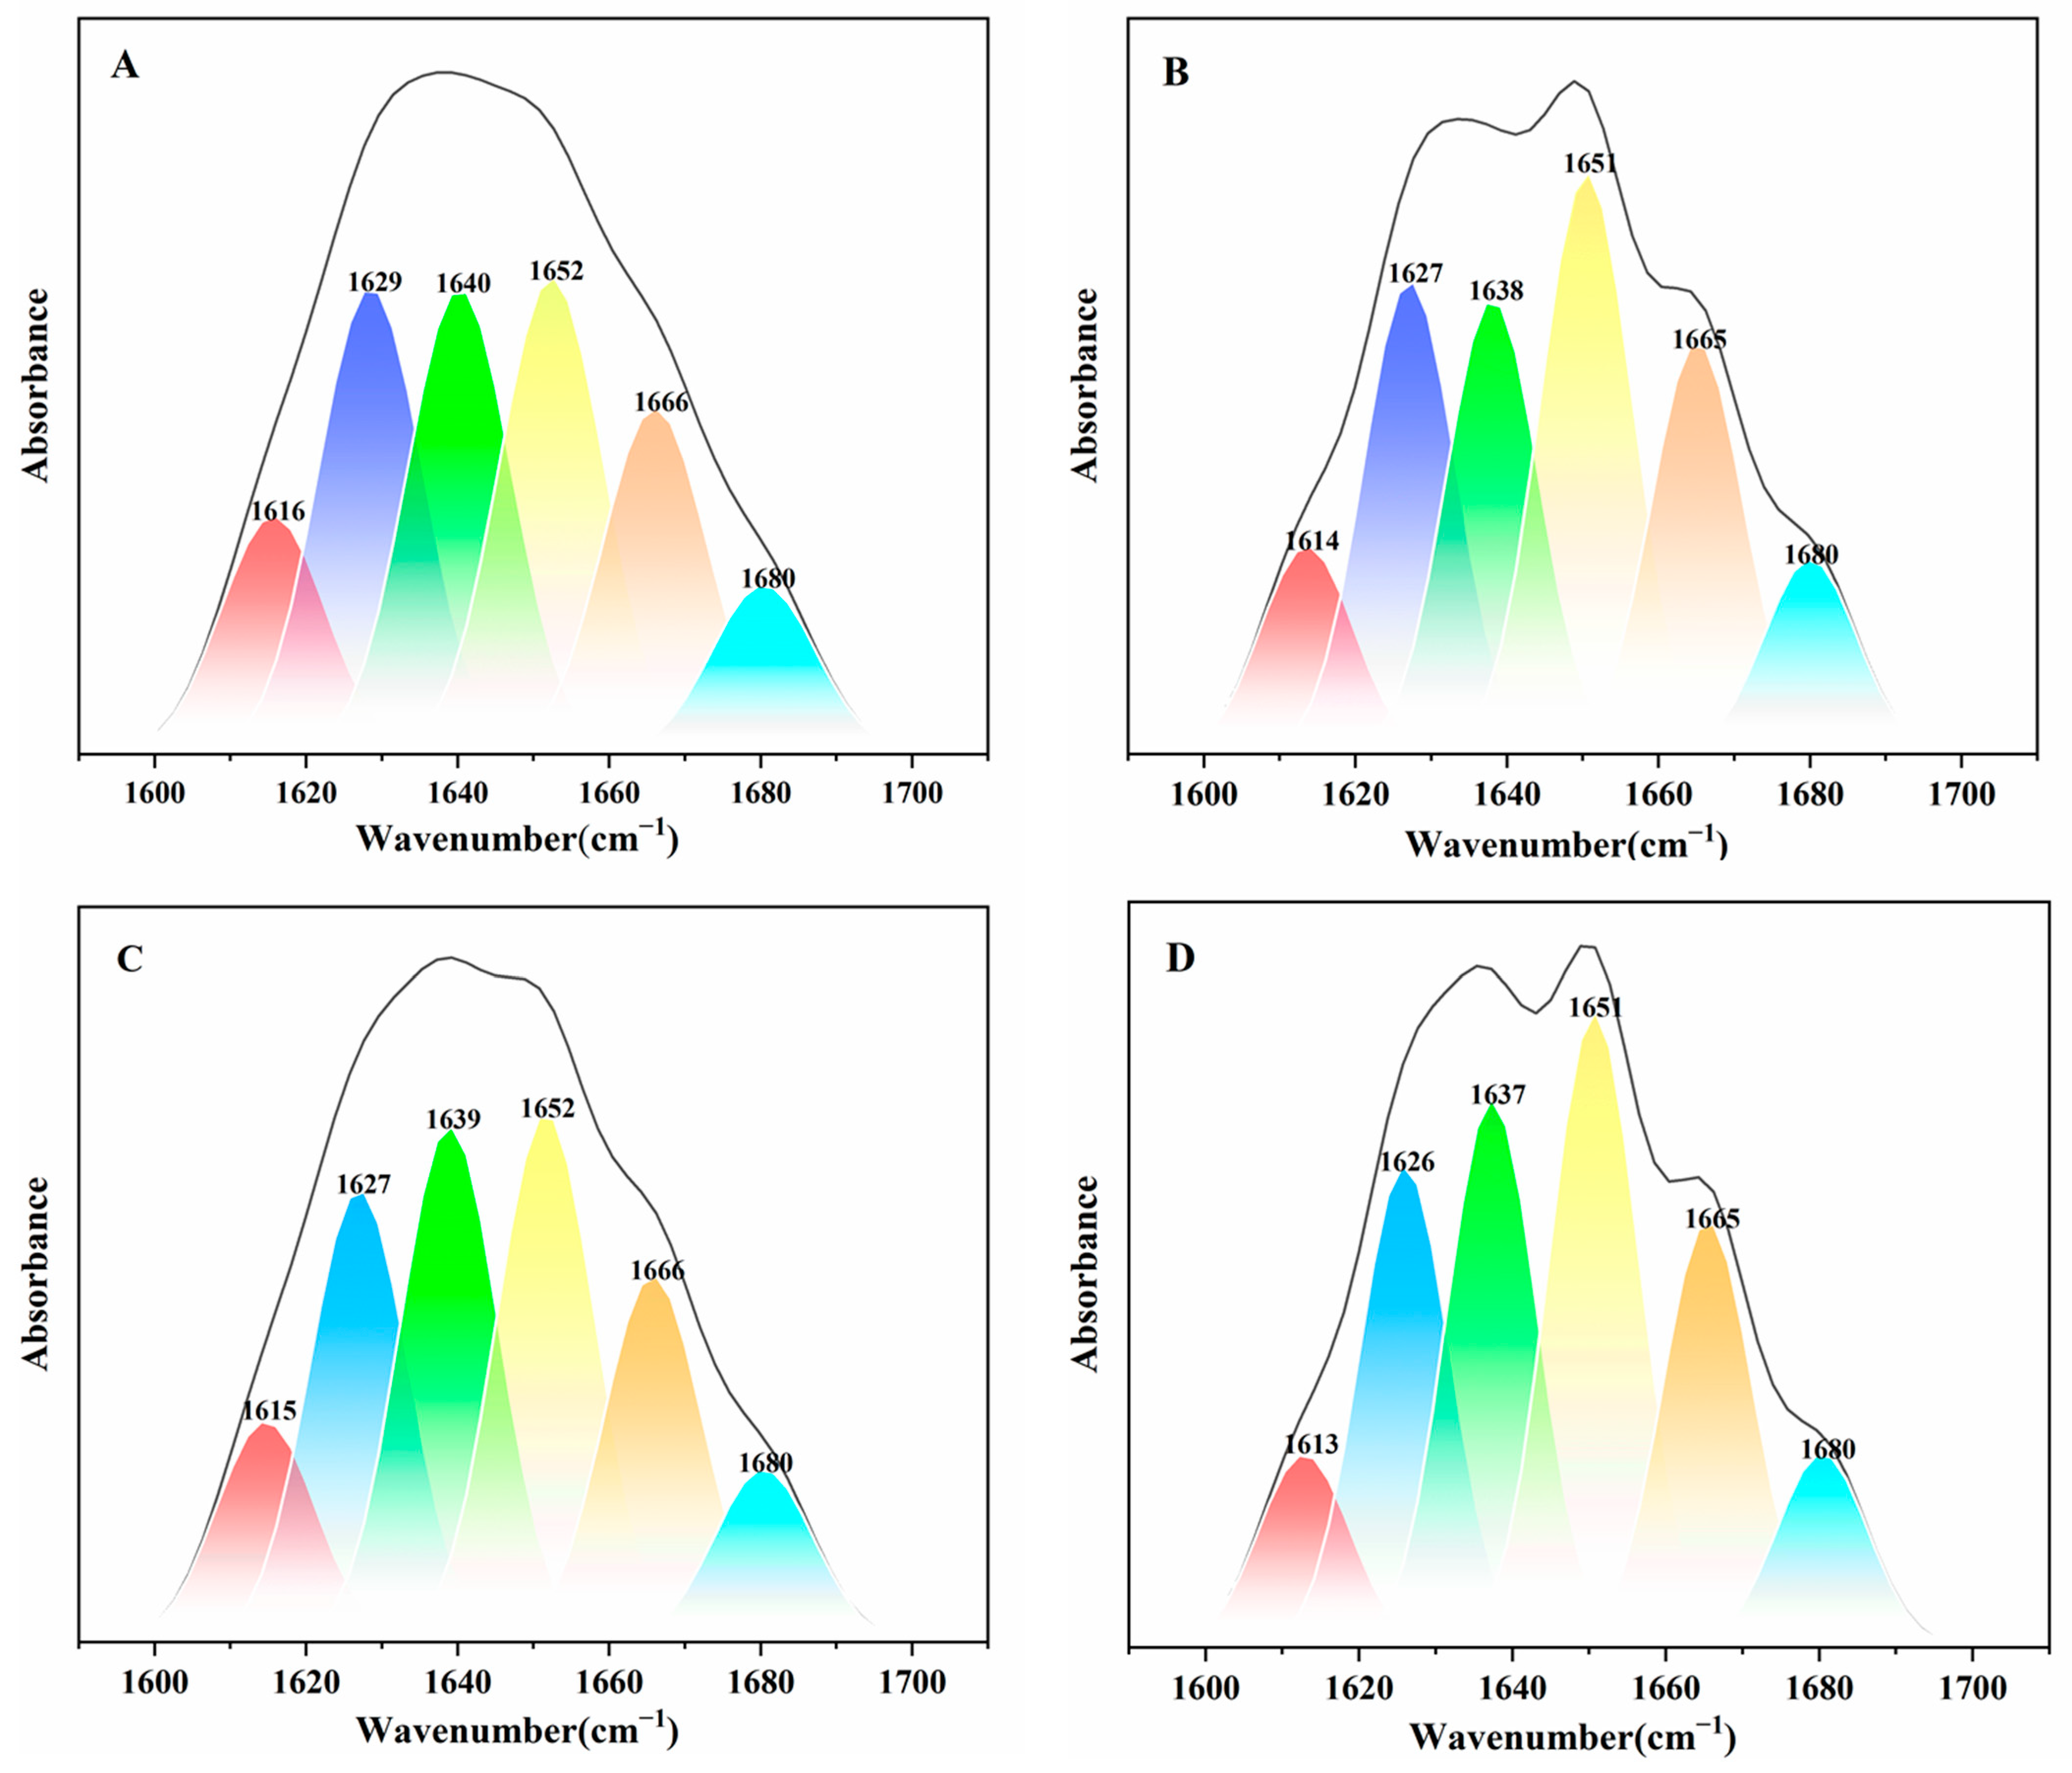
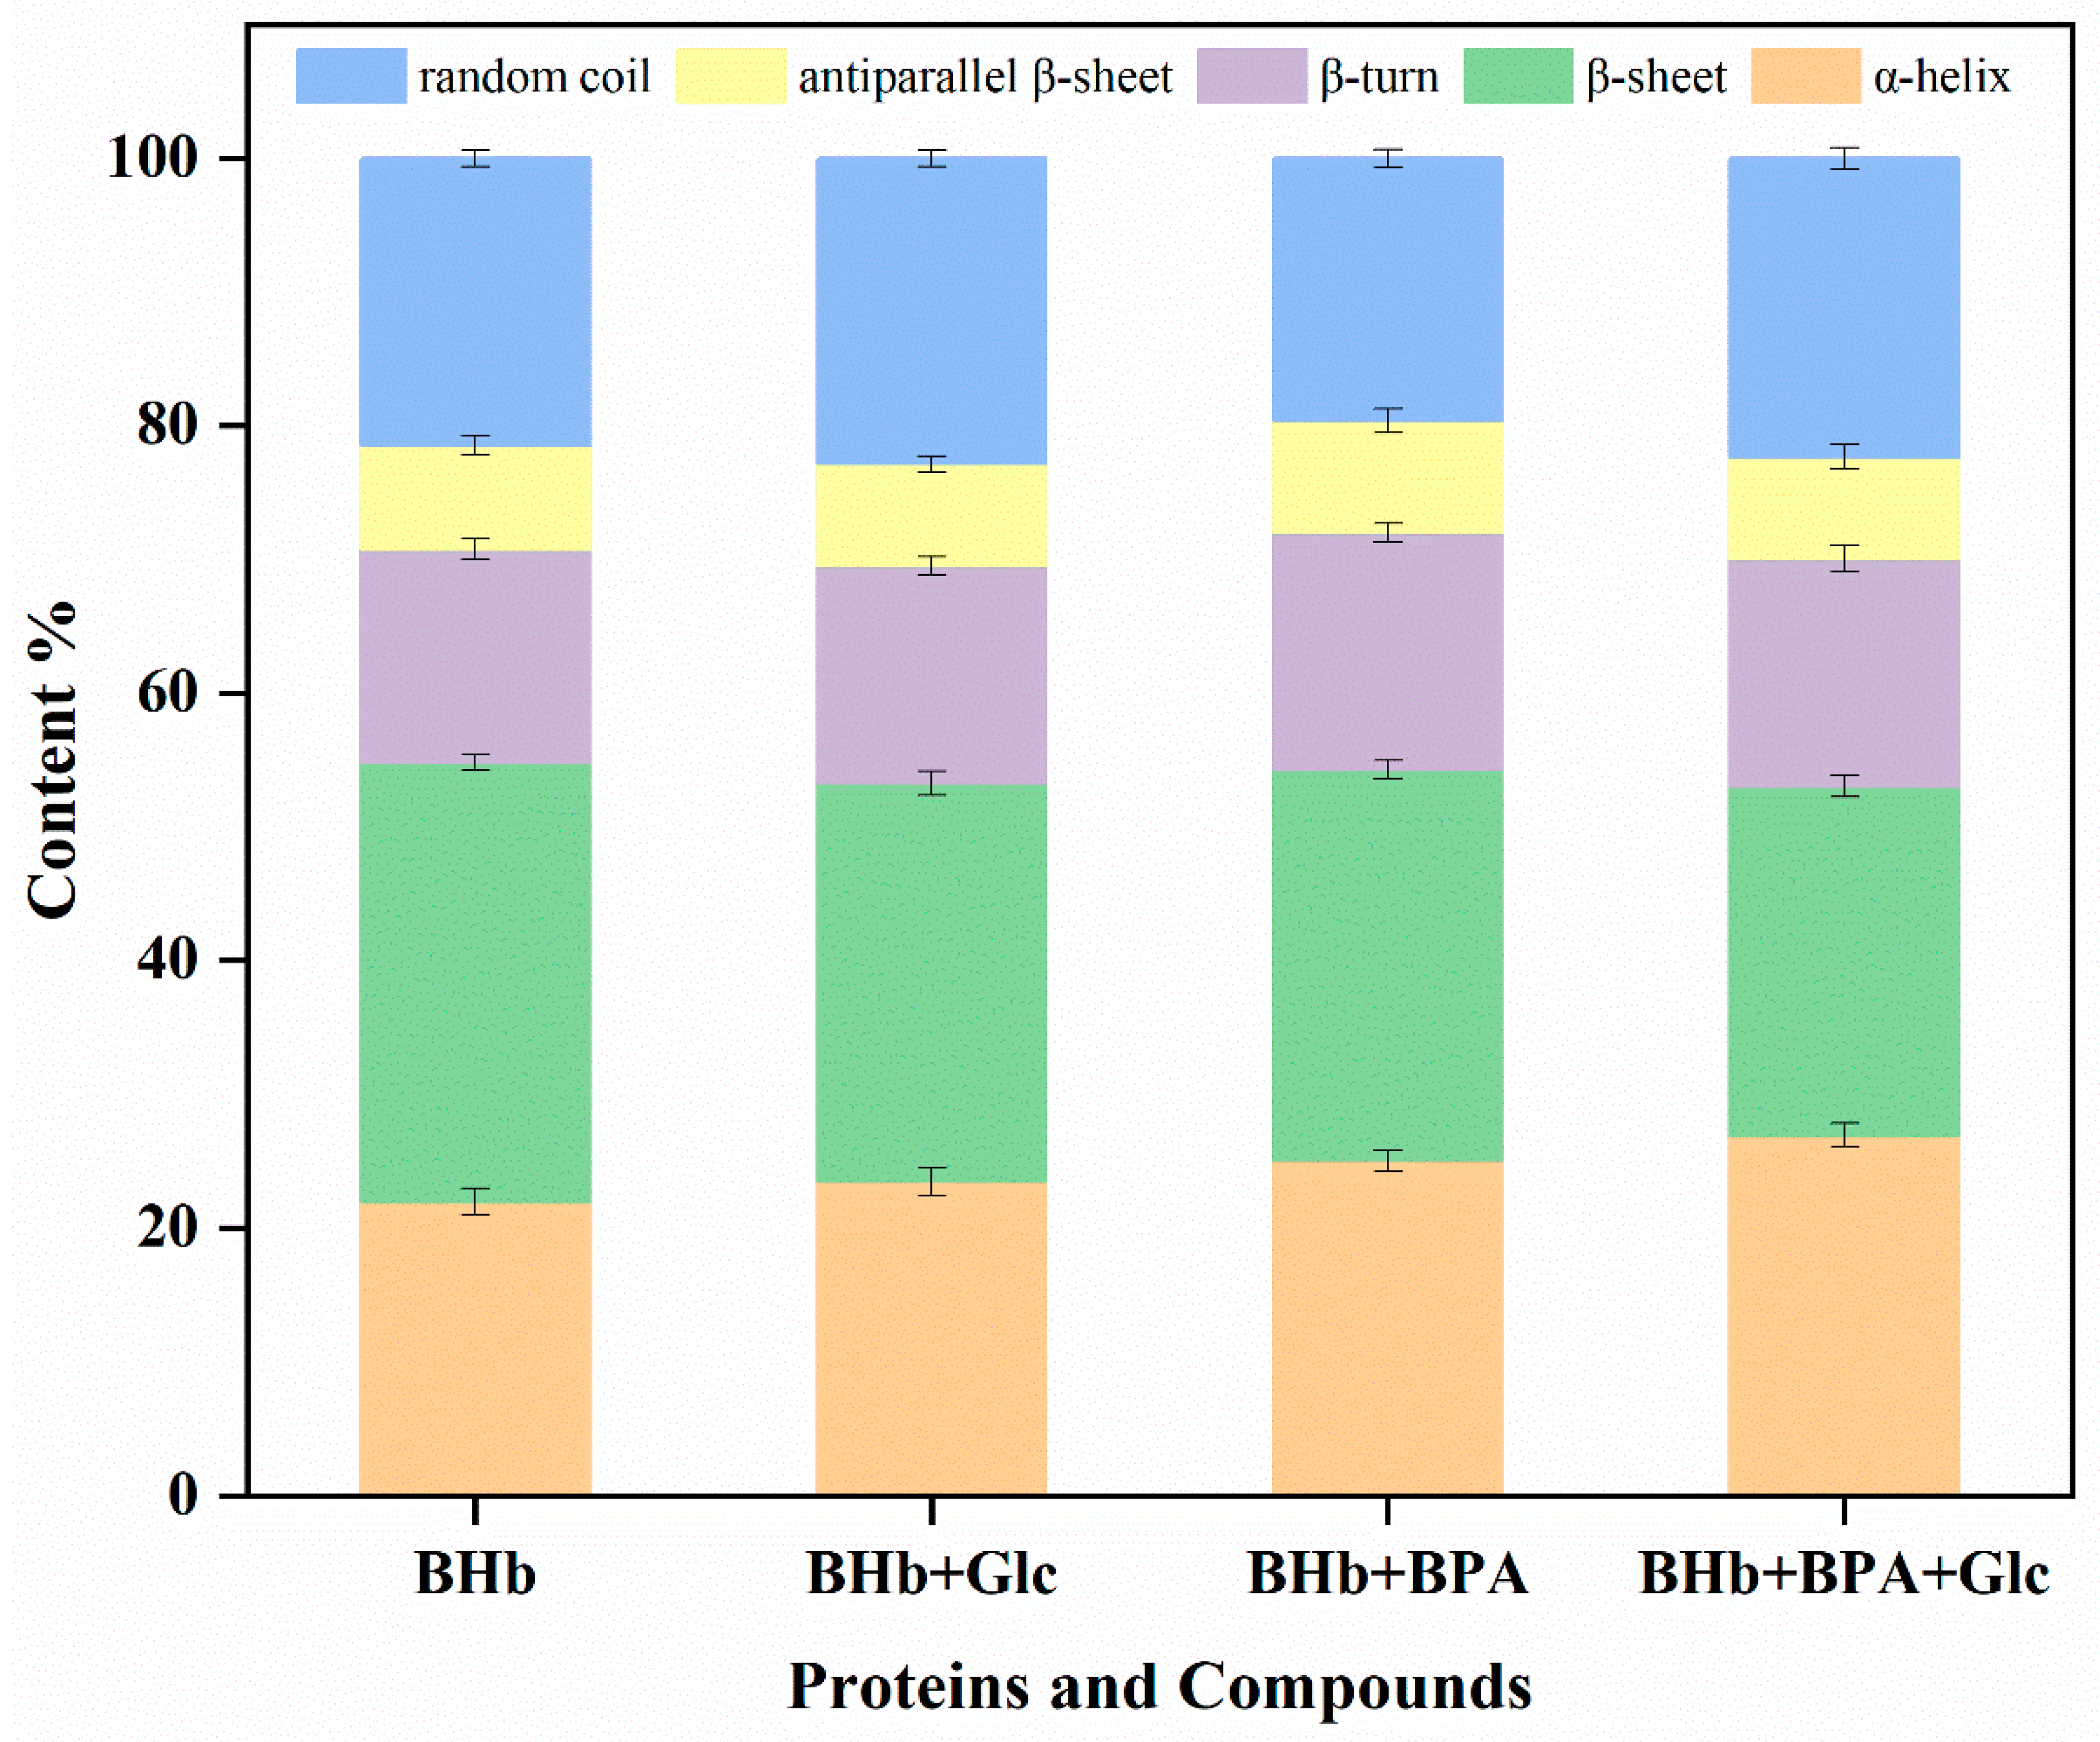
2.5. Fourier Infrared Spectroscopy Studies
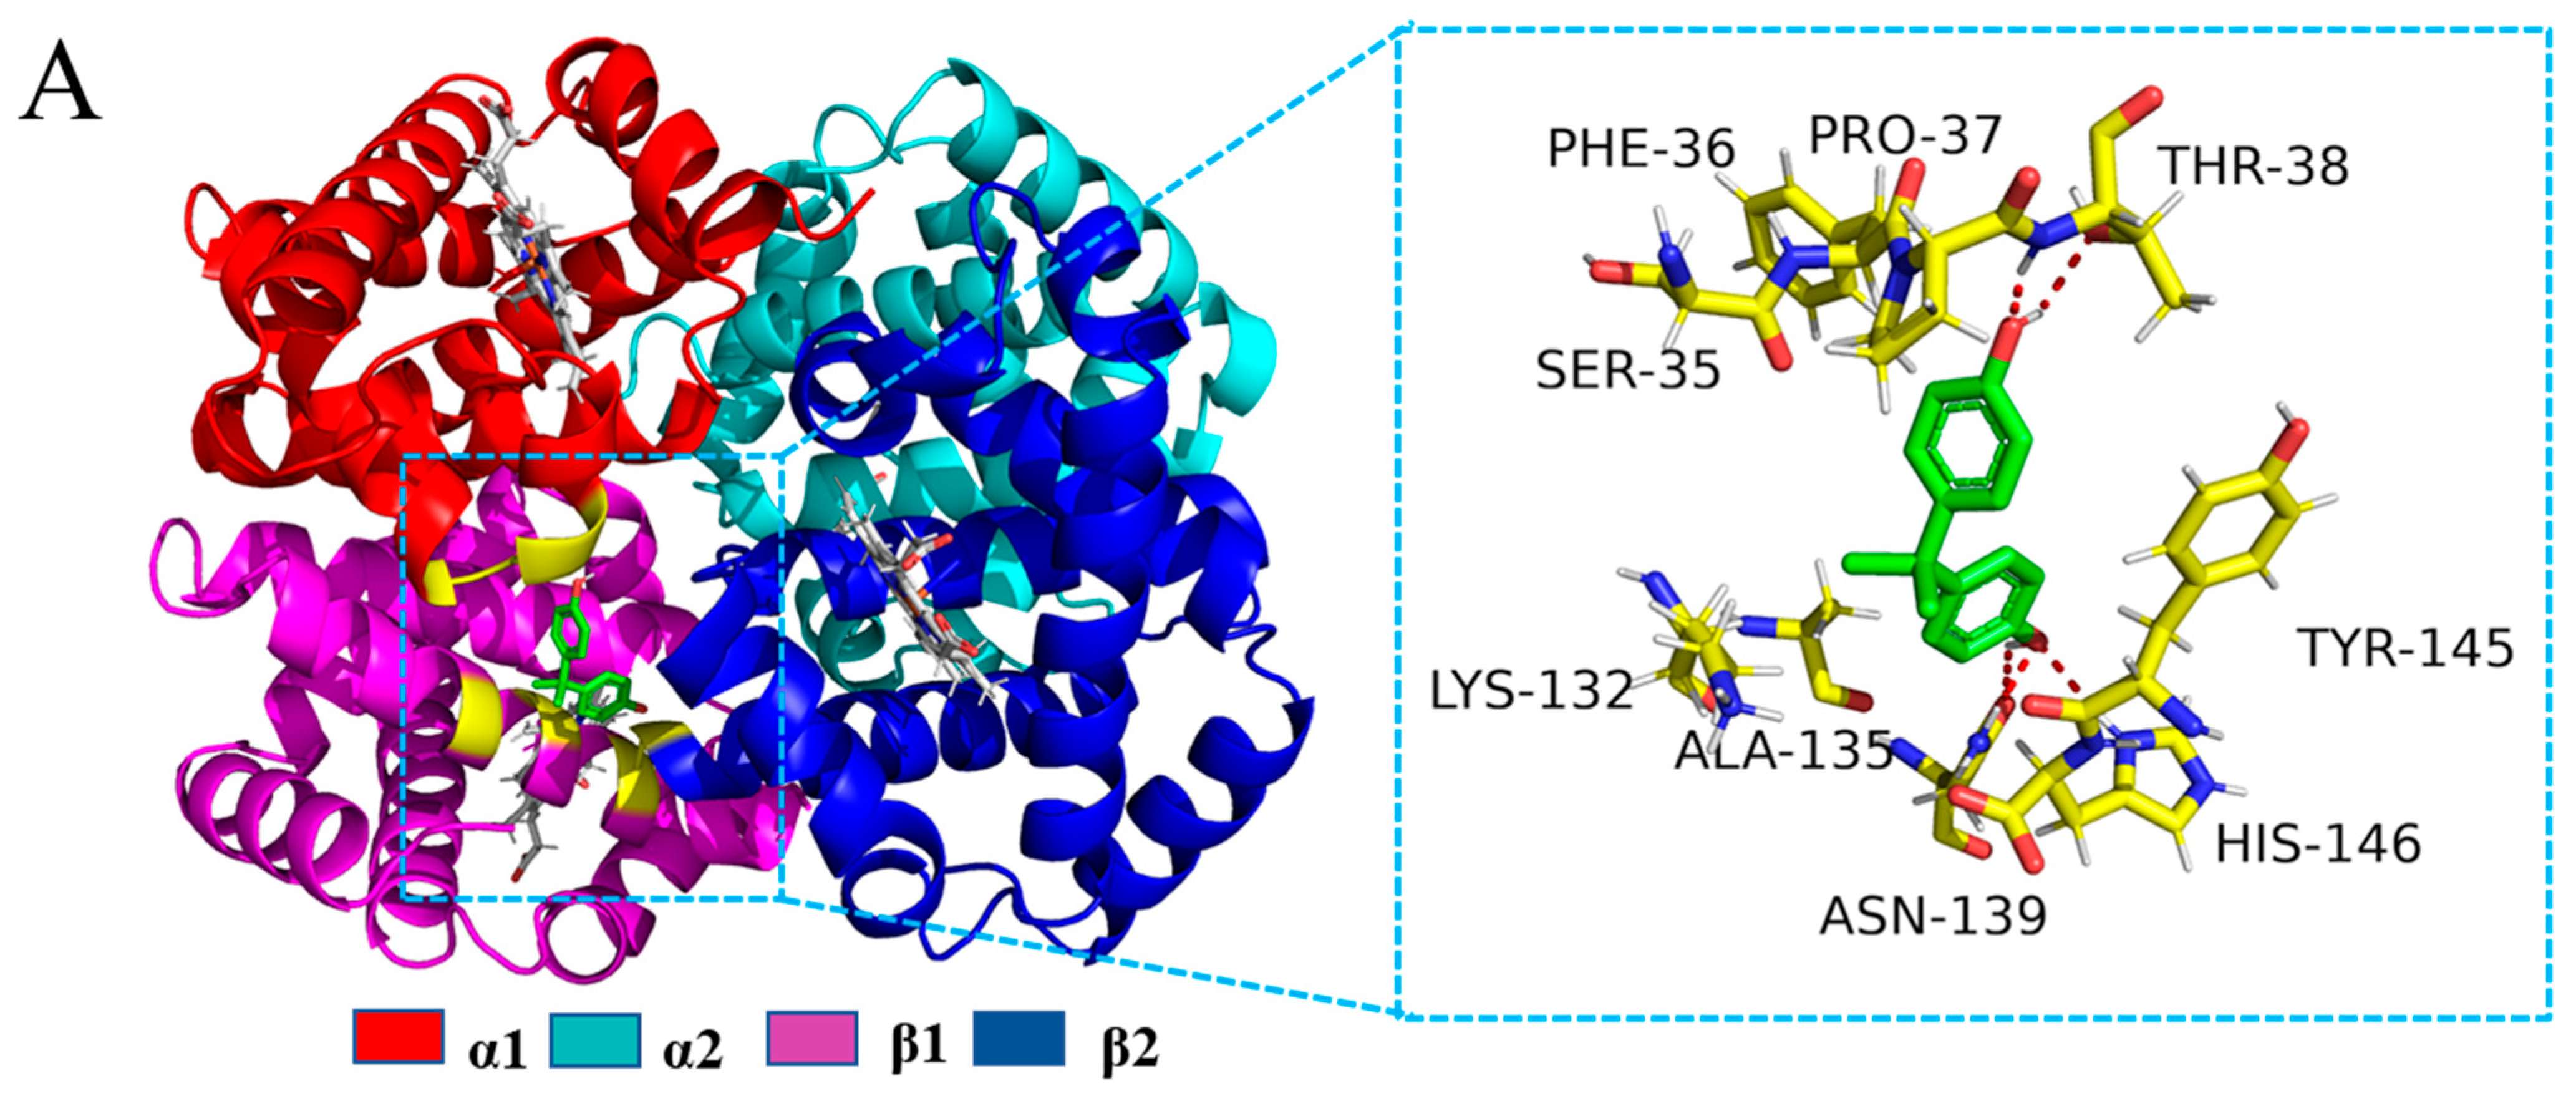
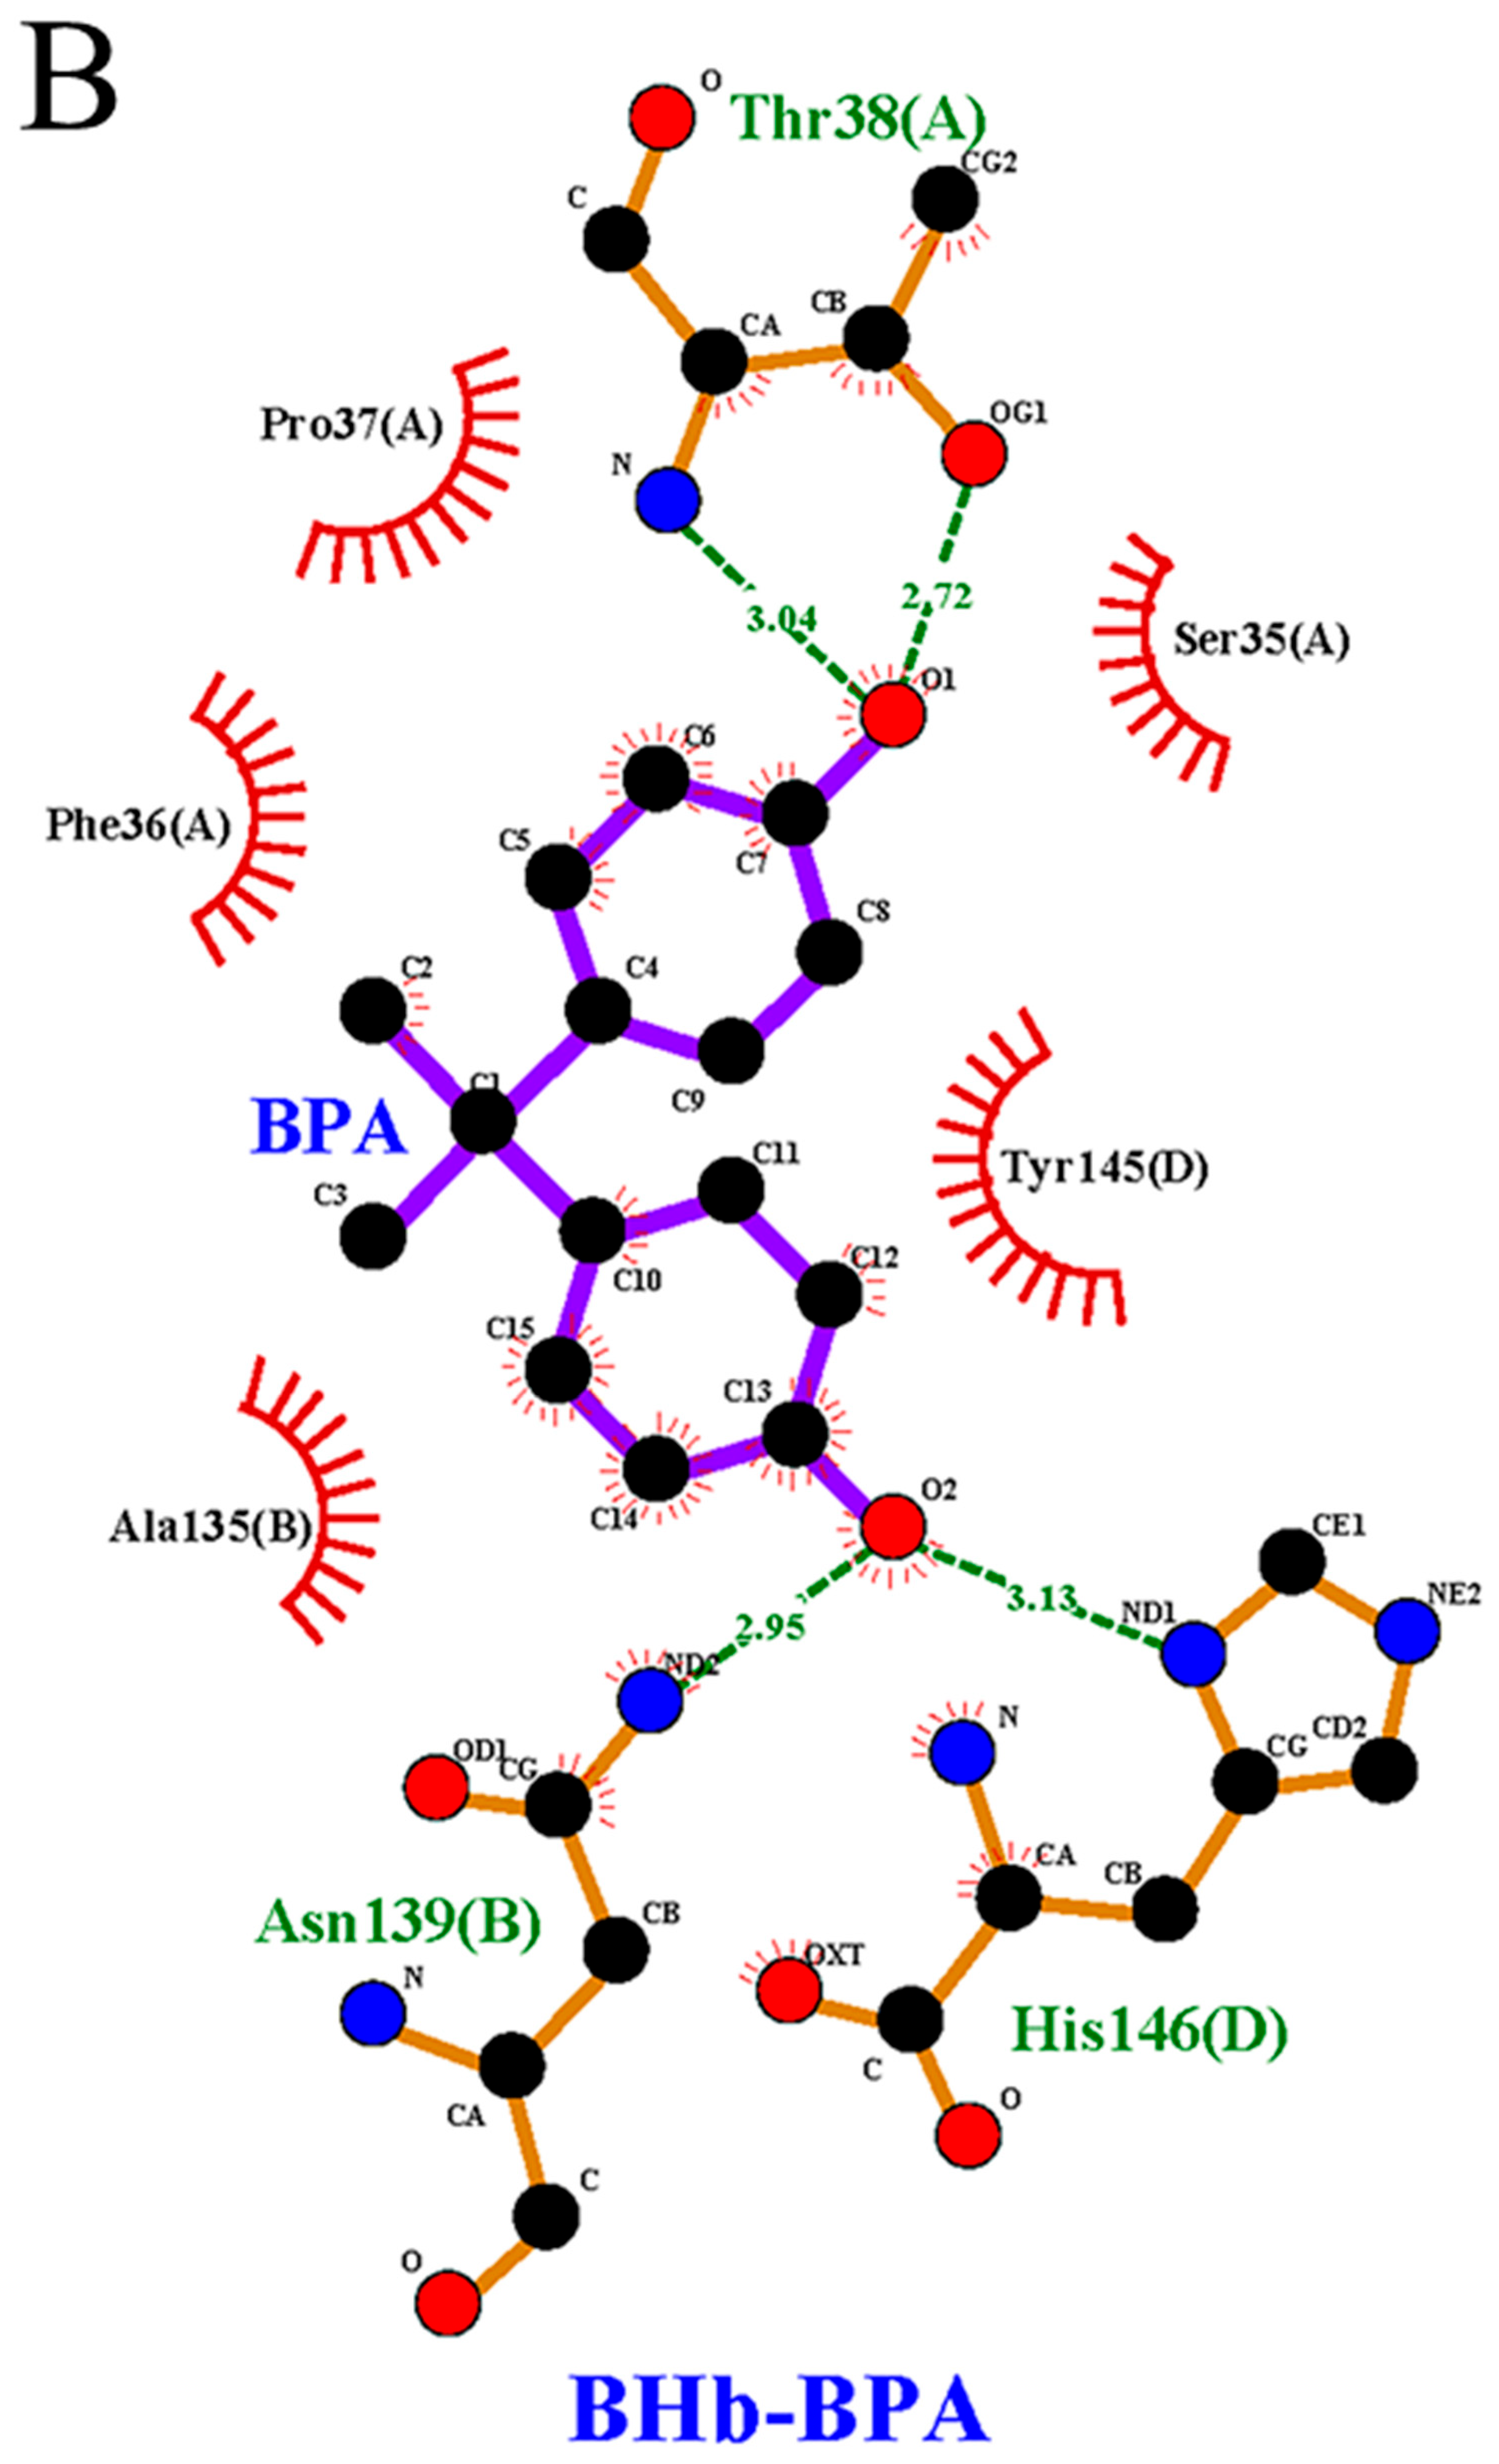
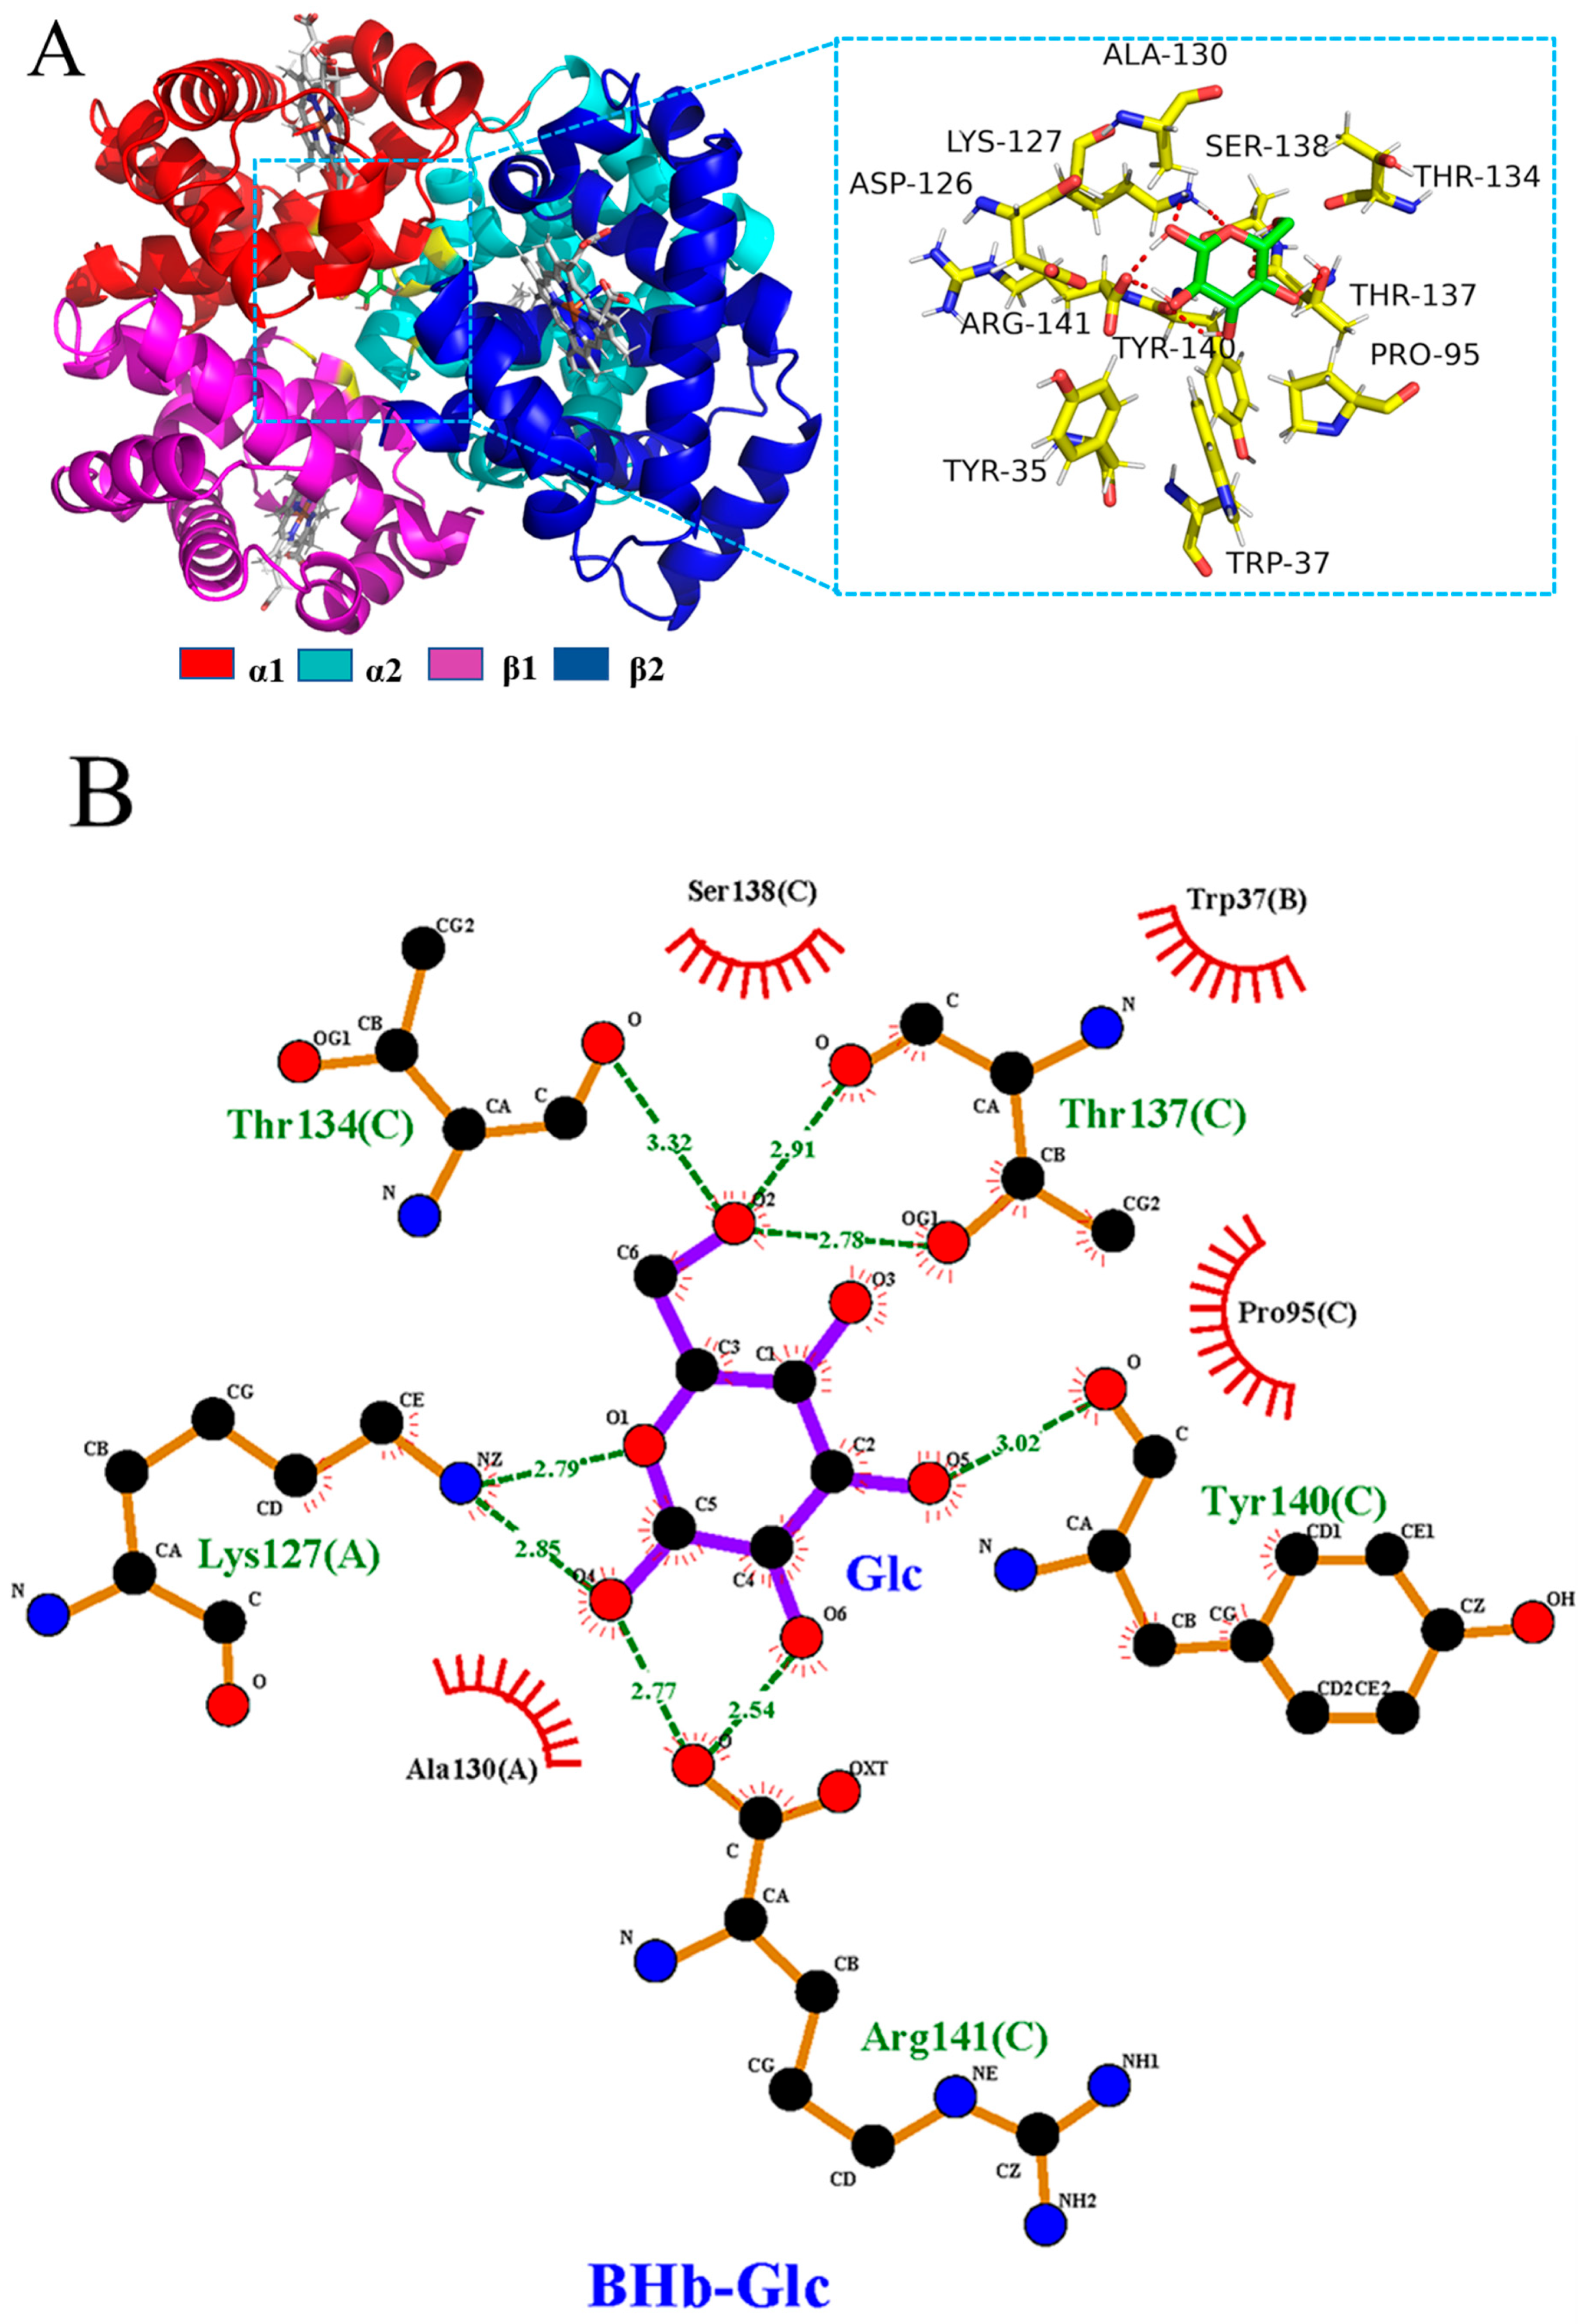
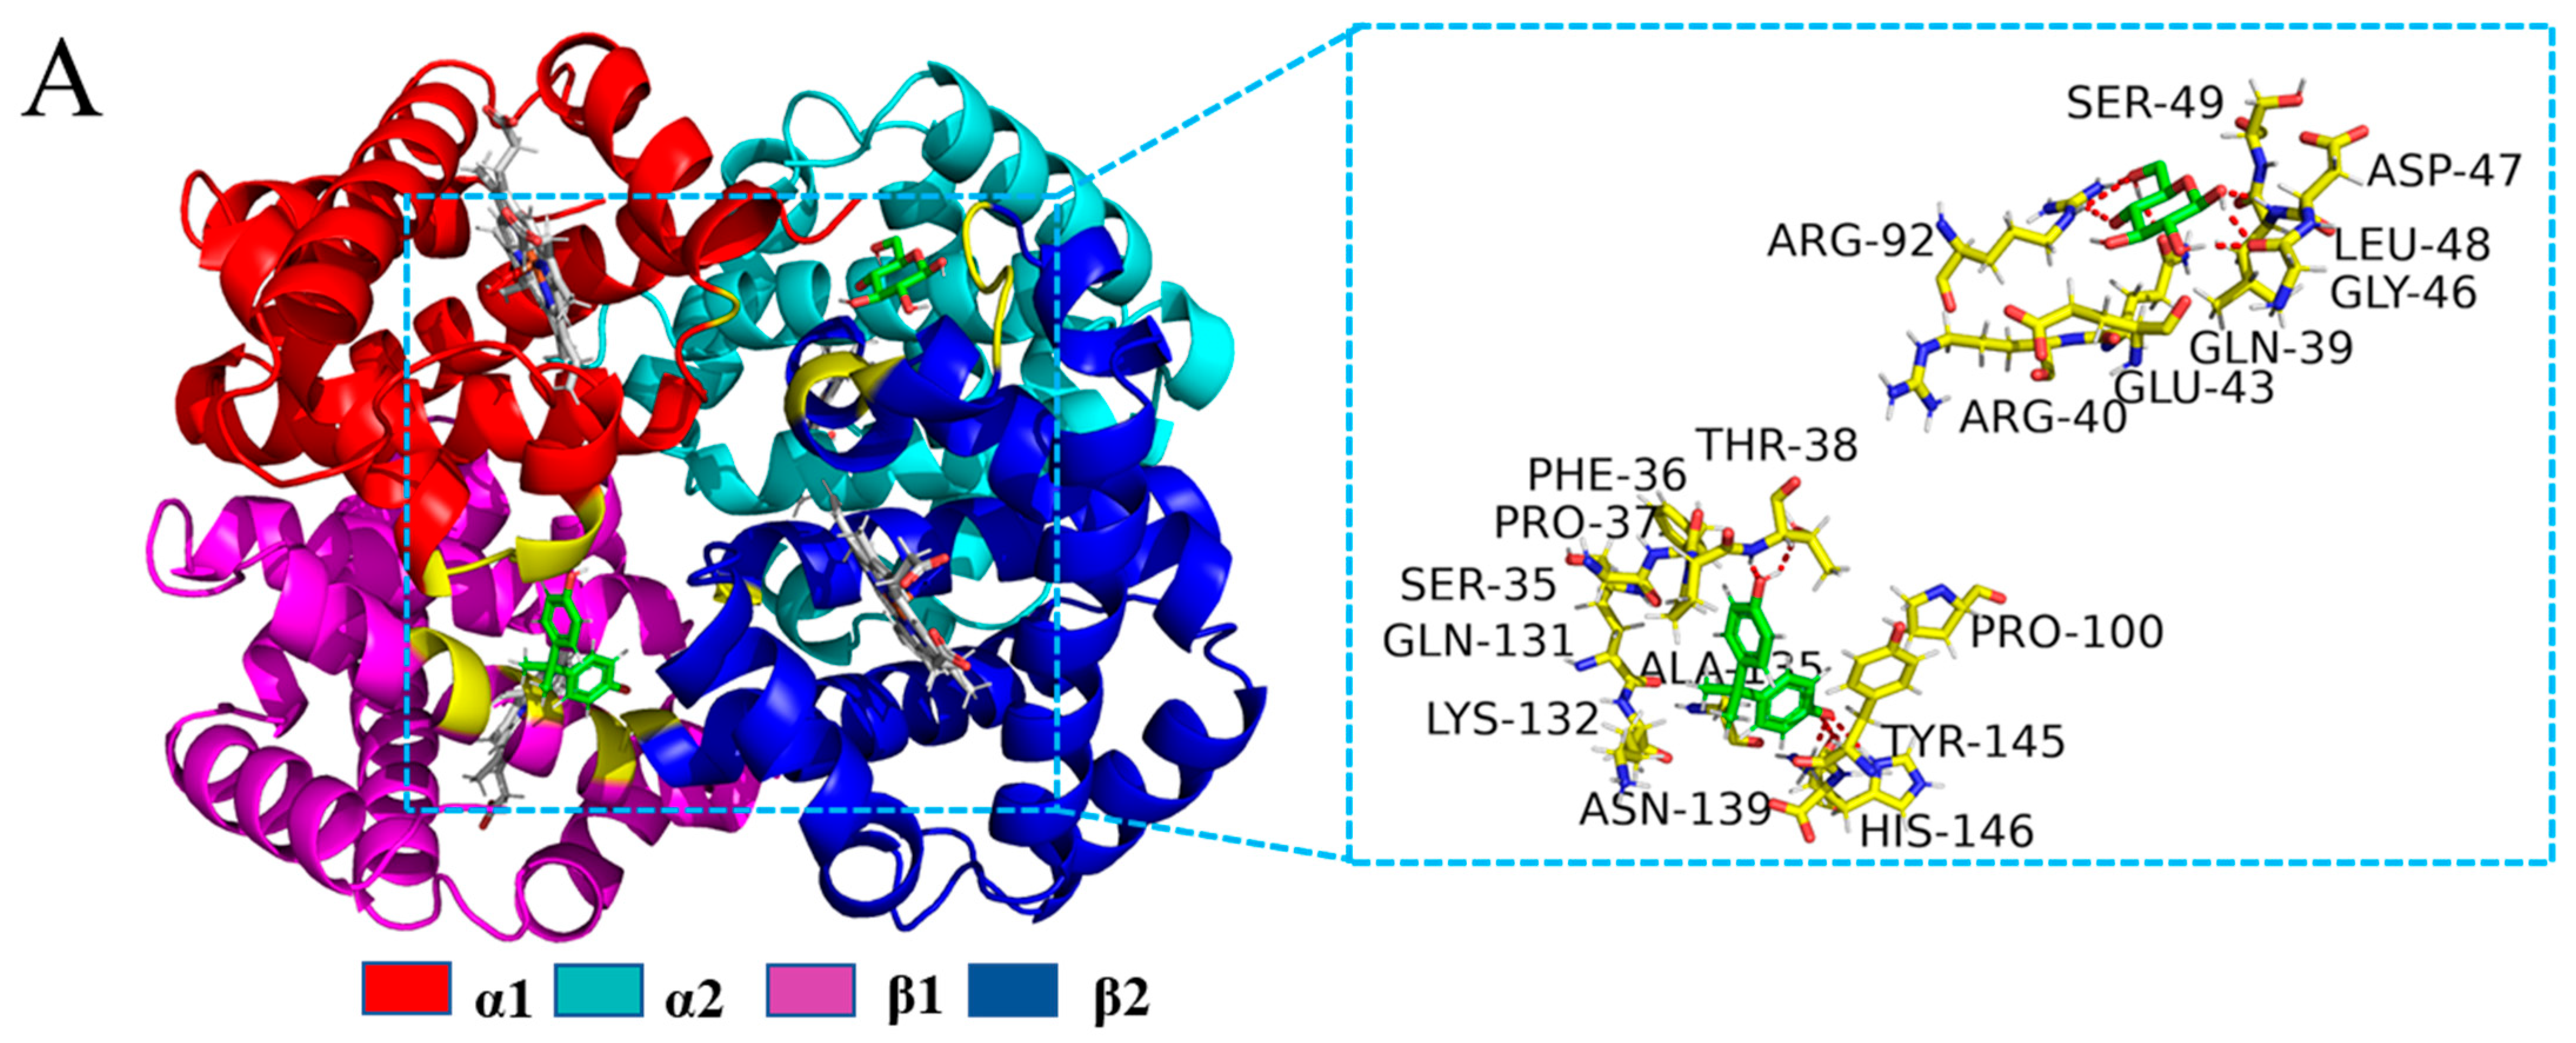
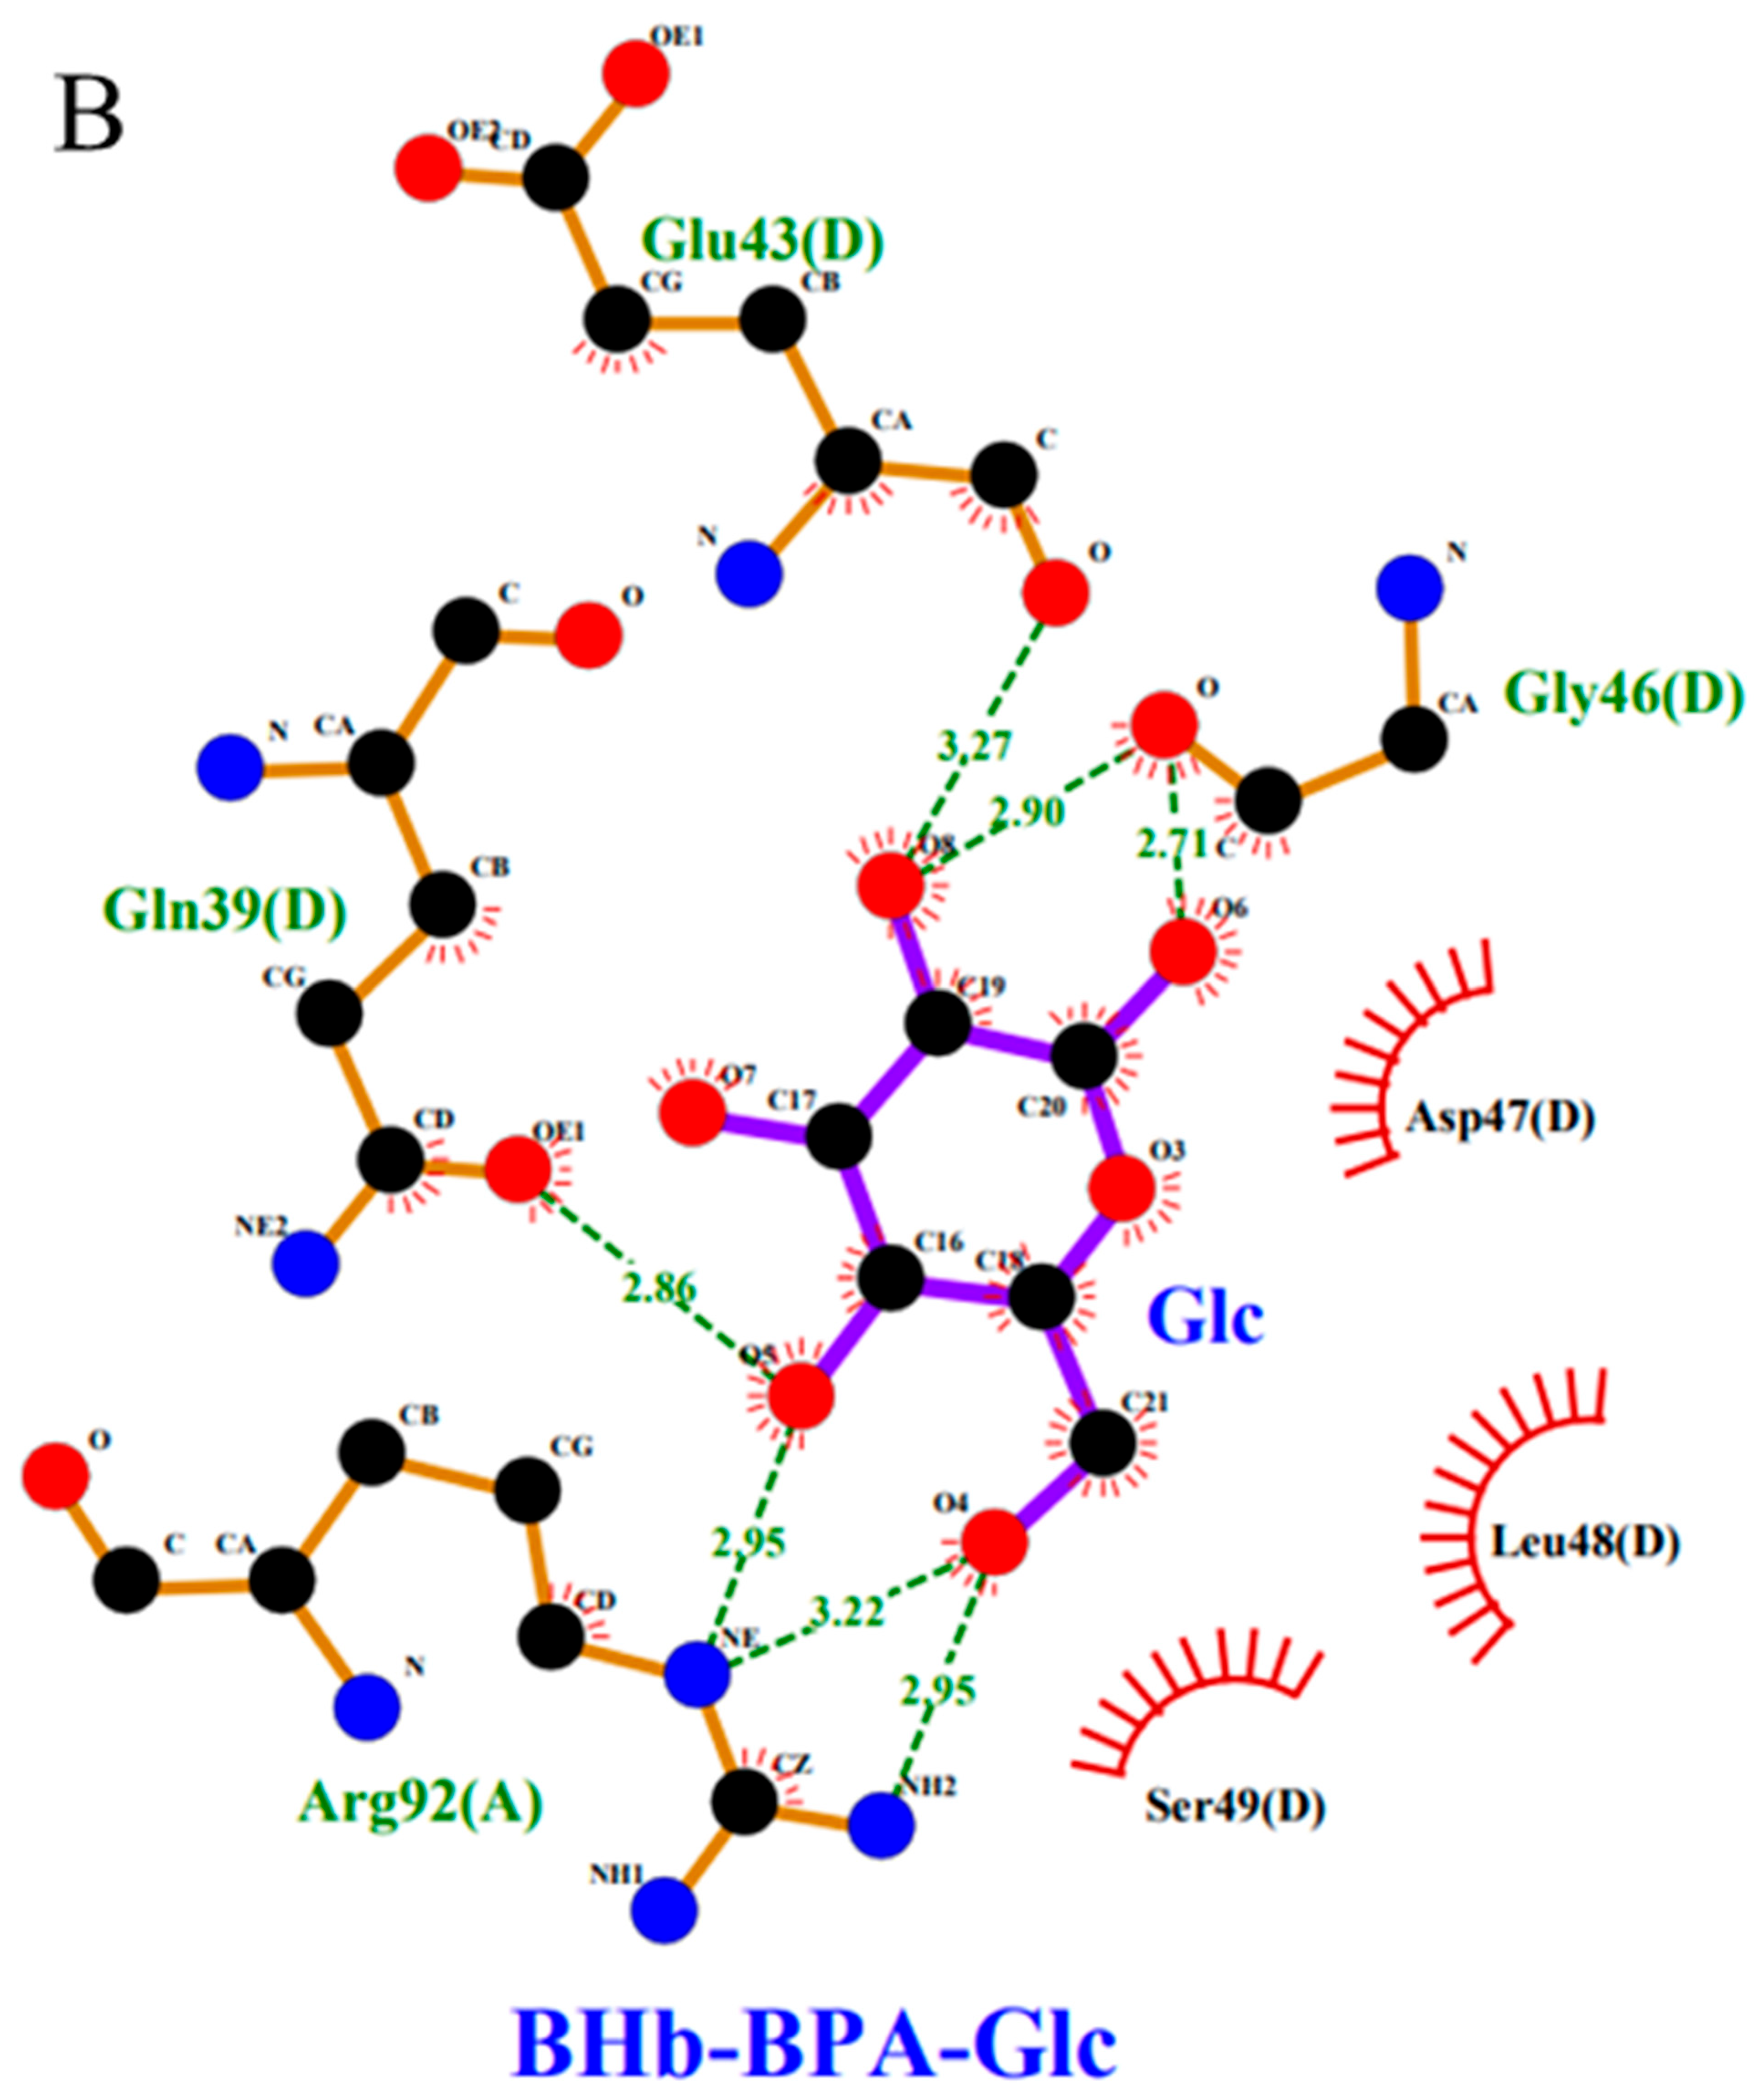
2.6. Molecular Modeling Study
3. Materials and Methods
3.1. Materials
3.2. Spectroscopic Studies
3.2.1. Ultraviolet (UV) Spectroscopy
3.2.2. Steady-State Fluorescence Spectra
3.2.3. Synchronized Fluorescence Spectroscopy
3.2.4. Circular Dichroism Spectroscopy
3.2.5. FTIR Spectra
3.3. Study of Molecular Docking Techniques
4. Conclusions
Supplementary Materials
Author Contributions
Funding
Institutional Review Board Statement
Informed Consent Statement
Data Availability Statement
Conflicts of Interest
References
- Vilarinho, F.; Sendon, R.; van der Kellen, A.; Vaz, M.F.; Silva, A.S. Bisphenol A in food as a result of its migration from food packaging. Trends Food Sci. Technol. 2019, 91, 33–65. [Google Scholar] [CrossRef]
- Vogel, S.A. The politics of plastics: The making and unmaking of bisphenol a “safety”. Am. J. Public Health 2009, 99 (Suppl. 3), S559–S566. [Google Scholar] [CrossRef] [PubMed]
- Garcia-Corcoles, M.T.; Cipa, M.; Rodriguez-Gomez, R.; Rivas, A.; Olea-Serrano, F.; Vilchez, J.L.; Zafra-Gomez, A. Determination of bisphenols with estrogenic activity in plastic packaged baby food samples using solid-liquid extraction and clean-up with dispersive sorbents followed by gas chromatography tandem mass spectrometry analysis. Talanta 2018, 178, 441–448. [Google Scholar] [CrossRef] [PubMed]
- Ma, Y.; Liu, H.H.; Wu, J.X.; Yuan, L.; Wang, Y.Q.; Du, X.D.; Wang, R.; Marwa, P.W.; Petlulu, P.; Chen, X.H.; et al. The adverse health effects of bisphenol A and related toxicity mechanisms. Environ. Res. 2019, 176, 108575. [Google Scholar] [CrossRef] [PubMed]
- Cwiek-Ludwicka, K. Bisphenol A (BPA) in food contact materials—New scientific opinion from EFSA regarding public health risk. Rocz. Panstw. Zakl. Hig. 2015, 66, 299–307. [Google Scholar] [PubMed]
- Diamanti-Kandarakis, E.; Bourguignon, J.P.; Giudice, L.C.; Hauser, R.; Prins, G.S.; Soto, A.M.; Zoeller, R.T.; Gore, A.C. Endocrine-Disrupting Chemicals: An Endocrine Society Scientific Statement. Endocr. Rev. 2009, 30, 293–342. [Google Scholar] [CrossRef] [PubMed]
- Meli, R.; Monnolo, A.; Annunziata, C.; Pirozzi, C.; Ferrante, M.C. Oxidative Stress and BPA Toxicity: An Antioxidant Approach for Male and Female Reproductive Dysfunction. Antioxidants 2020, 9, 405. [Google Scholar] [CrossRef] [PubMed]
- Zhang, Y.F.; Shan, C.; Wang, Y.; Qian, L.L.; Jia, D.D.; Zhang, Y.F.; Hao, X.D.; Xu, H.M. Cardiovascular toxicity and mechanism of bisphenol A and emerging risk of bisphenol S. Sci. Total Environ. 2020, 723, 137952. [Google Scholar] [CrossRef]
- Ikhlas, S.; Usman, A.; Ahmad, M. Comparative study of the interactions between bisphenol-A and its endocrine disrupting analogues with bovine serum albumin using multi-spectroscopic and molecular docking studies. J. Biomol. Struct. Dyn. 2019, 37, 1427–1437. [Google Scholar] [CrossRef]
- Forget, B.G.; Bunn, H.F. Classification of the Disorders of Hemoglobin. Cold Spring Harb. Perspect. Med. 2013, 3, a011684. [Google Scholar] [CrossRef]
- Wu, Q.; Zhao, H.Z.; Chen, X.F.; Cai, Z.W. Interaction of bisphenol A 3, 4-quinone metabolite with human hemoglobin, human serum albumin and cytochrome c in vitro. Chemosphere 2019, 220, 930–936. [Google Scholar] [CrossRef] [PubMed]
- Wang, Y.Q.; Zhang, H.M.; Zhou, Q.H. Studies on the interaction of caffeine with bovine hemoglobin. Eur. J. Med. Chem. 2009, 44, 2100–2105. [Google Scholar] [CrossRef] [PubMed]
- Zhang, X.; Zhang, R.; Zong, W.; Liu, R. Interactions of three bisphenol analogues with hemoglobin investigated by spectroscopy and molecular docking. J. Mol. Recognit. 2019, 32, e2758. [Google Scholar] [CrossRef] [PubMed]
- Fang, X.Y.; Cao, S.T.; Liu, R.T. Interaction of Bisphenol A with Bovine Hemoglobin Using Spectroscopic and Molecular Modeling Methods. Appl. Spectrosc. 2011, 65, 1250–1253. [Google Scholar] [CrossRef] [PubMed]
- Abri-Mehraban, F.; Zargar, S.J.; Salarizadeh, N. The effect of glucose on doxorubicin and human hemoglobin interaction: Characterization with spectroscopic techniques. Int. J. Biol. Macromol. 2021, 181, 193–201. [Google Scholar] [CrossRef] [PubMed]
- Safo, M.K.; Ahmed, M.H.; Ghatge, M.S.; Boyiri, T. Hemoglobin-ligand binding: Understanding Hb function and allostery on atomic level. Biochim. Biophys. Acta-Proteins Proteom. 2011, 1814, 797–809. [Google Scholar] [CrossRef] [PubMed]
- Mohammadi, T.; Ghayeb, Y.; Sharifi, T.; Khayamian, T. The effect of dichlorvos on the structural alteration of serum albumins: A combined spectroscopic and molecular dynamic simulation approach. Monatshefte Chem. 2017, 148, 1141–1151. [Google Scholar] [CrossRef]
- Patil, S.; Sandberg, A.; Heckert, E.; Self, W.; Seal, S. Protein adsorption and cellular uptake of cerium oxide nanoparticles as a function of zeta potential. Biomaterials 2007, 28, 4600–4607. [Google Scholar] [CrossRef]
- Bielecki, M.; Wojtowicz, H.; Olczak, T. Differential roles of tryptophan residues in conformational stability of Porphyromonas gingivalis HmuY hemophore. BMC Biochem. 2014, 15, 2. [Google Scholar] [CrossRef]
- Shi, J.H.; Chen, J.; Wang, J.; Zhu, Y.Y.; Wang, Q. Binding interaction of sorafenib with bovine serum albumin: Spectroscopic methodologies and molecular docking. Spectrochim. Acta Part A-Mol. Biomol. Spectrosc. 2015, 149, 630–637. [Google Scholar] [CrossRef]
- Krisanti, E.A.; Saputra, K.; Arif, M.M.; Mulia, K. Formulation and characterization of betaine-based deep eutectic solvent for extraction phenolic compound from spent coffee grounds. In Proceedings of the 5th International Symposium on Applied Chemistry, Tangerang, Indonesia, 23–24 October 2019. [Google Scholar]
- Makarska-Bialokoz, M. Interactions of hemin with bovine serum albumin and human hemoglobin: A fluorescence quenching study. Spectrochim. Acta Part A-Mol. Biomol. Spectrosc. 2018, 193, 23–32. [Google Scholar] [CrossRef] [PubMed]
- Guowen, Z.; Yadi, M.; Lin, W.; Yepeng, Z.; Jia, Z. Multispectroscopic studies on the interaction of maltol, a food additive, with bovine serum albumin. Food Chem. 2012, 133, 264–270. [Google Scholar]
- Suryawanshi, V.D.; Walekar, L.S.; Gore, A.H.; Anbhule, P.V.; Kolekar, G.B. Spectroscopic analysis on the binding interaction of biologically active pyrimidine derivative with bovine serum albumin. J. Pharm. Anal. 2016, 6, 56–63. [Google Scholar] [CrossRef] [PubMed]
- Jafari, F.; Samadi, S.; Nowroozi, A.; Sadrjavadi, K.; Moradi, S.; Ashrafi-Kooshk, M.R.; Shahlaei, M. Experimental and computational studies on the binding of diazinon to human serum albumin. J. Biomol. Struct. Dyn. 2018, 36, 1490–1510. [Google Scholar] [CrossRef] [PubMed]
- Alpert, B.; Jameson, D.M.; Weber, G. Tryptophan emission from human hemoglobin and its isolated subunits. Photochem. Photobiol. 1980, 31, 1–4. [Google Scholar] [CrossRef] [PubMed]
- Chi, Z.X.; Liu, R.T.; Yang, B.J.; Zhang, H. Toxic interaction mechanism between oxytetracycline and bovine hemoglobin. J. Hazard. Mater. 2010, 180, 741–747. [Google Scholar] [CrossRef] [PubMed]
- Yasmeen, S.; Riyazuddeen. Exploring thermodynamic parameters and the binding energetic of berberine chloride to bovine serum albumin (BSA): Spectroscopy, isothermal titration calorimetry and molecular docking techniques. Thermochim. Acta 2017, 655, 76–86. [Google Scholar] [CrossRef]
- Lu, J.Q.; Jin, F.; Sun, T.Q.; Zhou, X.W. Multi-spectroscopic study on interaction of bovine serum albumin with lomefloxacin-copper(II) complex. Int. J. Biol. Macromol. 2007, 40, 299–304. [Google Scholar] [CrossRef]
- Ding, F.; Wei, L.; Diao, J.X.; Sun, Y. Characterization of Alizarin Red S binding sites and structural changes on human serum albumin: A biophysical study. J. Hazard. Mater. 2011, 186, 352–359. [Google Scholar] [CrossRef]
- Gu, J.L.; Huang, X.Y.; Liu, H.R.; Dong, D.B.; Sun, X.K. A mutispectroscopic study on the structure-affinity relationship of the interactions of bisphenol analogues with bovine serum albumin. Chemosphere 2022, 291, 132769. [Google Scholar] [CrossRef]
- Xu, L.L.; Liu, Z.Q.; Liao, T.C.; Tuo, X. Probing the interaction between levamlodipine and hemoglobin based on spectroscopic and molecular docking methods. Spectrochim. Acta Part A-Mol. Biomol. Spectrosc. 2019, 223, 117306. [Google Scholar] [CrossRef] [PubMed]
- Nagy, G.; Grubmueller, H. Inaccuracies in Circular Dichroism Spectroscopy Based Secondary Structure Estimates. Biophys. J. 2020, 118, 361A. [Google Scholar] [CrossRef]
- Guler, G.; Vorob’ev, M.M.; Vogel, V.; Mantele, W. Proteolytically-induced changes of secondary structural protein conformation of bovine serum albumin monitored by Fourier transform infrared (FT-IR) and UV-circular dichroism spectroscopy. Spectrochim. Acta Part A-Mol. Biomol. Spectrosc. 2016, 161, 8–18. [Google Scholar] [CrossRef] [PubMed]
- Zhang, Y.Z.; Zhou, B.; Zhang, X.P.; Huang, P.; Li, C.H.; Liu, Y. Interaction of malachite green with bovine serum albumin: Determination of the binding mechanism and binding site by spectroscopic methods. J. Hazard. Mater. 2009, 163, 1345–1352. [Google Scholar] [CrossRef]
- Briehl, R.W.; Ranney, H.M. Ultraviolet difference spectra in human hemoglobin. II. Difference spectra in isolated subunits of hemoglobin. J. Biol. Chem. 1970, 245, 555–558. [Google Scholar]
- Mueser, T.C.; Rogers, P.H.; Arnone, A. Interface sliding as illustrated by the multiple quaternary structures of liganded hemoglobin. Biochemistry 2000, 39, 15353–15364. [Google Scholar] [CrossRef]
- Tian, F.F.; Jiang, F.L.; Han, X.L.; Xiang, C.; Ge, Y.S.; Li, J.H.; Zhang, Y.; Li, R.; Ding, X.L.; Liu, Y. Synthesis of a Novel Hydrazone Derivative and Biophysical Studies of Its Interactions with Bovine Serum Albumin by Spectroscopic, Electrochemical, and Molecular Docking Methods. J. Phys. Chem. B 2010, 114, 14842–14853. [Google Scholar] [CrossRef]
- Wang, Y.Q.; Zhang, H.M.; Zhang, G.C.; Liu, S.X.; Zhou, Q.H.; Fei, Z.H.; Liu, Z.T. Studies of the interaction between paraquat and bovine hemoglobin. Int. J. Biol. Macromol. 2007, 41, 243–250. [Google Scholar] [CrossRef]
- Ali, M.S.; Al-Lohedan, H.A. Multi-technique approach on the interaction between sugar-based surfactant n-dodecyl beta-D-maltoside and bovine serum albumin. J. Lumin. 2016, 169, 35–42. [Google Scholar] [CrossRef]
- Seeliger, D.; de Groot, B.L. Ligand docking and binding site analysis with PyMOL and Autodock/Vina. J. Comput.-Aided Mol. Des. 2010, 24, 417–422. [Google Scholar] [CrossRef]
- Morris, G.M.; Goodsell, D.S.; Halliday, R.S.; Huey, R.; Hart, W.E.; Belew, R.K.; Olson, A.J. Automated docking using a Lamarckian genetic algorithm and an empirical binding free energy function. J. Comput. Chem. 1998, 19, 1639–1662. [Google Scholar] [CrossRef]

| BHb | BHb + BPA | BHb + BPA + Glc | BHb + Glc | |
|---|---|---|---|---|
| α-Helix% | 28.7 | 32.4 | 33.9 | 29.7 |
| α-Helix% (1660–1649) | β-Sheet% (1637–1610) | β-Turn% (1680–1660) | Antiparallel β-Sheet% (1690–1680) | Random Coil% (1648–1638) | |
|---|---|---|---|---|---|
| BHb | 22.0 | 32.8 | 16.0 | 7.8 | 21.4 |
| BHb + Glc | 23.4 | 29.8 | 16.2 | 7.6 | 22.9 |
| BHb + BPA | 25.0 | 29.2 | 17.7 | 8.4 | 19.6 |
| BHb + BPA + Glc | 26.9 | 26.1 | 17.1 | 7.6 | 22.3 |
Disclaimer/Publisher’s Note: The statements, opinions and data contained in all publications are solely those of the individual author(s) and contributor(s) and not of MDPI and/or the editor(s). MDPI and/or the editor(s) disclaim responsibility for any injury to people or property resulting from any ideas, methods, instructions or products referred to in the content. |
© 2023 by the authors. Licensee MDPI, Basel, Switzerland. This article is an open access article distributed under the terms and conditions of the Creative Commons Attribution (CC BY) license (https://creativecommons.org/licenses/by/4.0/).
Share and Cite
Li, X.; Li, H.; Lai, K.; Miao, J. The Effect of Glucose on the Interaction of Bisphenol A and Bovine Hemoglobin Characterized by Spectroscopic and Molecular Docking Techniques. Int. J. Mol. Sci. 2023, 24, 14708. https://doi.org/10.3390/ijms241914708
Li X, Li H, Lai K, Miao J. The Effect of Glucose on the Interaction of Bisphenol A and Bovine Hemoglobin Characterized by Spectroscopic and Molecular Docking Techniques. International Journal of Molecular Sciences. 2023; 24(19):14708. https://doi.org/10.3390/ijms241914708
Chicago/Turabian StyleLi, Xianheng, Huan Li, Keqiang Lai, and Junjian Miao. 2023. "The Effect of Glucose on the Interaction of Bisphenol A and Bovine Hemoglobin Characterized by Spectroscopic and Molecular Docking Techniques" International Journal of Molecular Sciences 24, no. 19: 14708. https://doi.org/10.3390/ijms241914708
APA StyleLi, X., Li, H., Lai, K., & Miao, J. (2023). The Effect of Glucose on the Interaction of Bisphenol A and Bovine Hemoglobin Characterized by Spectroscopic and Molecular Docking Techniques. International Journal of Molecular Sciences, 24(19), 14708. https://doi.org/10.3390/ijms241914708