

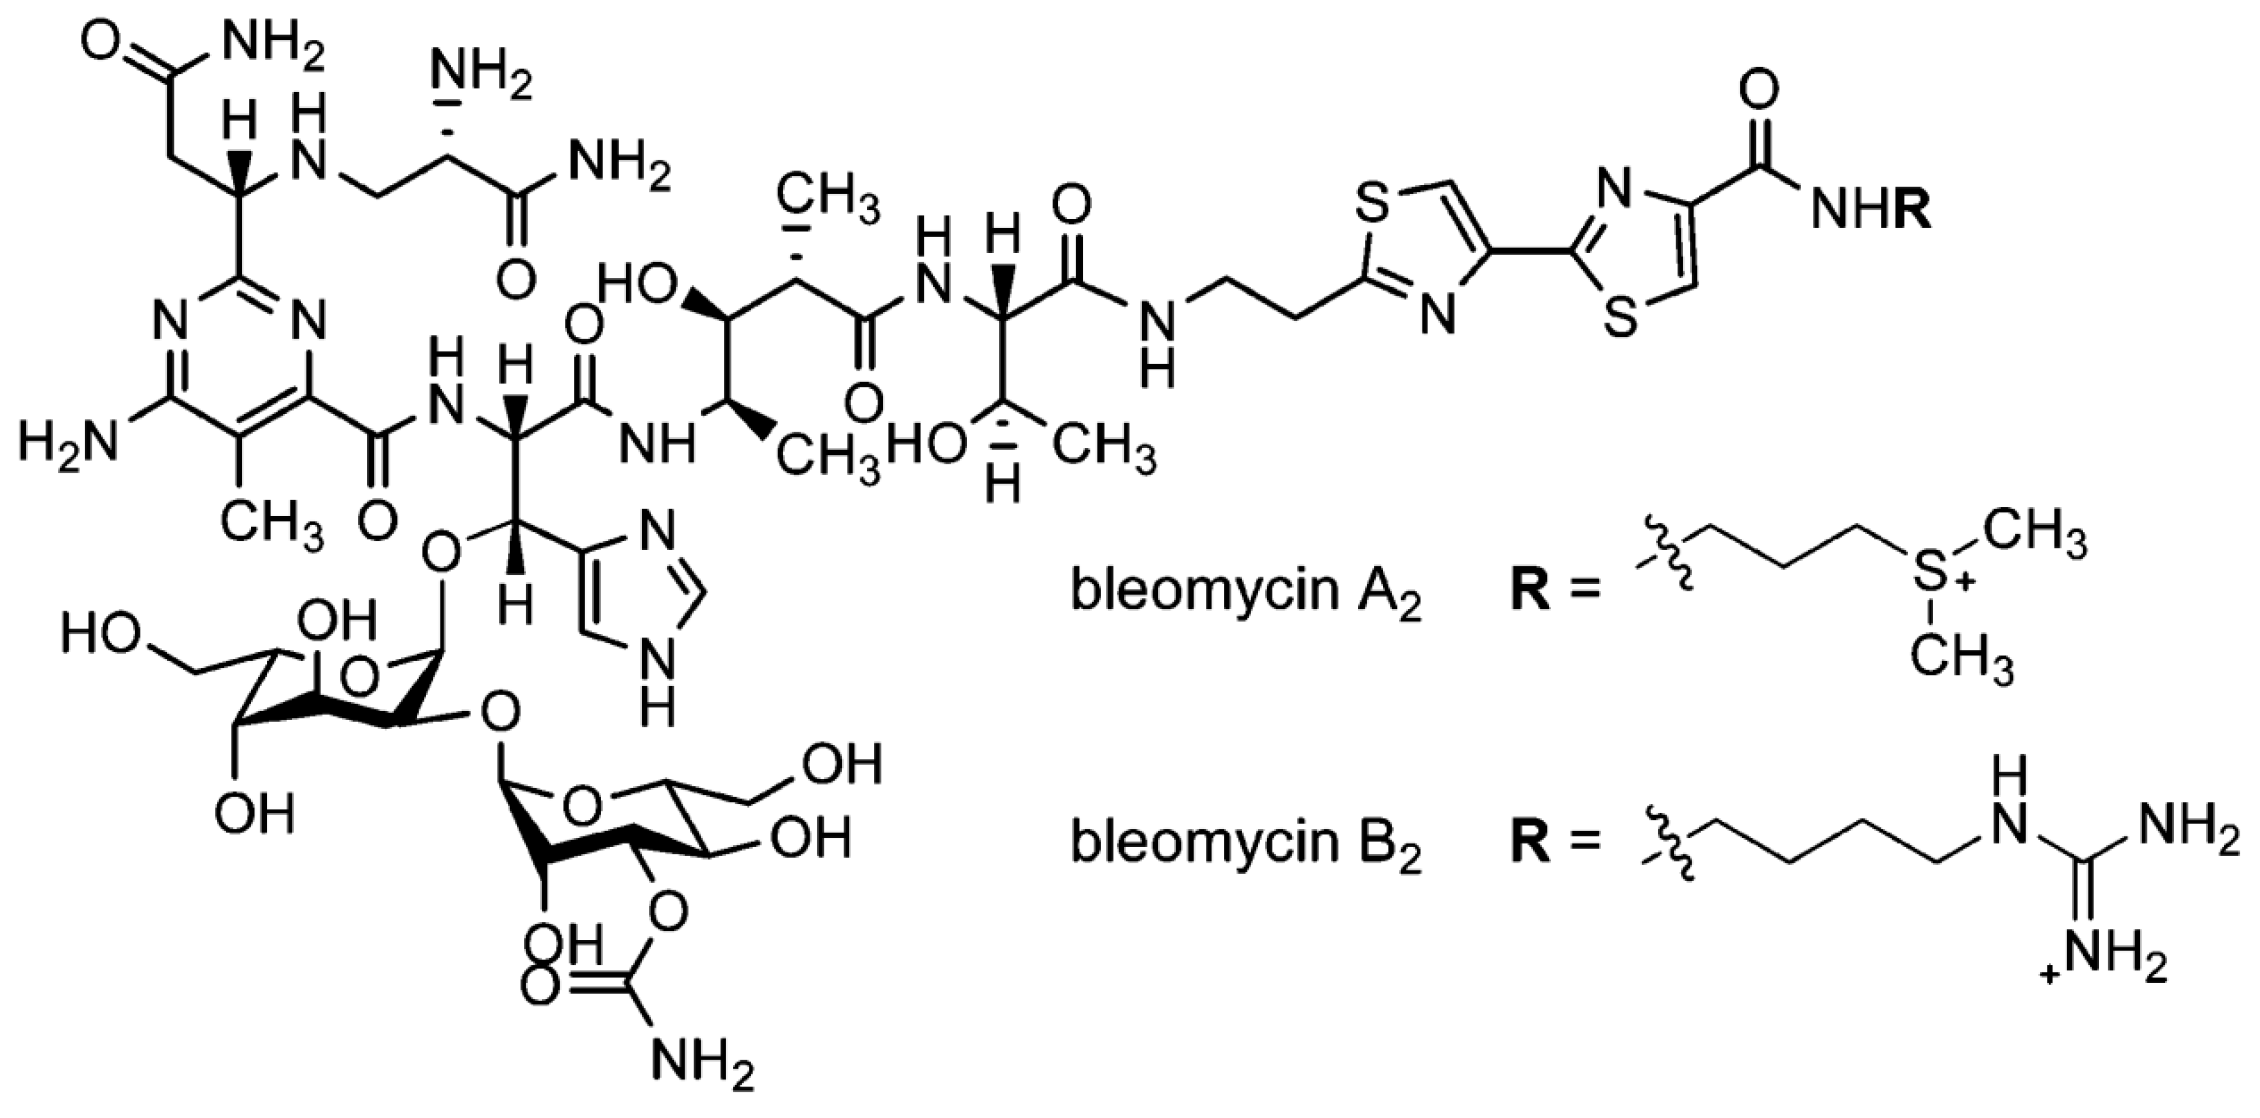
Interaction of Blenoxane and Congeners Bleomycins A2 and B2 with Human Plasma Proteins Using Circular Dichroism Spectroscopy


Abstract
:1. Introduction
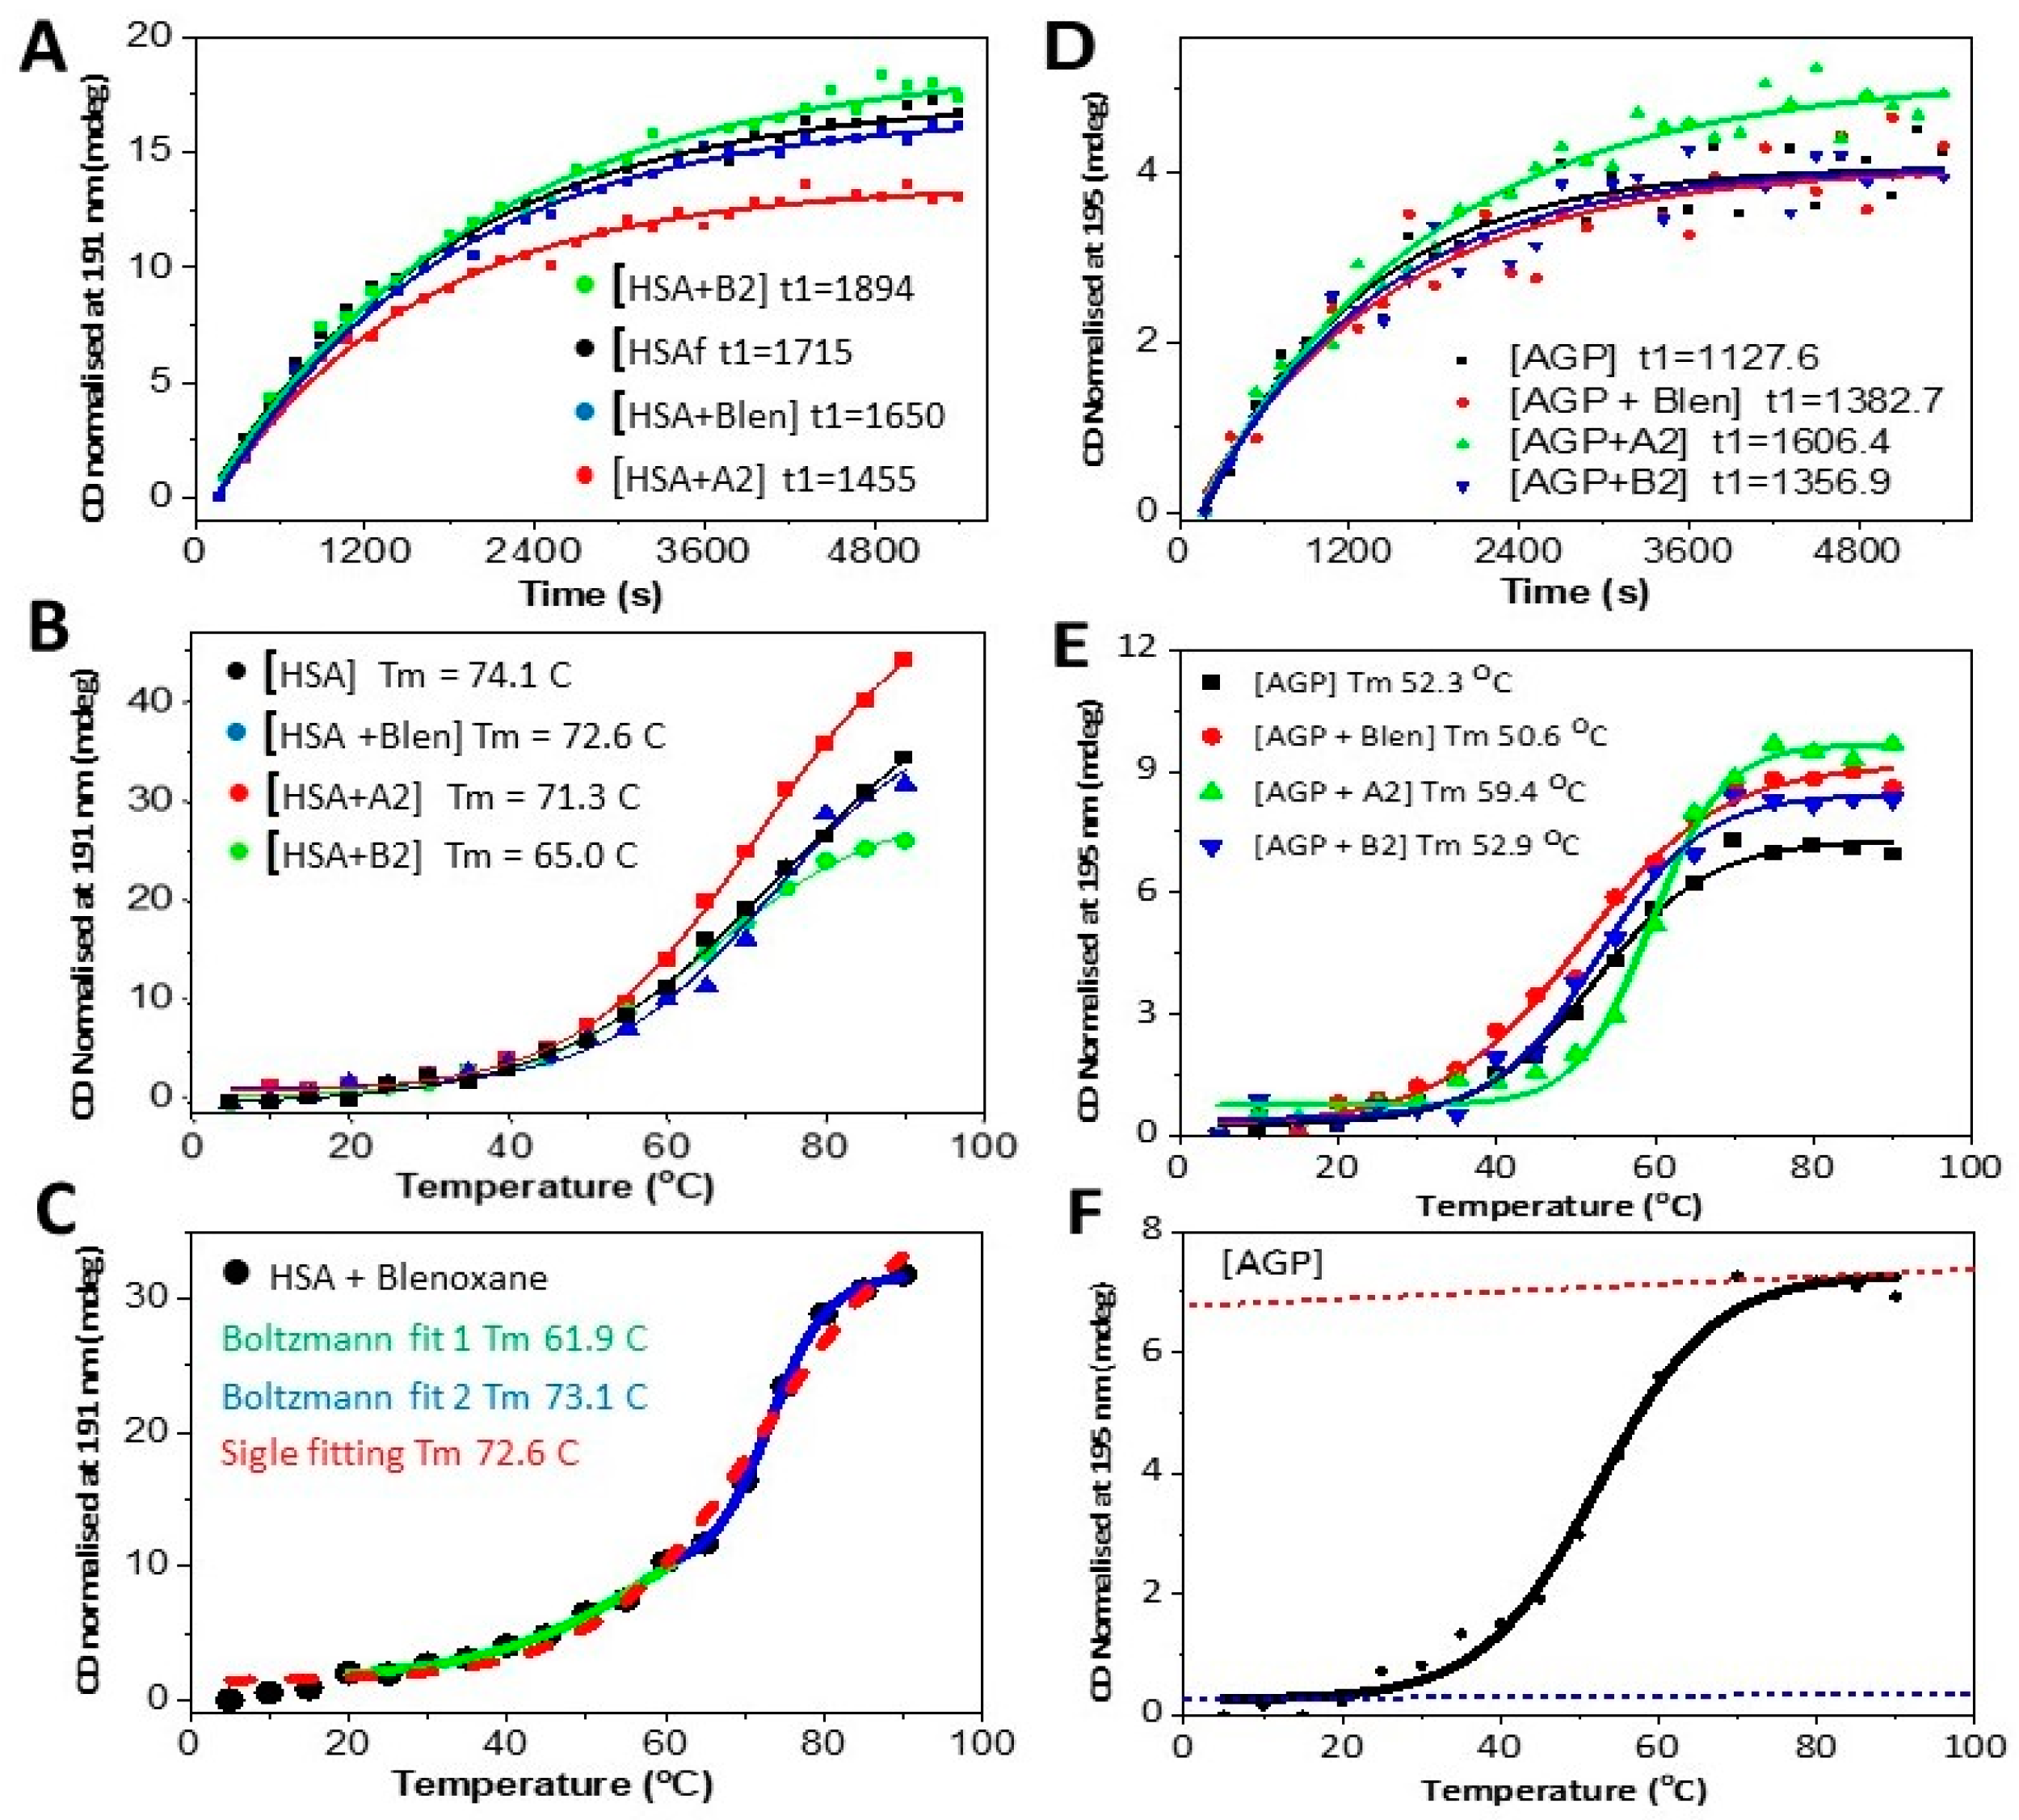
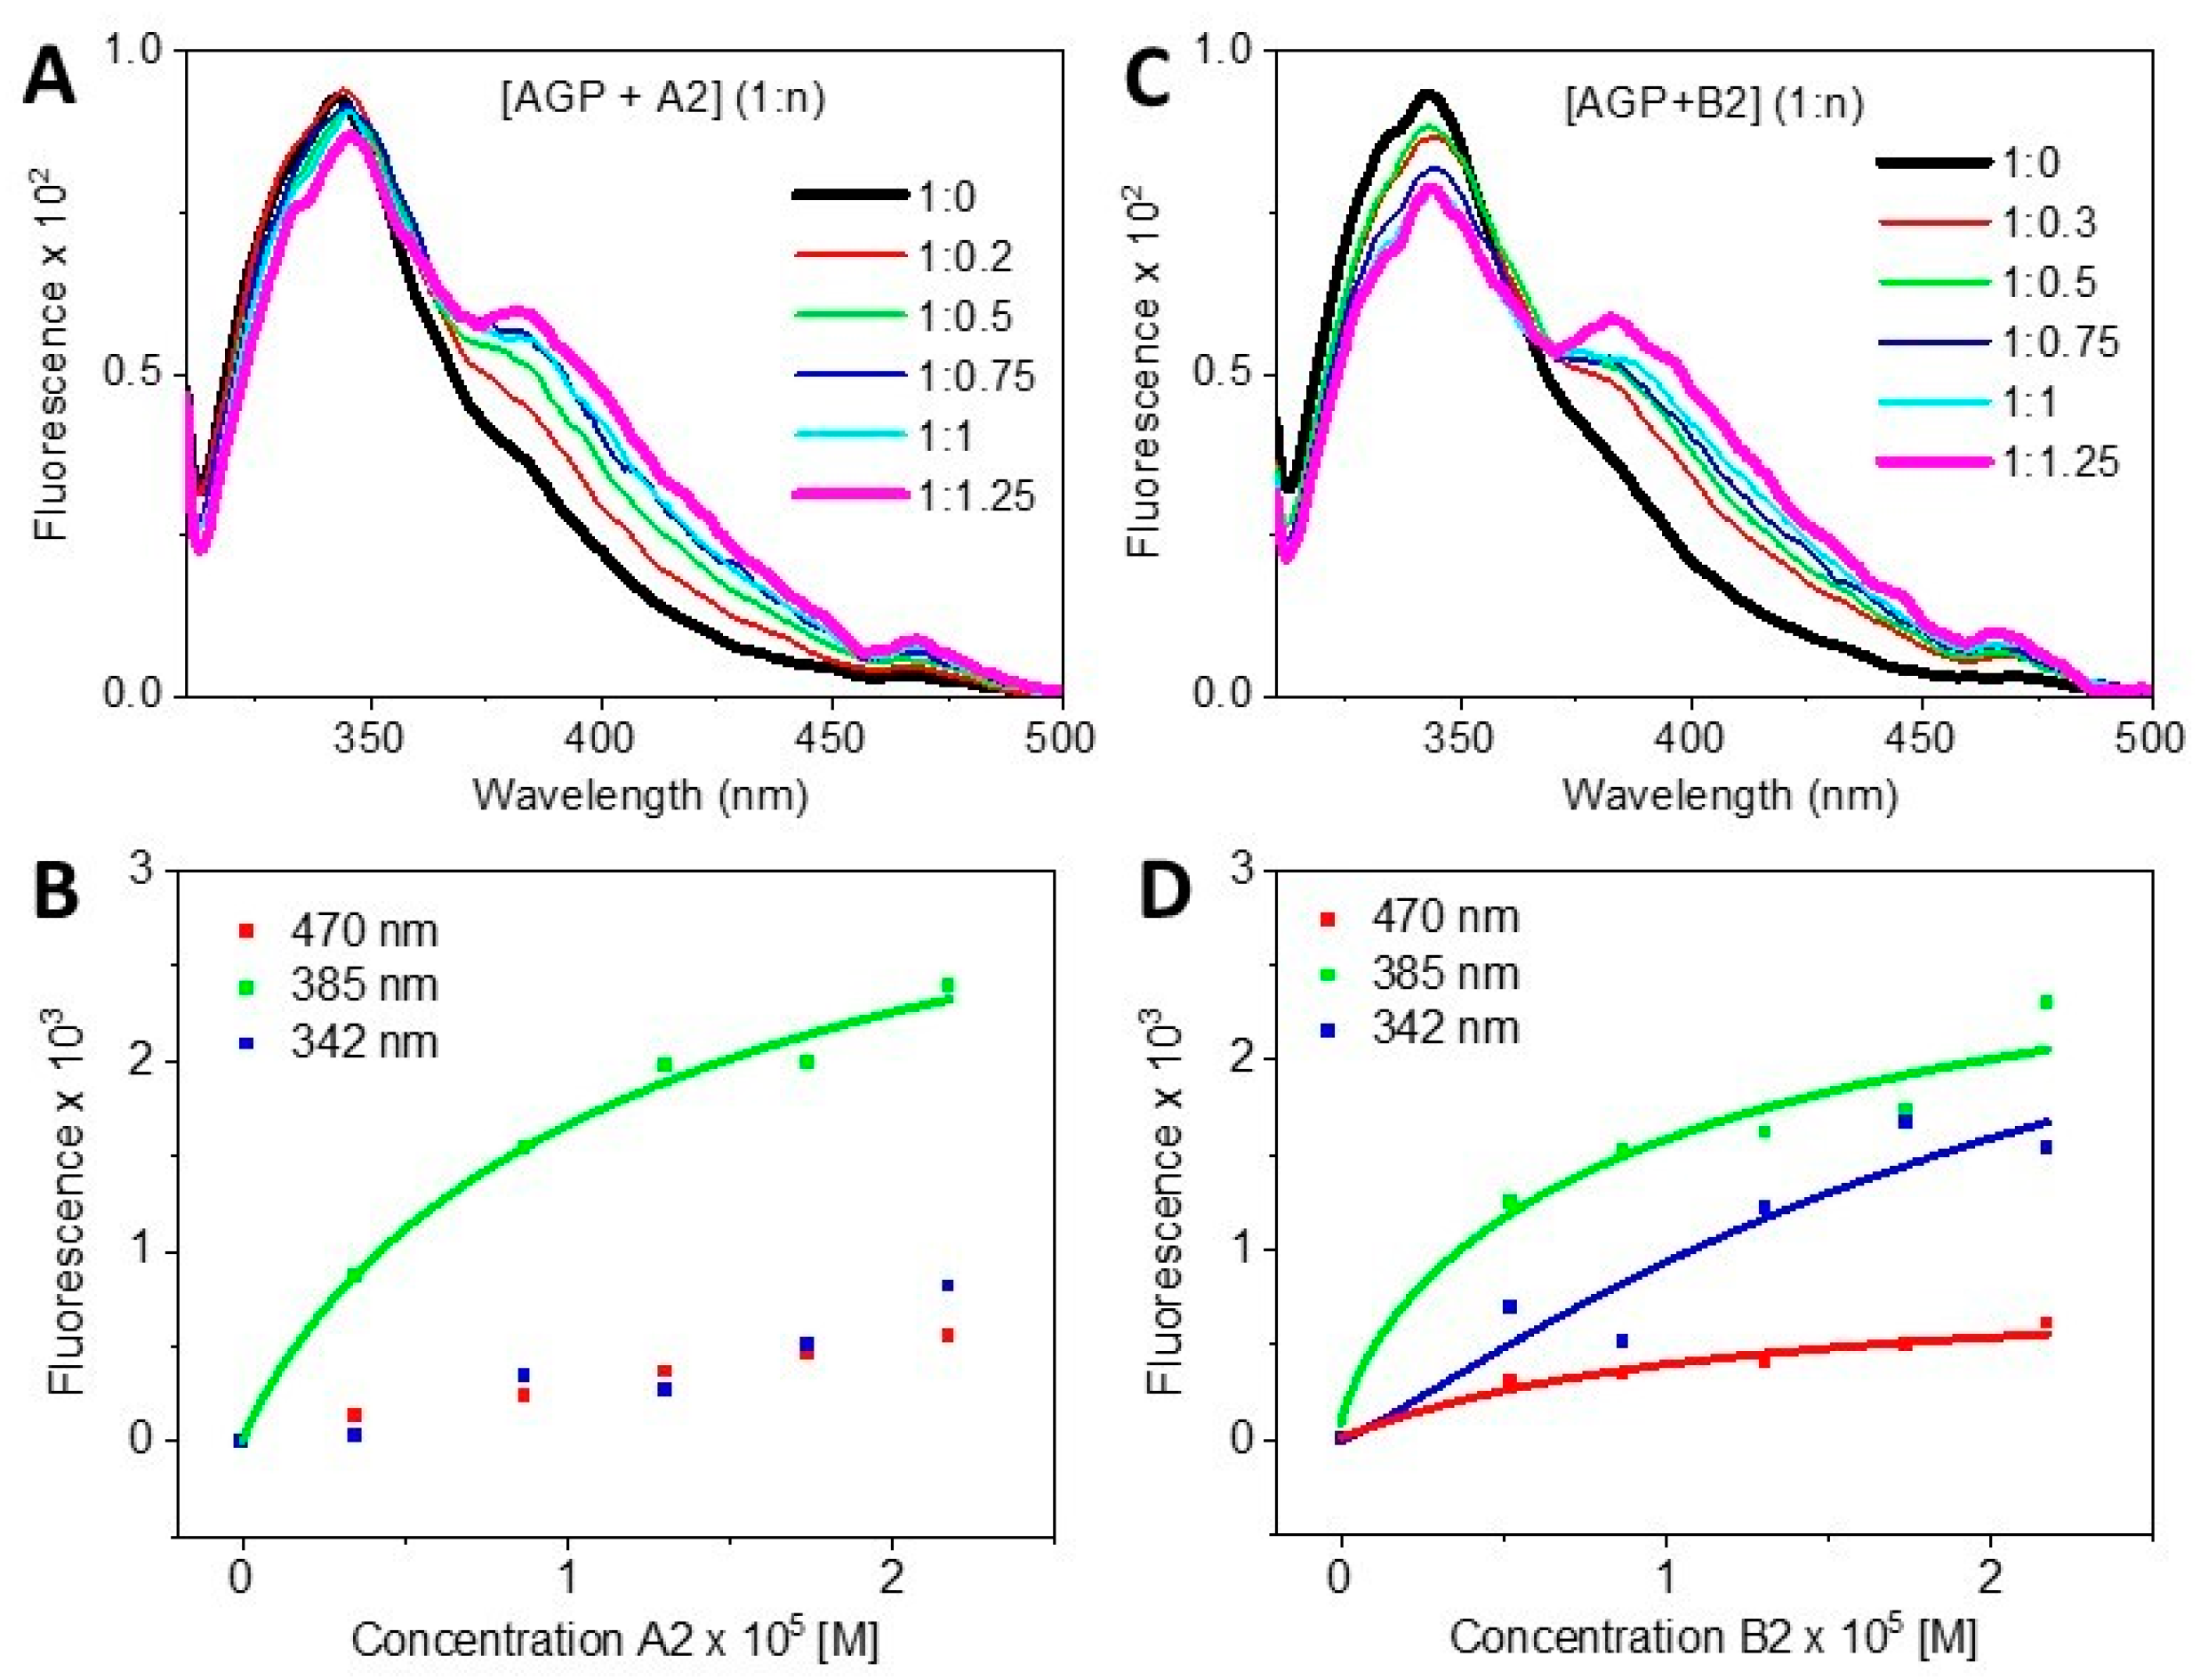
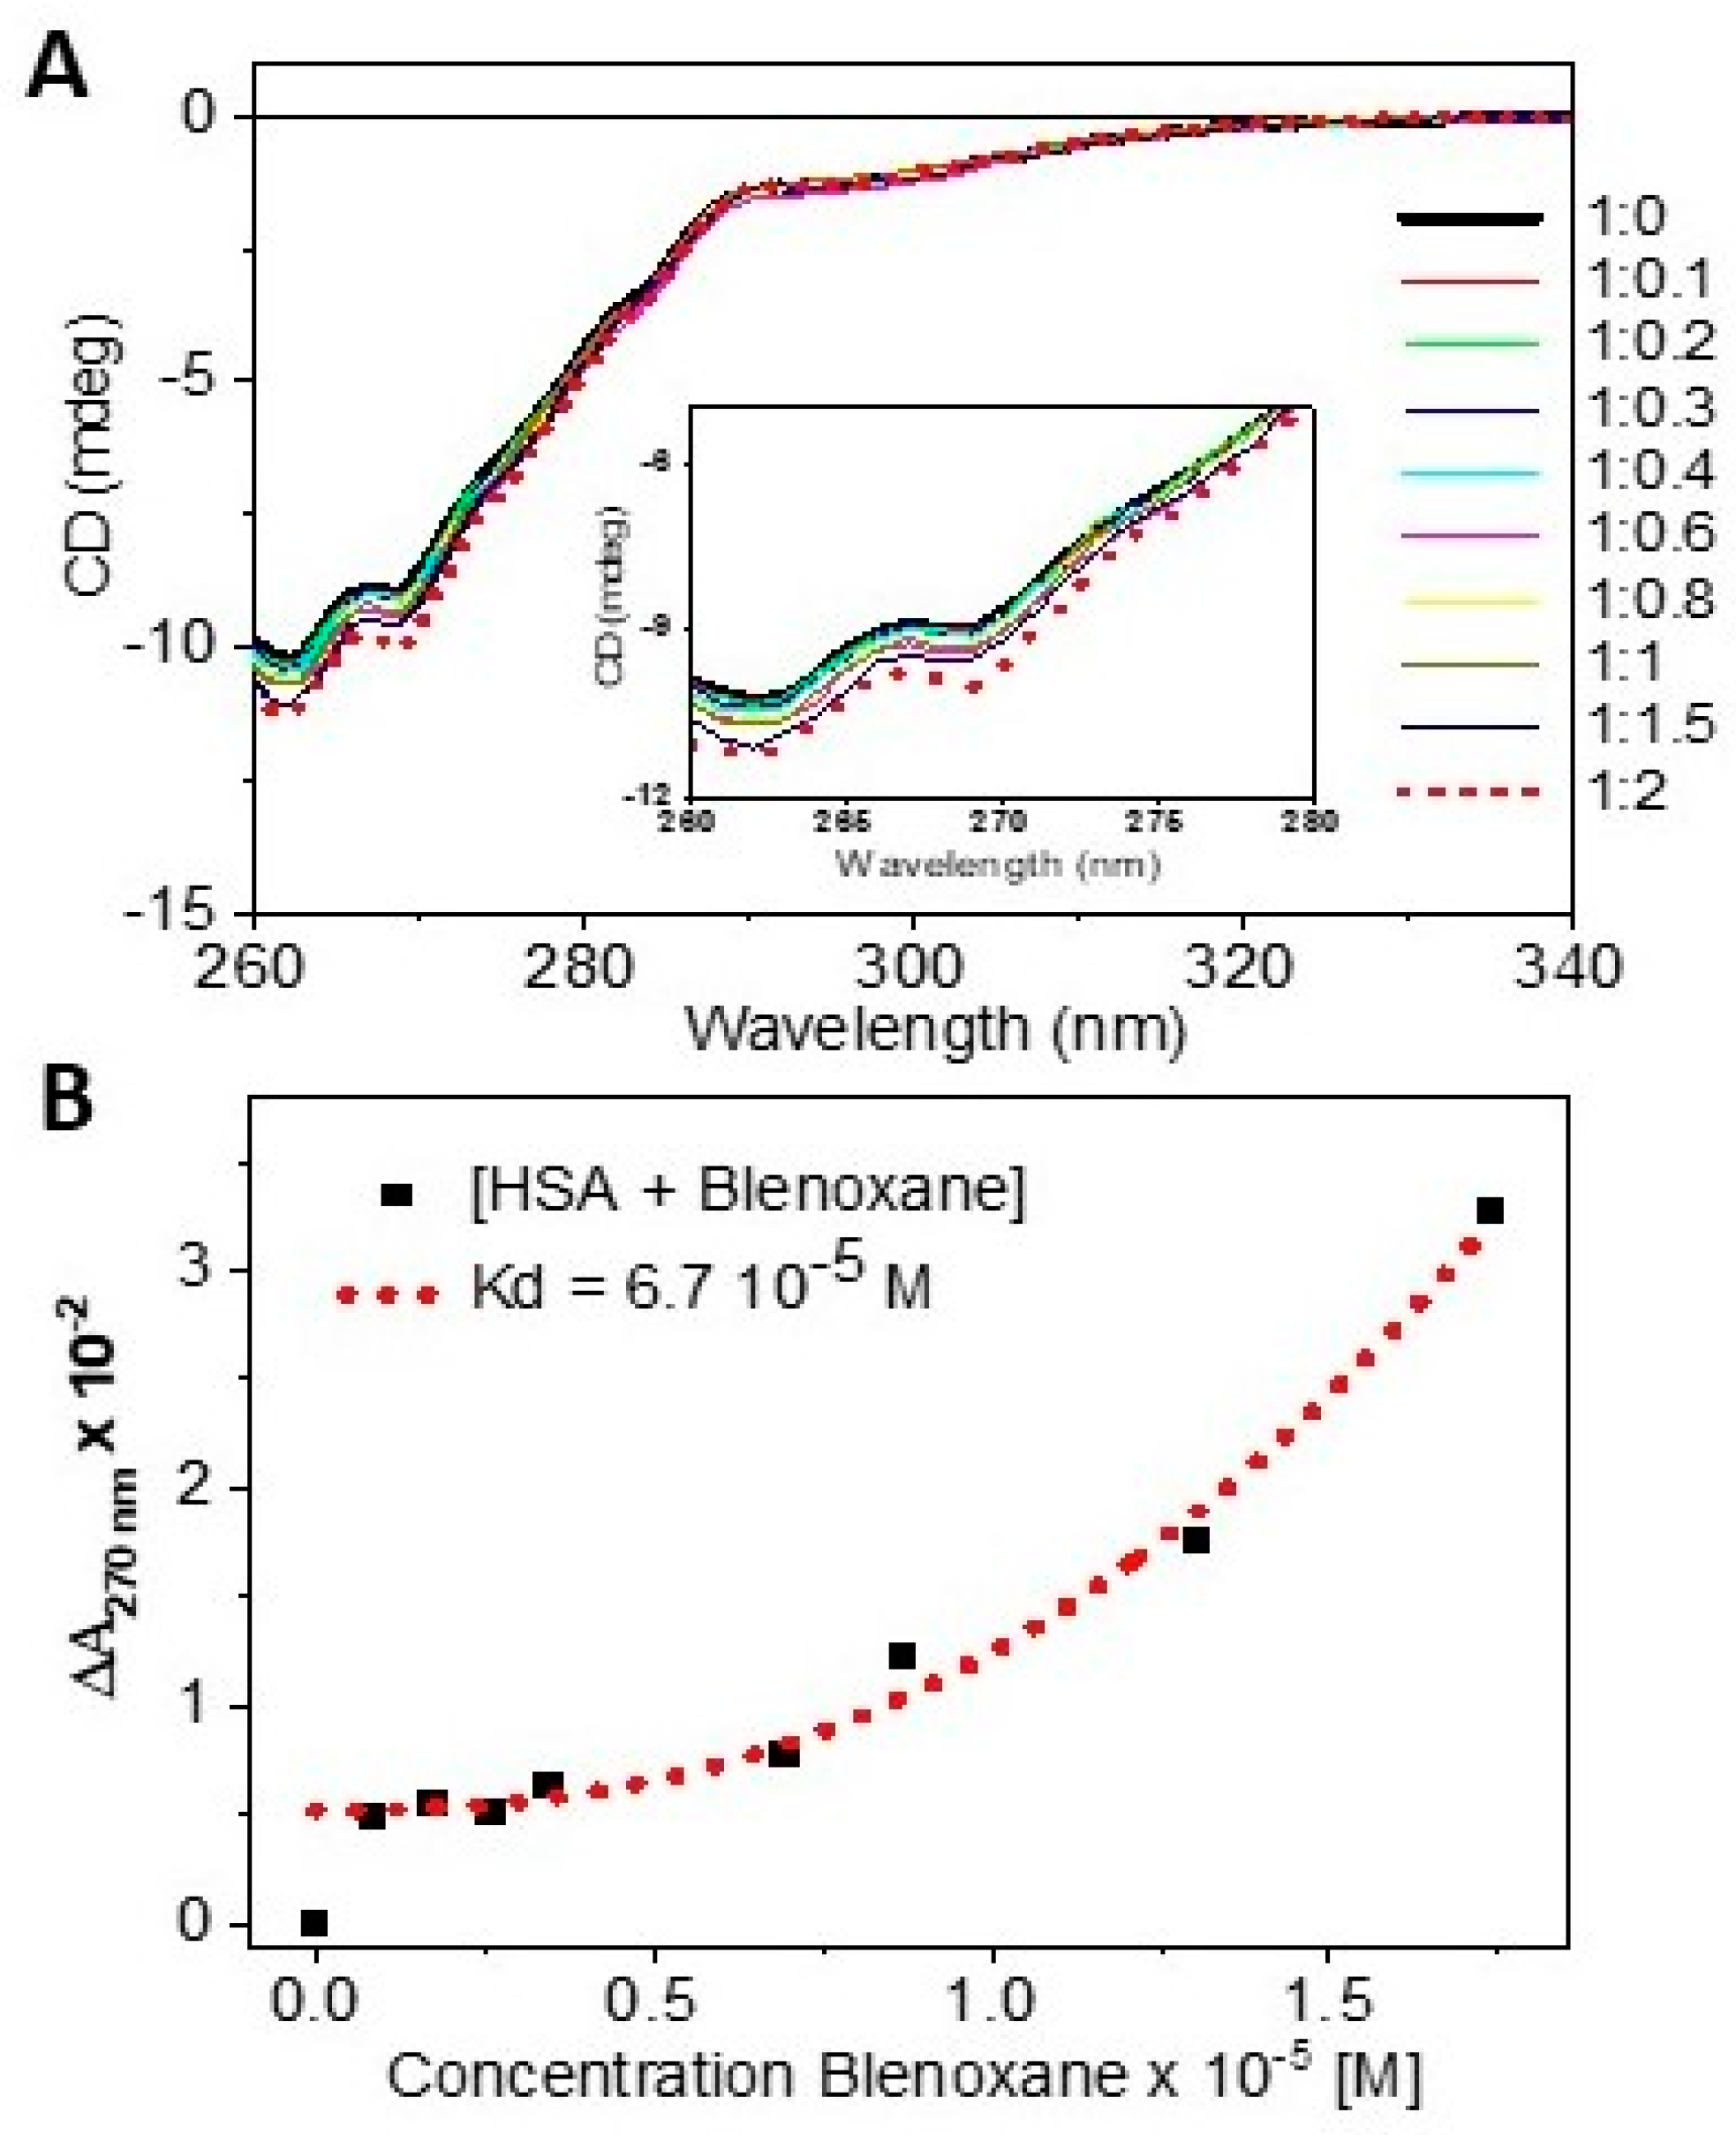
2. Results
- (i)
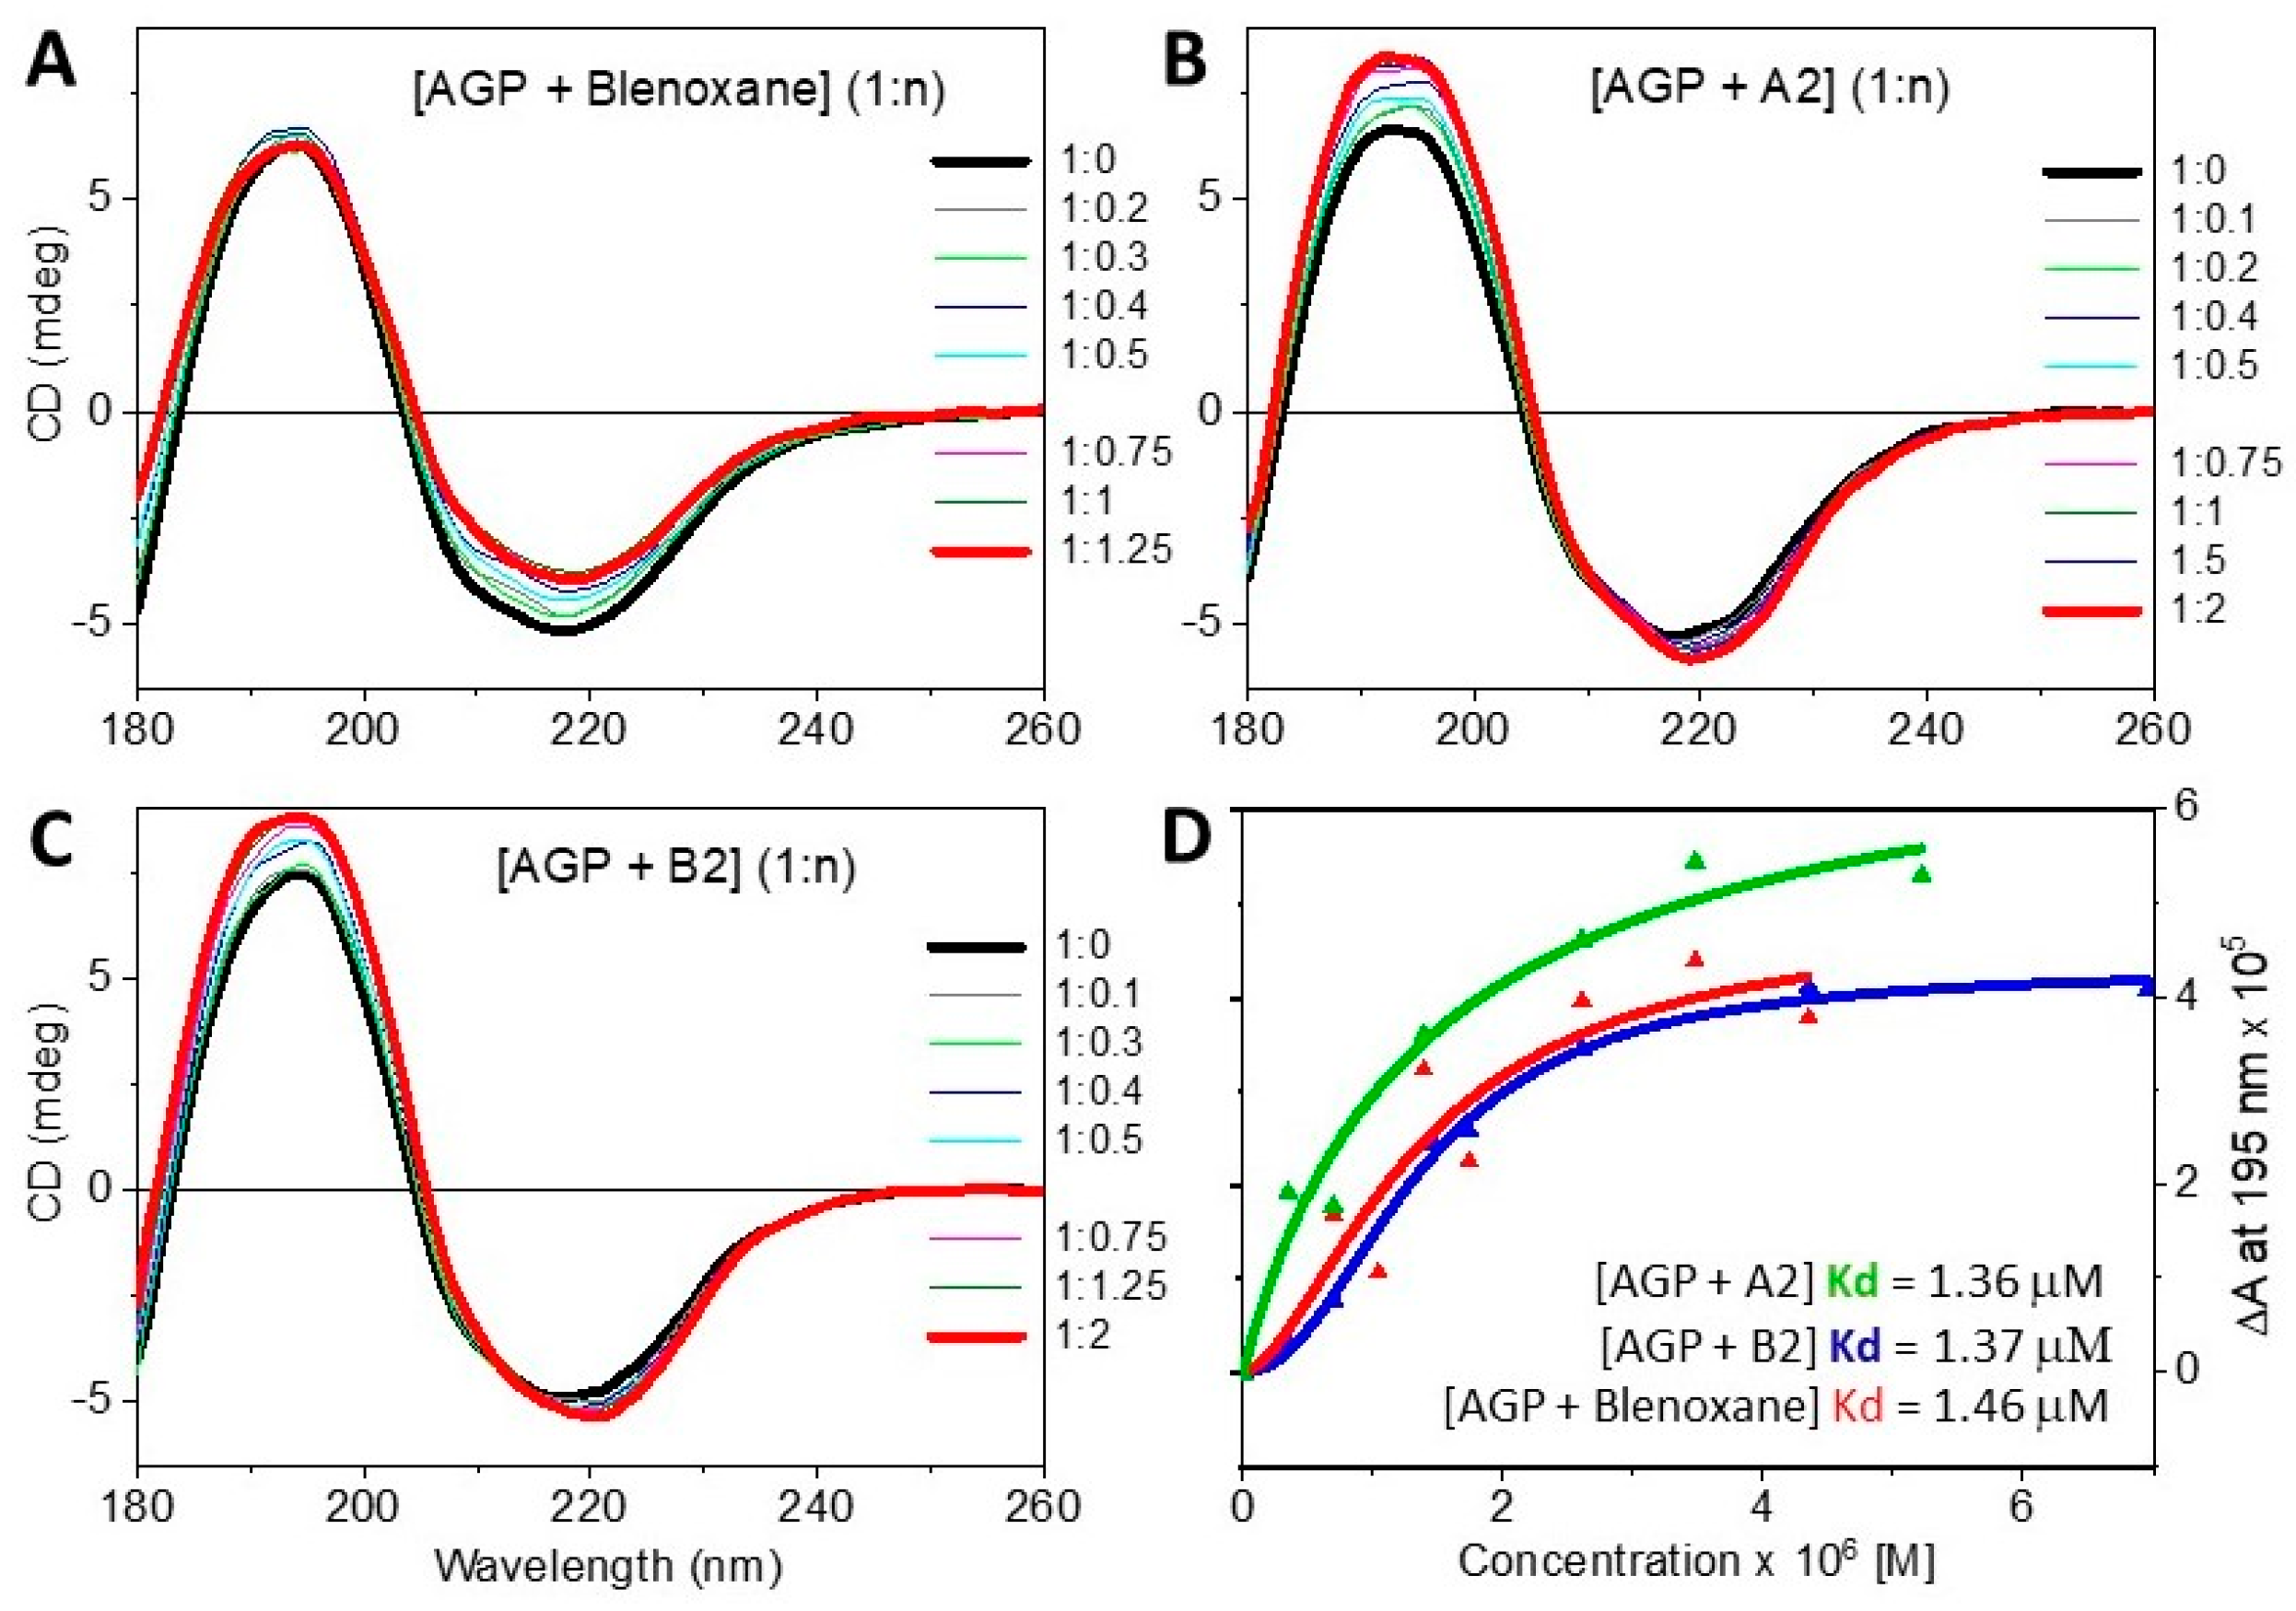
- By assessing qualitatively spectral differences between the observed spectra of the mixtures of proteins with ligands and the calculated spectra from the sum of the spectra of the individual components in the same molar ratio of the mixtures;
- (ii)
- By determining quantitatively the dissociation constant Kd from CD titrations data;
- (iii)
- (iv)
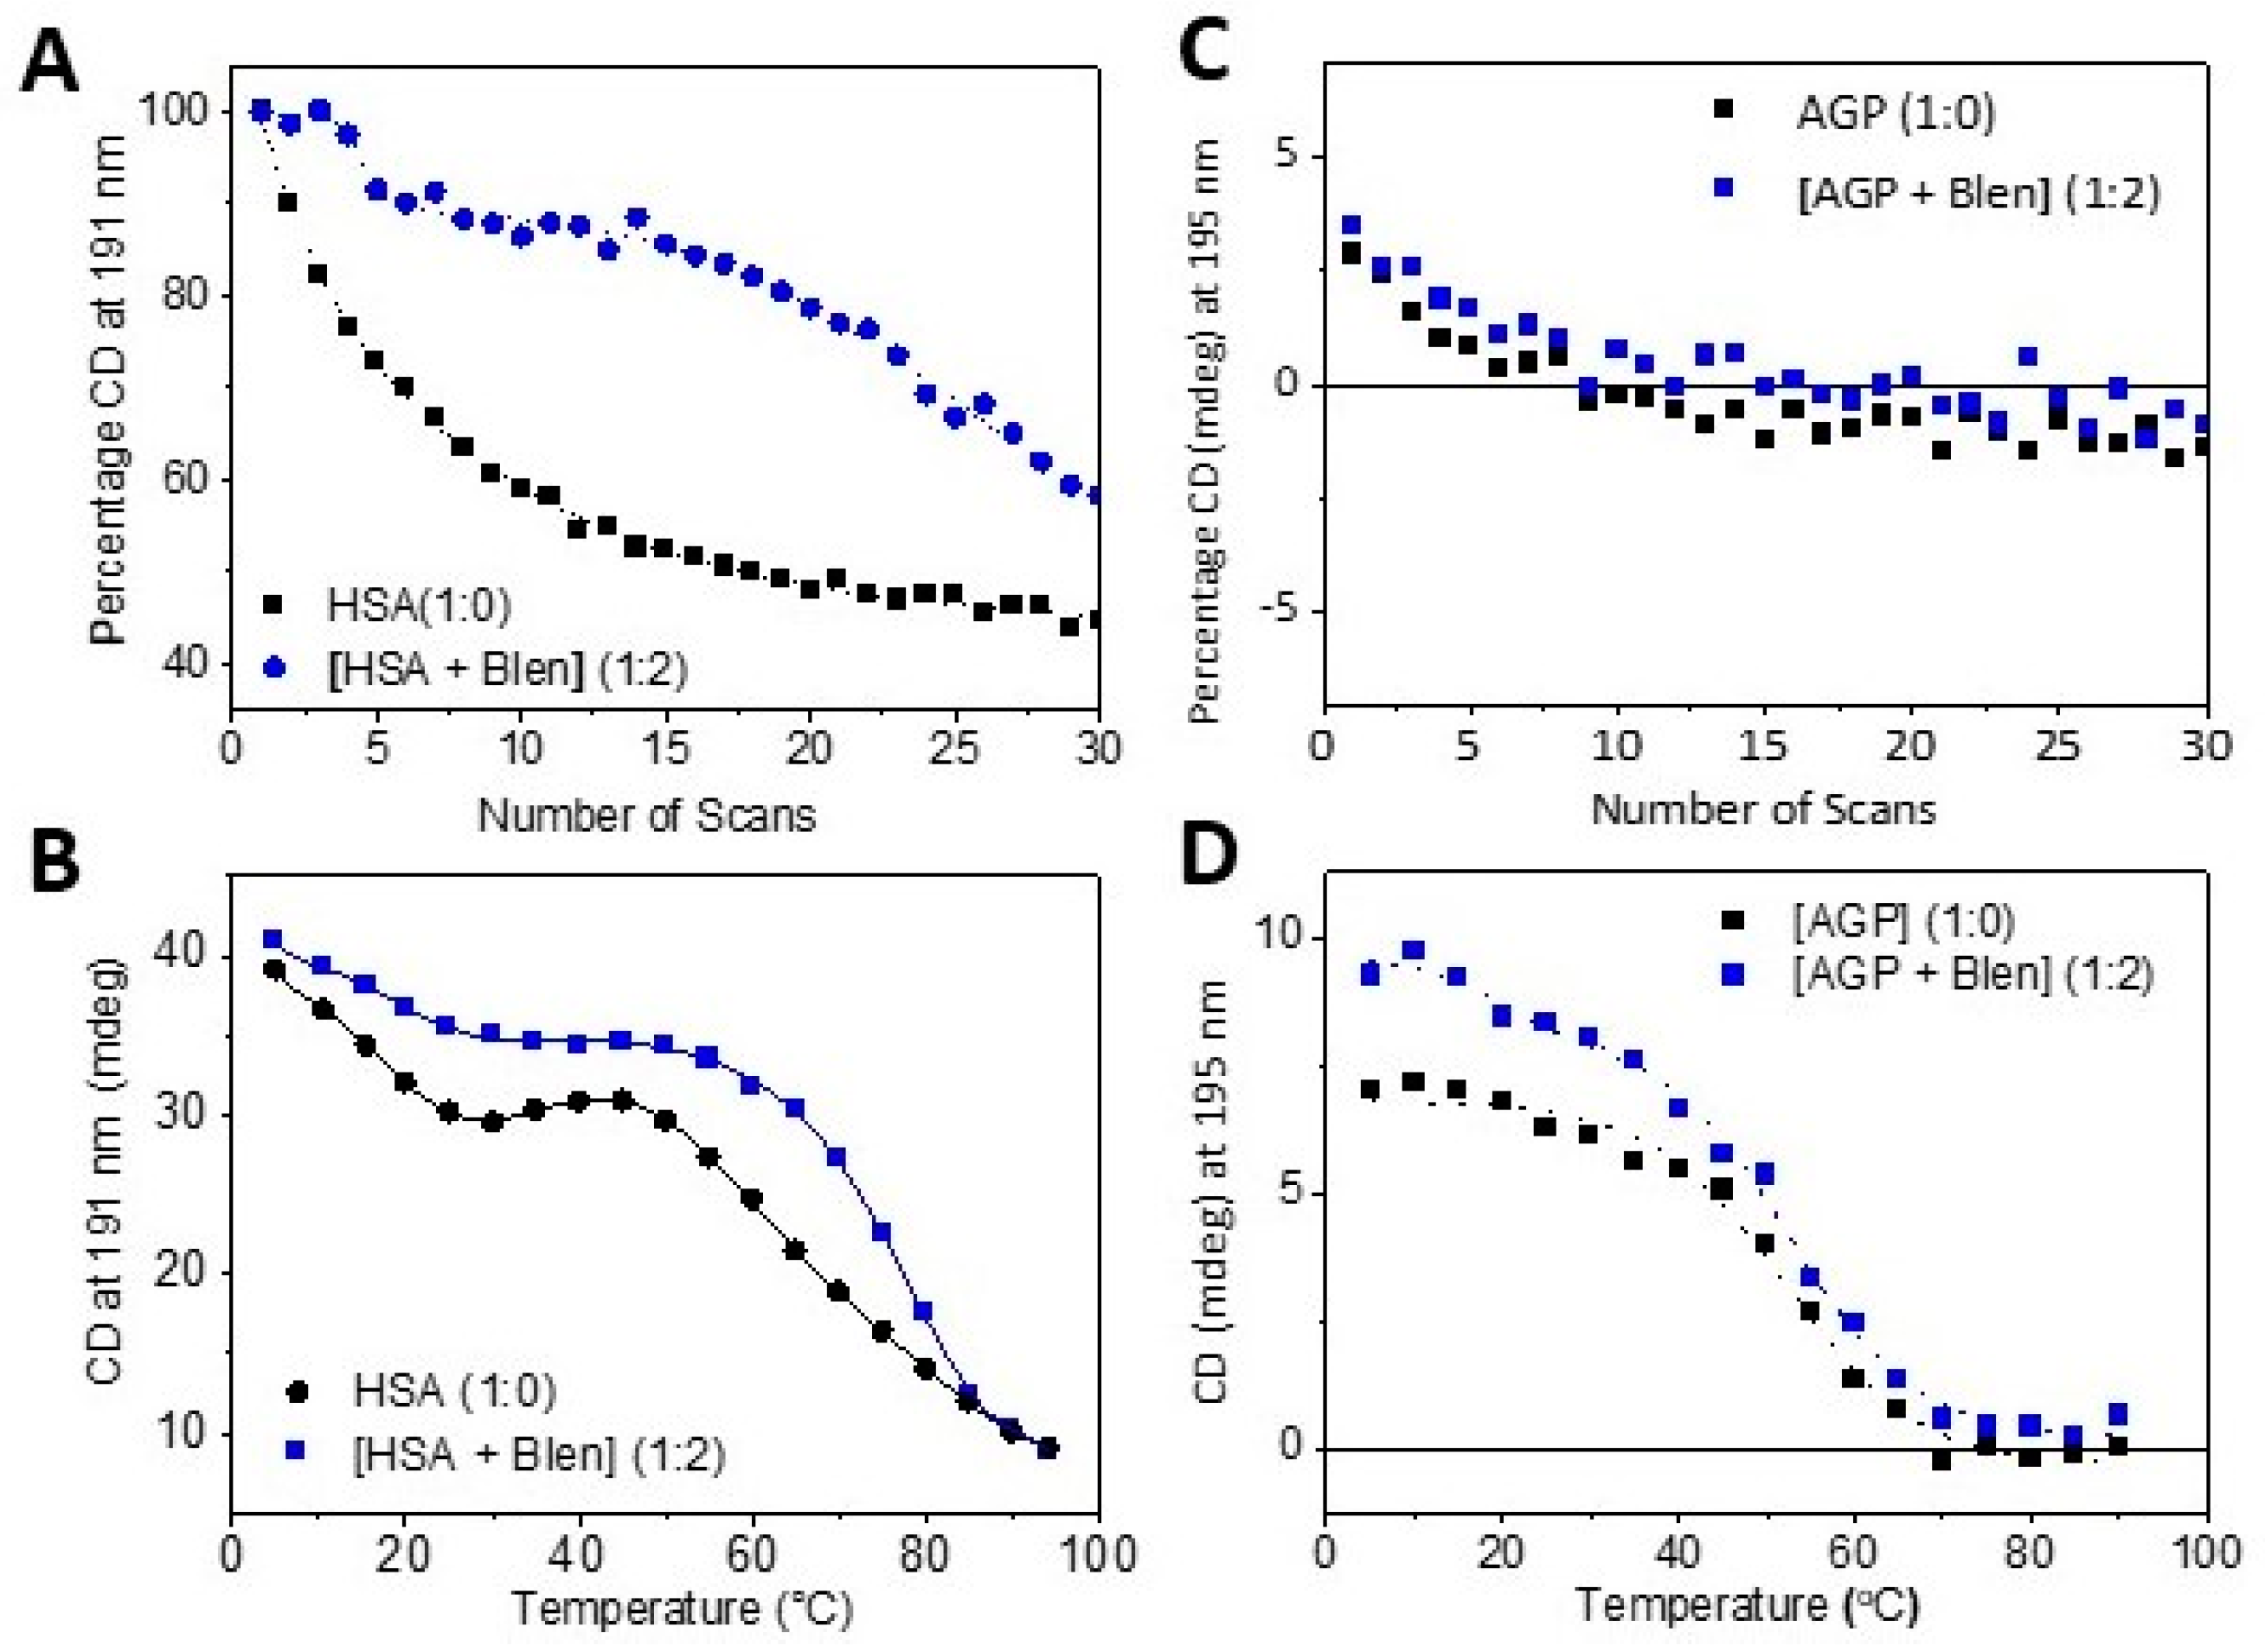
- By using a photo denaturation assay to determine the rate of denaturation as a function of UV irradiation. This was carried out by exploiting the high photo flux of B23 beamline for SRCD via scanning 30 repeated consecutive spectra in the far-UV region (180–260nm) of Blenoxane, and bleomycin A2 and B2 with plasma proteins HSA and AGP, which is unattainable using bespoke benchtop CD instruments [24].
3. Discussion
4. Experimental Details
4.1. Materials and Sample Preparations
4.2. Circular Dichroism Spectroscopy
4.3. Fluorescence Spectroscopy
4.4. Data Analysis
4.5. Determination of Thermodynamic Parameters for Thermal Denaturation Experiments
5. Conclusions
Author Contributions
Funding
Institutional Review Board Statement
Informed Consent Statement
Data Availability Statement
Acknowledgments
Conflicts of Interest
Abbreviations
References
- Galm, U.; Hager, M.H.; Van Lanen, S.G.; Ju, J.; Thorson, J.S.; Shen, B. Antitumor antibiotics: Bleomycin, enediynes, and mitomycin. Chem. Rev. 2005, 105, 739–758. [Google Scholar] [CrossRef] [PubMed]
- Chen, J.; Stubbe, J. Bleomycins: Towards better therapeutics. Nat. Rev. Cancer 2005, 5, 102–112. [Google Scholar] [CrossRef] [PubMed]
- Umezawa, H.; Maeda, K.; Takeuchi, T.; Okami, Y. New antibiotics, bleomycin A2 and B2. J. Antibiot. 1966, 19, 200–209. [Google Scholar]
- Lehmann, T.; Topchiy, E. Contributions of NMR to the understanding of the coordination chemistry and DNA interactions of metallo-bleomycins. Molecules 2013, 18, 9253–9277. [Google Scholar] [CrossRef] [PubMed]
- Hecht, S.M. Bleomycin: New perspectives on the mechanism of action. J Nat Prod 2000, 63, 158–168. [Google Scholar] [CrossRef]
- Du, L.; Shen, B. Identification and characterization of a type II peptidyl carrier protein from the bleomycin producer Streptomyces verticillus ATCC 15003. Chem. Biol. 1999, 6, 507–517. [Google Scholar] [CrossRef]
- Pron, G.; Belehradek, J., Jr.; Mir, L.M. Identification of a plasma membrane protein that specifically binds bleomycin. Biochem. Biophys. Res. Commun. 1993, 194, 333–337. [Google Scholar] [CrossRef]
- Sugiyama, M.; Kumagai, T.; Hayashida, M.; Maruyama, M.; Matoba, Y. The 1.6-A crystal structure of the copper (II)-bound bleomycin complexed with the bleomycin-binding protein from bleomycin-producing Streptomyces verticillus. J. Biol. Chem. 2002, 277, 2311–2320. [Google Scholar] [CrossRef]
- Shen, B.; Du, L.; Sanchez, C.; Edwards, D.J.; Chen, M.; Murrell, J.M. Cloning and characterization of the bleomycin biosynthetic gene cluster from Streptomyces verticillus ATCC15003. J. Nat. Prod. 2002, 65, 422–431. [Google Scholar] [CrossRef]
- Kumagai, T.; Maruyama, M.; Matoba, Y.; Kawano, Y.; Sugiyama, M. Crystallization and preliminary X-ray diffraction studies of bleomycin-binding protein encoded on the transposon Tn5. Acta Crystallogr. Sect. D Biol. Crystallogr. 1999, 55 Pt 5, 1095–1097. [Google Scholar] [CrossRef]
- Kumagai, T.; Muta, K.; Matoba, Y.; Kawano, Y.; Kamiya, N.; Davies, J.; Sugiyama, M. Crystallization and preliminary X-ray diffraction studies of bleomycin-binding protein from bleomycin-producing Streptomyces verticillus. Acta Crystallogr. Sect. D Biol. Crystallogr. 1998, 54 Pt 1, 127–128. [Google Scholar] [CrossRef] [PubMed]
- Sugiyama, M.; Kumagai, T.; Matsuo, H.; Bhuiyan, M.Z.; Ueda, K.; Mochizuki, H.; Nakamura, N.; Davies, J.E. Overproduction of the bleomycin-binding proteins from bleomycin-producing Streptomyces verticillus and a methicillin-resistant Staphylococcus aureus in Escherichia coli and their immunological characterisation. FEBS Lett. 1995, 362, 80–84. [Google Scholar] [CrossRef]
- Gatignol, A.; Durand, H.; Tiraby, G. Bleomycin resistance conferred by a drug-binding protein. FEBS Lett. 1988, 230, 171–175. [Google Scholar] [CrossRef]
- Balis, F.M.; Holcenberg, J.S.; Bleyer, W.A. Clinical pharmacokinetics of commonly used anticancer drugs. Clin. Pharmacokinet. 1983, 8, 202–232. [Google Scholar] [CrossRef] [PubMed]
- Peng, Y.M.; Alberts, D.S.; Chen, H.S.; Mason, N.; Moon, T.E. Antitumour activity and plasma kinetics of bleomycin by continuous and intermittent administration. Br. J. Cancer 1980, 41, 644–647. [Google Scholar] [CrossRef]
- Shiu, G.K.; Goehl, T.J.; Pitlick, W.H. Rapid high-performance liquid chromatographic determination of bleomycin A2 in plasma. J. Pharm. Sci. 1979, 68, 232–234. [Google Scholar] [CrossRef]
- Greenfield, N.J. Using circular dichroism collected as a function of temperature to determine the thermodynamics of protein unfolding and binding interactions. Nat. Protoc. 2006, 1, 2527–2535. [Google Scholar] [CrossRef]
- Greenfield, N.J. Determination of the folding of proteins as a function of denaturants, osmolytes or ligands using circular dichroism. Nat. Protoc. 2006, 1, 2733–2741. [Google Scholar] [CrossRef]
- Greenfield, N.J. Using circular dichroism spectra to estimate protein secondary structure. Nat. Protoc. 2006, 1, 2876–2890. [Google Scholar] [CrossRef]
- Greenfield, N.J. Analysis of the kinetics of folding of proteins and peptides using circular dichroism. Nat. Protoc. 2006, 1, 2891–2899. [Google Scholar] [CrossRef] [PubMed]
- Sreerama, N.; Woody, R.W. Estimation of protein secondary structure from circular dichroism spectra: Comparison of CONTIN, SELCON, and CDSSTR methods with an expanded reference set. Anal. Biochem. 2000, 287, 252–260. [Google Scholar] [CrossRef] [PubMed]
- Micsonai, A.; Wien, F.; Kernya, L.; Lee, Y.-H.; Goto, Y.; Réfrégiers, M.; Kardos, J. Accurate secondary structure prediction and fold recognition for circular dichroism spectroscopy. Proc. Natl. Acad. Sci. USA 2015, 112, E3095–E3103. [Google Scholar] [CrossRef]
- Siligardi, G.; Hussain, R. Applications of Circular Dichroism. In Encyclopedia of Spectroscopy and Spectrometry, 2nd ed.; Lindon, J., Tranter, G., Koppenaal, D., Eds.; Elsevier: Oxford, UK, 2010; Volume 1, pp. 9–14. [Google Scholar]
- Hussain, R.; Longo, E.; Siligardi, G. UV-Denaturation Assay to Assess Protein Photostability and Ligand-Binding Interactions Using the High Photon Flux of Diamond B23 Beamline for SRCD. Molecules 2018, 3, 1906. [Google Scholar] [CrossRef]
- Pitekova, B.; Uhlikova, E.; Kupcova, V.; Durfinova, M.; Mojto, V.; Turecky, L. Can alpha-1-acid glycoprotein affect the outcome of treatment in a cancer patient? Bratisl. Med. J. 2019, 120, 9–14. [Google Scholar] [CrossRef]
- Qiong, L.; Yin, J. Characterization of alpha-1-acid glycoprotein as a potential biomarker for breast cancer. Bioengineered 2022, 13, 5818–5826. [Google Scholar] [CrossRef] [PubMed]
- Hussain, R.; Benning, K.; Myatt, D.; Javorfi, T.; Longo, E.; Rudd, T.R.; Pulford, B.; Siligardi, G. CDApps: Integrated software for experimental planning and data processing at beamline B23, Diamond Light Source. J Synchrotron Radiat. 2015, 22, 862. [Google Scholar] [CrossRef]
- Siligardi, G.; Hussain, R. Biomolecules Interactions and Competitions by Non-Immobilised Ligand Interaction Assay by Circular Dichroism. Enantiomer 1998, 1, 77–87. [Google Scholar]
- Siligardi, G.; Hussain, R. CD Spectroscopy: An Essential Tool for Quality Control of Protein Folding. In Structural Proteomics: High-Throughput Methods, Methods in Molecular Biology; Owens, R.J., Ed.; Springer Science+Business Media: New York, NY, USA, 2015; Chapter 14; pp. 255–276. [Google Scholar]
- Dorr, R.T.; Meyers, R.; Snead, K.; Liddil, J.D. Analytical and biological inequivalence of two commercial formulations of the antitumor agent bleomycin. Cancer Chemother Pharmacol. 1998, 42, 149–154. [Google Scholar] [CrossRef]
- Siligardi, G.; Panaretou, B.; Meyer, P.; Singh, S.; Woolfson, D.N.; Piper, P.W.; Pearl, L.H.; Prodromou, C. Regulation of Hsp90 ATPase Activity by the Co-chaperone Cdc37p/p50cdc37. J. Biol. Chem. 2002, 277, 20151–20159. [Google Scholar] [CrossRef] [PubMed]


| Tm (°C) [A] | Std. Dev. | Tm (°C) [B] | Std. Dev. | ΔHm, Tm (kJ.mol−1) | Std. Dev. | ΔSm, Tm (J·K−1·mol−1) | Std. Dev. | |
|---|---|---|---|---|---|---|---|---|
| HSA | 74.1 | 1.8 | 67.3 | 3.6 | 85.8 | 5.8 | 252.3 | 9.9 |
| [HSA + A2] (1:2) | 71.3 | 0.8 | 69.1 | 2.1 | 95.8 | 3.5 | 279.9 | 5.9 |
| [HSA + B2] (1:2) | 65.0 | 0.9 | 62.2 | 4.3 | 91.0 | 7.7 | 271.6 | 13.4 |
| [HSA + Blenoxane] | 71.6 | 1.0 | 67.3 | 3.6 | 87.8 | 5.8 | 258.0 | 9.9 |
| AGP | 52.3 | 0.9 | 52.9 | 2.1 | 127.8 | 6.2 | 392.1 | 11.3 |
| [AGP + A2] (1:2) | 59.4 | 0.6 | 59.5 | 7.4 | 239.6 | 35.3 | 720.6 | 62.8 |
| [AGP + B2] (1:2) | 52.3 | 0.8 | 51.7 | 9.4 | 122.3 | 27.3 | 376.5 | 49.0 |
| [AGP + Blenoxane] | 50.6 | 0.9 | 49.5 | 4.4 | 91.7 | 10.1 | 284.4 | 18.5 |
| T1/2 (s) | Std. Dev. | |
|---|---|---|
| HSA | 1188 | 64 |
| [HSA + A2] | 1008 | 52 |
| [HSA + B2] | 1312 | 78 |
| [HSA + Blenoxane] (1:2) | 1143 | 44 |
| AGP | 720 | 83 |
| [AGP + A2] (1:2) | 1026 | 89 |
| [AGP + B2] (1:2) | 803 | 86 |
| [AGP + Blenoxane] (1:2) | 883 | 163 |
| Kd by CD | Kd by Fluorescence | ||
|---|---|---|---|
| far-UV (180–260) | near-UV (260–340) | Excitation at 287 nm | |
| [AGP + Blenoxane] | 1.36 (R2 = 0.802) | -- | -- |
| [AGP + A2] | 1.47 (R2 = 0.951) | -- | 13.23 (R2 0.984) |
| [AGP + B2] | 1.37 (R2 = 0.995) | -- | 13.68 (R2 0.975) |
| [HSA + Blenoxane] | 66.84 (R2 0.929) | ||
Disclaimer/Publisher’s Note: The statements, opinions and data contained in all publications are solely those of the individual author(s) and contributor(s) and not of MDPI and/or the editor(s). MDPI and/or the editor(s) disclaim responsibility for any injury to people or property resulting from any ideas, methods, instructions or products referred to in the content. |
© 2023 by the authors. Licensee MDPI, Basel, Switzerland. This article is an open access article distributed under the terms and conditions of the Creative Commons Attribution (CC BY) license (https://creativecommons.org/licenses/by/4.0/).
Share and Cite
Longo, E.; Siligardi, G.; Hussain, R. Interaction of Blenoxane and Congeners Bleomycins A2 and B2 with Human Plasma Proteins Using Circular Dichroism Spectroscopy. Int. J. Mol. Sci. 2023, 24, 13598. https://doi.org/10.3390/ijms241713598
Longo E, Siligardi G, Hussain R. Interaction of Blenoxane and Congeners Bleomycins A2 and B2 with Human Plasma Proteins Using Circular Dichroism Spectroscopy. International Journal of Molecular Sciences. 2023; 24(17):13598. https://doi.org/10.3390/ijms241713598
Chicago/Turabian StyleLongo, Edoardo, Giuliano Siligardi, and Rohanah Hussain. 2023. "Interaction of Blenoxane and Congeners Bleomycins A2 and B2 with Human Plasma Proteins Using Circular Dichroism Spectroscopy" International Journal of Molecular Sciences 24, no. 17: 13598. https://doi.org/10.3390/ijms241713598
APA StyleLongo, E., Siligardi, G., & Hussain, R. (2023). Interaction of Blenoxane and Congeners Bleomycins A2 and B2 with Human Plasma Proteins Using Circular Dichroism Spectroscopy. International Journal of Molecular Sciences, 24(17), 13598. https://doi.org/10.3390/ijms241713598