
Dynamic Changes in miRNA Expression during the Generation of Expanded and Activated NK Cells
 , , ,
, , ,  and
and 
Abstract
:
1. Introduction
2. Results
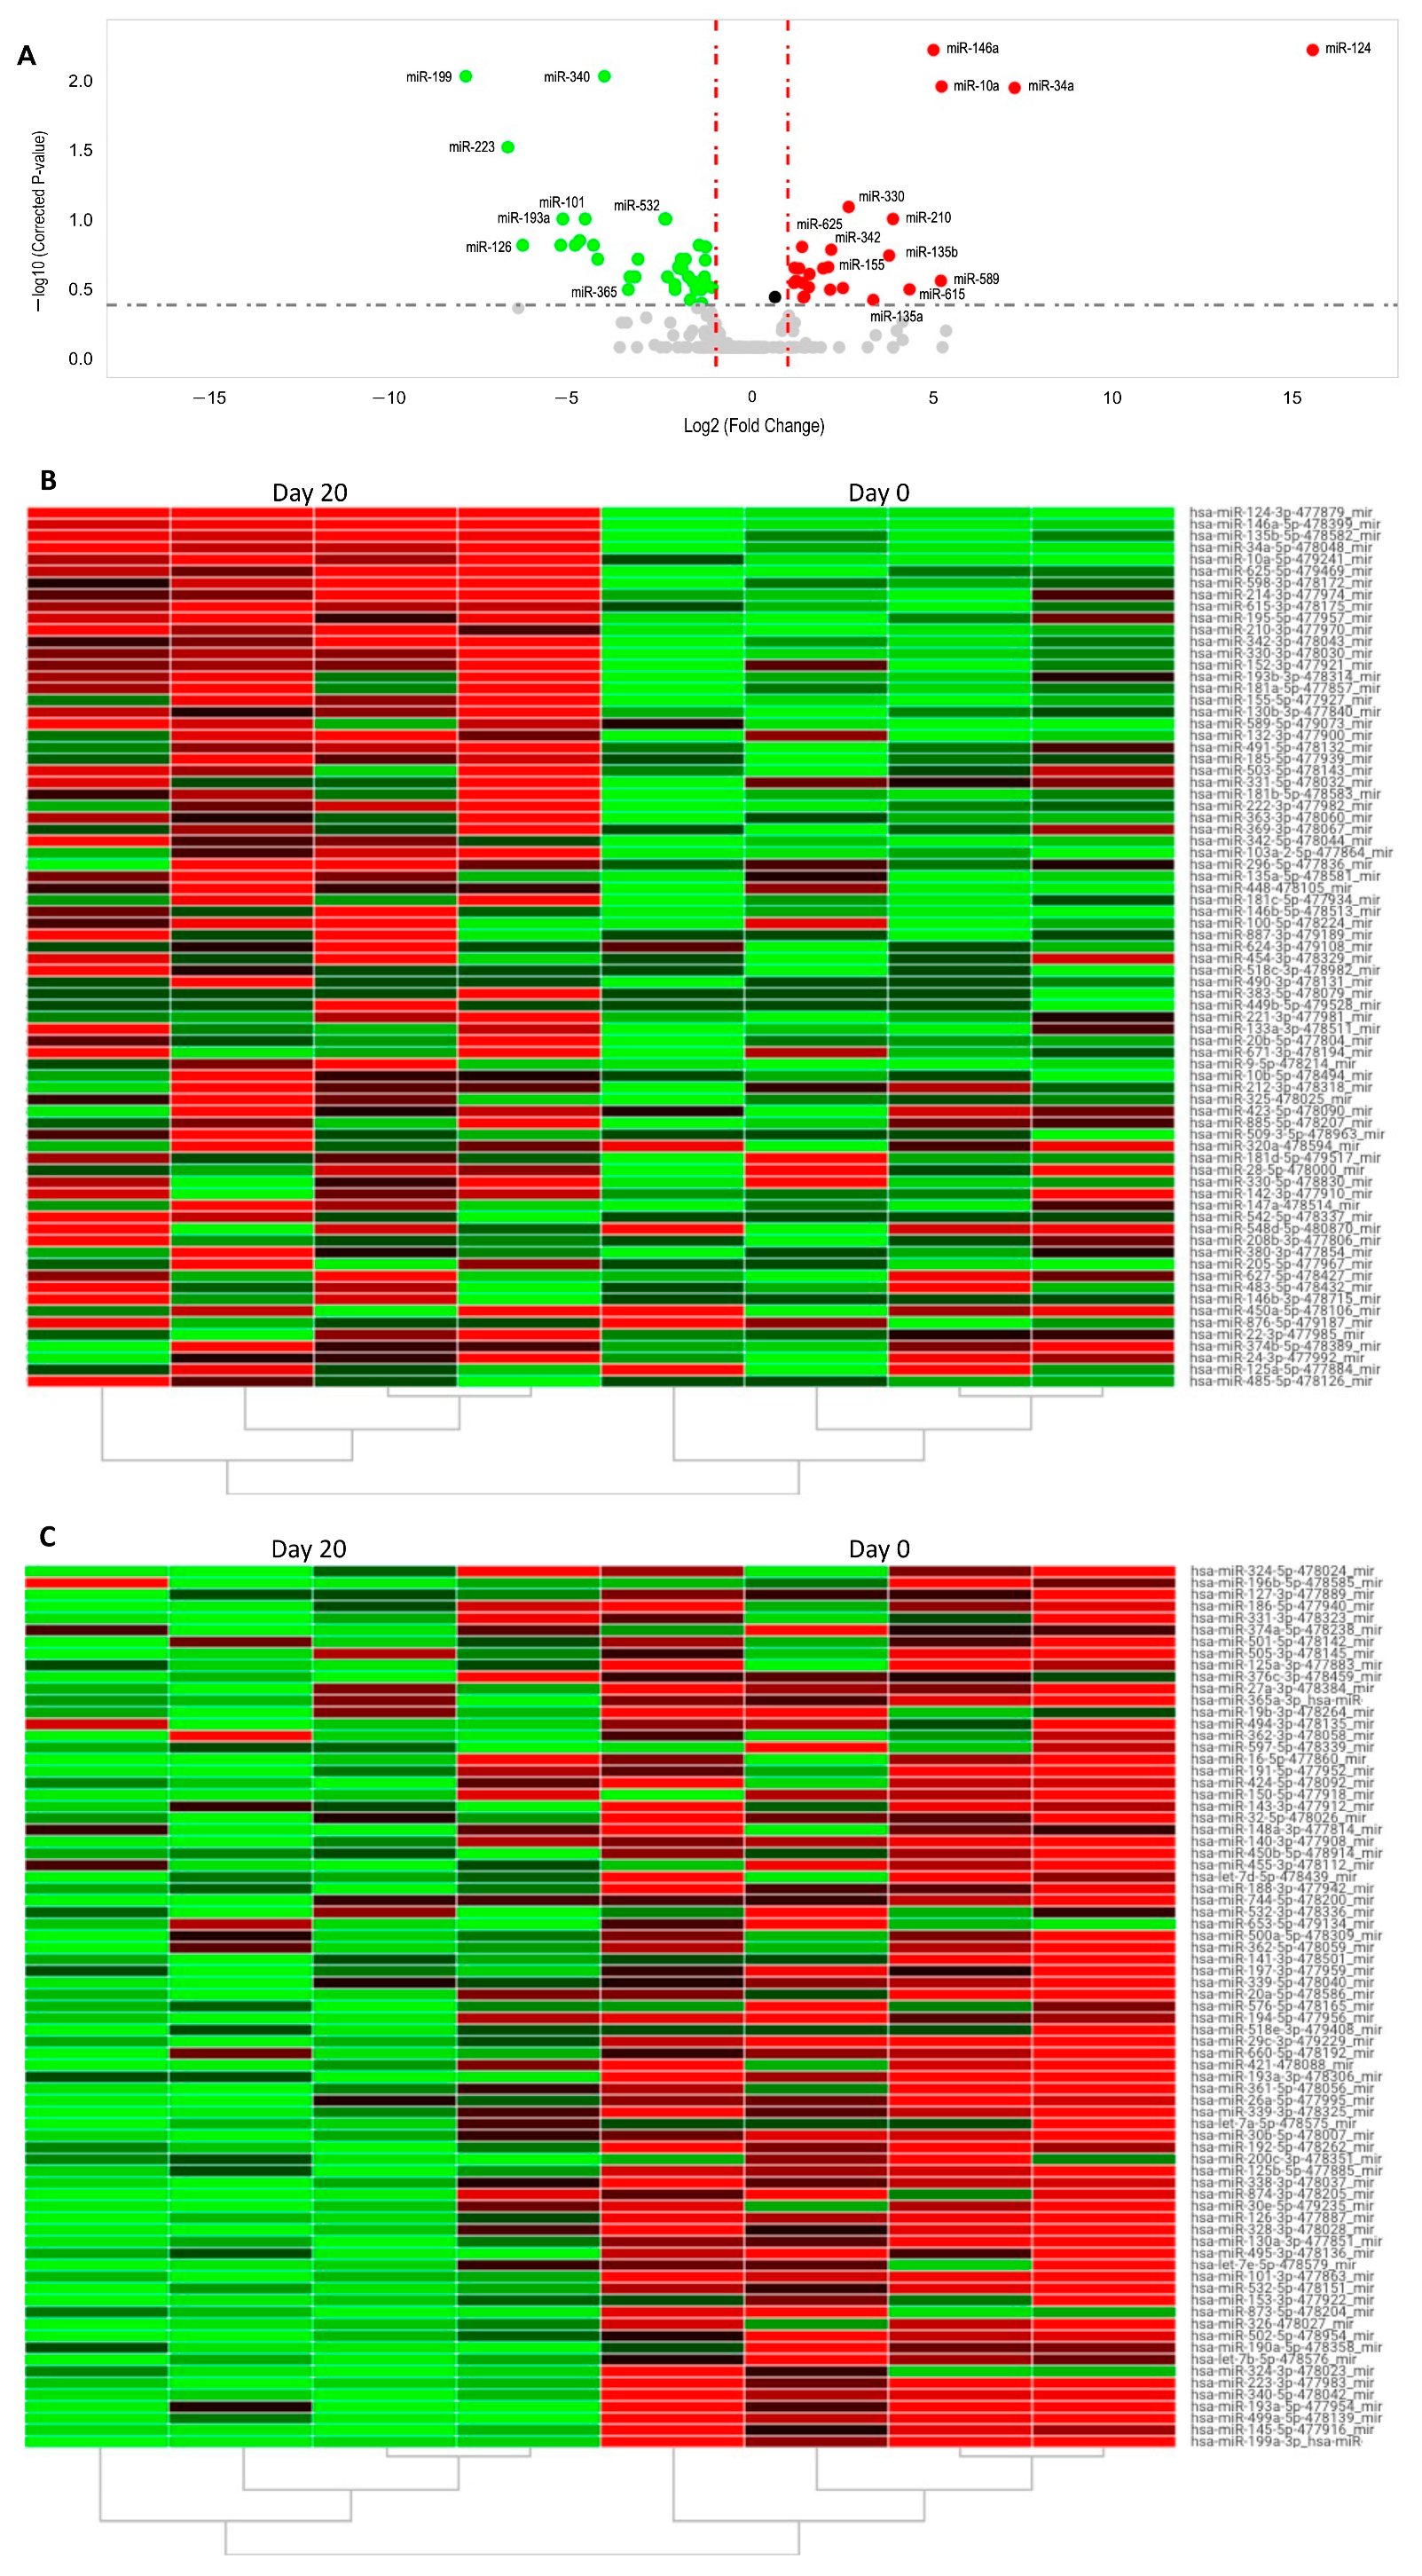
2.1. Expression of miRNAs in Healthy Donor NKs at Day 0 and Day 20 of Expansion
2.2. Down-Regulated Differentially Expressed miRNAs
2.3. Up-Regulated Differentially Expressed miRNAs
3. Discussion
4. Materials and Methods
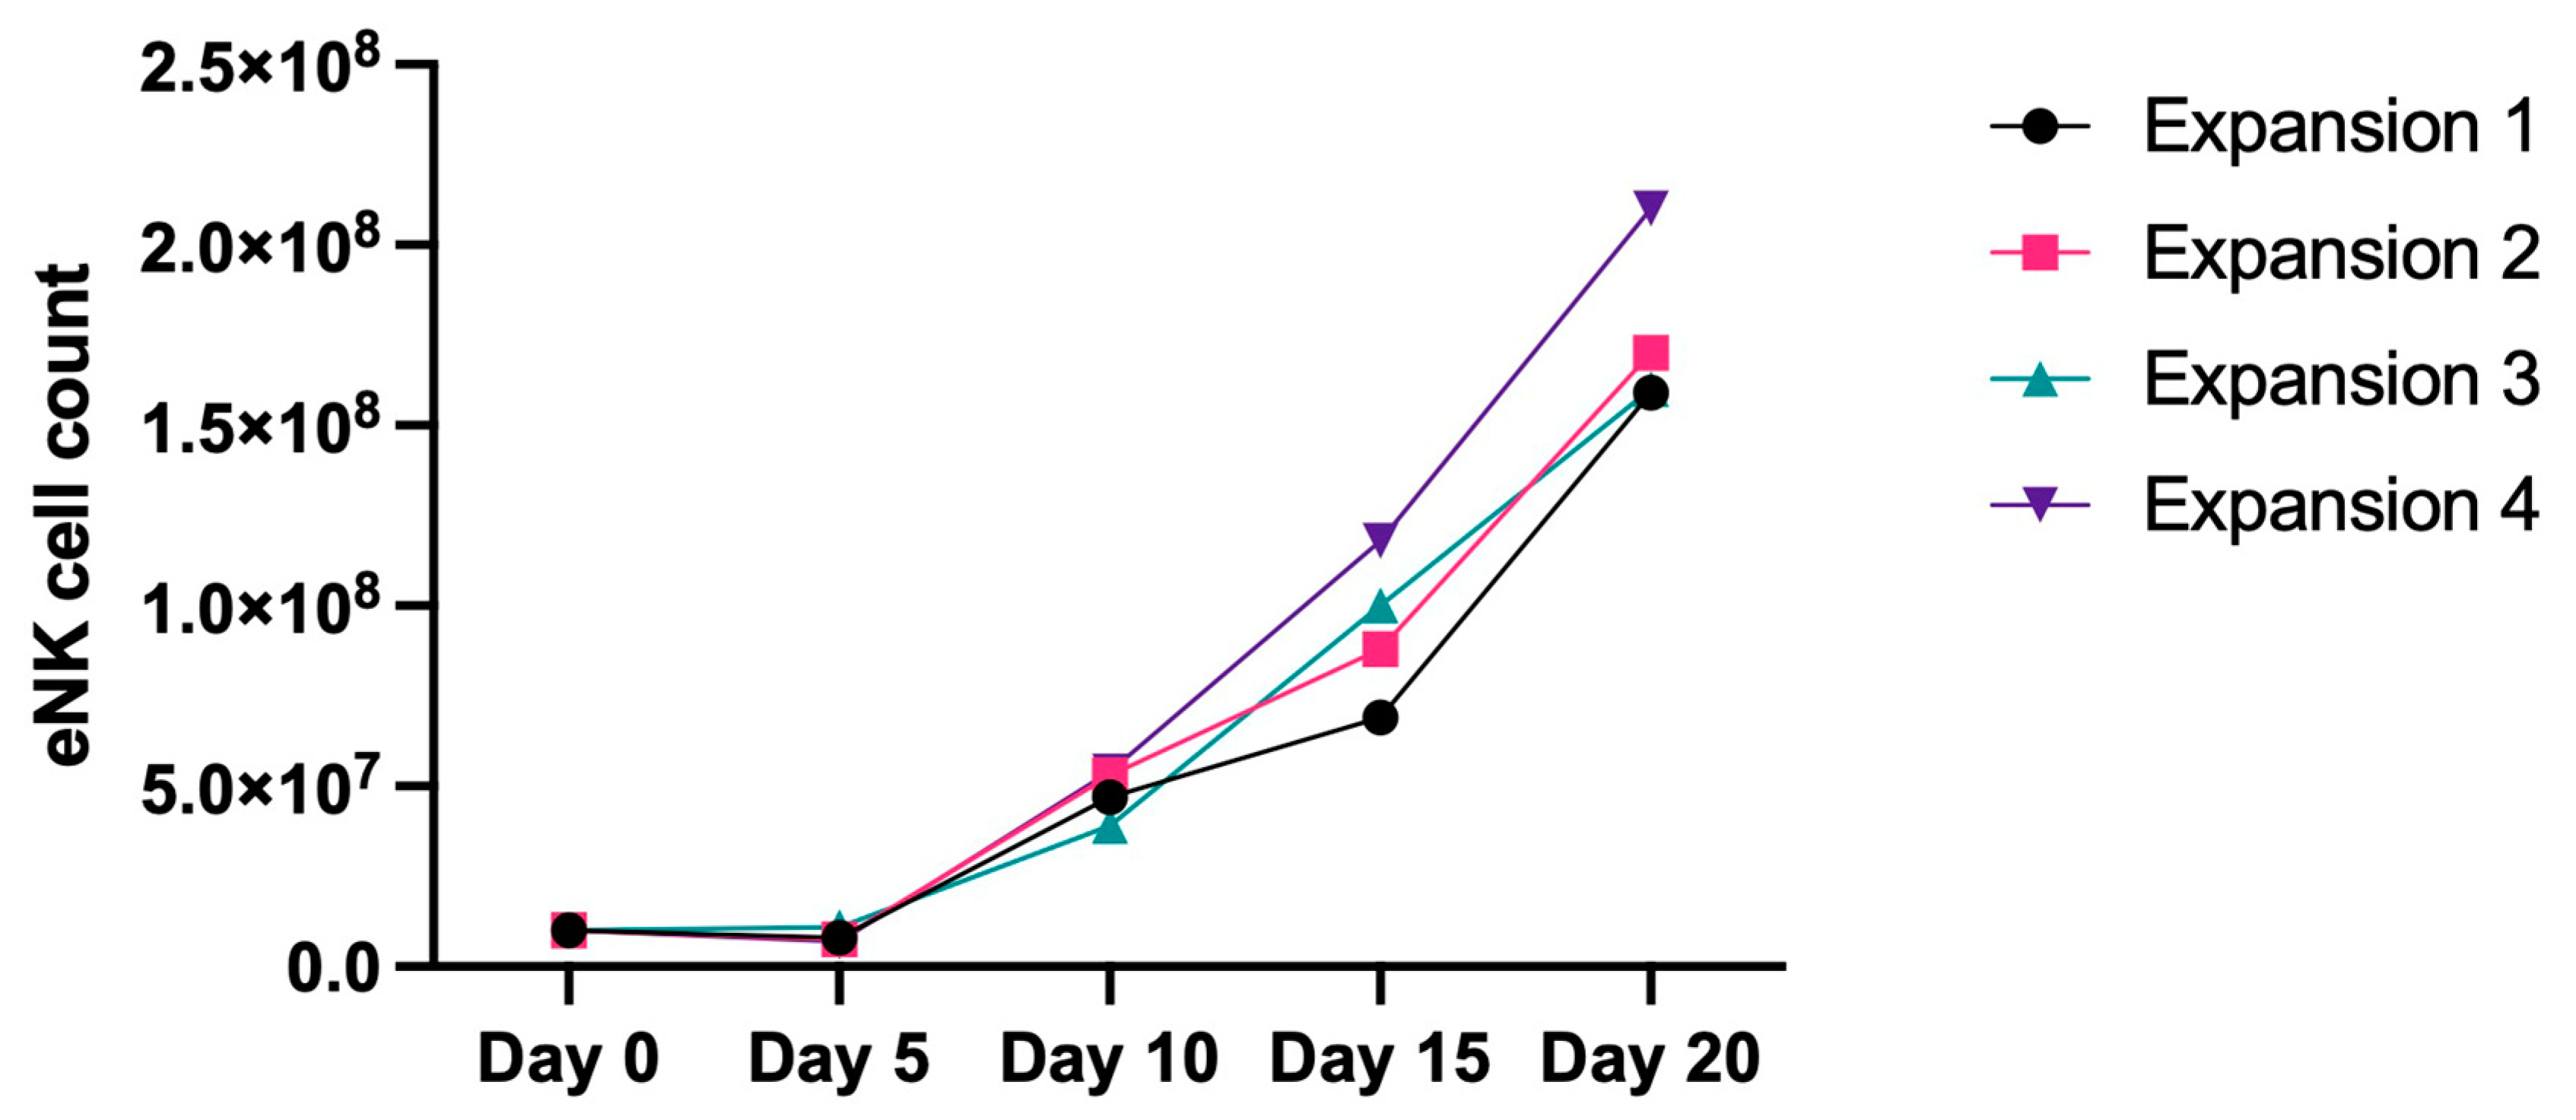
4.1. NK Cell Activation and Expansion Protocol
4.2. Total RNA Extraction
4.3. RT-qPCR and miRNA Quantitative Analysis
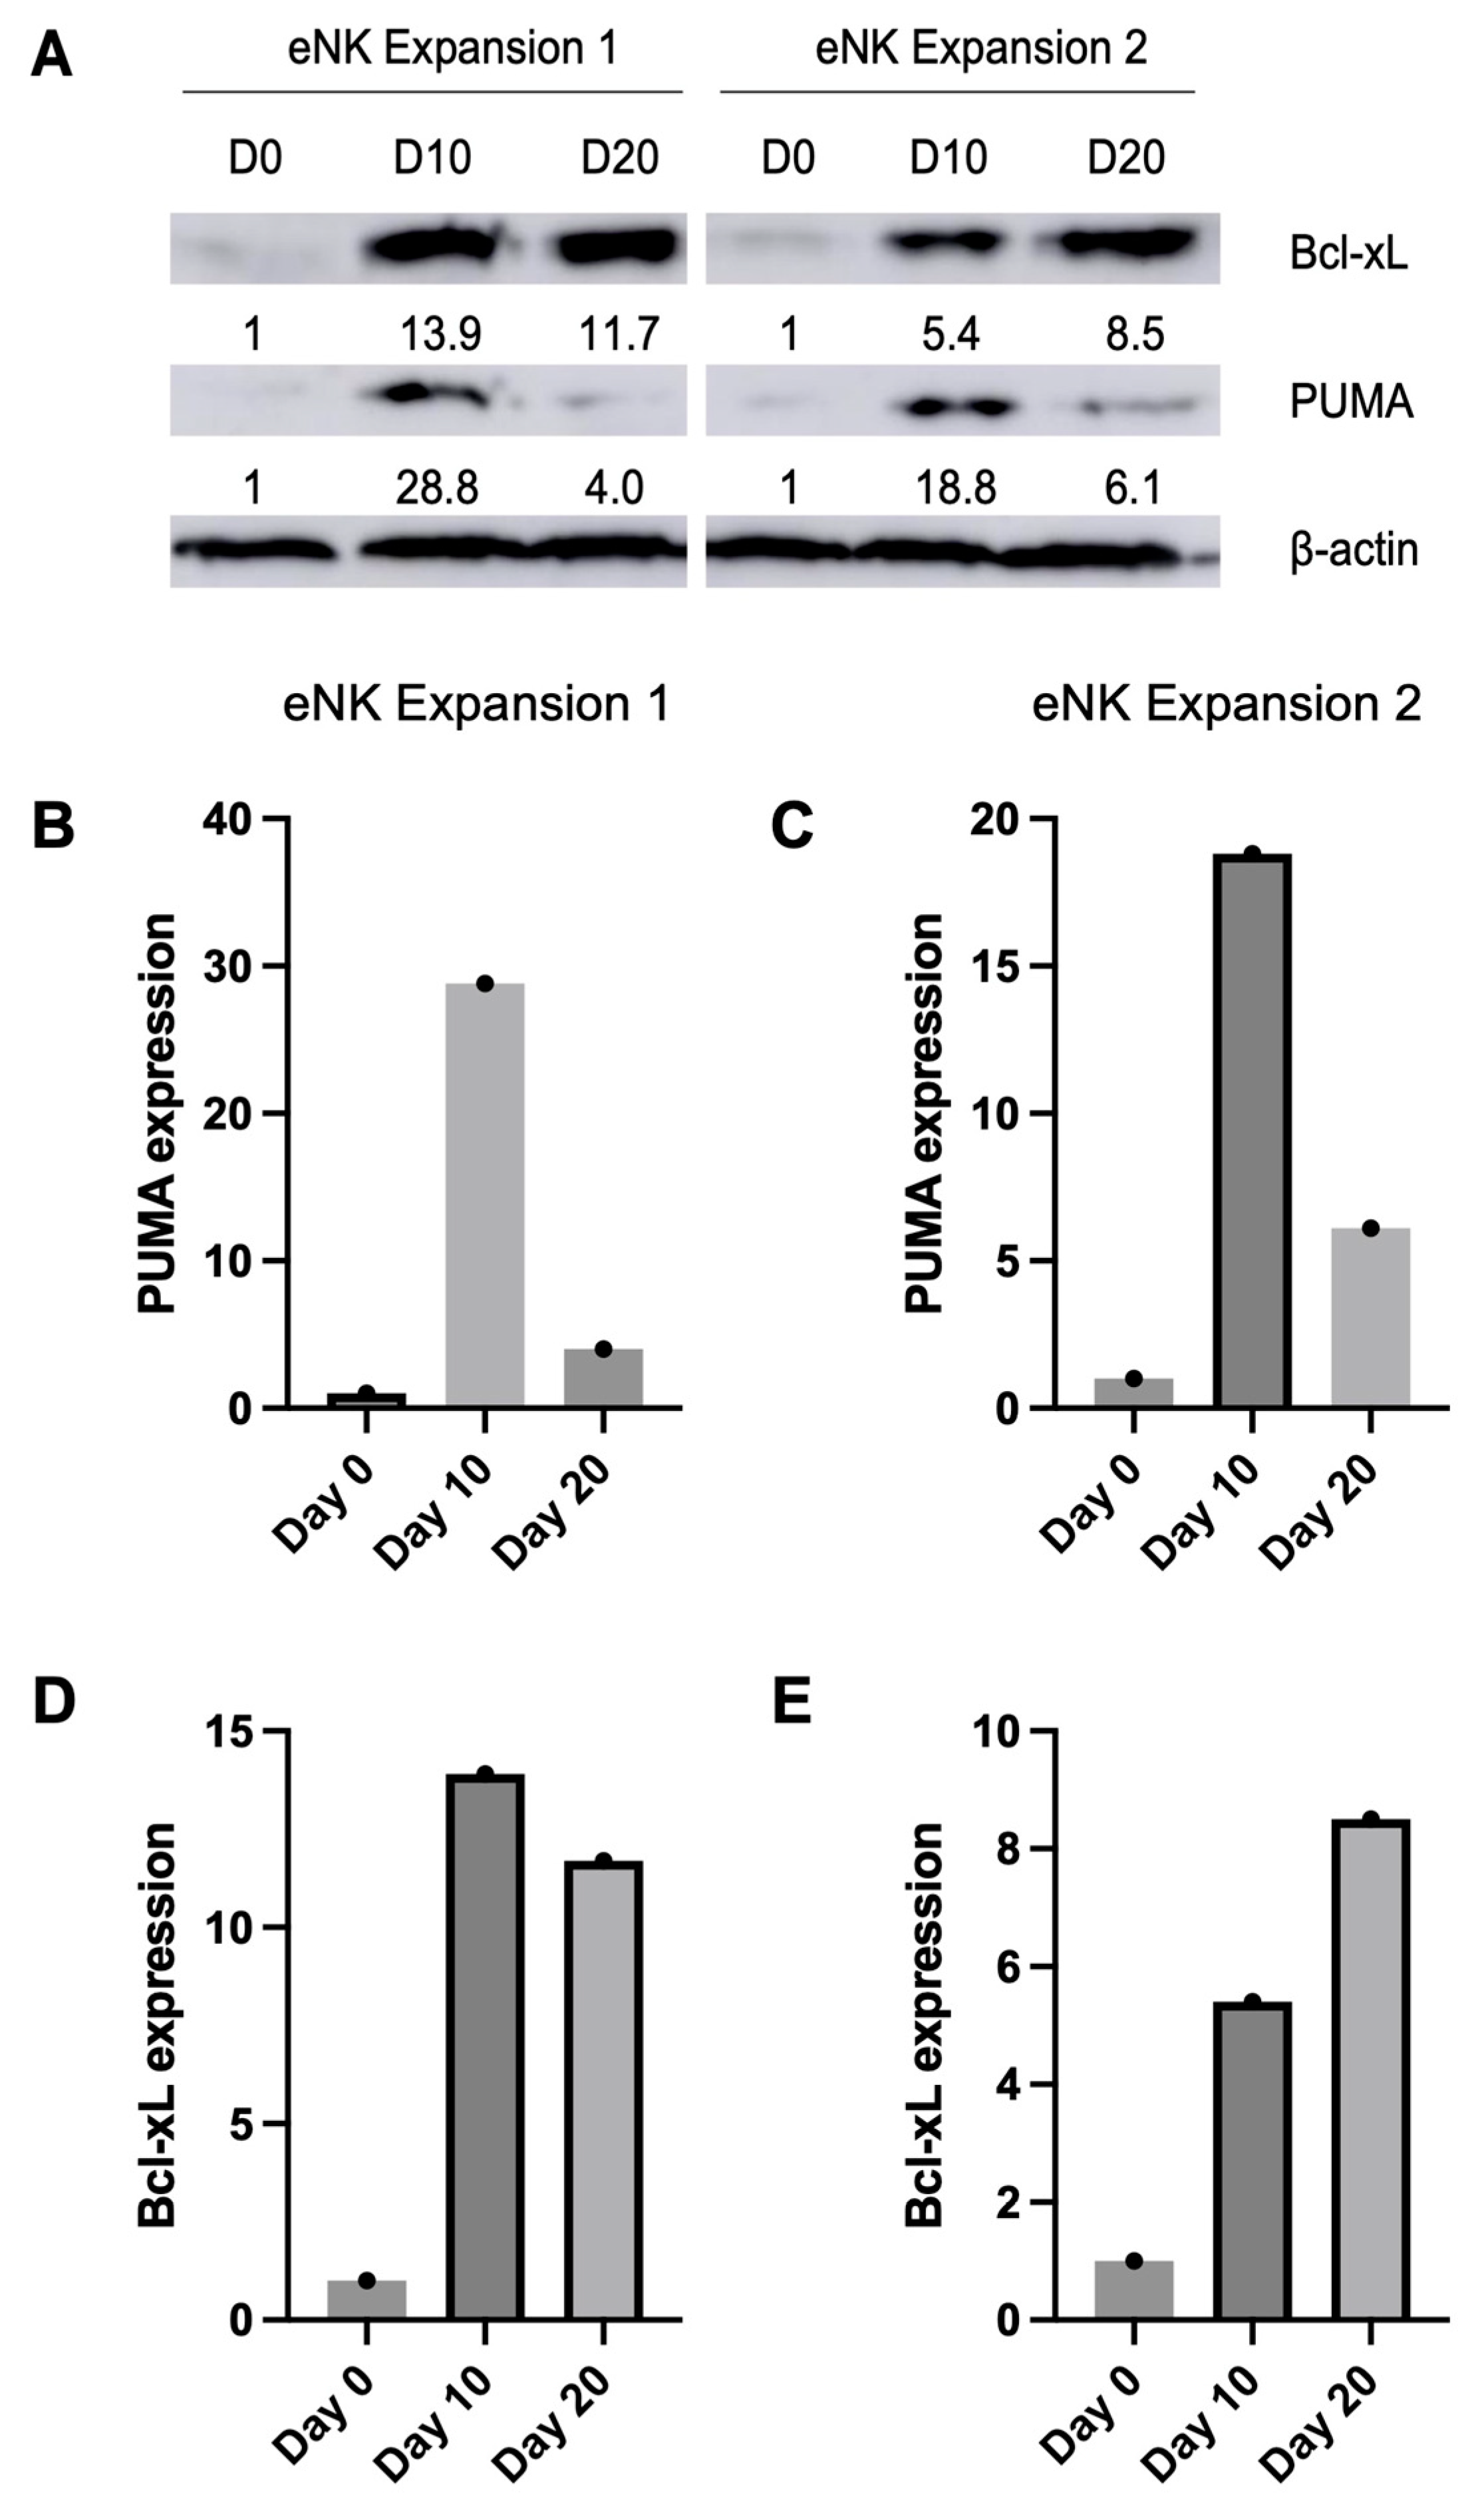
4.4. Immunoblot
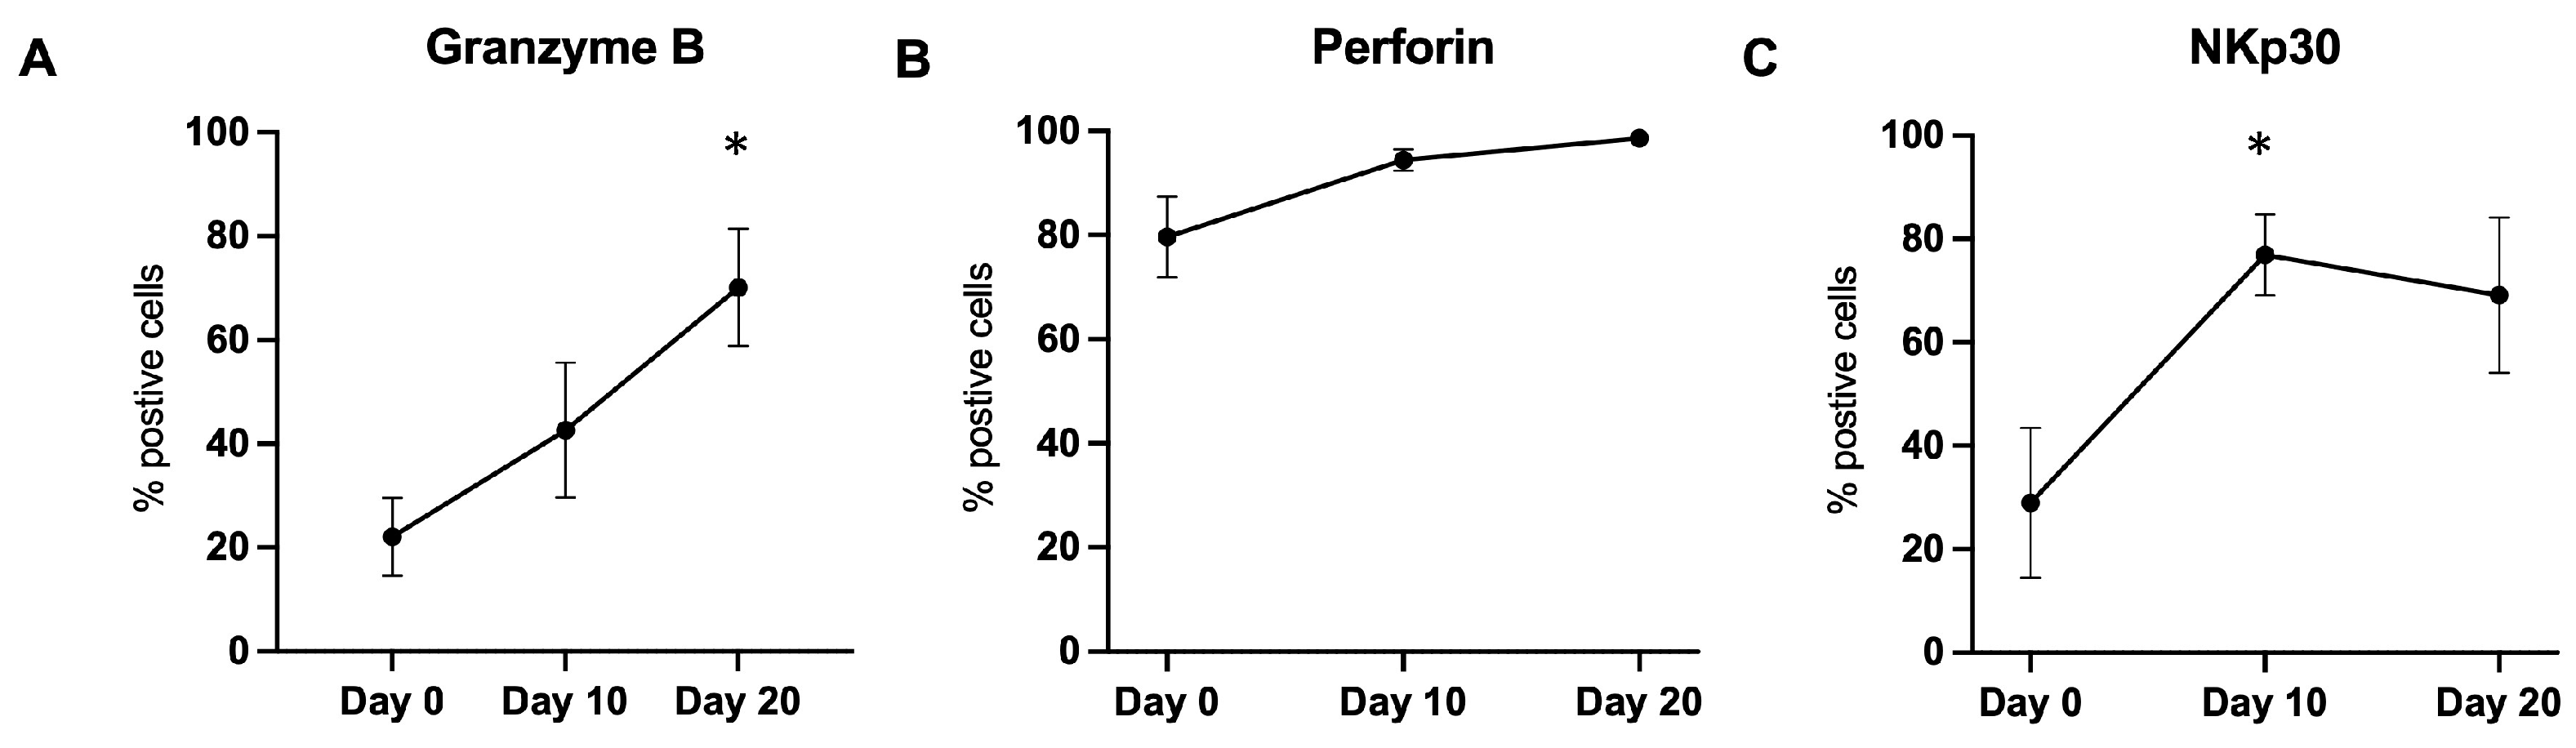
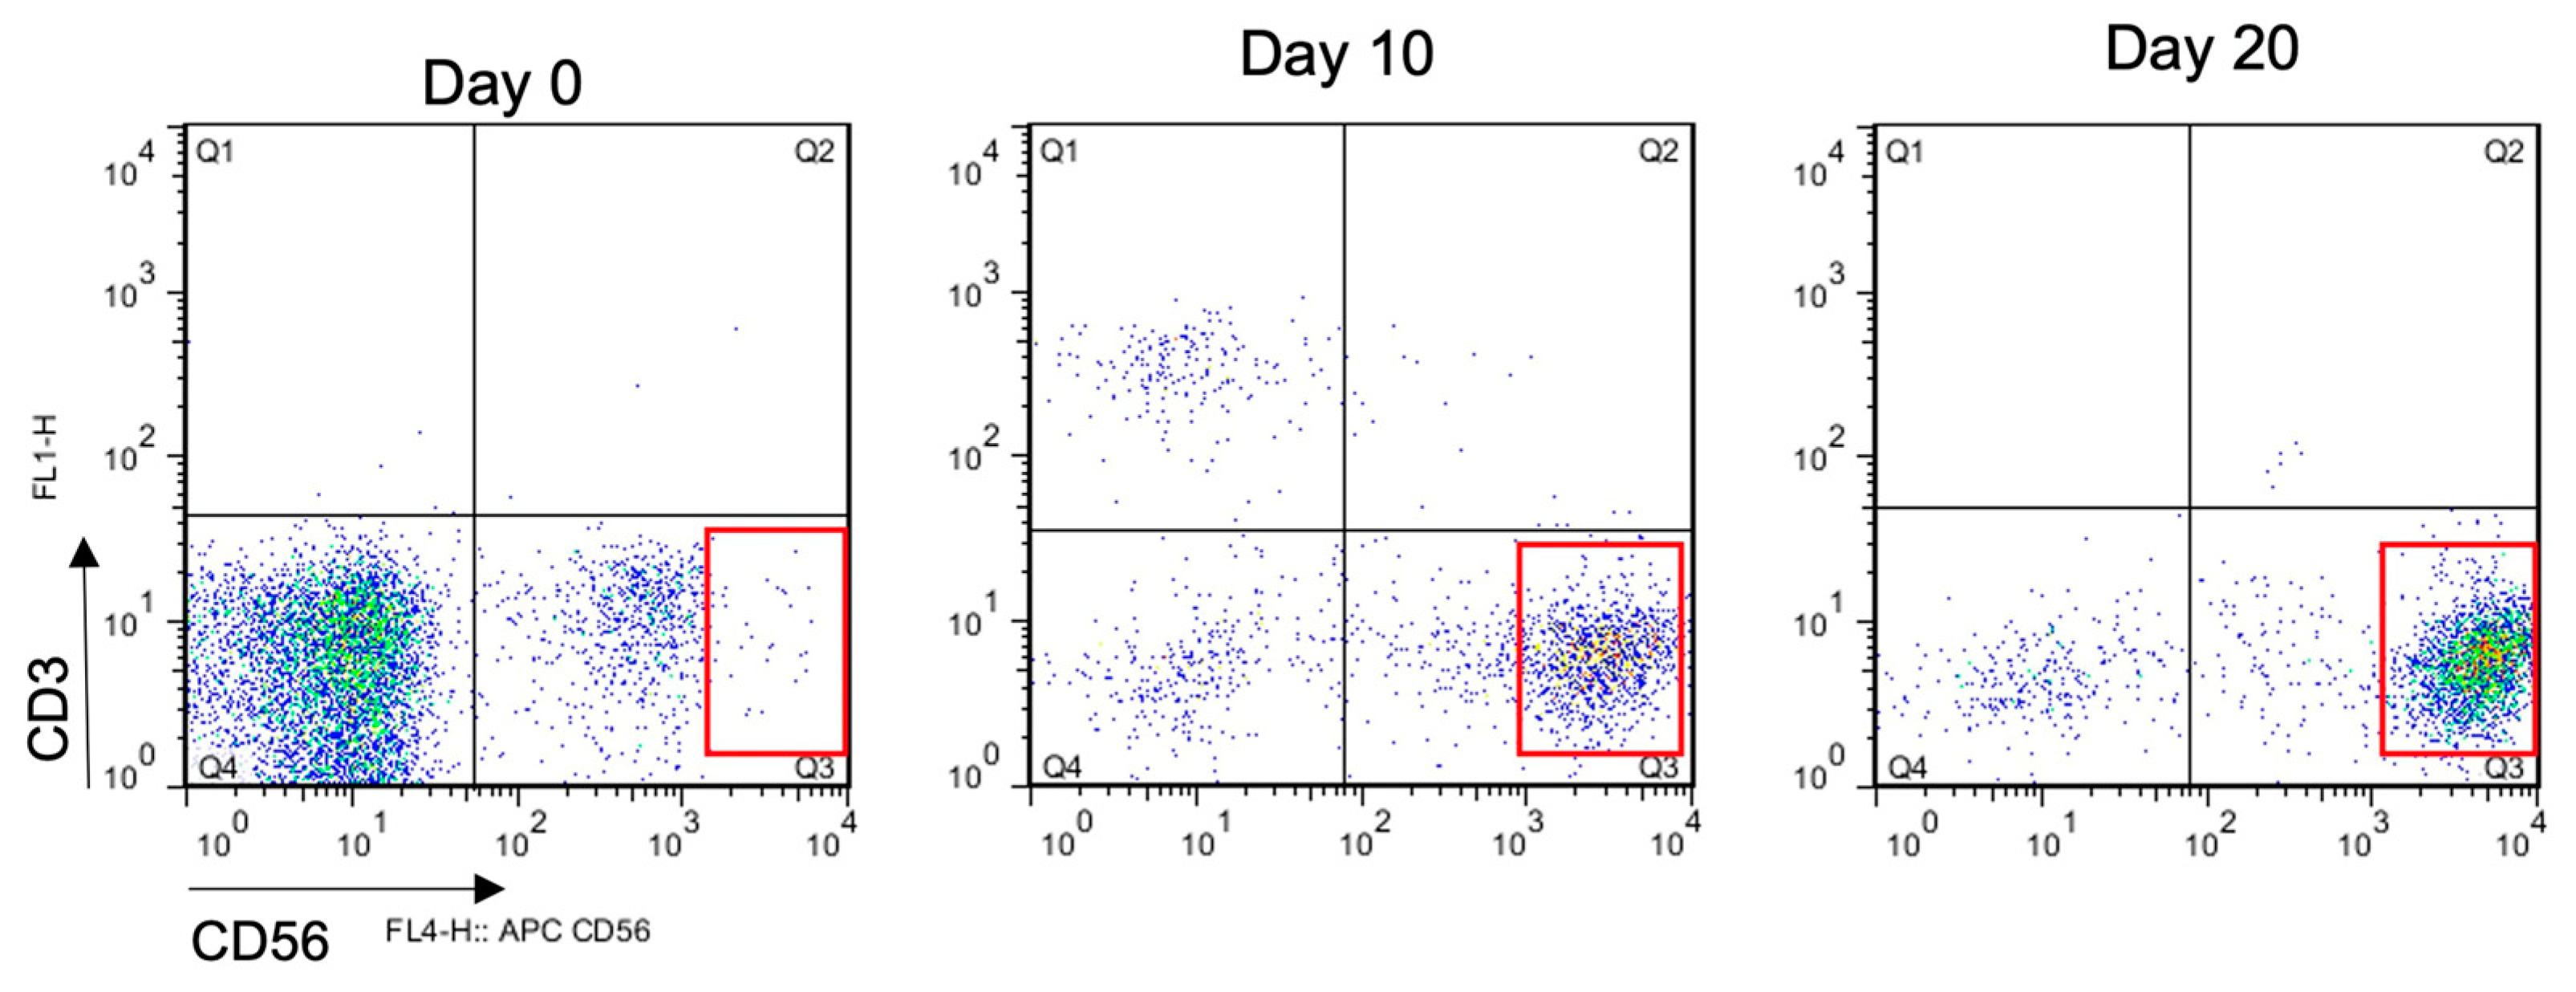
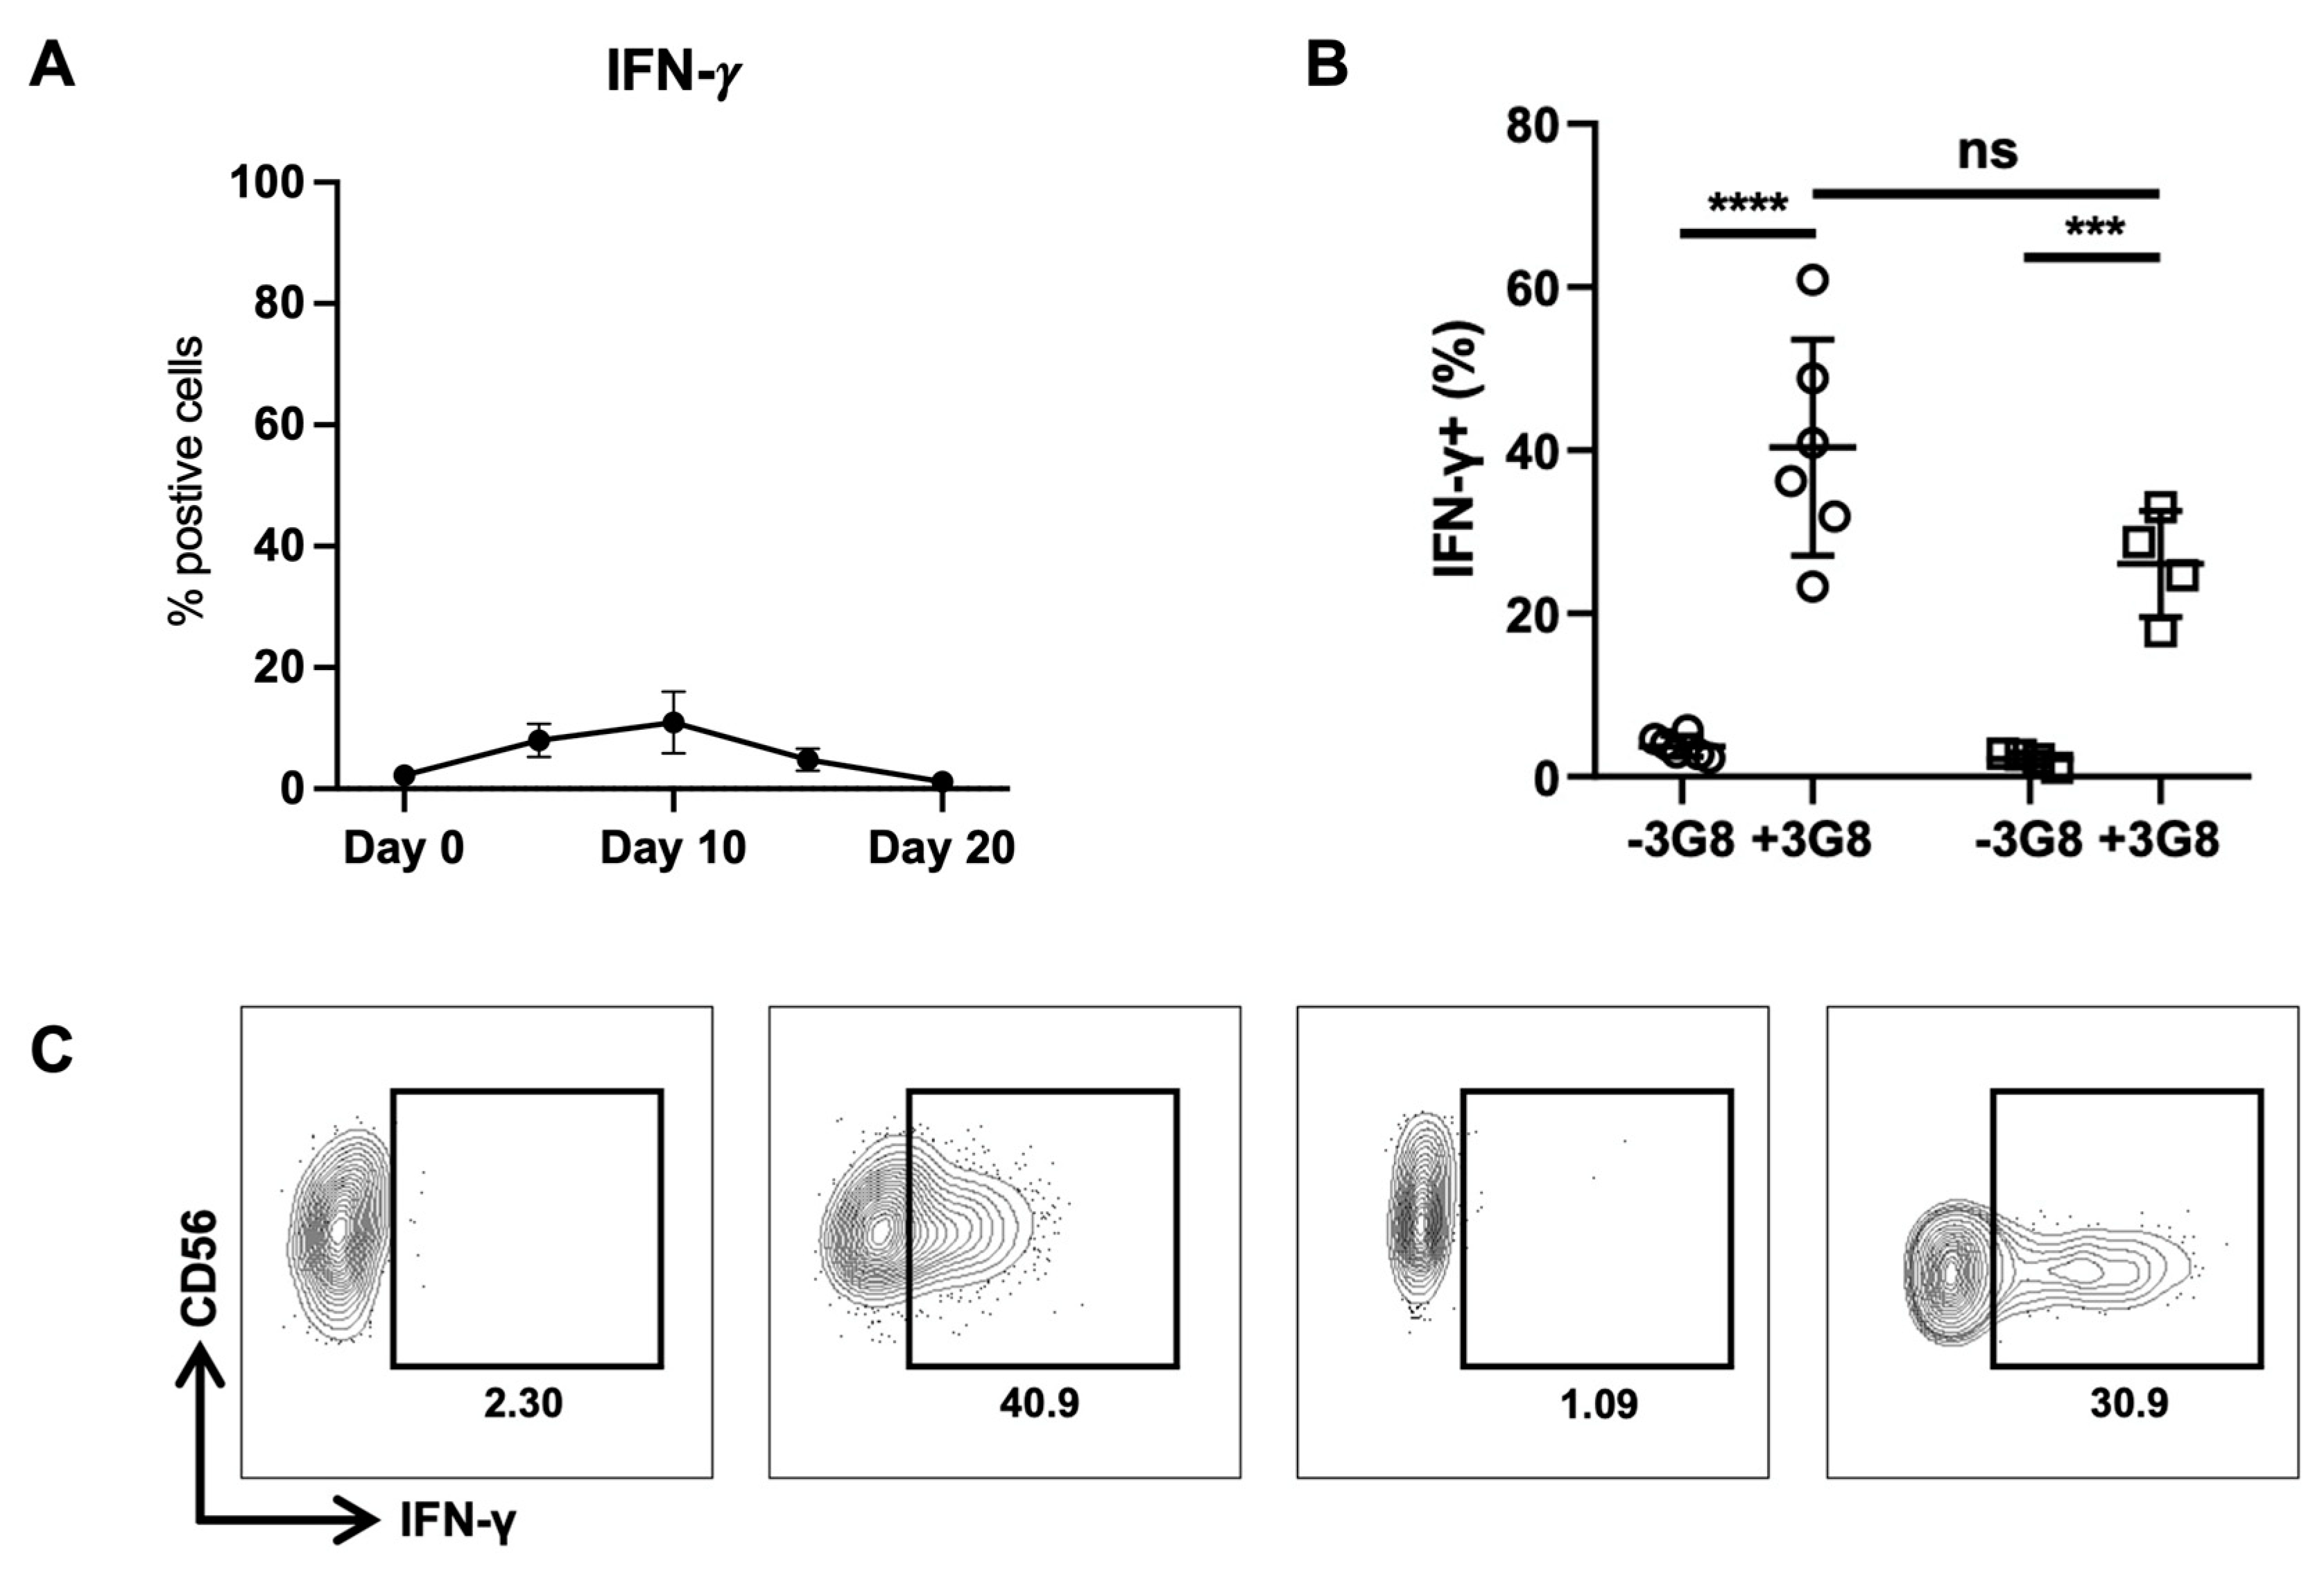
4.5. Flow Cytometry
4.6. Statistical Analysis
5. Conclusions
Supplementary Materials
Author Contributions
Funding
Institutional Review Board Statement
Informed Consent Statement
Data Availability Statement
Conflicts of Interest
References
- Demaria, O.; Cornen, S.; Daëron, M.; Morel, Y.; Medzhitov, R.; Vivier, E. Harnessing innate immunity in cancer therapy. Nature 2019, 574, 45–56. [Google Scholar] [CrossRef] [PubMed]
- Morvan, M.; Lanier, L. NK cells and cancer: You can teach innate cells new tricks. Nat. Rev. Cancer 2016, 16, 7–19. [Google Scholar] [CrossRef] [PubMed]
- Chiossone, L.; Vivier, E. Bringing natural killer cells to the clinic. J. Exp. Med. 2022, 219, e20220830. [Google Scholar] [CrossRef] [PubMed]
- Reina-Ortiz, C.; Giraldos, D.; Azaceta, G.; Palomera, L.; Marzo, I.; Naval, J.; Villalba, M.; Anel, A. Harnessing the Potential of NK Cell-Based Immunotherapies against Multiple Myeloma. Cells 2021, 11, 392. [Google Scholar] [CrossRef] [PubMed]
- Fujisaki, H.; Kakuda, H.; Shimasaki, N.; Imai, C.; Ma, J.; Lockey, T.; Elridge, P.; Leung, W.H.; Campana, D. Expansion of Highly Cytotoxic Human Natural Killer Cells for Cancer Cell Therapy. Cancer Res. 2009, 69, 4010–4017. [Google Scholar] [CrossRef]
- Cooper, M.A.; Elliott, J.M.; Keyel, P.A.; Yang, L.; Carrero, J.A.; Yokoyama, W.M. Cytokine-induced memory-like natural killer cells. Proc. Natl. Acad. Sci. USA 2009, 106, 1915–1919. [Google Scholar] [CrossRef]
- Heipertz, E.; Zynda, E.; Stav-Noraas, T.; Hungler, A.; Boucher, S.; Kaur, N.; Vemuri, M. Current Perspectives on “Off-The-Shelf” Allogeneic NK and CAR-NK Cell Therapies. Front. Immunol. 2021, 12, 732135. [Google Scholar] [CrossRef]
- Clara, J.; Childs, R. Harnessing natural killer cells for the treatment of multiple myeloma. Semin. Oncol. 2022, 49, 69–85. [Google Scholar] [CrossRef]
- Calvo, T.; Reina-Ortiz, C.; Giraldos, D.; Gascón, M.; Woods, D.; Asenjo, J.; Marco-Brualla, J.; Azaceta, G.; Izquierdo, I.; Palomera, L.; et al. Expanded and activated allogeneic NK cells are cytotoxic against B-chronic lymphocytic leukemia (B-CLL) cells with sporadic cases of resistance. Sci. Rep. 2020, 10, 19398. [Google Scholar] [CrossRef]
- Reina-Ortiz, C.; Constantinides, M.; Fayd-Herbe-de-Maudave, A.; Présumey, J.; Hernandez, J.; Cartron, G.; Giraldos, D.; Díez, R.; Izquierdo, I.; Azaceta, G.; et al. Expanded NK cells from umbilical cord blood and adult peripheral blood combined with daratumumab are effective against tumor cells from multiple myeloma patients. Oncoimmunology 2020, 10, e1853314. [Google Scholar] [CrossRef]
- Sánchez-Martínez, D.; Allende-Vega, N.; Orecchioni, S.; Talarico, G.; Cornillon, A.; Vo, D.; Rene, C.; Lu, Z.; Krzywinska, E.; Anel, A.; et al. Expansion of allogeneic NK cells with efficient antibody-dependent cell cytotoxicity against multiple tumors. Theranostics 2018, 8, 3856–3869. [Google Scholar] [CrossRef] [PubMed]
- Kim, V.; Han, J.; Siomi, M. Biogenesis of small RNAs in animals. Nat. Rev. Mol. Cell Biol. 2009, 10, 126–139. [Google Scholar] [CrossRef] [PubMed]
- Bartel, D. MicroRNAs: Target recognition and regulatory functions. Cell 2009, 136, 215–233. [Google Scholar] [CrossRef] [PubMed]
- Drakaki, A.; Iliopoulos, D. MicroRNA Gene Networks in Oncogenesis. Curr. Genom. 2009, 10, 35–41. [Google Scholar] [CrossRef] [PubMed]
- Sánchez-Martínez, D.; Krzywinska, E.; Rathore, M.G.; Saument, A.; Cornilon, A.; López-Royuela, N.; Martínez-Lostao, L.; Ramírez-Labrada, A.; Lu, Z.; Rossi, J.; et al. All-trans retinoic acid (ATRA) induces miR-23a expression, decreases CTSC expression and granzyme B activity leading to impaired NK cell cytotoxicity. Int. J. Biochem. Cell Biol. 2014, 49 Pt C, 42–52. [Google Scholar] [CrossRef]
- Cui, X.; Qian, Z.; Li, C.; Cui, S. Identification of miRNA and mRNA expression profiles by PCR microarray in hepatitis B virus-associated hepatocellular carcinoma. Mol. Med. Rep. 2018, 18, 5123–5132. [Google Scholar] [CrossRef]
- Dobrowolny, G.; Martone, J.; Lepore, E.; Casola, I.; Petrucci, A.; Inghilleri, M.; Morlando, M.; Colantoni, A.; Scicchitano, B.; Calvo, A.; et al. A longitudinal study defined circulating microRNAs as reliable biomarkers for disease prognosis and progression in ALS human patients. Cell Death Discov. 2021, 7, 4. [Google Scholar] [CrossRef]
- Li, D.; Wang, X.; Yin, W.; Niu, K.; Zhu, W.; Fang, N. MiR-199a-5p suppresses proliferation and invasion of human laryngeal cancer cells. Eur. Rev. Med. Pharmacol. Sci. 2020, 24, 12200–12207. [Google Scholar]
- Liu, L.; Lu, L.; Zheng, A.; Xie, J.; Xue, Q.; Wang, F.; Wang, X.; Zhou, H.; Tong, X.; Li, Y.; et al. MiR-199a-5p and let-7c cooperatively inhibit migration and invasion by targeting MAP4K3 in hepatocellular carcinoma. Oncotarget 2017, 8, 13666–13677. [Google Scholar] [CrossRef]
- Liu, P.; Xia, P.; Fu, Q.; Liu, C.; Luo, Q.; Cheng, L.; Yu, P.; Qin, T.; Zhang, H. miR-199a-5p inhibits the proliferation of hepatocellular carcinoma cells by regulating CDC25A to induce cell cycle arrest. Biochem. Biophys Res. Commun. 2021, 571, 96–103. [Google Scholar] [CrossRef]
- Wong, Q.; Lung, R.; Law, P.; Lai, P.; Chan, K.; To, K.; Wong, N. MicroRNA-223 is commonly repressed in hepatocellular carcinoma and potentiates expression of Stathmin1. Gastroenterology 2008, 135, 257–269. [Google Scholar] [CrossRef] [PubMed]
- Guan, J.; Liu, Z.; Xiao, M.; Hao, F.; Wang, C.; Chen, Y.; Lu, Y.; Liang, J. MicroRNA-199a-3p inhibits tumorigenesis of hepatocellular carcinoma cells by targeting ZHX1/PUMA signal. Am. J. Transl. Res. 2017, 9, 2457–2465. [Google Scholar] [PubMed]
- Chen, W.; Li, X. MiR-222-3p Promotes Cell Proliferation and Inhibits Apoptosis by Targeting PUMA (BBC3) in Non-Small Cell Lung Cancer. Technol. Cancer Res. Treat. 2020, 19, 1533033820922558. [Google Scholar] [CrossRef] [PubMed]
- Jiang, F.; Zhao, W.; Zhou, L.; Zhang, L.; Liu, Z.; Yu, D. miR-222 regulates the cell biological behavior of oral squamous cell carcinoma by targeting PUMA. Oncol. Rep. 2014, 31, 1255–1262. [Google Scholar] [CrossRef] [PubMed]
- Lai, T.; Lee, T.; Chang, Y.; Chen, Y.; Lin, S.; Lin, S.; Pu, C.; Tsai, J.; Chen, Y. MicroRNA-221/222 Mediates ADSC-Exosome-Induced Cardioprotection Against Ischemia/Reperfusion by Targeting PUMA and ETS-1. Front. Cell Dev. Biol. 2020, 8, 569150. [Google Scholar] [CrossRef]
- Zhang, C.; Zhang, J.; Zhang, A.; Shi, Z.; Han, L.; Jia, Z.; Yang, W.; Wang, G.; Jiang, T.; You, Y.; et al. MiR-221 and miR-222 target PUMA to induce cell survival in glioblastoma. Mol. Cancer 2010, 9, 229. [Google Scholar] [CrossRef]
- Yan, Y.; Xie, R.; Zhang, Q.; Zhu, X.; Han, J.; Xia, R. Bcl-xL/Bak interaction and regulation by miRNA let-7b in the intrinsic apoptotic pathway of stored platelets. Platelets 2019, 30, 75–80. [Google Scholar] [CrossRef]
- Yu, S.; Huang, H.; Deng, G.; Xie, Z.; Ye, Y.; Guo, R.; Cai, X.; Hong, J.; Qian, D.; Zhou, X.; et al. miR-326 Targets Antiapoptotic Bcl-xL and Mediates Apoptosis in Human Platelets. PLoS ONE 2015, 10, e0122784. [Google Scholar] [CrossRef]
- Tuo, B.; Xu, J.; Zhang, W.; Li, X.; Peng, L.; Zou, Q.; Deng, Y.; Lei, J.; Li, H. Upregulation of miR-140-5p uncouples mitochondria by targeting Bcl-xL in vascular smooth muscle cells in angiotensin II-induced hypertension. Bioengineered 2022, 13, 1137–1148. [Google Scholar] [CrossRef]
- Shimizu, S.; Takehara, T.; Hikita, H.; Kodama, T.; Miyagi, T.; Hosui, A.; Tatsumi, T.; Ishida, H.; Noda, T.; Nagano, H.; et al. The let-7 family of microRNAs inhibits Bcl-xL expression and potentiates sorafenib-induced apoptosis in human hepatocellular carcinoma. J. Hepatol. 2010, 52, 698–704. [Google Scholar] [CrossRef]
- Fehniger, T.; Wylie, T.; Germino, E.; Leong, J.; Magrini, V.; Koul, S.; Keppel, C.; Schneider, S.; Koboldt, D.; Sullivan, R.; et al. Next-generation sequencing identifies the natural killer cell microRNA transcriptome. Genome Res. 2010, 20, 1590–1604. [Google Scholar] [CrossRef] [PubMed]
- Kim, T.; Lee, S.; Yun, S.; Sun, H.; Lee, S.; Kim, J.; Kim, H.; Park, S.; Lee, C.; Yoon, S.; et al. Human microRNA-27a* targets Prf1 and GzmB expression to regulate NK-cell cytotoxicity. Blood 2011, 118, 5476–5486. [Google Scholar] [CrossRef] [PubMed]
- Ou, D.; Wu, Y.; Zhang, J.; Liu, J.; Liu, Z.; Shao, M.; Guo, X.; Cui, S. miR-340-5p affects oral squamous cell carcinoma (OSCC) cells proliferation and invasion by targeting endoplasmic reticulum stress proteins. Eur. J. Pharmacol. 2022, 920, 174820. [Google Scholar] [CrossRef]
- Yang, L.; Men, W.; Yan, K.; Tie, J.; Nie, Y.; Xiao, H. MiR-340-5p is a potential prognostic indicator of colorectal cancer and modulates ANXA3. Eur. Rev. Med. Pharmacol. Sci. 2018, 22, 4837–4845. [Google Scholar] [PubMed]
- Zhao, L.; Zhang, X.; Wu, Z.; Huang, K.; Sun, X.; Chen, H.; Jin, M. The Downregulation of MicroRNA hsa-miR-340-5p in IAV-Infected A549 Cells Suppresses Viral Replication by Targeting RIG-I and OAS2. Mol. Ther. Nucleic Acids 2019, 14, 509–519. [Google Scholar] [CrossRef] [PubMed]
- Liu, D.; Lin, L.; Wang, Y.; Chen, L.; He, Y.; Luo, Y.; Qi, L.; Guo, Y.; Chen, L.; Han, Z.; et al. PNO1, which is negatively regulated by miR-340-5p, promotes lung adenocarcinoma progression through Notch signaling pathway. Oncogenesis 2020, 9, 58. [Google Scholar] [CrossRef]
- Zhang, Y.; Li, X.; Zhang, J.; Liang, H. Natural killer T cell cytotoxic activity in cervical cancer is facilitated by the LINC00240/microRNA-124-3p/STAT3/MICA axis. Cancer Lett. 2020, 474, 63–73. [Google Scholar] [CrossRef]
- de Araujo, E.; Keseru, G.; Gunning, P.; Moriggl, R. Targeting STAT3 and STAT5 in Cancer. Cancers 2020, 12, 2002. [Google Scholar] [CrossRef]
- Tolomeo, M.; Cascio, A. The Multifaced Role of STAT3 in Cancer and Its Implication for Anticancer Therapy. Int. J. Mol. Sci. 2021, 22, 603. [Google Scholar] [CrossRef]
- Jonker, D.; Nott, L.; Yoshino, T.; Gill, S.; Shapiro, J.; Ohtsu, A.; Zalcberg, J.; Vickers, M.; Wei, A.; Gao, Y.; et al. Napabucasin versus placebo in refractory advanced colorectal cancer: A randomised phase 3 trial. Lancet Gastroenterol. Hepatol. 2018, 3, 263–270. [Google Scholar] [CrossRef]
- Gotthardt, D.; Putz, E.; Straka, E.; Kudweis, P.; Biaggio, M.; Poli, V.; Strobl, B.; Müller, M.; Sexl, V. Loss of STAT3 in murine NK cells enhances NK cell-dependent tumor surveillance. Blood 2014, 124, 2370–2379. [Google Scholar] [CrossRef] [PubMed]
- Wu, J.; Gao, F.; Wang, C.; Qin, M.; Han, F.; Xu, T.; Hu, Z.; Long, Y.; He, X.; Deng, X.; et al. L-6 and IL-8 secreted by tumour cells impair the function of NK cells via the STAT3 pathway in oesophageal squamous cell carcinoma. J. Exp. Clin. Cancer Res. 2019, 38, 321. [Google Scholar] [CrossRef] [PubMed]
- Zhu, S.; Phatarpekar, P.; Denman, C.; Senyukov, V.; Somanchi, S.; Nguyen-Jackson, H.; Mace, E.; Freeman, A.; Watowich, S.; Orange, J.; et al. Transcription of the activating receptor NKG2D in natural killer cells is regulated by STAT3 tyrosine phosphorylation. Blood 2014, 124, 403–411. [Google Scholar] [CrossRef] [PubMed]
- He, L.; He, X.; Lim, L.; de Stanchina, E.; Xuan, Z.; Liang, Y.; Xue, W.; Zender, L.; Magnus, J.; Ridzon, D.; et al. A microRNA component of the p53 tumour suppressor network. Nature 2007, 447, 1130–1134. [Google Scholar] [CrossRef]
- Liu, C.; Kelnar, K.; Liu, B.; Chen, X.; Calhoun-Davis, T.; Li, H.; Patrawala, L.; Yan, H.; Jeter, C.; Honorio, S.; et al. The microRNA miR-34a inhibits prostate cancer stem cells and metastasis by directly repressing CD44. Nat. Med. 2011, 17, 211–215. [Google Scholar] [CrossRef]
- Rathod, S.; Rani, S.; Khan, M.; Muzumdar, D.; Shiras, A. Tumor suppressive miRNA-34a suppresses cell proliferation and tumor growth of glioma stem cells by targeting Akt and Wnt signaling pathways. FEBS Open Bio. 2014, 4, 485–495. [Google Scholar] [CrossRef]
- Zhang, H.; Li, N.; Zhang, J.; Jin, F.; Shan, M.; Qin, J.; Wang, Y. The influence of miR-34a expression on stemness and cytotoxic susceptibility of breast cancer stem cells. Cancer Biol. Ther. 2016, 17, 614–624. [Google Scholar] [CrossRef]
- Zhang, R.; Su, J.; Xue, S.; Yang, H.; Ju, L.; Ji, Y.; Wu, K.; Zhang, Y.; Zhang, Y.; Hu, J.; et al. HPV E6/p53 mediated down-regulation of miR-34a inhibits Warburg effect through targeting LDHA in cervical cancer. Am. J. Cancer Res. 2016, 6, 312–320. [Google Scholar]
- Ovcharenko, D.; Stölzel, F.; Poitz, D.; Fierro, F.; Schaich, M.; Neubauer, A.; Kelnar, K.; Davison, T.; Müller-Tidow, C.; Thiede, C.; et al. miR-10a overexpression is associated with NPM1 mutations and MDM4 downregulation in intermediate-risk acute myeloid leukemia. Exp. Hematol. 2011, 39, 1030–1042. [Google Scholar] [CrossRef]
- Gu, Y.; Feng, X.; Jin, Y.; Liu, Y.; Zeng, L.; Zhou, D.; Feng, Y. Upregulation of miRNA-10a-5p promotes tumor progression in cervical cancer by suppressing UBE2I signaling. J. Obstet. Gynaecol. 2023, 43, 2171283. [Google Scholar] [CrossRef]
- Bryant, A.; Palma, C.; Jayaswal, V.; Yang, Y.; Lutherborrow, M.; Ma, D. miR-10a is aberrantly overexpressed in Nucleophosmin1 mutated acute myeloid leukaemia and its suppression induces cell death. Mol. Cancer 2012, 11, 8. [Google Scholar] [CrossRef] [PubMed]
- Pesce, S.; Squillario, M.; Greppi, M.; Loiacono, F.; Moretta, L.; Moretta, A.; Sivori, S.; Castagnola, P.; Barla, A.; Candiani, S.; et al. New miRNA Signature Heralds Human NK Cell Subsets at Different Maturation Steps: Involvement of miR-146a-5p in the Regulation of KIR Expression. Front. Immunol. 2018, 9, 2360. [Google Scholar] [CrossRef] [PubMed]
- Xu, D.; Han, Q.; Hou, Z.; Zhang, C.; Zhang, J. miR-146a negatively regulates NK cell functions via STAT1 signaling. Cell. Mol. Immunol. 2017, 14, 712–720. [Google Scholar] [CrossRef]
- Wang, H.; Zhang, Y.; Wu, X.; Wang, Y.; Cui, H.; Li, X.; Zhang, J.; Tun, N.; Peng, Y.; Yu, J. Regulation of Human Natural Killer Cell IFN-γ Production by MicroRNA-146a via Targeting the NF-κB Signaling Pathway. Front. Immunol. 2018, 9, 293. [Google Scholar] [CrossRef]
- Allende-Vega, N.; Marco-Brualla, J.; Falvo, P.; Alexia, C.; Constantinides, M.; de Maudave, A.; Coenon, L.; Gitenay, D.; Mitola, G.; Massa, P.; et al. Metformin sensitizes leukemic cells to cytotoxic lymphocytes by increasing expression of intercellular adhesion molecule-1 (ICAM-1). Sci. Rep. 2022, 12, 1341. [Google Scholar] [CrossRef] [PubMed]
- Belkahla, S.; Marco-Brualla, J.; Fayd’herbe de Maudave, A.; Falvo, P.; Allende-Vega, N.; Constantinides, M.; Khan, A.; Coenon, L.; Alexia, C.; Mitola, G.; et al. The metabolism of cells regulates their sensitivity to NK cells depending on p53 status. Sci. Rep. 2022, 12, 3234. [Google Scholar] [CrossRef] [PubMed]
- Nanbakhsh, A.; Srinivasamani, A.; Holzhauer, S.; Riese, M.; Zheng, Y.; Wang, D.; Burns, R.; Reimer, M.; Rao, S.; Lemke, A.; et al. Mirc11 Disrupts Inflammatory but Not Cytotoxic Responses of NK Cells. Cancer Immunol. Res. 2019, 7, 1647–1662. [Google Scholar] [CrossRef]
- Wang, P.; Gu, Y.; Zhang, Q.; Han, Y.; Hou, J.; Lin, L.; Wu, C.; Bao, Y.; Su, X.; Jiang, M.; et al. Identification of Resting and Type I IFN-Activated Human NK Cell miRNomes Reveals MicroRNA-378 and MicroRNA-30e as Negative Regulators of NK Cell Cytotoxicity. J. Immunol. 2012, 189, 211–221. [Google Scholar] [CrossRef]
- Sánchez-Martínez, D.; Azaceta, G.; Muntasell, A.; Aguiló, N.; Núñez, D.; Gálvez, E.; Naval, J.; Anel, A.; Palomera, L.; Vilches, C.; et al. Human NK cells activated by EBV+ lymphoblastoid cells overcome anti-apoptotic mechanisms of drug resistance in haematological cancer cells. Oncoimmunology 2015, 4, e991613. [Google Scholar] [CrossRef]
- Sánchez-Martínez, D.; Lanuza, P.; Gómez, N.; Muntasell, A.; Cisneros, E.; Moraru, M.; Azaceta, G.; Anel, A.; Martínez-Lostao, L.; Villalba, M.; et al. Activated allogeneic NK cells preferentially kill poor prognosis B-cell chronic lymphocytic leukemia cells. Front. Immunol. 2016, 7, 454. [Google Scholar] [CrossRef]
- Comet, N.; Aguiló, J.; Rathoré, M.; Catalán, E.; Garaude, J.; Uzé, G.; Naval, J.; Pardo, J.; Villalba, M.; Anel, A. IFNα signaling through PKC-θ is essential for antitumor NK cell function. Oncoimmunology 2014, 3, e948705. [Google Scholar] [CrossRef] [PubMed]
- Perussia, B.; Ramoni, C.; Anegon, I.; Cuturi, M.; Faust, J.; Trinchieri, G. Preferential proliferation of natural killer cells among peripheral blood mononuclear cells cocultured with B lymphoblastoid cell lines. Nat. Immun. Cell Growth Regul. 1987, 6, 171–188. [Google Scholar] [PubMed]


| Differentially Expressed miRNAs | |||||
|---|---|---|---|---|---|
| Down-Regulated miRNAs | Up-Regulated miRNAs | ||||
| Target | Fold Change | p-Value, C | Target | Fold Change | p-Value, C |
| hsa-miR-199a-3p | 0.004 | ** 0.01 | hsa-miR-124-3p | 50,135.445 | ** 0.01 |
| hsa-miR-223-3p | 0.009 | * 0.04 | hsa-miR-34a-5p | 159.077 | ** 0.01 |
| hsa-miR-126-3p | 0.012 | 0.19 | hsa-miR-10a-5p | 38.856 | ** 0.01 |
| hsa-miR-495-3p | 0.025 | 0.19 | hsa-miR-589-5p | 38.322 | 0.33 |
| hsa-miR-193a-3p | 0.026 | 0.12 | hsa-miR-146a-5p | 33.218 | ** 0.01 |
| hsa-miR-145-5p | 0.033 | 0.19 | hsa-miR-615-3p | 20.92 | 0.39 |
| hsa-miR-193a-5p | 0.036 | 0.17 | hsa-miR-210-3p | 15.214 | 0.12 |
| hsa-miR-101-3p | 0.04 | 0.12 | hsa-miR-135b-5p | 14.119 | 0.22 |
| hsa-miR-130a-3p | 0.047 | 0.19 | hsa-miR-135a-5p | 10.394 | 0.46 |
| hsa-miR-338-3p | 0.051 | 0.23 | hsa-miR-330-3p | 6.473 | 0.1 |
| hsa-miR-340-5p | 0.058 | ** 0.01 | hsa-miR-342-5p | 5.791 | 0.38 |
| hsa-miR-365a-3p | 0.092 | 0.39 | hsa-miR-342-3p | 4.618 | 0.2 |
| hsa-miR-190a-5p | 0.095 | 0.31 | hsa-miR-363-3p | 4.526 | 0.39 |
| hsa-miR-450b-5p | 0.105 | 0.31 | hsa-miR-155-5p | 4.361 | 0.27 |
| hsa-miR-125b-5p | 0.111 | 0.23 | hsa-miR-130b-3p | 3.951 | 0.27 |
| hsa-miR-499a-5p | 0.186 | 0.12 | hsa-miR-193b-3p | 3.038 | 0.3 |
| hsa-miR-532-5p | 0.19 | 0.12 | hsa-miR-181b-5p | 3.003 | 0.37 |
| hsa-miR-26a-5p | 0.196 | 0.31 | hsa-miR-222-3p | 2.749 | 0.43 |
| hsa-miR-339-5p | 0.226 | 0.36 | hsa-miR-132-3p | 2.701 | 0.44 |
| hsa-miR-27a-3p | 0.227 | 0.39 | hsa-miR-195-5p | 2.653 | 0.35 |
| hsa-miR-30b-5p | 0.242 | 0.27 | hsa-miR-625-5p | 2.631 | 0.19 |
| hsa-miR-188-3p | 0.247 | 0.27 | hsa-miR-214-3p | 2.488 | 0.27 |
| hsa-miR-328-3p | 0.255 | 0.23 | hsa-miR-181a-5p | 2.346 | 0.33 |
| hsa-miR-29c-3p | 0.258 | 0.27 | hsa-miR-598-3p | 2.274 | 0.27 |
| hsa-miR-326 | 0.258 | 0.27 | hsa-miR-152-3p | 2.248 | 0.35 |
| hsa-let-7b-5p | 0.277 | 0.23 | |||
| hsa-miR-32-5p | 0.293 | 0.31 | |||
| hsa-miR-140-3p | 0.304 | 0.46 | |||
| hsa-miR-660-5p | 0.319 | 0.34 | |||
| hsa-miR-194-5p | 0.34 | 0.39 | |||
| hsa-miR-502-5p | 0.36 | 0.19 | |||
| hsa-miR-30e-5p | 0.376 | 0.39 | |||
| hsa-miR-421 | 0.381 | 0.48 | |||
| hsa-miR-361-5p | 0.393 | 0.36 | |||
| hsa-miR-197-3p | 0.4 | 0.34 | |||
| hsa-miR-339-3p | 0.4 | 0.31 | |||
| hsa-miR-141-3p | 0.406 | 0.24 | |||
| hsa-miR-192-5p | 0.41 | 0.19 | |||
| hsa-miR-20a-5p | 0.467 | 0.37 | |||
Disclaimer/Publisher’s Note: The statements, opinions and data contained in all publications are solely those of the individual author(s) and contributor(s) and not of MDPI and/or the editor(s). MDPI and/or the editor(s) disclaim responsibility for any injury to people or property resulting from any ideas, methods, instructions or products referred to in the content. |
© 2023 by the authors. Licensee MDPI, Basel, Switzerland. This article is an open access article distributed under the terms and conditions of the Creative Commons Attribution (CC BY) license (https://creativecommons.org/licenses/by/4.0/).
Share and Cite
Reina-Ortiz, C.; Mozas, M.P.; Ovelleiro, D.; Gao, F.; Villalba, M.; Anel, A. Dynamic Changes in miRNA Expression during the Generation of Expanded and Activated NK Cells. Int. J. Mol. Sci. 2023, 24, 13556. https://doi.org/10.3390/ijms241713556
Reina-Ortiz C, Mozas MP, Ovelleiro D, Gao F, Villalba M, Anel A. Dynamic Changes in miRNA Expression during the Generation of Expanded and Activated NK Cells. International Journal of Molecular Sciences. 2023; 24(17):13556. https://doi.org/10.3390/ijms241713556
Chicago/Turabian StyleReina-Ortiz, Chantal, Mª Pilar Mozas, David Ovelleiro, Fei Gao, Martín Villalba, and Alberto Anel. 2023. "Dynamic Changes in miRNA Expression during the Generation of Expanded and Activated NK Cells" International Journal of Molecular Sciences 24, no. 17: 13556. https://doi.org/10.3390/ijms241713556
APA StyleReina-Ortiz, C., Mozas, M. P., Ovelleiro, D., Gao, F., Villalba, M., & Anel, A. (2023). Dynamic Changes in miRNA Expression during the Generation of Expanded and Activated NK Cells. International Journal of Molecular Sciences, 24(17), 13556. https://doi.org/10.3390/ijms241713556