
New Insight into the Potential Protective Function of Sulforaphene against ROS−Mediated Oxidative Stress Damage In Vitro and In Vivo

Abstract
1. Introduction
2. Results
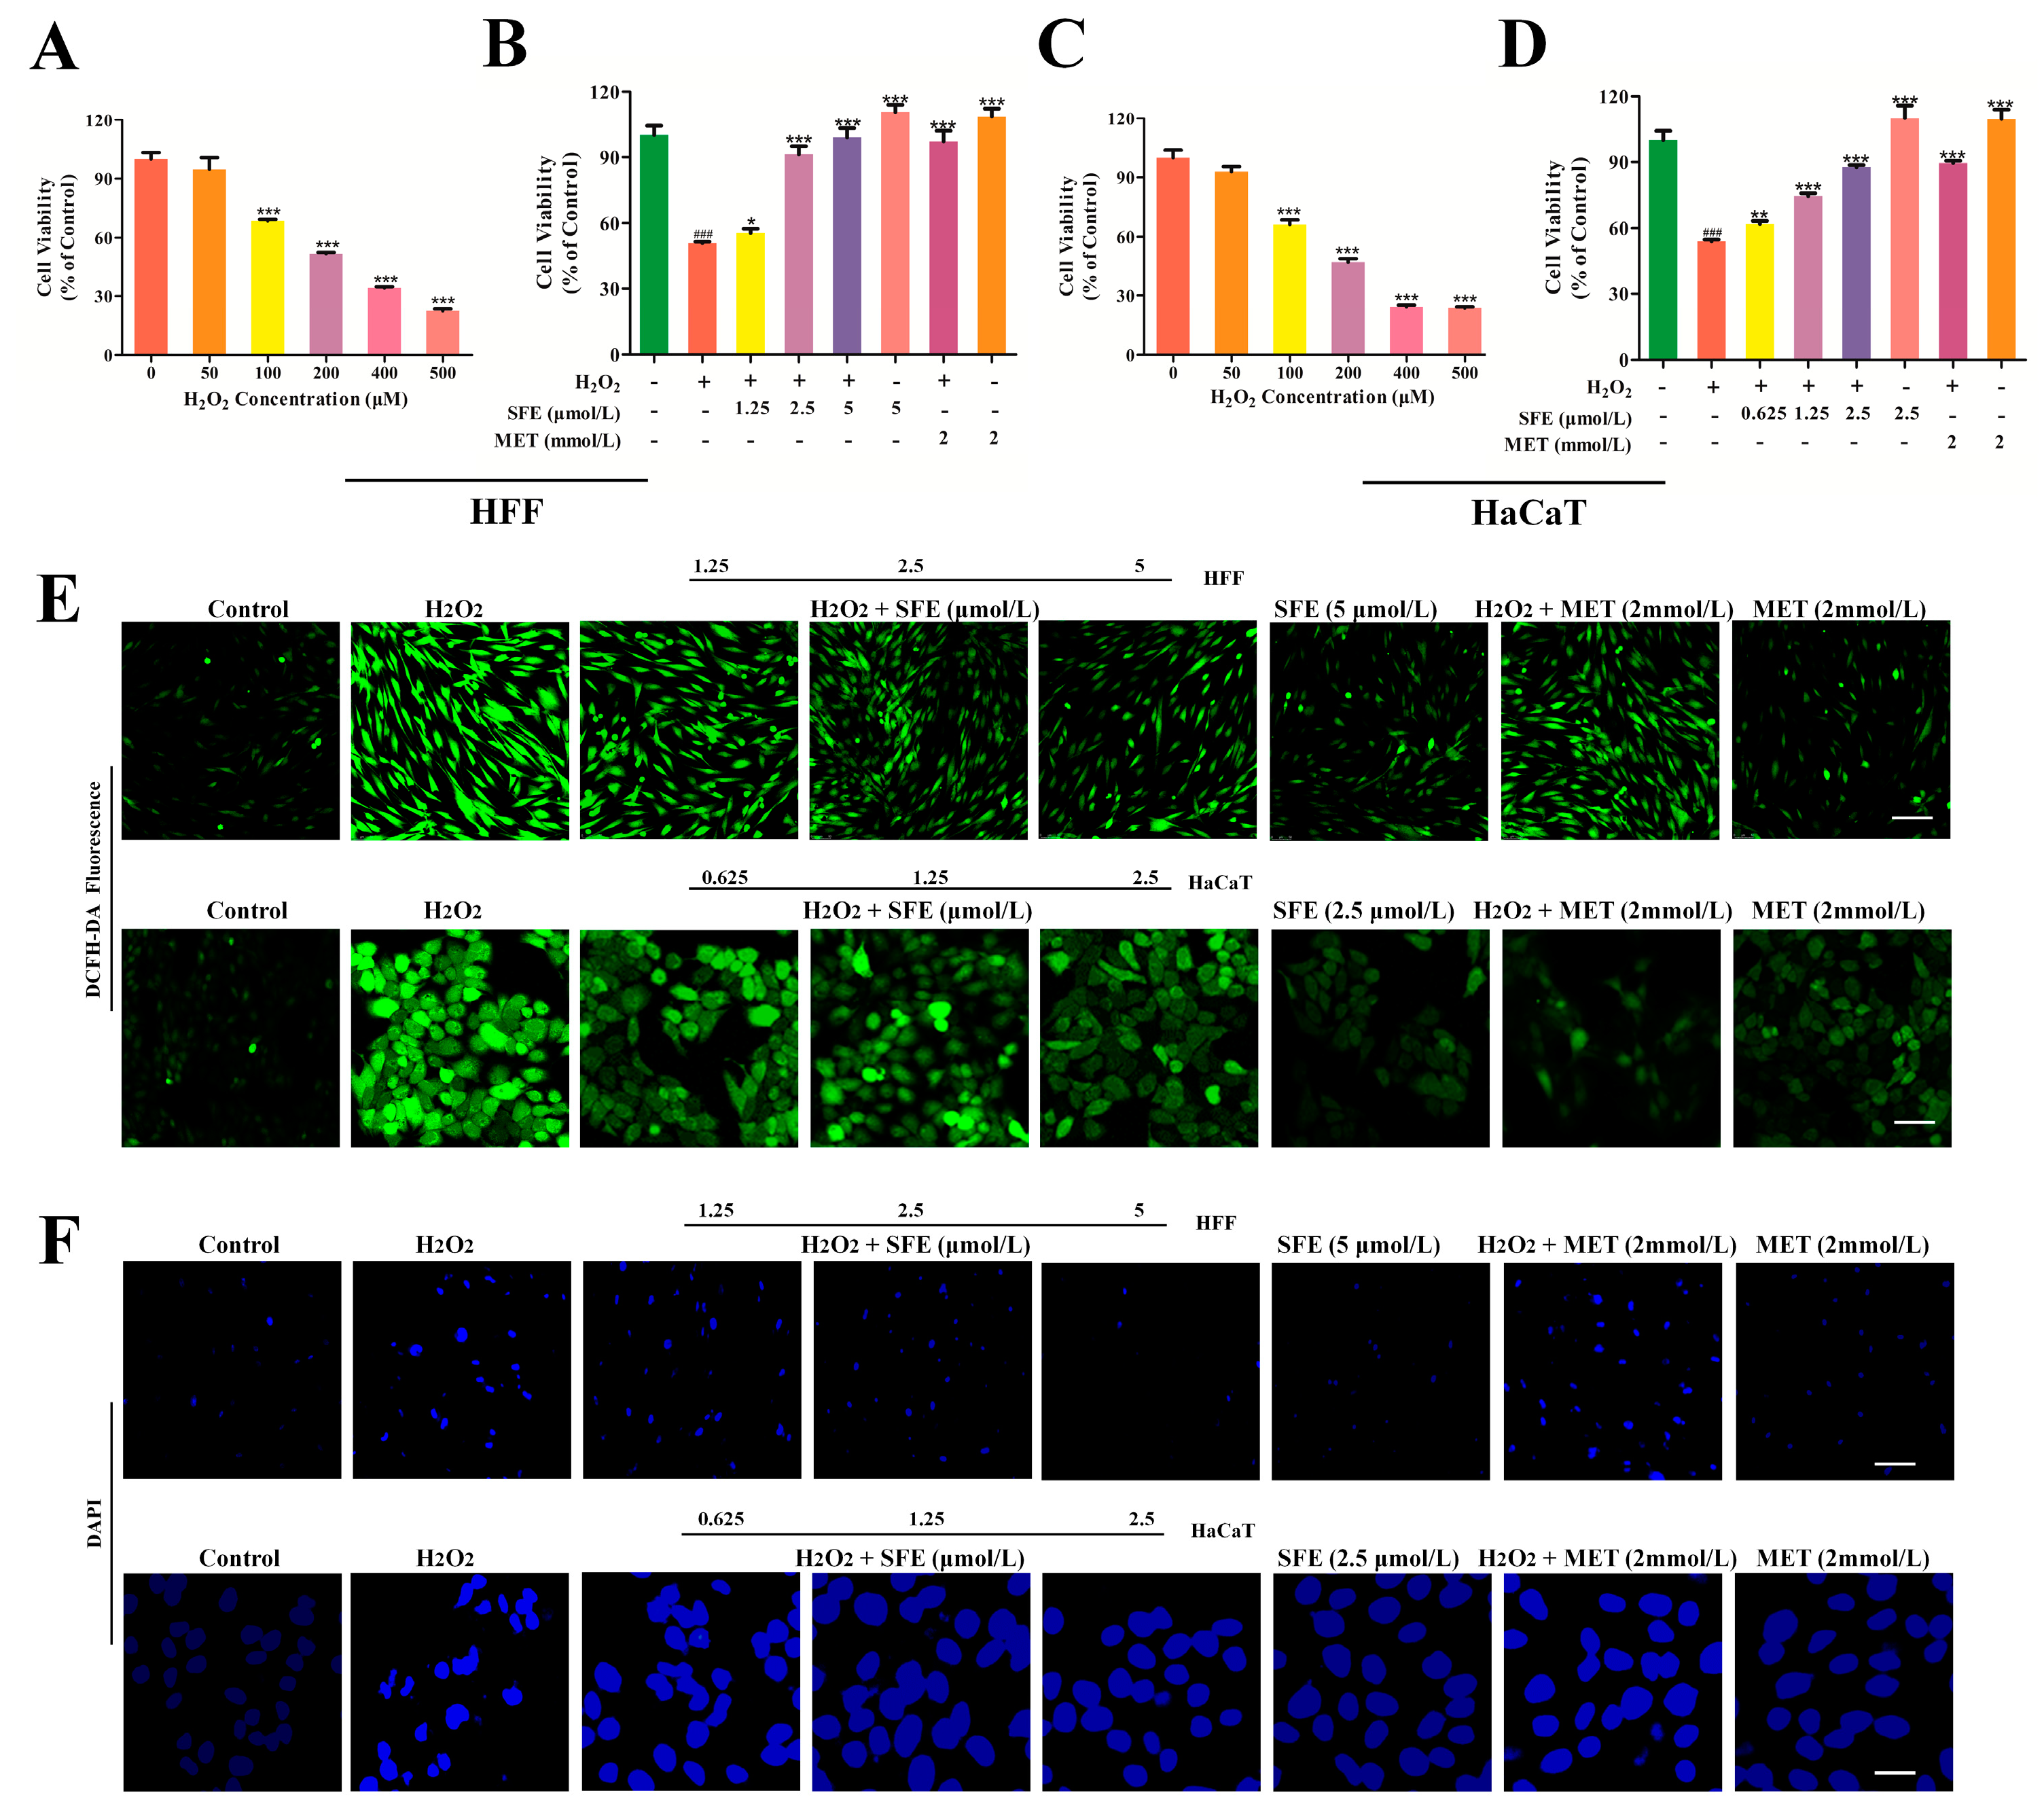
2.1. SFE Promoted Cell Growth and Inhibited ROS Generation
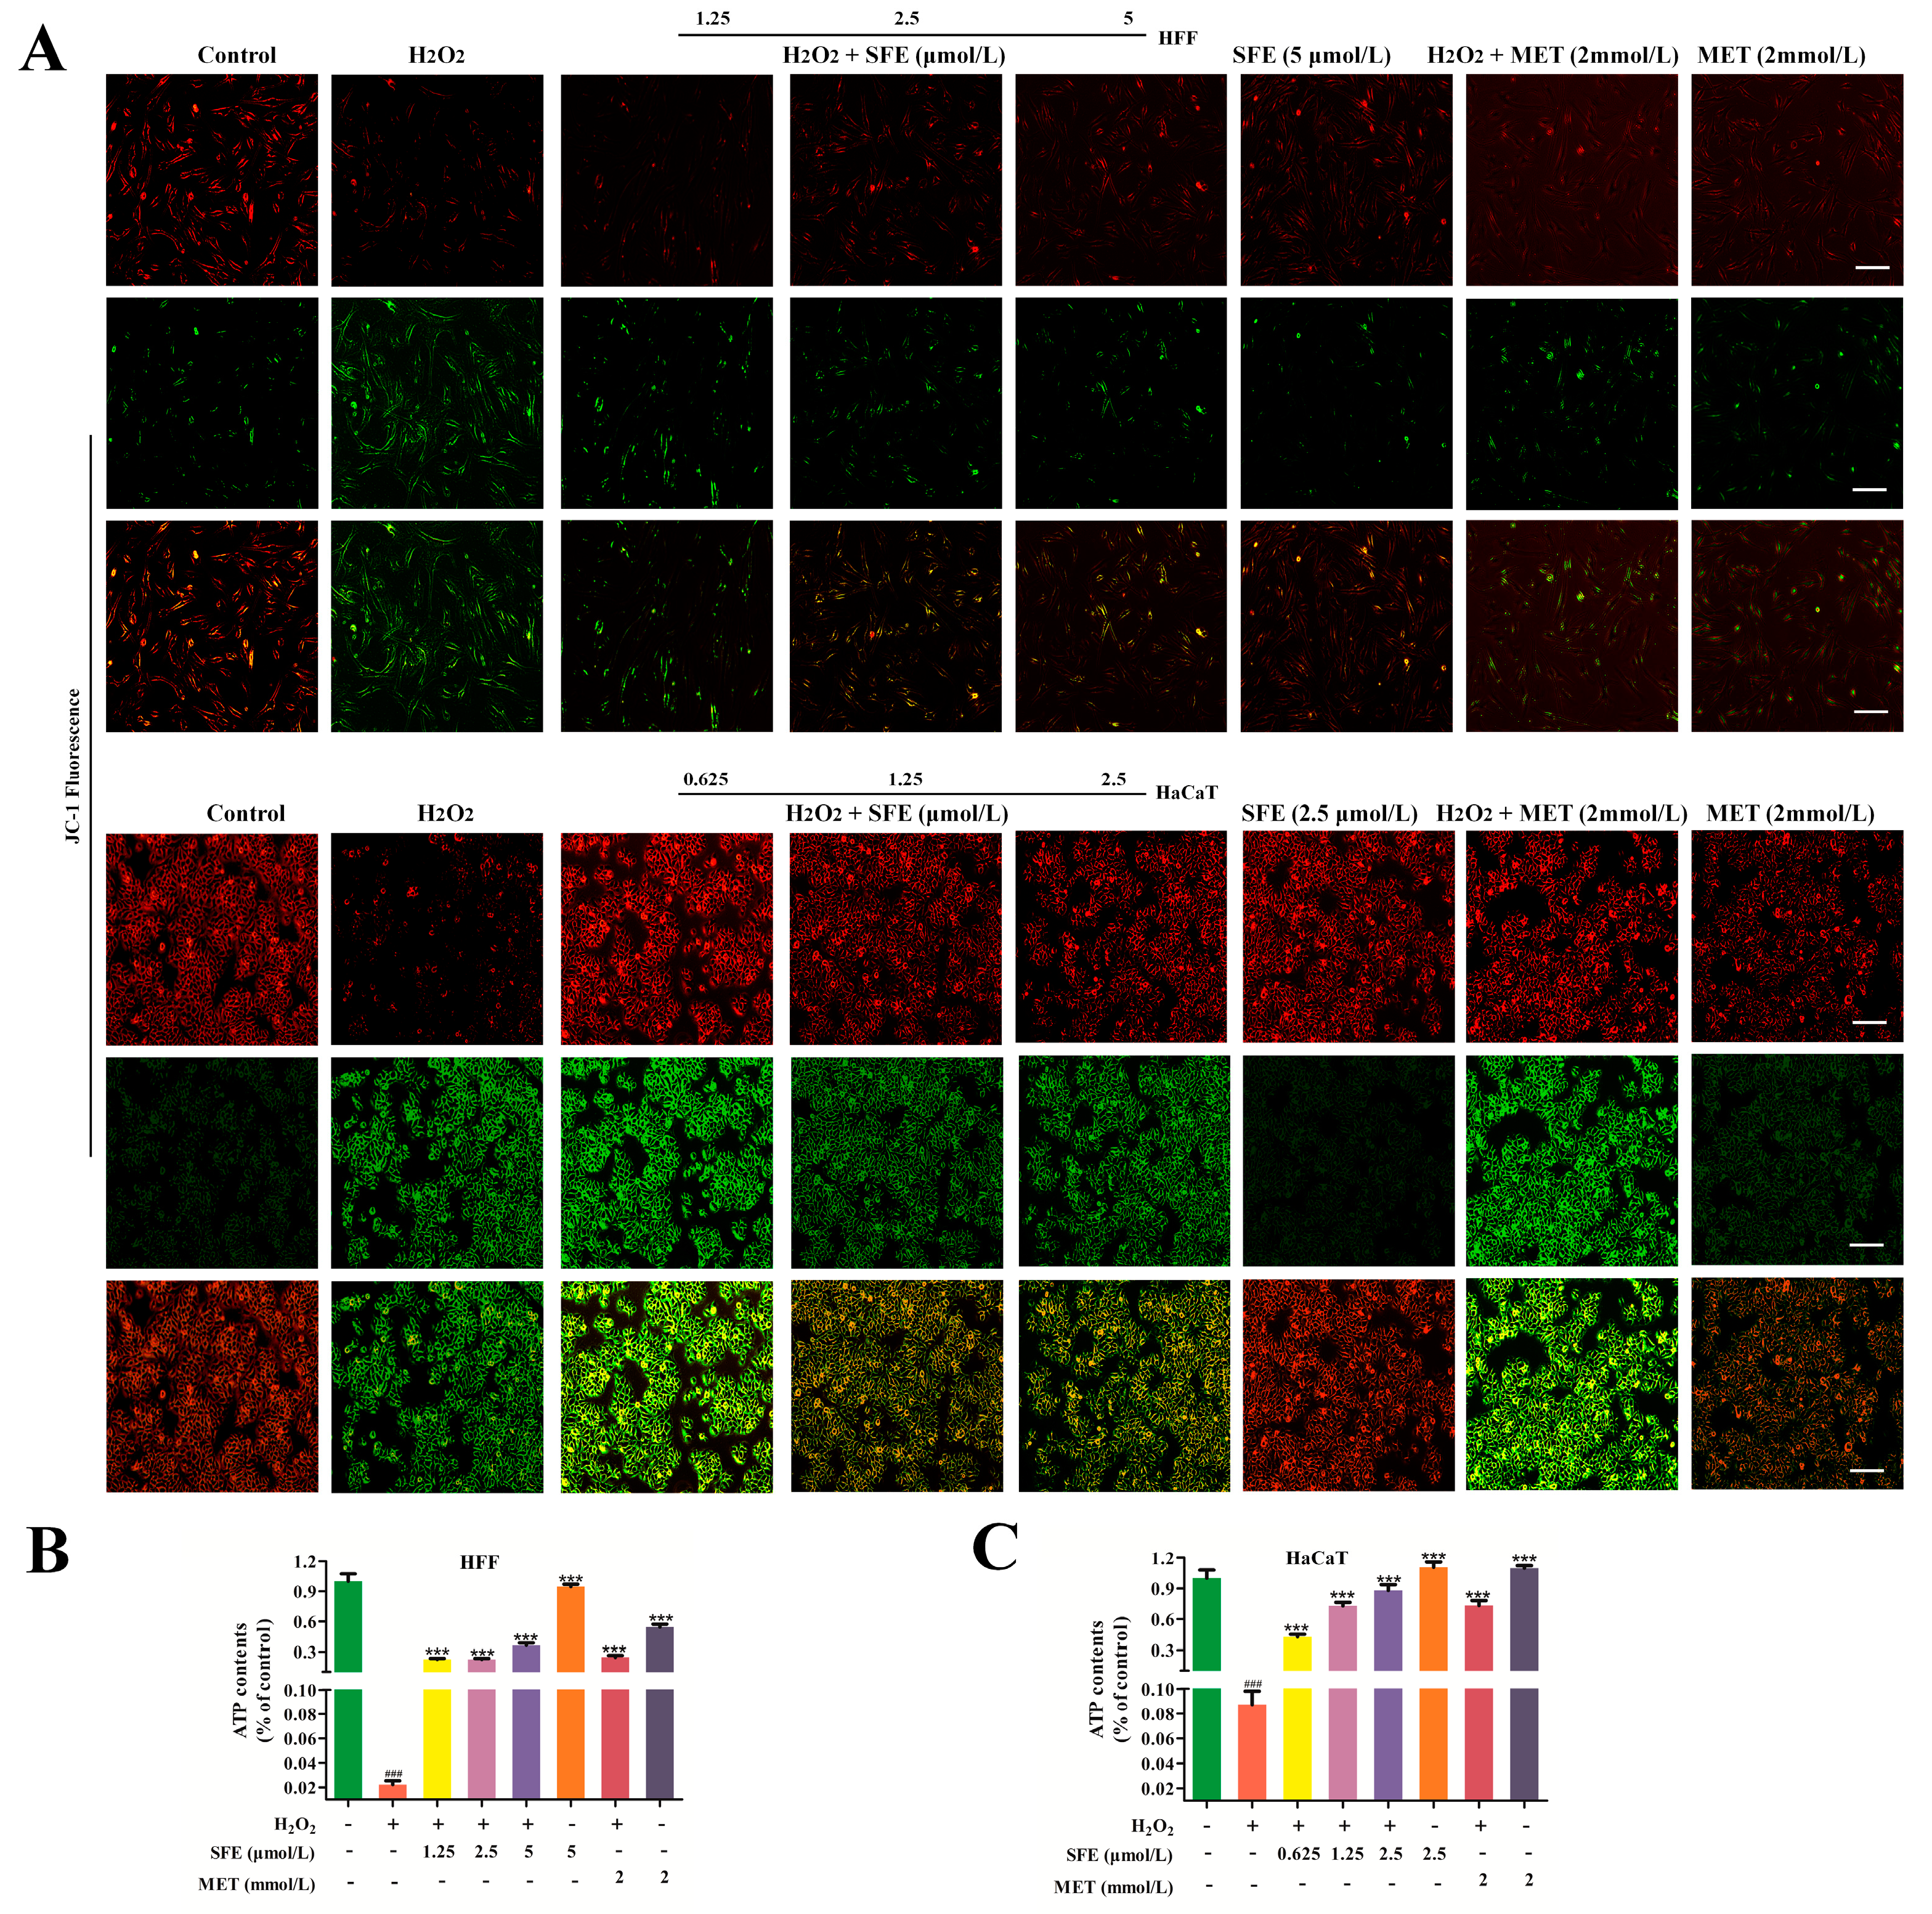
2.2. SFE Alleviated H2O2−Induced Mitochondrial Damage in HFF and HaCaT Cells
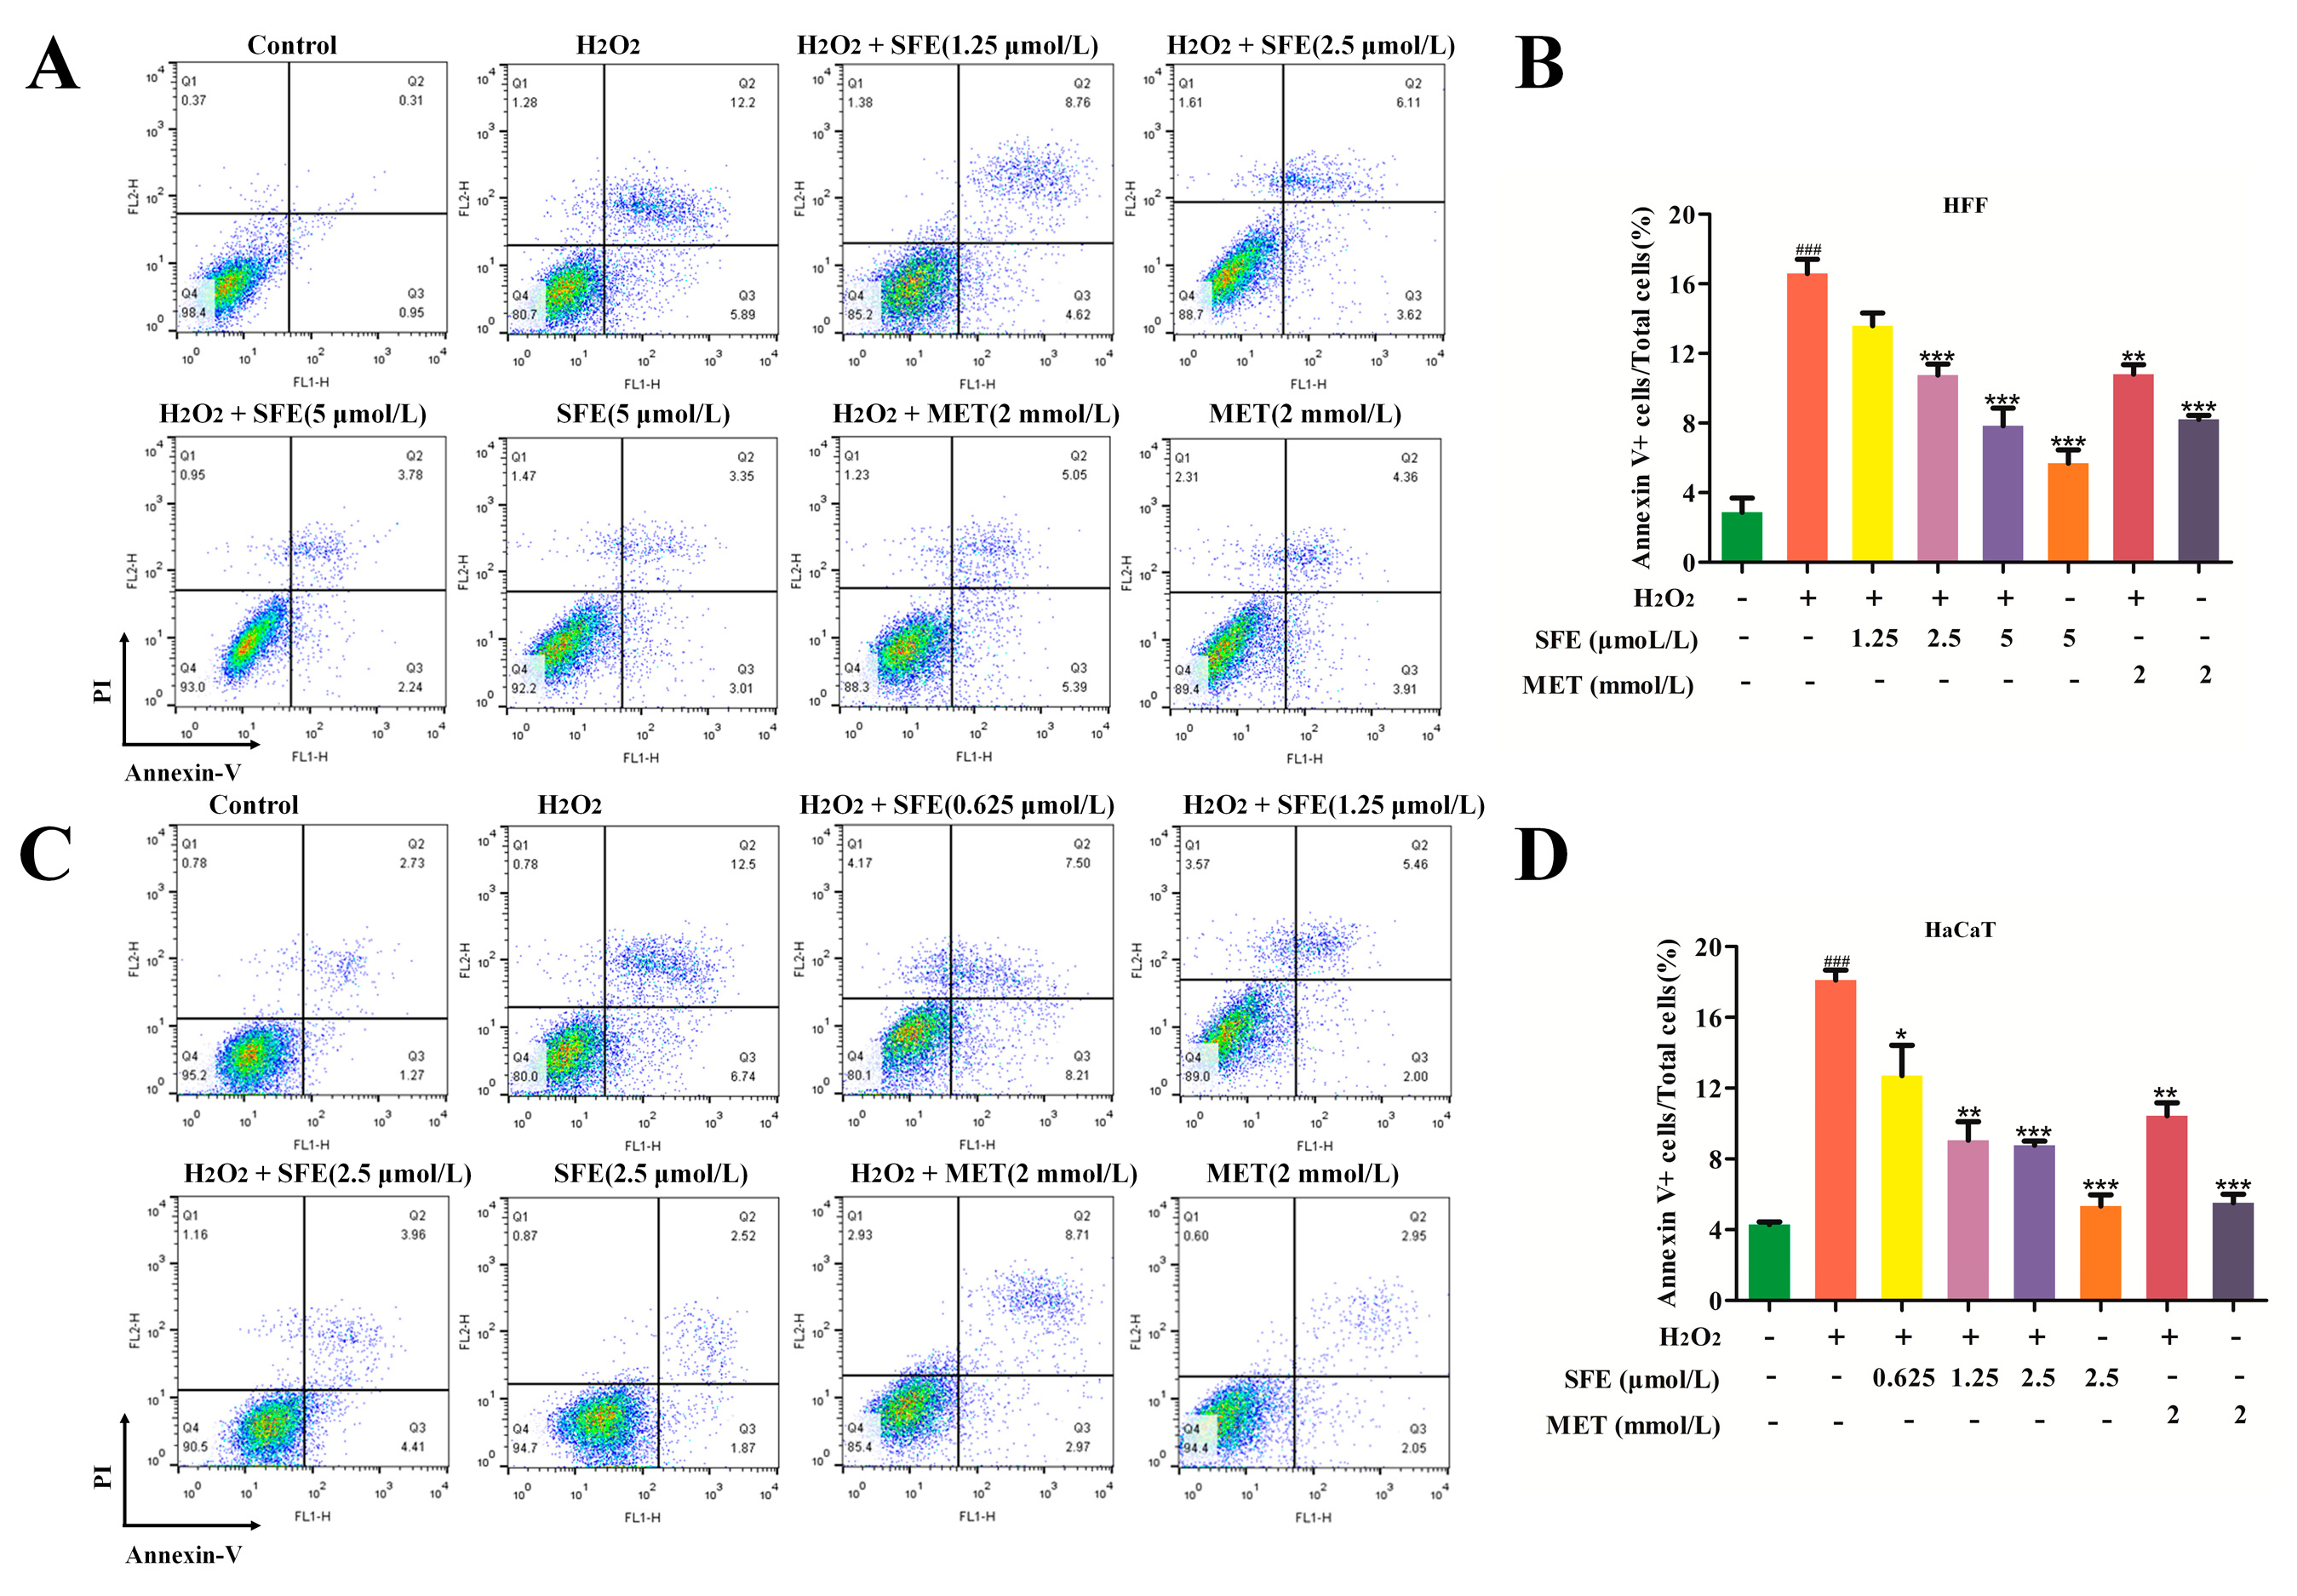
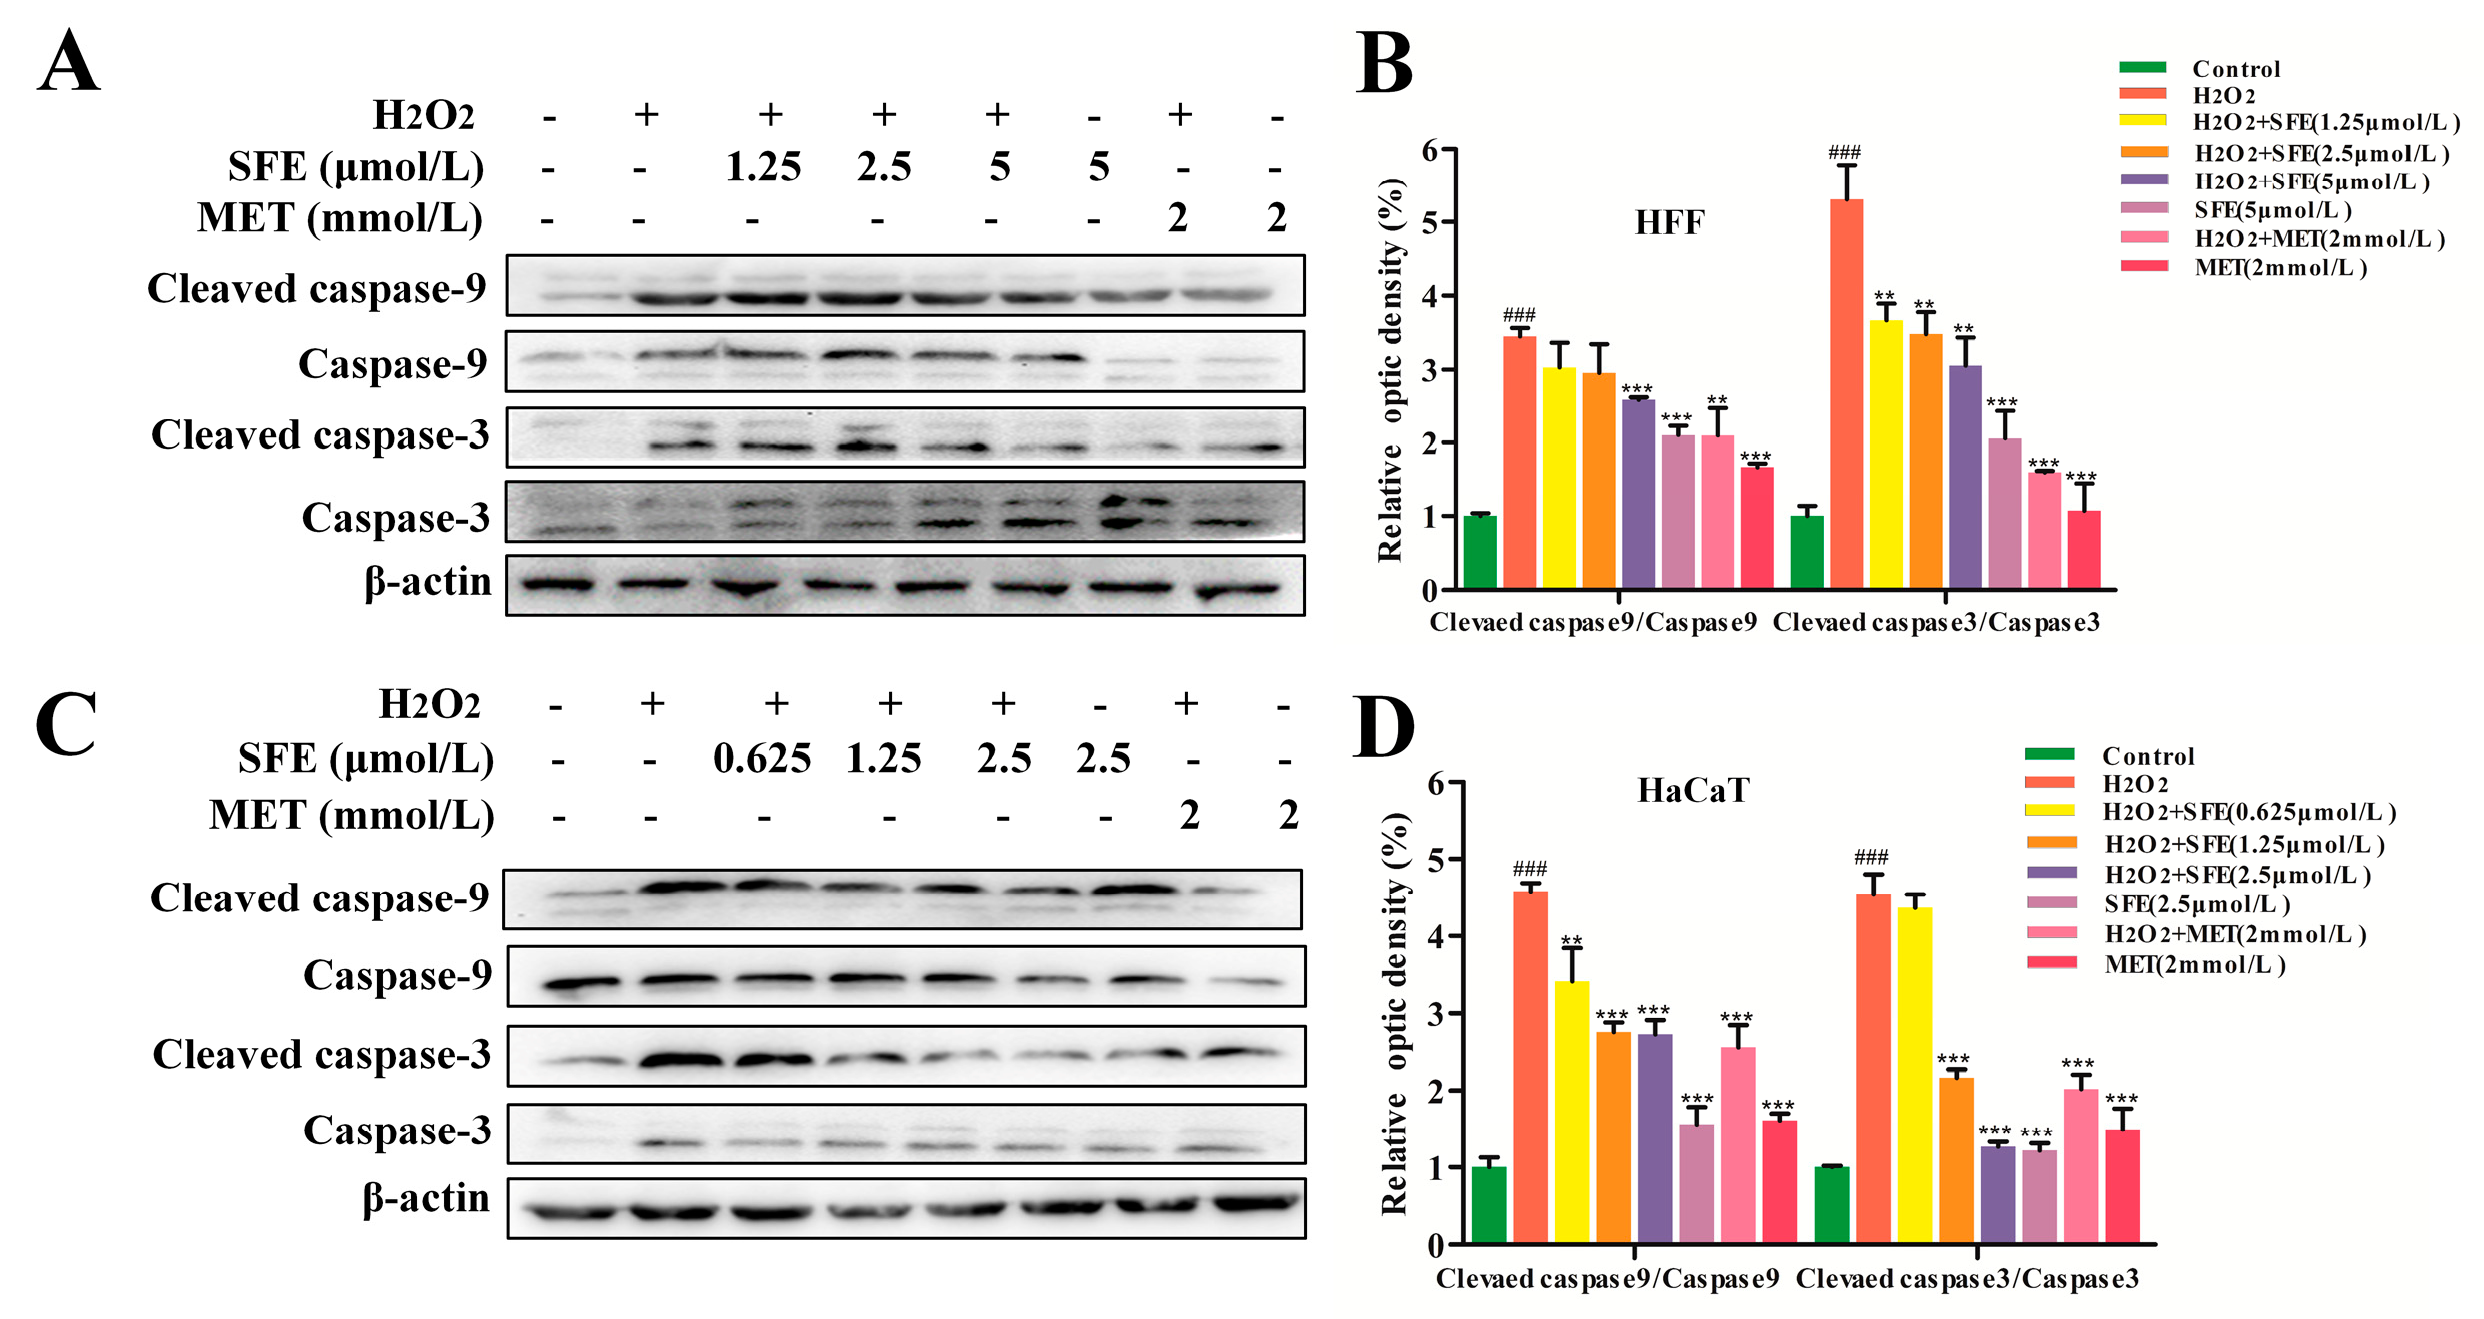
2.3. SFE Attenuated Apoptosis in H2O2−Treated HFF and HaCaT Cells
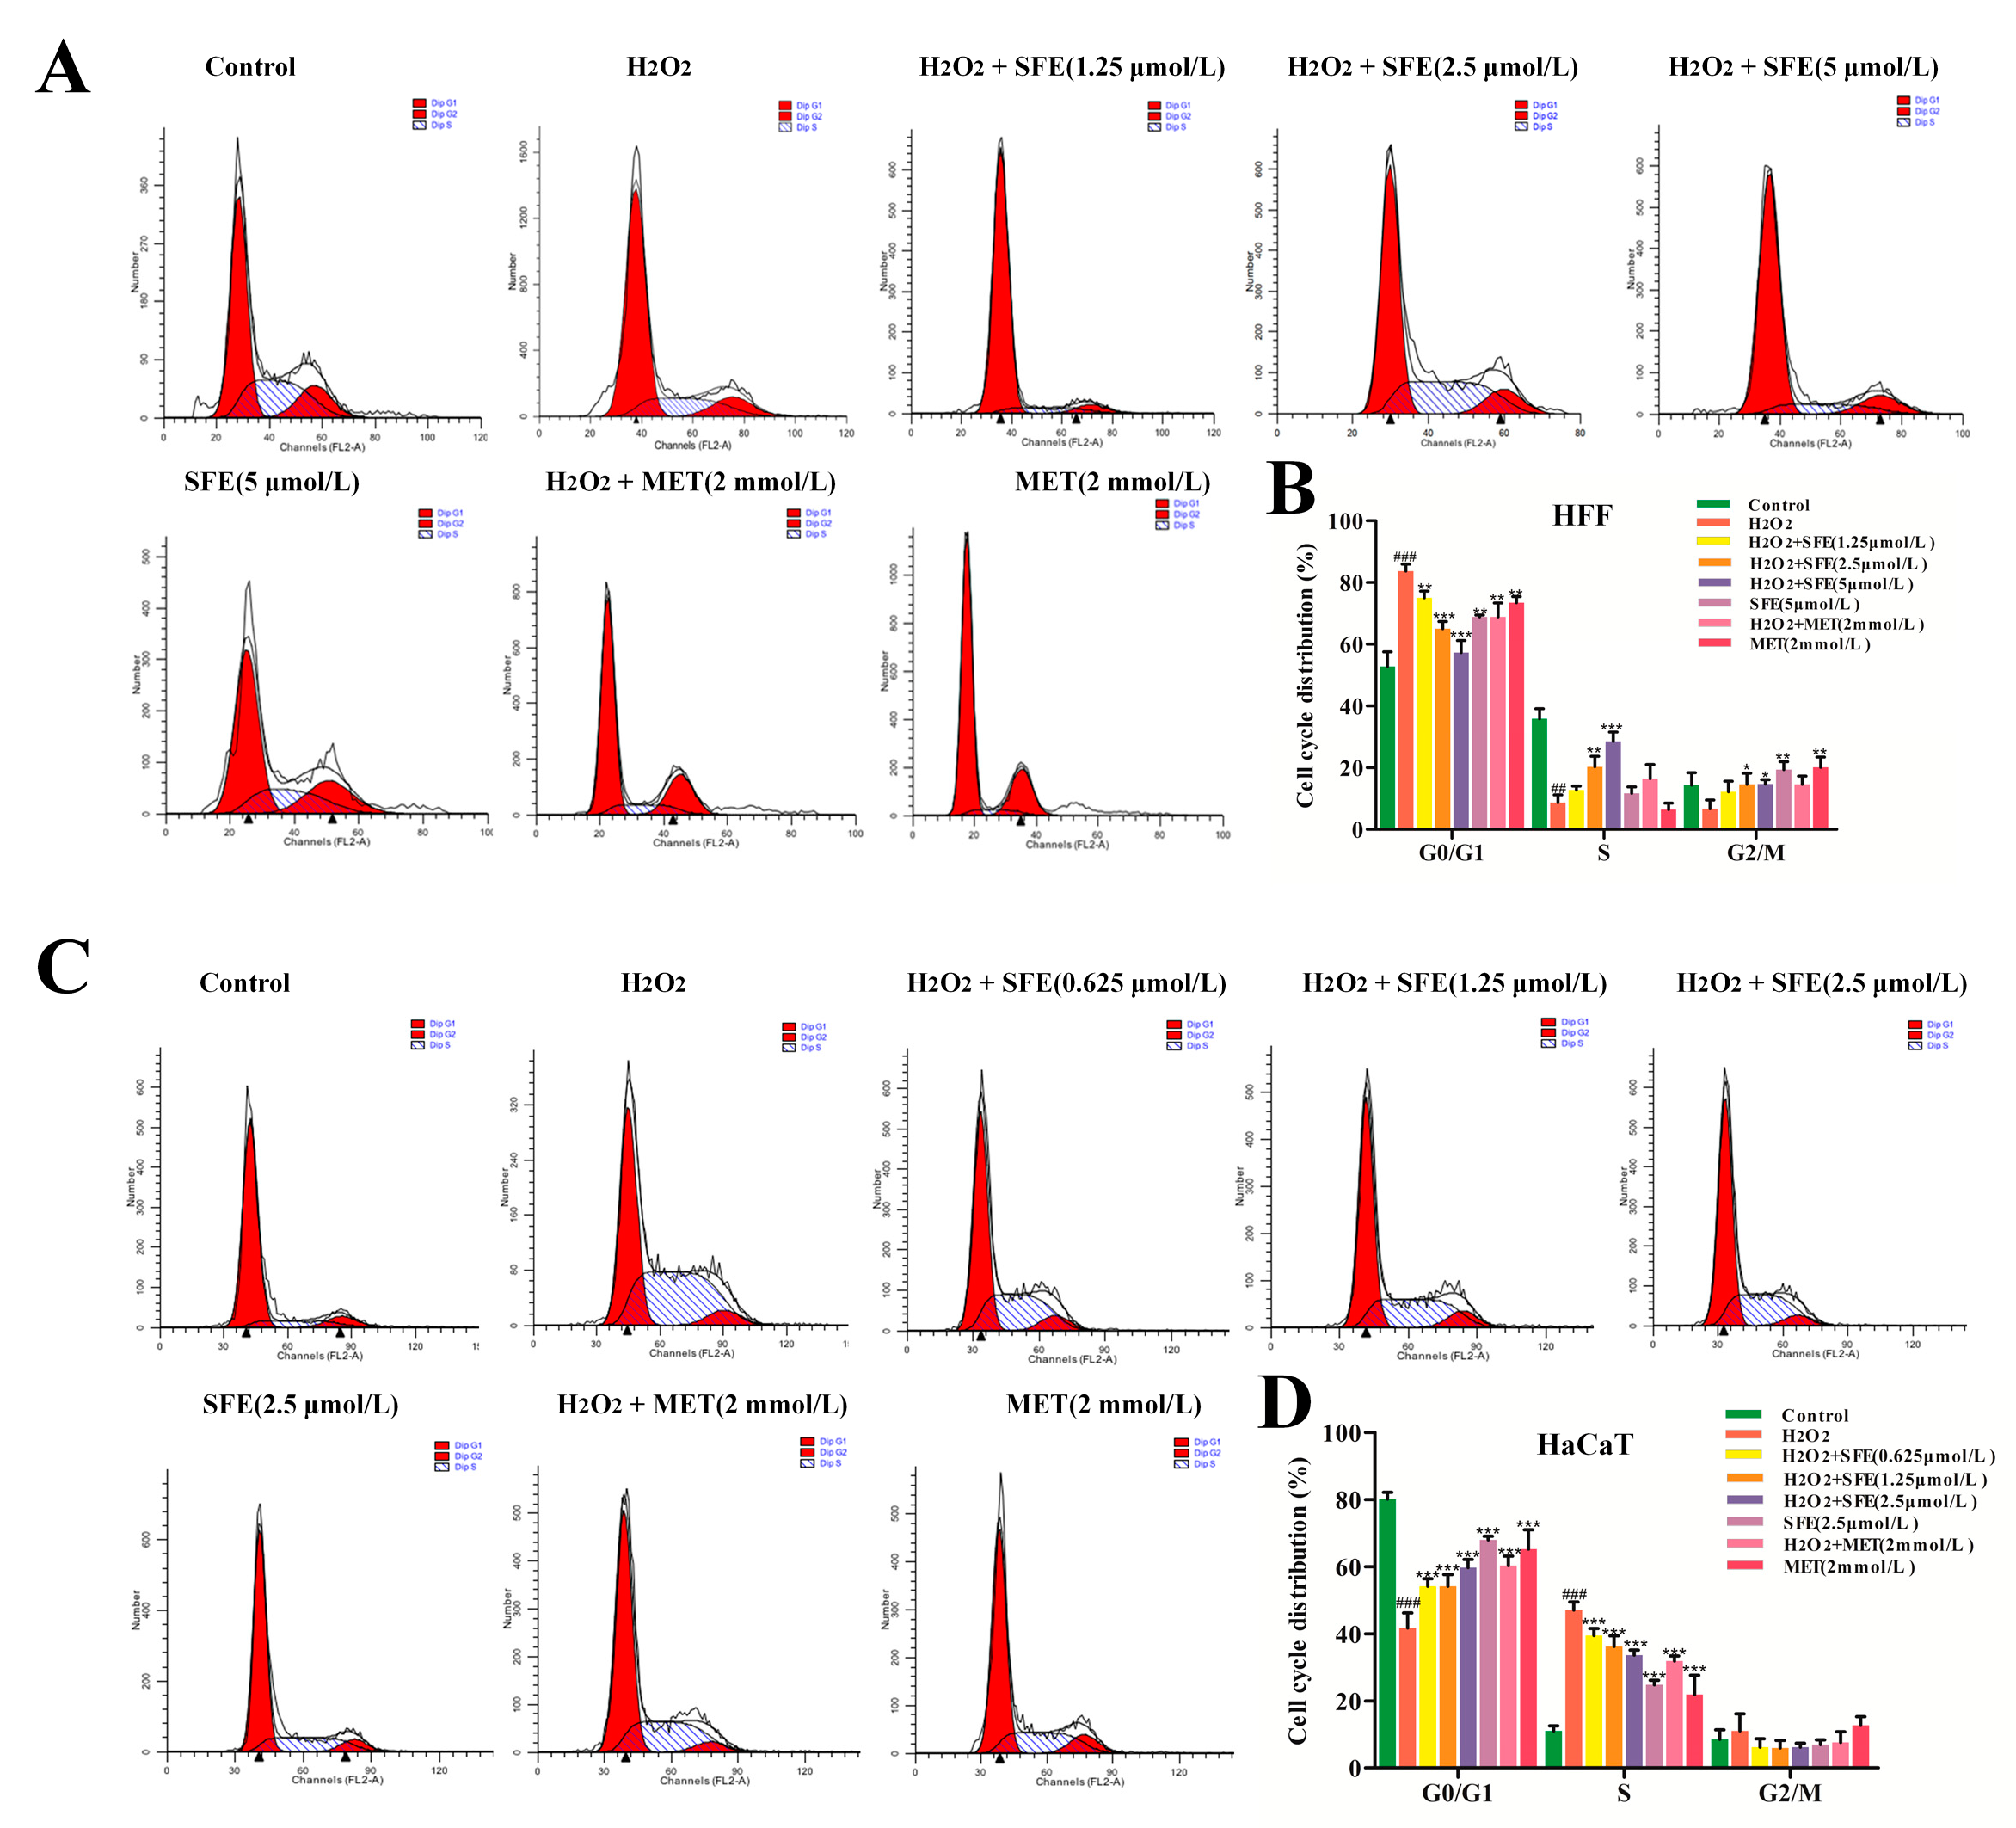
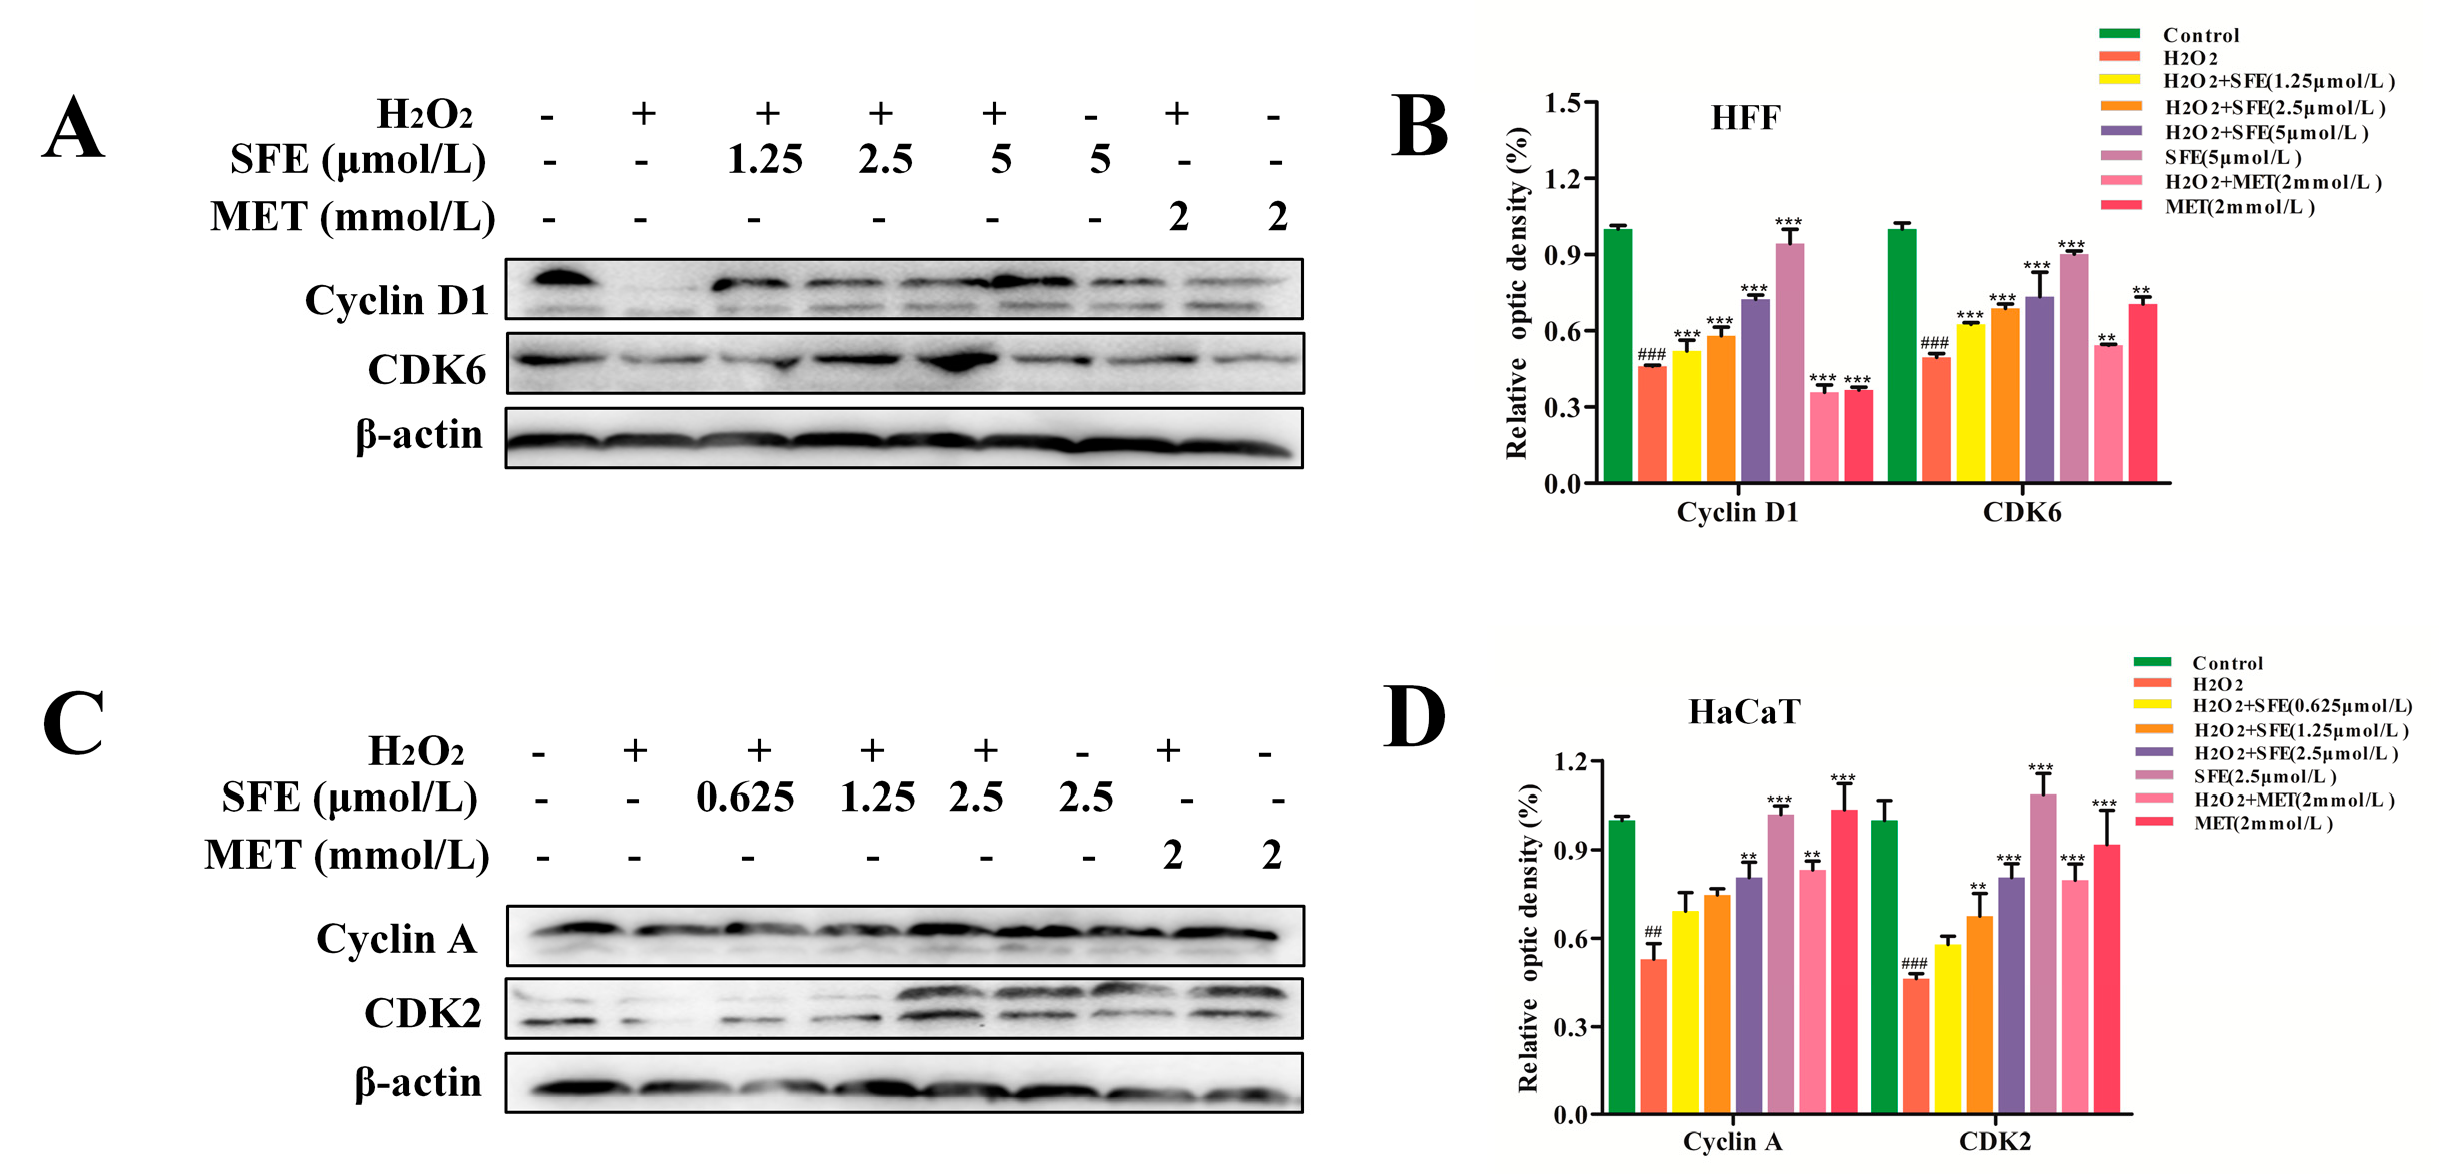
2.4. Effect of SFE on the Cell Cycle in HFF and HaCaT Cells with H2O2−Induced Damage
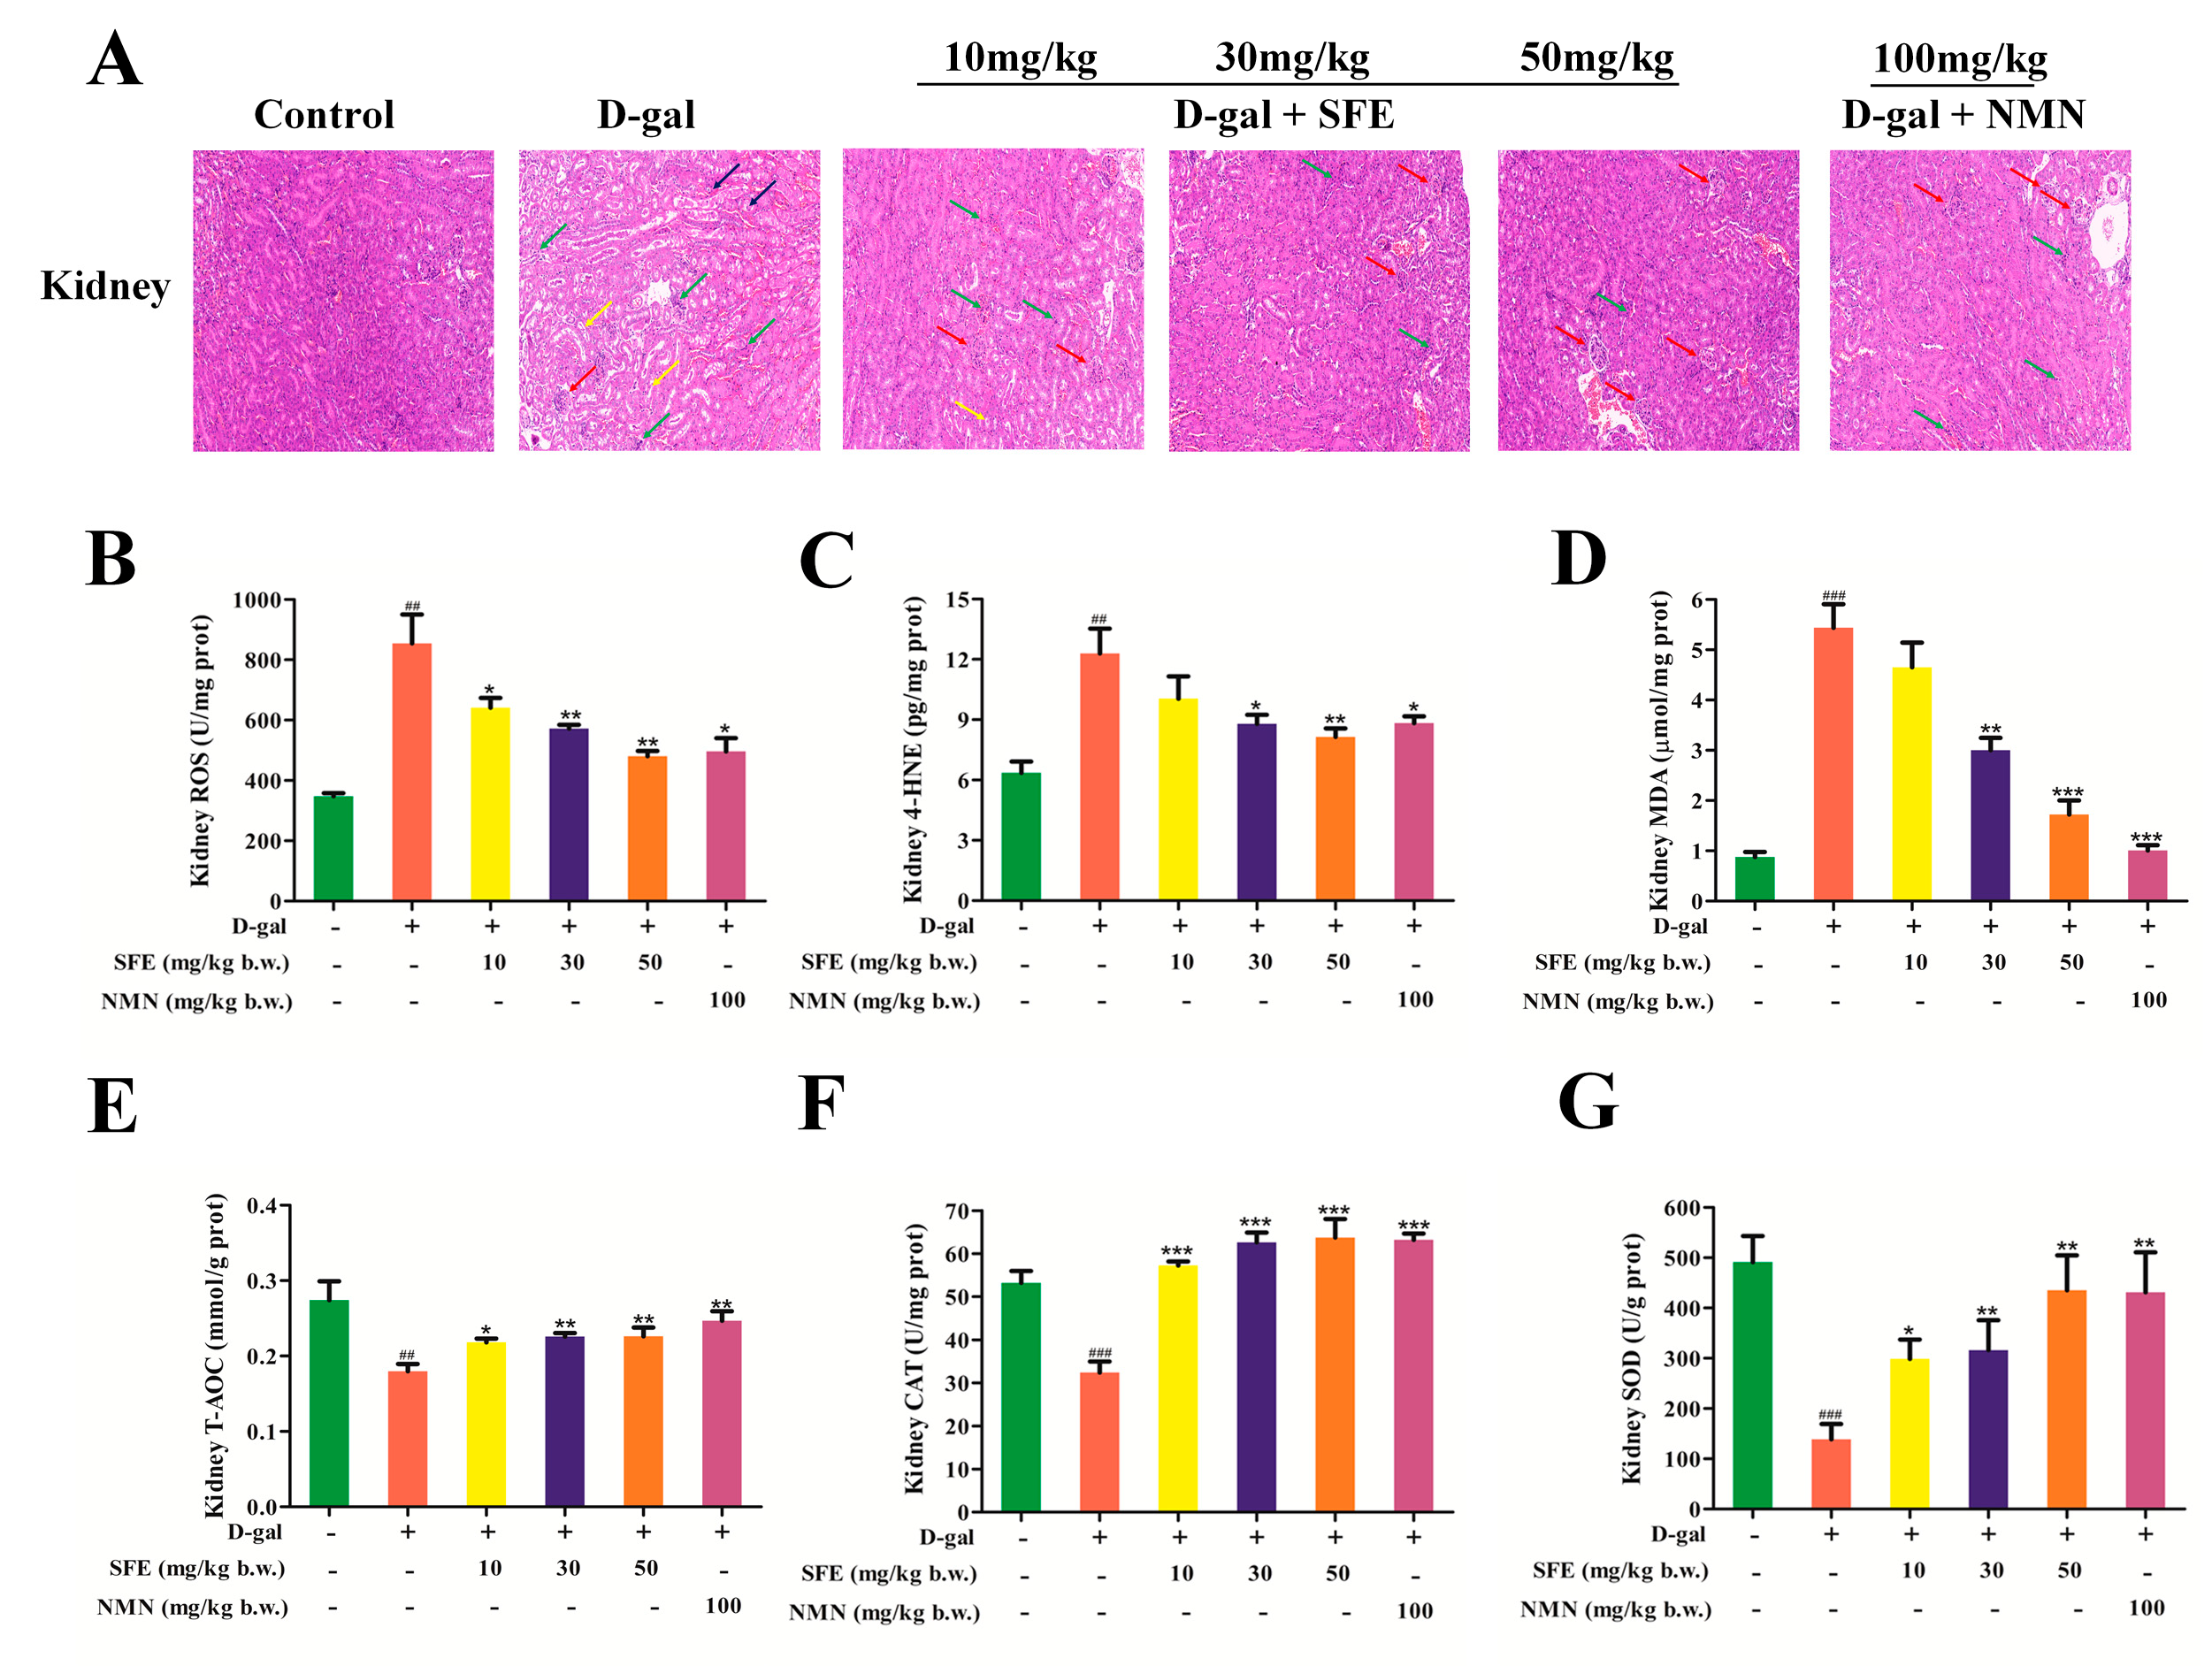
2.5. Effect of SFE on D−Galactose (D−gal)−Induced Kidney Injury in Mice
2.6. SFE Ameliorated D−gal−Induced Oxidative Kidney Damage in Mice
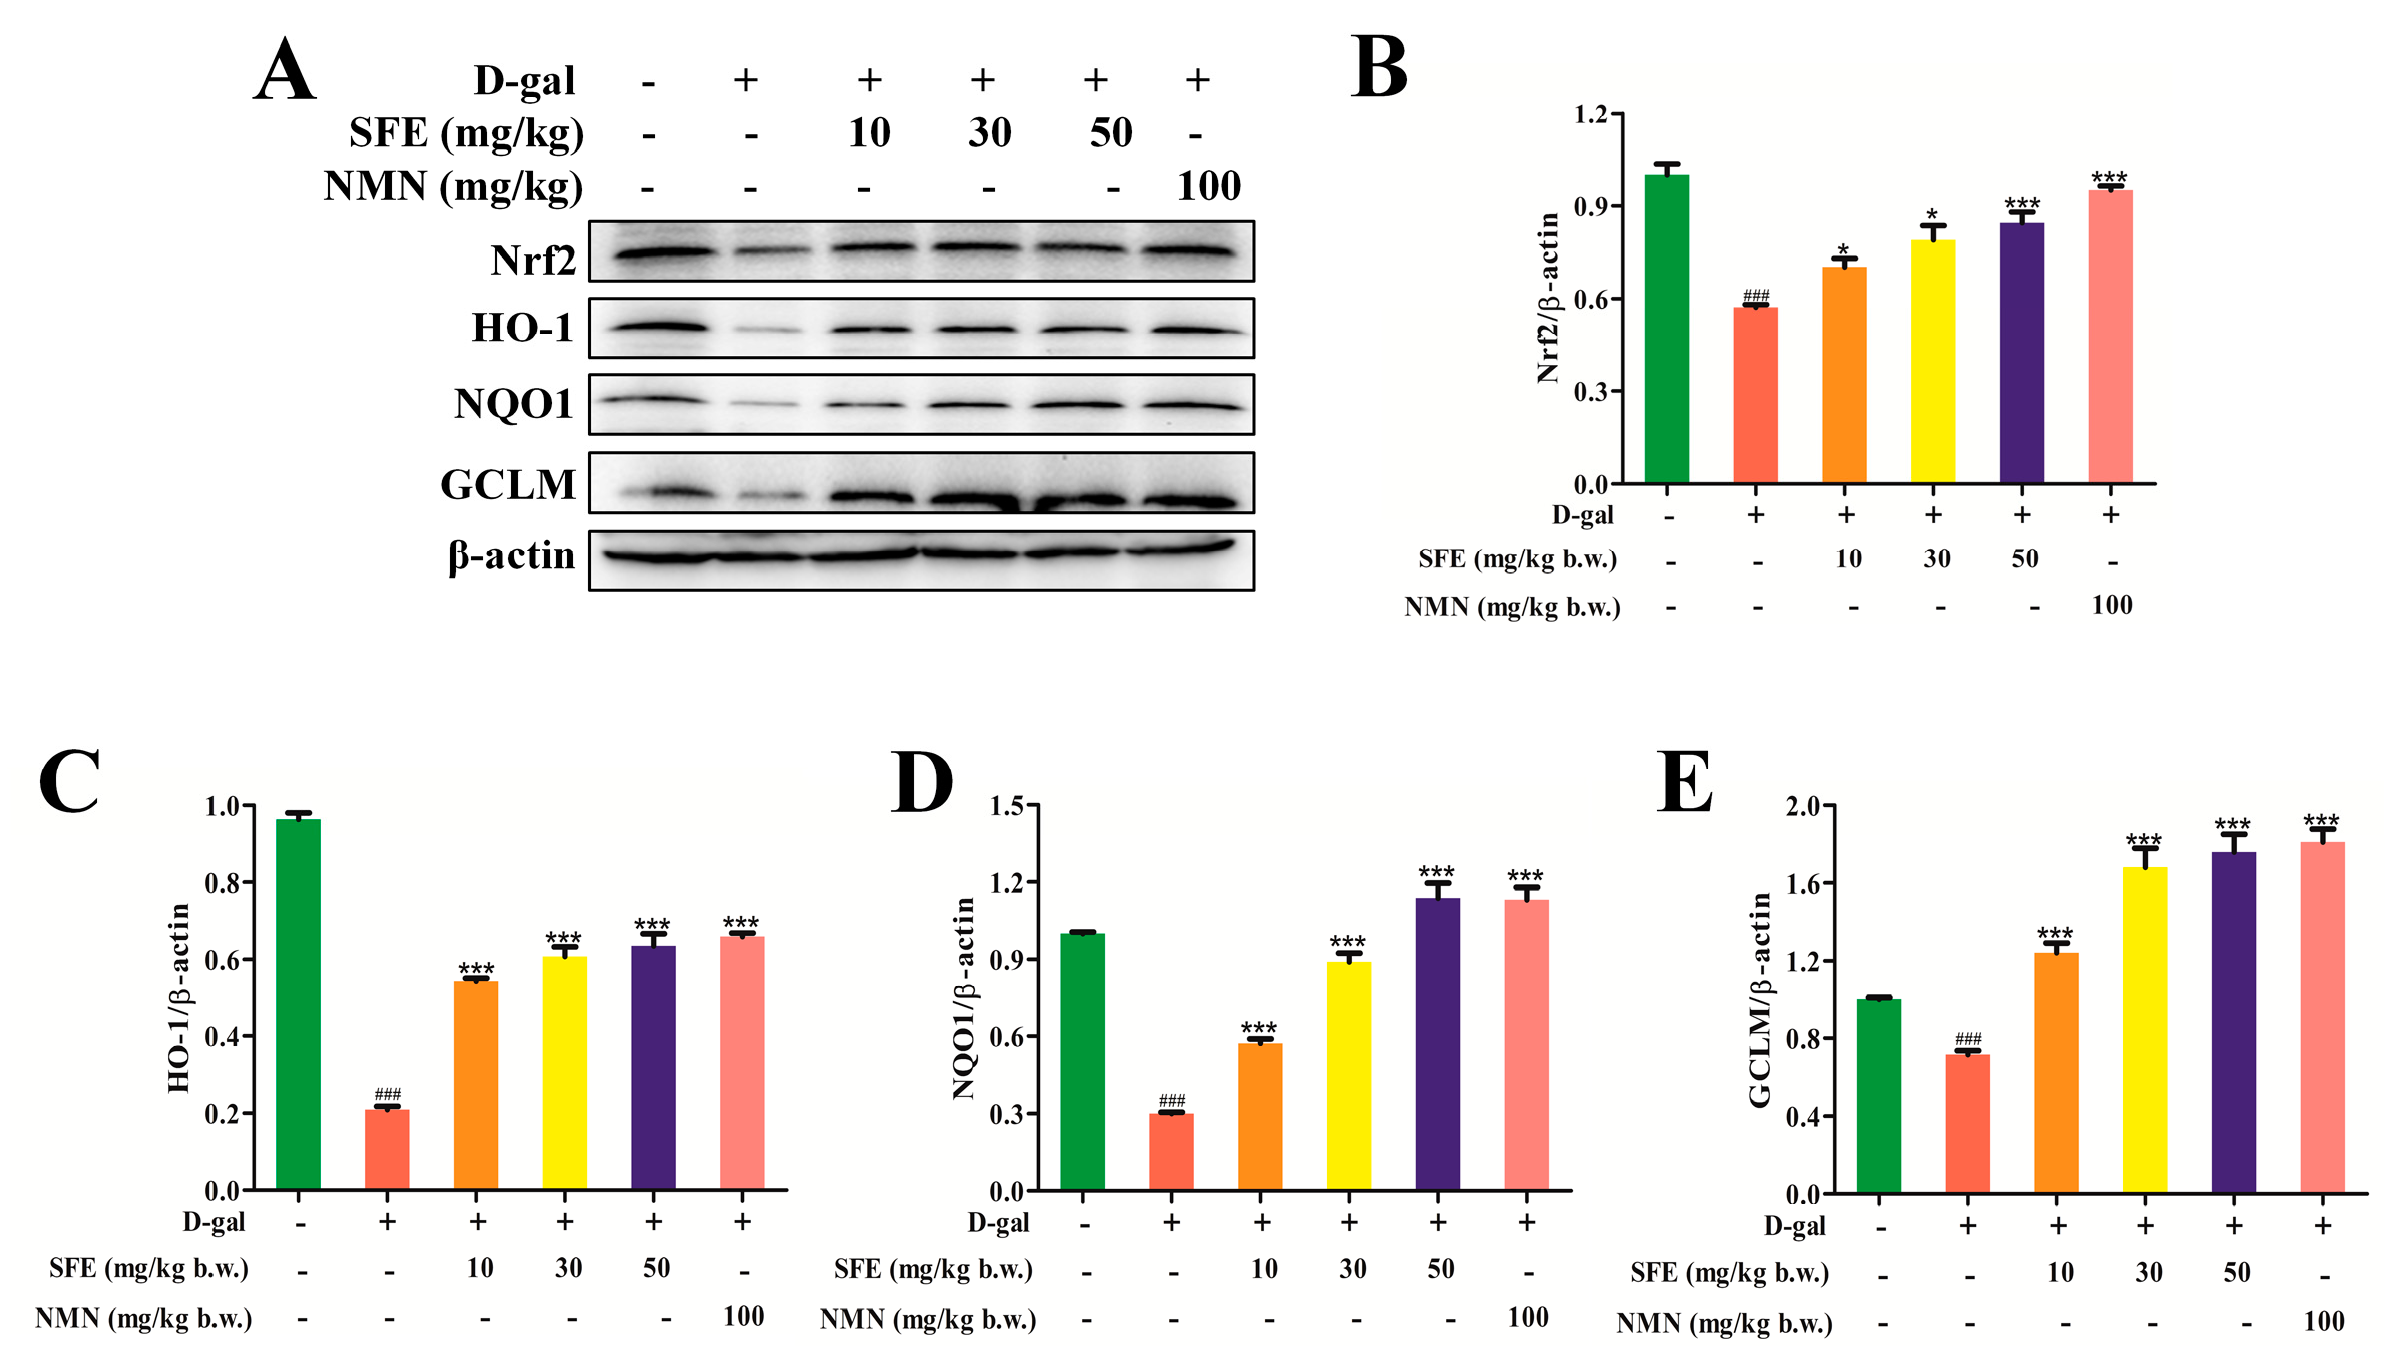
2.7. SFE Enhanced the Antioxidant Capacity of the Kidney by Activating the Nrt2–ARE Signal Pathway
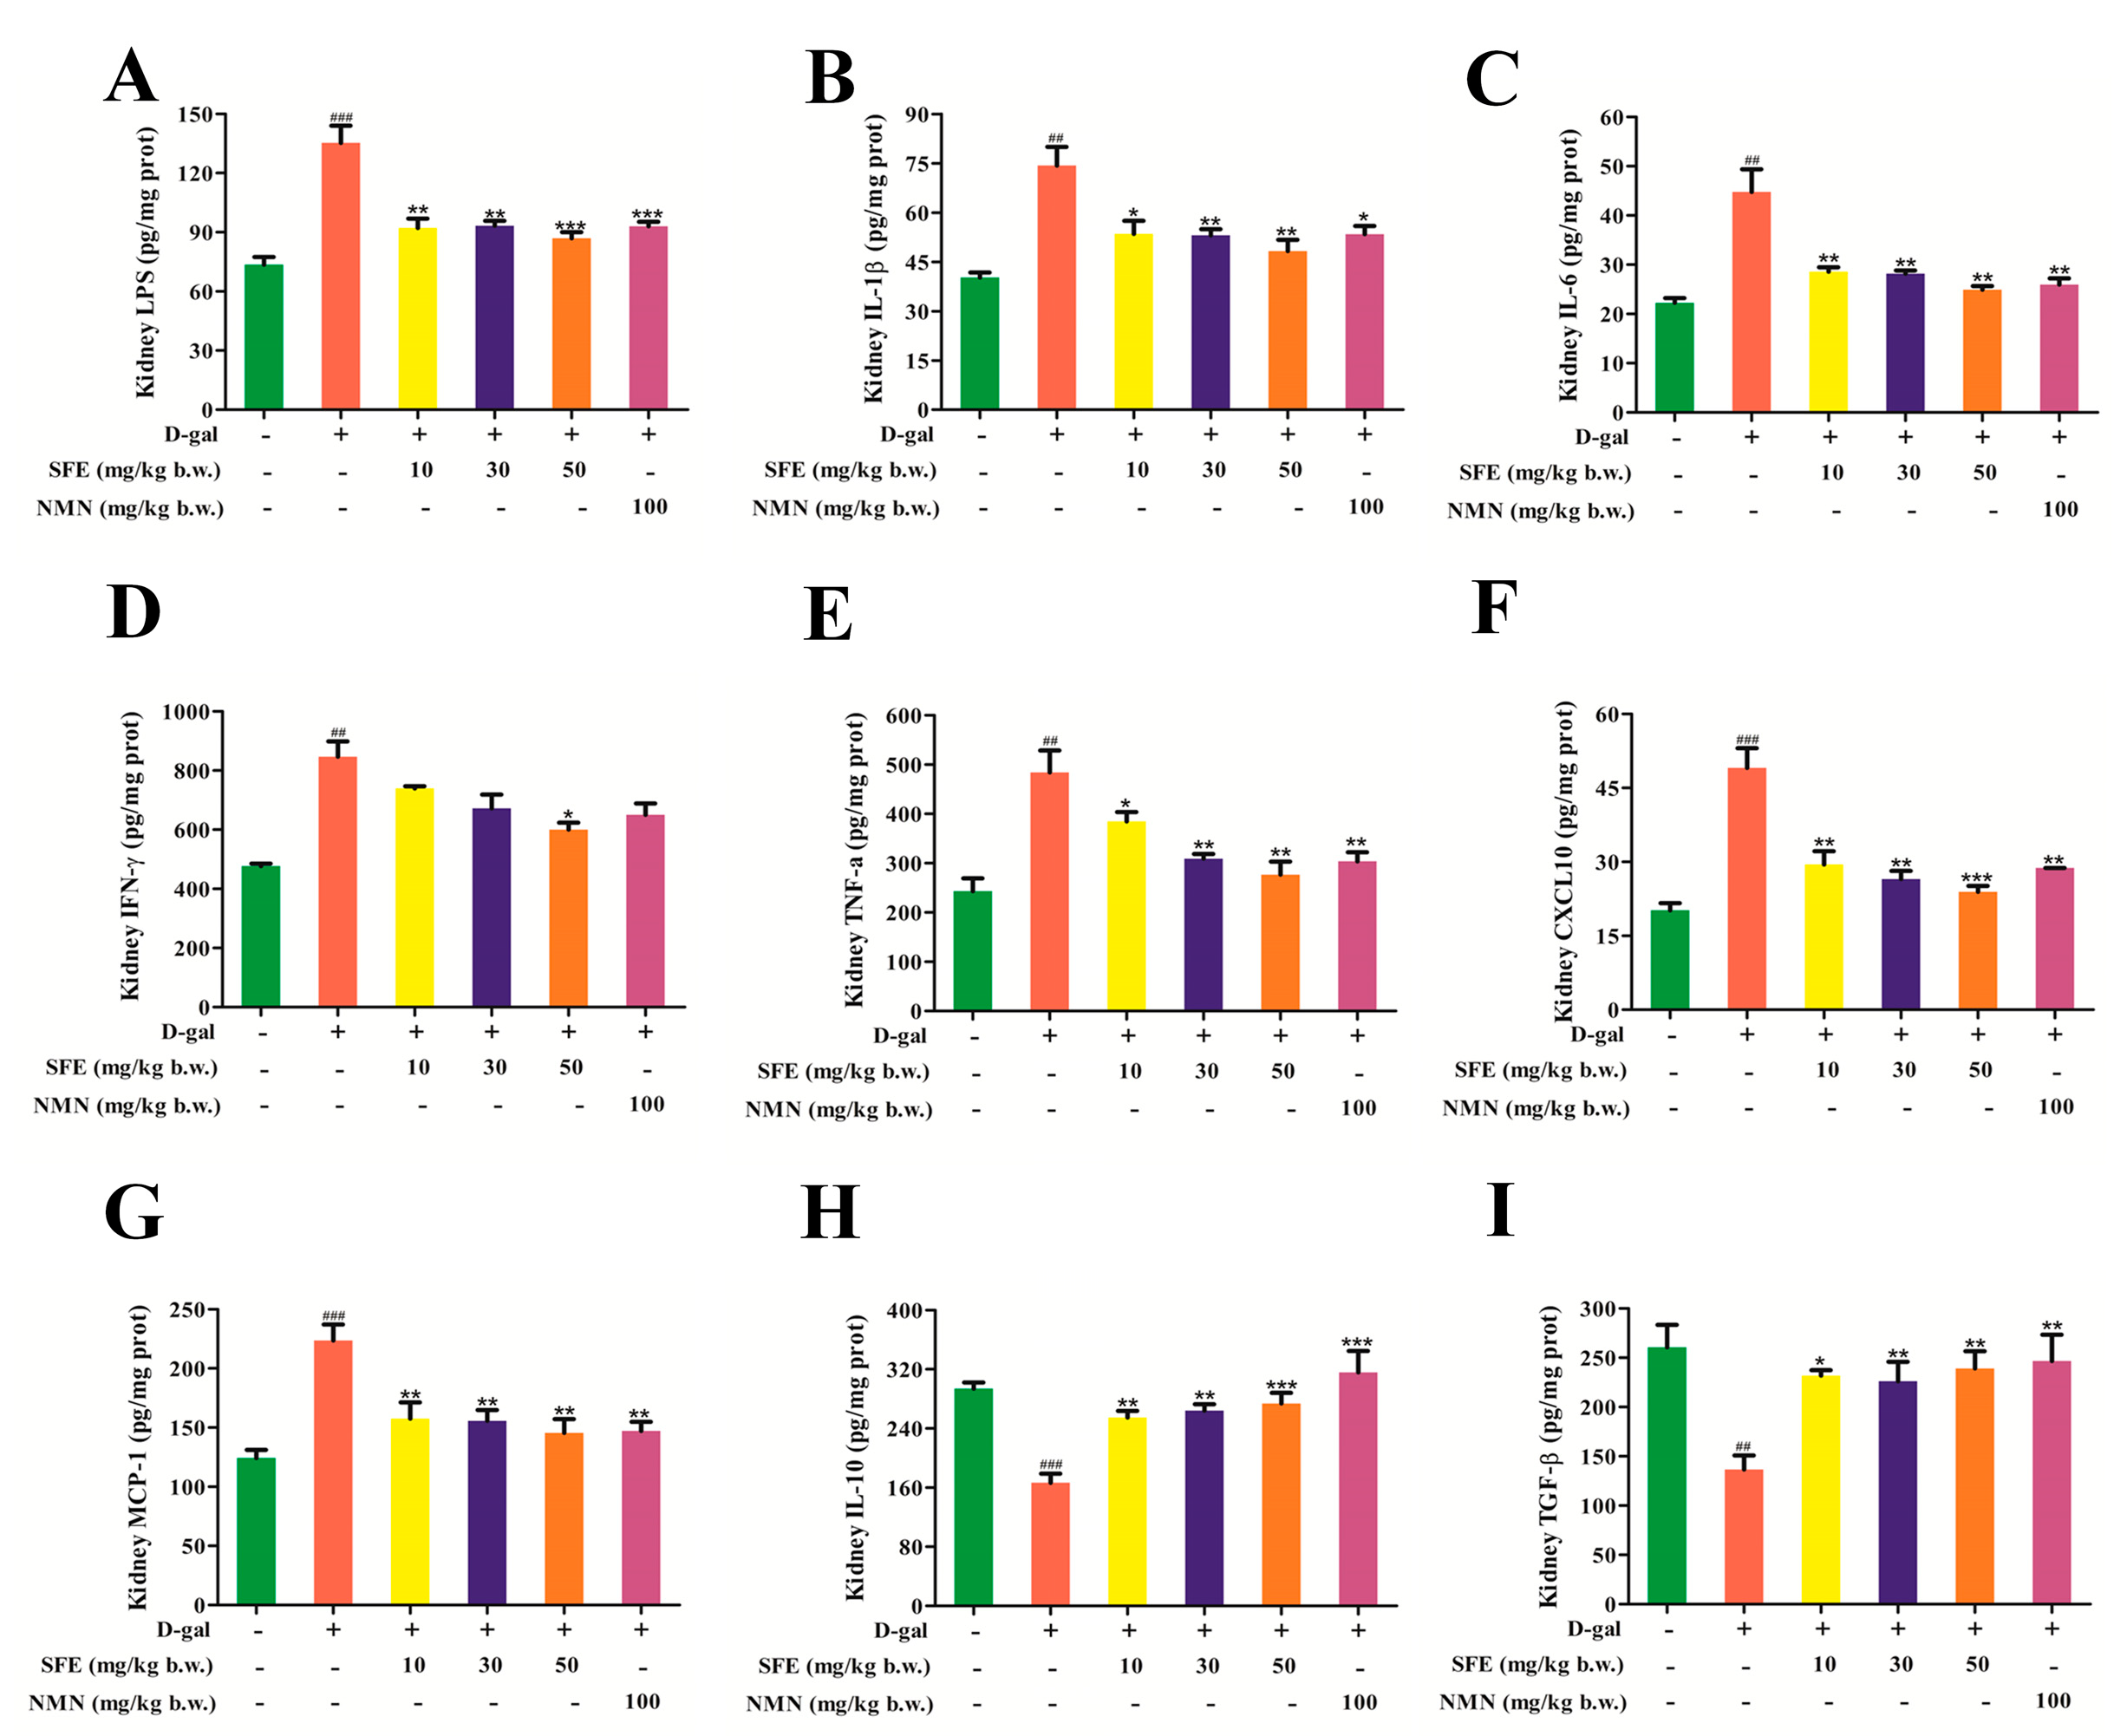
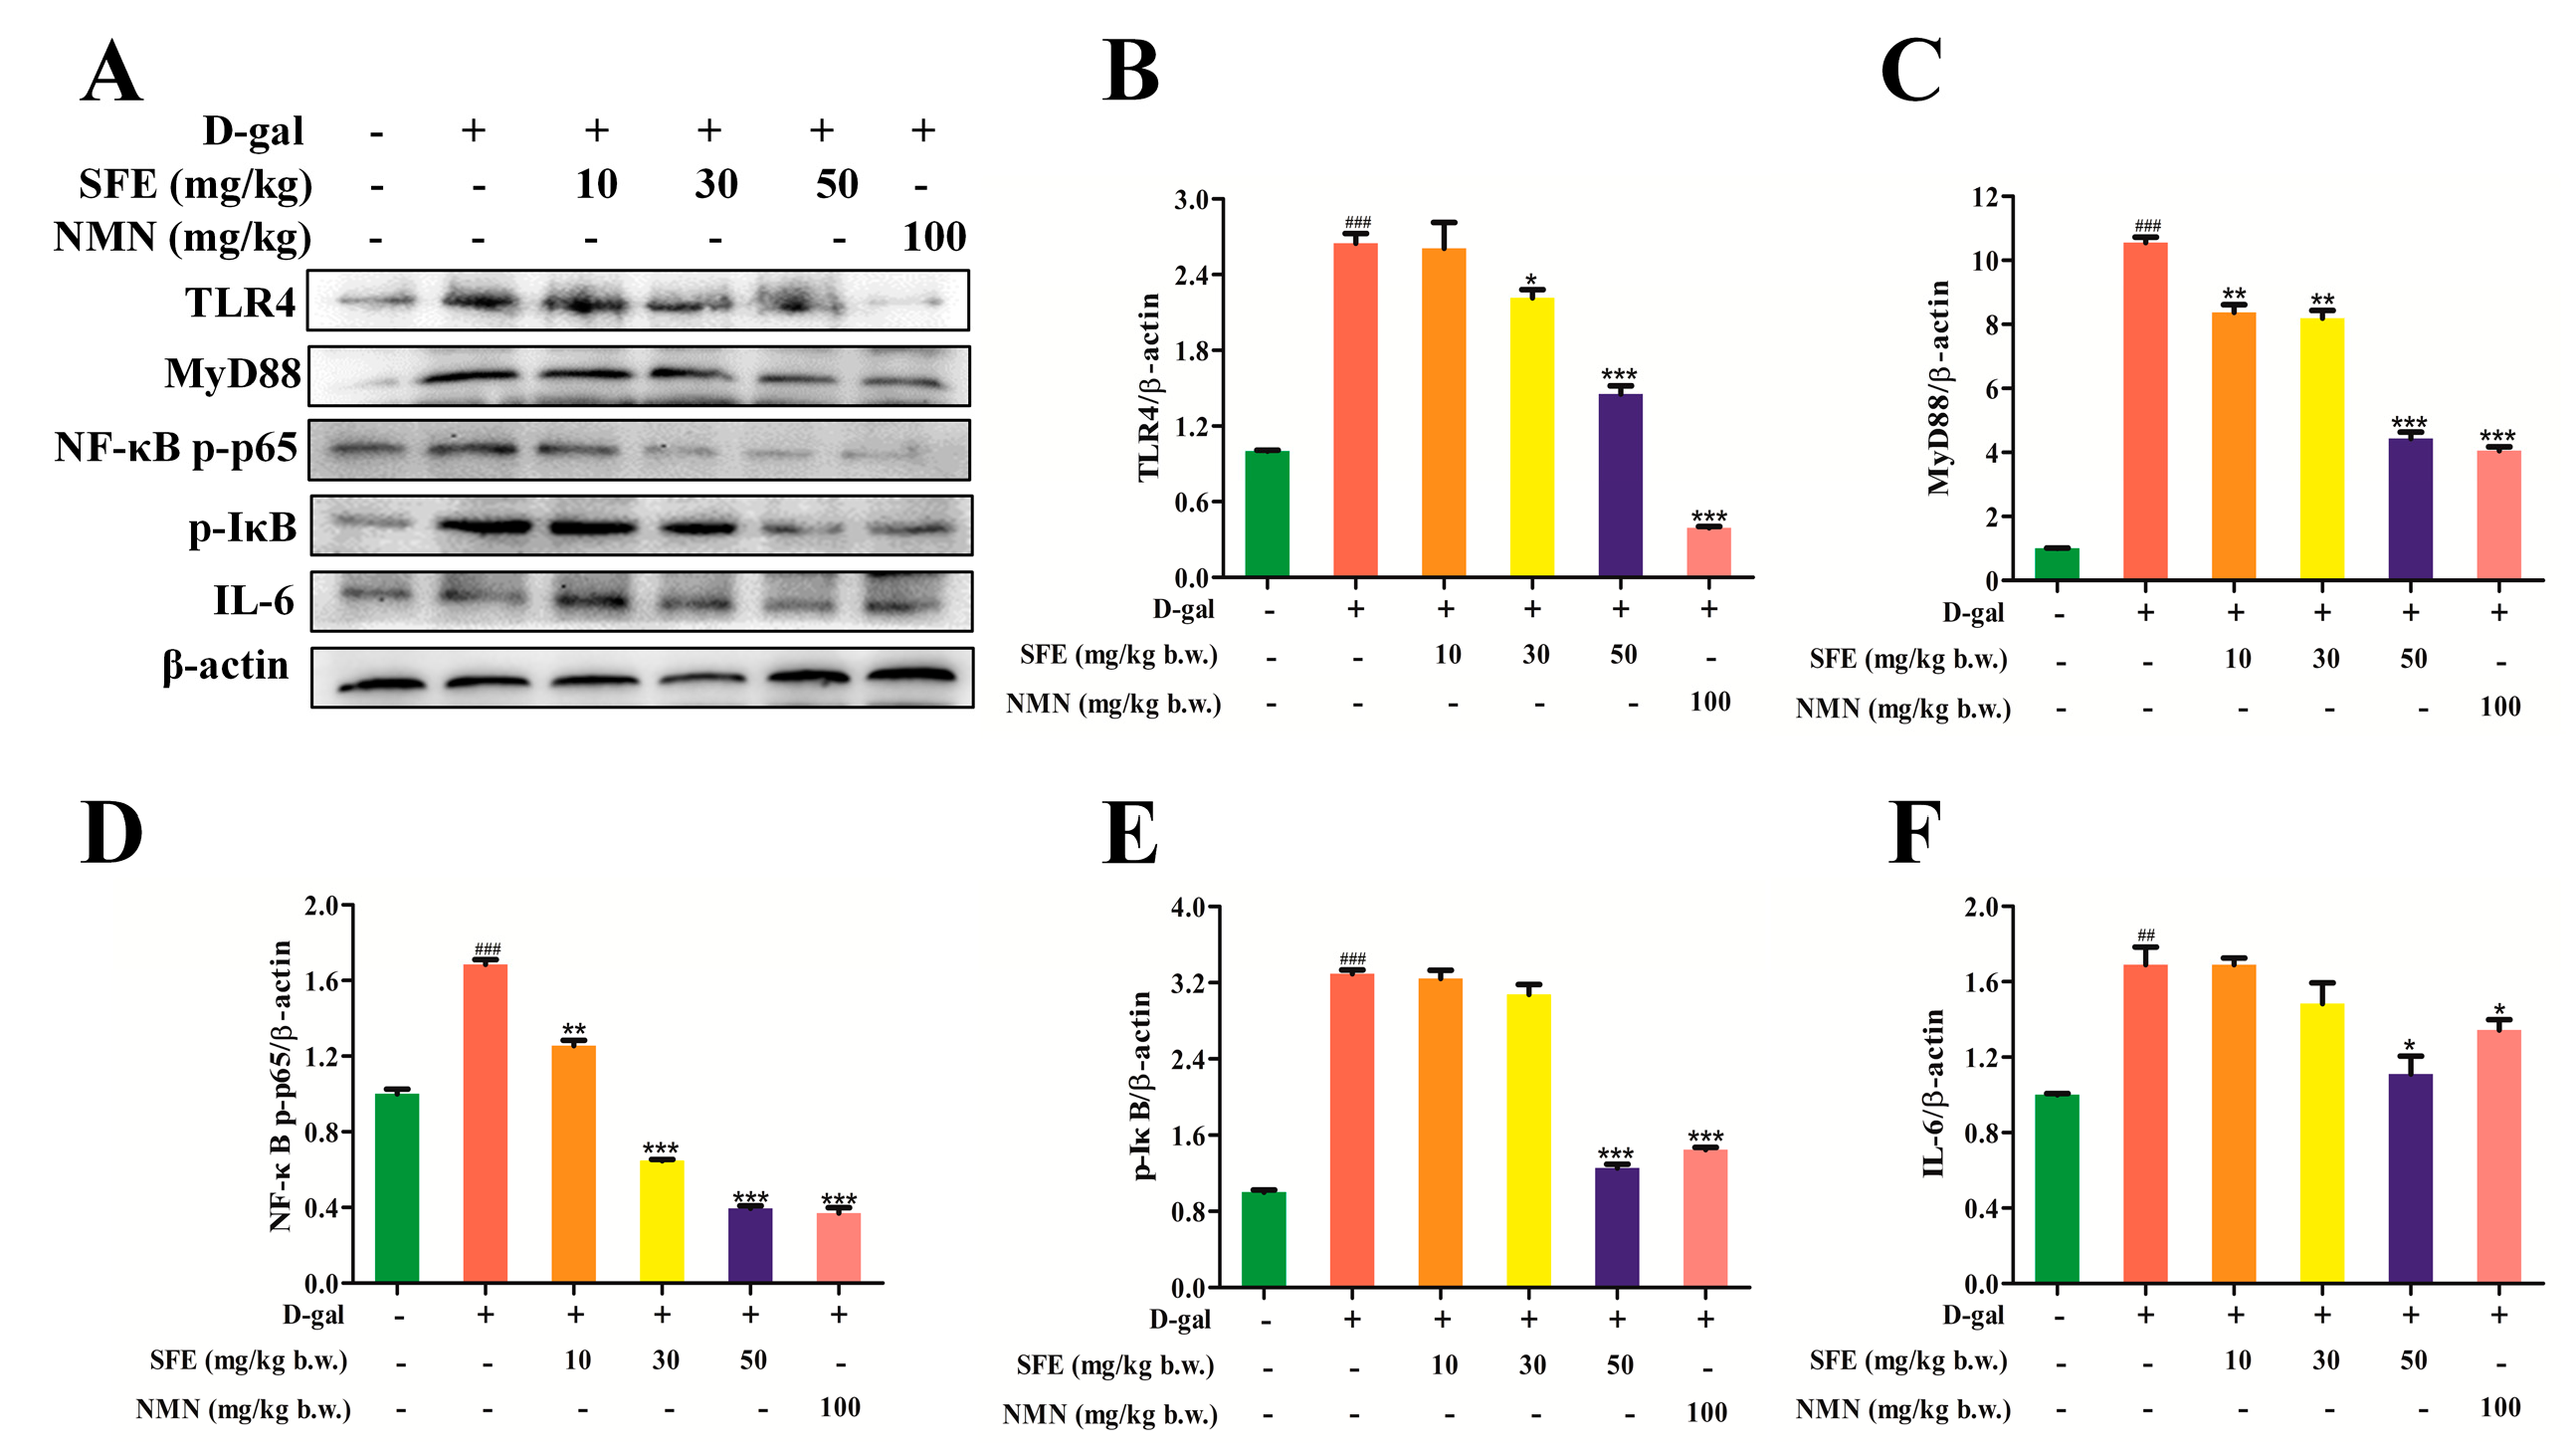
2.8. SFE Attenuated D−gal−Induced Inflammatory Responses in the Kidneys of Mice
3. Discussion
4. Materials and Methods
4.1. Materials
4.2. Cell Culture and Treatments
4.3. Detection of Intracellular ROS Production
4.4. Analysis of Nuclear Morphology
4.5. Determination of Mitochondrial Membrane Potential (Δψm)
4.6. Intracellular ATP Level Detection
4.7. Measurement of Apoptotic Cells
4.8. Cell Cycle Analysis
4.9. Animal Experiment
4.10. Histopathological Examination of the Kidney
4.11. Biochemical Analysis
4.12. Western Blotting Analysis
4.13. Statistical Analysis
5. Conclusions
Supplementary Materials
Author Contributions
Funding
Institutional Review Board Statement
Data Availability Statement
Conflicts of Interest
Abbreviations
| GLs | glucosinolates |
| ITCs | isothiocyanates |
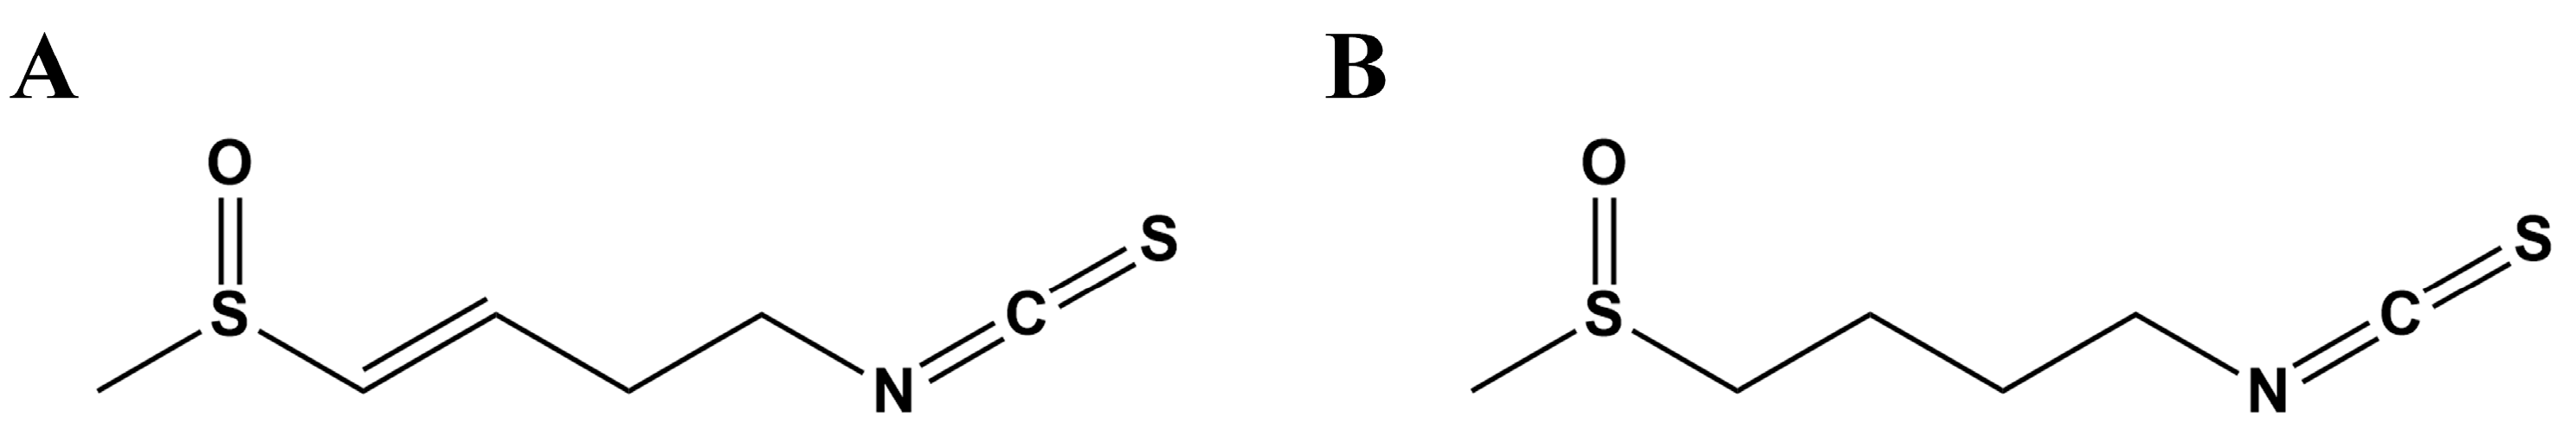
| SFE | sulforaphene |
| SFN | sulforaphane |
| PI3K | phosphoinositide 3−kinase |
| Akt | protein kinase B |
| GSK−3β | glycogen synthase kinase−3β |
| ROS | reactive oxygen species |
| SOD | superoxide dismutase |
| GSH−Px | glutathione reductase |
| CAT | catalase |
| Nrf2 | nuclear factor−erythroid 2−related factor 2 |
| ARE | antioxidant responsive element |
| HO−1 | heme oxygenase 1 |
| SASP | senescence associated secretory phenotype |
| LPS | lipopolysaccharide |
| TLR4 | toll−like receptor 4 |
| MyD88 | myeloid differentiation factor 88 |
| NQO1 | quinone oxidoreductase−1 |
| GCLM | glutamate−cysteine ligase modifier |
| 4−HNE | 4−hydroxynonenal |
| MDA | malondialdehyde |
| T−AOC | total antioxidant capacity |
| IFN−γ | interferon−gamma |
| CXCL10 | CXC chemokineligand−10 |
| MCP−1 | monocyte chemotactic protein−1 |
| IL−10 | interleukin−10 |
| TGF−β | transforming growth factor−β |
References
- Schreiner, M.; Krumbein, A.; Ruppel, S. Interaction between plants and bacteria: Glucosinolates and phyllospheric colonization of cruciferous vegetables by Enterobacter radicincitans DSM 16656. J. Mol. Microbiol. Biotechnol. 2009, 17, 124–135. [Google Scholar] [CrossRef] [PubMed]
- Blažević, I.; Montaut, S.; Burčul, F.; Olsen, C.E.; Burow, M.; Rollin, P.; Agerbirk, N. Glucosinolate structural diversity, identification, chemical synthesis and metabolism in plants. Phytochemistry 2020, 169, 112100. [Google Scholar] [CrossRef]
- Dinkova−Kostova, A.T.; Kostov, R.V. Glucosinolates and isothiocyanates in health and disease. Trends Mol. Med. 2012, 18, 337–347. [Google Scholar] [CrossRef]
- Zhang, Y.; Kensler, T.W.; Cho, C.G.; Posner, G.H.; Talalay, P. Anticarcinogenic activities of sulforaphane and structurally related synthetic norbornyl isothiocyanates. Proc. Natl. Acad. Sci. USA 1994, 91, 3147–3150. [Google Scholar] [CrossRef]
- Gerhäuser, C.; You, M.; Liu, J.; Moriarty, R.M.; Hawthorne, M.; Mehta, R.G.; Moon, R.C.; Pezzuto, J.M. Cancer chemopreventive potential of sulforamate, a novel analogue of sulforaphane that induces phase 2 drug−metabolizing enzymes. Cancer Res. 1997, 57, 272–278. [Google Scholar] [PubMed]
- Tian, G.; Li, Y.; Cheng, L.; Yuan, Q.; Tang, P.; Kuang, P.; Hu, J. The mechanism of sulforaphene degradation to different water contents. Food Chem. 2016, 194, 1022–1027. [Google Scholar] [CrossRef]
- Yang, W.; Liu, Y.; Xu, Q.Q.; Xian, Y.F.; Lin, Z.X. Sulforaphene ameliorates neuroinflammation and hyperphosphorylated tau protein via regulating the PI3K/Akt/GSK−3β pathway in experimental models of alzheimer’s disease. Oxidative Med. Cell. Longev. 2020, 2020, 4754195. [Google Scholar] [CrossRef] [PubMed]
- Mukherjee, P.K.; Venkatesh, P.; Ponnusankar, S. Ethnopharmacology and integrative medicine—let the history tell the future. J. Ayurveda Integr. Med. 2010, 1, 100–109. [Google Scholar] [CrossRef]
- Yin, S.Y.; Wei, W.C.; Jian, F.Y.; Yang, N.S. Therapeutic applications of herbal medicines for cancer patients. Evid. Based Complement Alternat. Med. 2013, 2013, 302426. [Google Scholar] [CrossRef]
- Toussaint, O.; Medrano, E.E.; von Zglinicki, T. Cellular and molecular mechanisms of stress−induced premature senescence (SIPS) of human diploid fibroblasts and melanocytes. Exp. Gerontol. 2000, 35, 927–945. [Google Scholar] [CrossRef]
- Lu, T.H.; Tseng, T.J.; Su, C.C.; Tang, F.C.; Yen, C.C.; Liu, Y.Y.; Yang, C.Y.; Wu, C.C.; Chen, K.; Hung, D.Z.; et al. Arsenic induces reactive oxygen species−caused neuronal cell apoptosis through JNK/ERK−mediated mitochondria−dependent and GRP 78/CHOP−regulated pathways. Toxicol. Lett. 2014, 224, 130–140. [Google Scholar] [CrossRef]
- Czaja, M.J. Cell signaling in oxidative stress−induced liver injury. Semin. Liver Dis. 2007, 27, 378–389. [Google Scholar] [CrossRef] [PubMed]
- Golden, T.R.; Hinerfeld, D.A.; Melov, S. Oxidative stress and aging: Beyond correlation. Aging Cell 2002, 1, 117–123. [Google Scholar] [CrossRef]
- Shelton, L.M.; Park, B.K.; Copple, I.M. Role of Nrf2 in protection against acute kidney injury. Kidney Int. 2013, 84, 1090–1095. [Google Scholar] [CrossRef]
- Saito, H. Toxico−pharmacological perspective of the Nrf2−Keap1 defense system against oxidative stress in kidney diseases. Biochem. Pharmacol. 2013, 85, 865–872. [Google Scholar] [CrossRef]
- Lei, P.; Zhao, W.; Pang, B.; Yang, X.; Li, B.L.; Ren, M.; Shan, Y.J. Broccoli sprout extract alleviates alcohol−induced oxidative stress and endoplasmic reticulum stress in C57BL/6 mice. J. Agric. Food Chem. 2018, 66, 5574–5580. [Google Scholar] [CrossRef] [PubMed]
- Kim, E.N.; Lim, J.H.; Kim, M.Y.; Ban, T.H.; Jang, I.A.; Yoon, H.E.; Park, C.W.; Chang, Y.S.; Choi, B.S. Resveratrol, an Nrf2 activator, ameliorates aging−related progressive renal injury. Aging 2018, 10, 83–99. [Google Scholar] [CrossRef] [PubMed]
- Shan, Q.; Zhuang, J.; Zheng, G.; Zhang, Z.; Zhang, Y.; Lu, J.; Zheng, Y. Troxerutin reduces kidney damage against BDE−47−induced apoptosis via inhibiting NOX2 activity and increasing Nrf2 activity. Oxidative Med. Cell. Longev. 2017, 2017, 6034692. [Google Scholar] [CrossRef]
- López−Otín, C.; Blasco, M.A.; Partridge, L.; Serrano, M.; Kroemer, G. The hallmarks of aging. Cell 2013, 153, 1194–1217. [Google Scholar] [CrossRef]
- Campisi, J.; d’Adda di Fagagna, F. Cellular senescence: When bad things happen to good cells. Nat. Rev. Mol. Cell Biol. 2007, 8, 729–740. [Google Scholar] [CrossRef]
- Wiley, C.D.; Flynn, J.M.; Morrissey, C.; Lebofsky, R.; Shuga, J.; Dong, X.; Unger, M.A.; Vijg, J.; Melov, S.; Campisi, J. Analysis of individual cells identifies cell−to−cell variability following induction of cellular senescence. Aging Cell 2017, 16, 1043–1050. [Google Scholar] [CrossRef] [PubMed]
- Kato, Y.; Morikawa, A.; Sugiyama, T.; Koide, N.; Jiang, G.Z.; Takahashi, K.; Yokochi, T. Role of tumor necrosis factor−alpha and glucocorticoid on lipopolysaccharide (LPS)−induced apoptosis of thymocytes. FEMS Immunol. Med. Microbiol. 1995, 12, 195–204. [Google Scholar] [CrossRef]
- Guo, H.; Guo, H.; Xie, Y.; Chen, Y.; Lu, C.; Yang, Z.; Zhu, Y.; Ouyang, Y.; Zhang, Y.; Wang, X. Mo3Se4 nanoparticle with ROS scavenging and multi−enzyme activity for the treatment of DSS−induced colitis in mice. Redox Biol. 2022, 56, 102441. [Google Scholar] [CrossRef]
- Wang, Y.; Hu, H.; Yin, J.; Shi, Y.; Tan, J.; Zheng, L.; Wang, C.; Li, X.; Xue, M.; Liu, J.; et al. TLR4 participates in sympathetic hyperactivity Post−MI in the PVN by regulating NF−κB pathway and ROS production. Redox Biol. 2019, 24, 101186. [Google Scholar] [CrossRef] [PubMed]
- Wu, Z.; Wang, H.; Fang, S.; Xu, C. Roles of endoplasmic reticulum stress and autophagy on H2O2−induced oxidative stress injury in HepG2 cells. Mol. Med. Rep. 2018, 18, 4163–4174. [Google Scholar] [CrossRef]
- Guo, K.; Liu, R.; Jing, R.; Wang, L.; Li, X.; Zhang, K.; Fu, M.; Ye, J.; Hu, Z.; Zhao, W.; et al. Cryptotanshinone protects skin cells from ultraviolet radiation−induced photoaging via its antioxidant effect and by reducing mitochondrial dysfunction and inhibiting apoptosis. Front. Pharmacol. 2022, 13, 1036013. [Google Scholar] [CrossRef]
- Hao, R.; Li, M.; Li, F.; Sun−Waterhouse, D.; Li, D. Protective effects of the phenolic compounds from mung bean hull against H2O2−induced skin aging through alleviating oxidative injury and autophagy in HaCaT cells and HSF cells. Sci. Total Environ. 2022, 841, 156669. [Google Scholar] [CrossRef] [PubMed]
- Maldaner, D.R.; Azzolin, V.F.; Barbisan, F.; Mastela, M.H.; Teixeira, C.F.; Dihel, A.; Duarte, T.; Pellenz, N.L.; Lemos, L.F.C.; Negretto, C.M.U.; et al. In vitro effect of low−level laser therapy on the proliferative, apoptosis modulation, and oxi−inflammatory markers of premature−senescent hydrogen peroxide−induced dermal fibroblasts. Lasers Med. Sci. 2019, 34, 1333–1343. [Google Scholar] [CrossRef]
- Martin−Montalvo, A.; Mercken, E.M.; Mitchell, S.J.; Palacios, H.H.; Mote, P.L.; Scheibye−Knudsen, M.; Gomes, A.P.; Ward, T.M.; Minor, R.K.; Blouin, M.J.; et al. Metformin improves healthspan and lifespan in mice. Nat. Commun. 2013, 4, 2192. [Google Scholar] [CrossRef]
- Anisimov, V.N.; Berstein, L.M.; Egormin, P.A.; Piskunova, T.S.; Popovich, I.G.; Zabezhinski, M.A.; Tyndyk, M.L.; Yurova, M.V.; Kovalenko, I.G.; Poroshina, T.E.; et al. Metformin slows down aging and extends life span of female SHR mice. Cell Cycle 2008, 7, 2769–2773. [Google Scholar] [CrossRef]
- Stefanatos, R.; Sanz, A. The role of mitochondrial ROS in the aging brain. FEBS Lett. 2018, 592, 743–758. [Google Scholar] [CrossRef]
- Nicolson, G.L. Metabolic syndrome and mitochondrial function: Molecular replacement and antioxidant supplements to prevent membrane peroxidation and restore mitochondrial function. J. Cell Biochem. 2007, 100, 1352–1369. [Google Scholar] [CrossRef]
- Kitase, Y.; Vallejo, J.A.; Dallas, S.L.; Xie, Y.; Dallas, M.; Tiede−Lewis, L.; Moore, D.; Meljanac, A.; Kumar, C.; Zhao, C.; et al. Body weight influences musculoskeletal adaptation to long−term voluntary wheel running during aging in female mice. Aging 2022, 15, 308–352. [Google Scholar] [CrossRef]
- Li, F.; Huang, G.; Tan, F.; Yi, R.; Zhou, X.; Mu, J.; Zhao, X. Lactobacillus plantarum KSFY06 on d−galactose−induced oxidation and aging in Kunming mice. Food Sci. Nutr. 2019, 8, 379–389. [Google Scholar] [CrossRef] [PubMed]
- Wang, Q.; Botchway, B.O.A.; Zhang, Y.; Liu, X. Ellagic acid activates the Keap1−Nrf2−ARE signaling pathway in improving Parkinson’s disease: A review. Biomed. Pharmacother. 2022, 156, 113848. [Google Scholar] [CrossRef] [PubMed]
- Liu, H.; Johnston, L.J.; Wang, F.; Ma, X. Triggers for the Nrf2/ARE signaling pathway and its nutritional regulation: Potential therapeutic applications of ulcerative colitis. Int. J. Mol. Sci. 2021, 22, 11411. [Google Scholar] [CrossRef] [PubMed]
- Zhang, H.; Zhou, L.; Davies, K.J.A.; Forman, H.J. Silencing Bach1 alters aging−related changes in the expression of Nrf2−regulated genes in primary human bronchial epithelial cells. Arch. Biochem. Biophys. 2019, 672, 108074. [Google Scholar] [CrossRef]
- Marrot, L.; Jones, C.; Perez, P.; Meunier, J.R. The significance of Nrf2 pathway in (photo)−oxidative stress response in melanocytes and keratinocytes of the human epidermis. Pigment. Cell Melanoma Res. 2008, 21, 79–88. [Google Scholar] [CrossRef]
- Dai, Y.; Lu, Q.; Li, P.; Zhu, J.; Jiang, J.; Zhao, T.; Hu, Y.; Ding, K.; Zhao, M. Xianglian Pill attenuates ulcerative colitis through TLR4/MyD88/NF−κB signaling pathway. J. Ethnopharmacol. 2023, 300, 115690. [Google Scholar] [CrossRef]
- Poprac, P.; Jomova, K.; Simunkova, M.; Kollar, V.; Rhodes, C.J.; Valko, M. Targeting free radicals in oxidative stress−related human diseases. Trends Pharmacol. Sci. 2017, 38, 592–607. [Google Scholar] [CrossRef]
- Samarghandian, S.; Azimi−Nezhad, M.; Farkhondeh, T.; Samini, F. Anti−oxidative effects of curcumin on immobilization−induced oxidative stress in rat brain, liver and kidney. Biomed. Pharmacother. 2017, 87, 223–229. [Google Scholar] [CrossRef] [PubMed]
- Coppolino, G.; Leonardi, G.; Andreucci, M.; Bolignano, D. Oxidative stress and kidney function: A brief update. Curr. Pharm. Des. 2018, 24, 4794–4799. [Google Scholar] [CrossRef]
- Barrera, L.N.; Cassidy, A.; Johnson, I.T.; Bao, Y.; Belshaw, N.J. Epigenetic and antioxidant effects of dietary isothiocyanates and selenium: Potential implications for cancer chemoprevention. Proc. Nutr. Soc. 2012, 71, 237–245. [Google Scholar] [CrossRef] [PubMed]
- Ishida, K.; Kaji, K.; Sato, S.; Ogawa, H.; Takagi, H.; Takaya, H.; Kawaratani, H.; Moriya, K.; Namisaki, T.; Akahane, T.; et al. Sulforaphane ameliorates ethanol plus carbon tetrachloride−induced liver fibrosis in mice through the Nrf2−mediated antioxidant response and acetaldehyde metabolization with inhibition of the LPS/TLR4 signaling pathway. J. Nutr. Biochem. 2021, 89, 108573. [Google Scholar] [CrossRef]
- Brenton, J.D.; Carey, L.A.; Ahmed, A.A.; Caldas, C. Molecular classification and molecular forecasting of breast cancer: Ready for clinical application? J. Clin. Oncol. 2005, 23, 7350–7360. [Google Scholar] [CrossRef] [PubMed]
- Zhang, J.; Li, X.; Ge, P.; Zhang, B.; Wen, L.; Gu, C.; Zhou, X. Sulforaphene: Formation, stability, separation, purification, determination and biological activities. Sep. Purif. Rev. 2021, 51, 1–10. [Google Scholar] [CrossRef]
- Zhang, Y.; Talalay, P.; Cho, C.G.; Posner, G.H. A major inducer of anticarcinogenic protective enzymes from broccoli: Isolation and elucidation of structure. Proc. Natl. Acad. Sci. USA 1992, 89, 2399–2403. [Google Scholar] [CrossRef] [PubMed]
- Mahn, A.; Castillo, A. Potential of sulforaphane as a natural immune system enhancer: A review. Molecules 2021, 26, 752. [Google Scholar] [CrossRef]
- Ruhee, R.T.; Suzuki, K. The integrative role of sulforaphane in preventing inflammation, oxidative stress and fatigue: A review of a potential protective phytochemical. Antioxidants 2020, 9, 521. [Google Scholar] [CrossRef] [PubMed]
- Santín−Márquez, R.; Alarcón−Aguilar, A.; López−Diazguerrero, N.E.; Chondrogianni, N.; Königsberg, M. Sulforaphane—role in aging and neurodegeneration. Geroscience 2019, 41, 655–670. [Google Scholar] [CrossRef]
- Li, Y.; Liu, Y.; Yan, X.; Liu, Q.; Zhao, Y.H.; Wang, D.W. Pharmacological Effects and Mechanisms of Chinese Medicines Modulating NLRP3 Inflammasomes in Ischemic Cardio/Cerebral Vascular Disease. Am. J. Chin. Med. 2018, 46, 1727–1741. [Google Scholar] [CrossRef]
- Gautam, D.K.; Misro, M.M.; Chaki, S.P.; Sehgal, N. H2O2 at physiological concentrations modulates Leydig cell function inducing oxidative stress and apoptosis. Apoptosis 2006, 11, 39–46. [Google Scholar] [CrossRef] [PubMed]
- Bayir, H.; Kagan, V.E. Bench−to−bedside review: Mitochondrial injury, oxidative stress and apoptosis—there is nothing more practical than a good theory. Crit. Care 2008, 12, 206. [Google Scholar] [CrossRef]
- Rakotoarisoa, M.; Angelov, B.; Garamus, V.M.; Angelova, A. Curcumin−and fish oil−loaded spongosome and cubosome nanoparticles with neuroprotective potential against H2O2−induced oxidative stress in differentiated human SHSY5Y cells. ACS Omega. 2019, 4, 3061–3073. [Google Scholar] [CrossRef]
- Richter, C.; Schweizer, M.; Cossarizza, A.; Franceschi, C. Control of apoptosis by the cellular ATP level. FEBS Lett. 1996, 378, 107–110. [Google Scholar] [CrossRef]
- Mannella, C.A. Structure and dynamics of the mitochondrial inner membrane cristae. Biochim. Biophys. Acta. 2006, 1763, 542–548. [Google Scholar] [CrossRef]
- Wang, H.; Chen, S.; Zhang, Y.; Xu, H.; Sun, H. Electroacupuncture ameliorates neuronal injury by Pink1/Parkin−mediated mitophagy clearance in cerebral ischemia−reperfusion. Nitric. Oxide 2019, 91, 23–34. [Google Scholar] [CrossRef]
- Zhao, C.; Su, P.; Lv, C.; Guo, L.; Cao, G.; Qin, C.; Zhang, W. Berberine alleviates amyloid β−Induced mitochondrial dysfunction and synaptic loss. Oxidative Med. Cell. Longev. 2019, 2019, 7593608. [Google Scholar] [CrossRef]
- Weinberg, F.; Hamanaka, R.; Wheaton, W.W.; Weinberg, S.; Joseph, J.; Lopez, M.; Kalyanaraman, B.; Mutlu, G.M.; Budinger, G.R.; Chandel, N.S. Mitochondrial metabolism and ROS generation are essential for Kras−mediated tumorigenicity. Proc. Natl. Acad. Sci. USA 2010, 107, 8788–8893. [Google Scholar] [CrossRef] [PubMed]
- Havens, C.G.; Ho, A.; Yoshioka, N.; Dowdy, S.F. Regulation of late G1/S phase transition and APC Cdh1 by reactive oxygen species. Mol. Cell Biol. 2006, 26, 4701–4711. [Google Scholar] [CrossRef]
- Pei, X.H.; Xiong, Y. Biochemical and cellular mechanisms of mammalian CDK inhibitors: A few unresolved issues. Oncogene 2005, 24, 2787–2795. [Google Scholar] [CrossRef]
- Yang, W.; Zhang, Y.; Li, Y.; Wu, Z.; Zhu, D. Myostatin induces cyclin D1 degradation to cause cell cycle arrest through a phosphatidylinositol 3−kinase/AKT/GSK−3 beta pathway and is antagonized by insulin−like growth factor 1. J. Biol. Chem. 2007, 282, 3799–3808. [Google Scholar] [CrossRef] [PubMed]
- Haider, S.; Liaquat, L.; Shahzad, S.; Sadir, S.; Madiha, S.; Batool, Z.; Tabassum, S.; Saleem, S.; Naqvi, F.; Perveen, T. A high dose of short term exogenous D−galactose administration in young male rats produces symptoms simulating the natural aging process. Life Sci. 2015, 124, 110–119. [Google Scholar] [CrossRef] [PubMed]
- He, S.; Yu, M.; Sun, H.; Zhang, Z.; Zhu, Y.; Zhao, J.; Tang, M.; Cao, Y. Potential effects of dietary Maillard reaction products derived from 1 to 3 kDa soybean peptides on the aging ICR mice. Food Chem. Toxicol. 2019, 125, 62–70. [Google Scholar] [CrossRef] [PubMed]
- Xu, L.Q.; Xie, Y.L.; Gui, S.H.; Zhang, X.; Mo, Z.Z.; Sun, C.Y.; Li, C.L.; Luo, D.D.; Zhang, Z.B.; Su, Z.R.; et al. Polydatin attenuates d−galactose−induced liver and brain damage through its anti−oxidative, anti−inflammatory and anti−apoptotic effects in mice. Food Funct. 2016, 7, 4545–4555. [Google Scholar] [CrossRef]
- Kim, H.; Oh, E.; Im, H.; Mun, J.; Yang, M.; Khim, J.Y.; Lee, E.; Lim, S.H.; Kong, M.H.; Lee, M.; et al. Oxidative damages in the DNA, lipids, and proteins of rats exposed to isofluranes and alcohols. Toxicology 2006, 220, 169–178. [Google Scholar] [CrossRef]
- Zhuang, Y.; Ma, Q.; Guo, Y.; Sun, L. Protective effects of rambutan (Nephelium lappaceum) peel phenolics on H2O2−induced oxidative damages in HepG2 cells and d−galactose−induced aging mice. Food Chem. Toxicol. 2017, 108, 554–562. [Google Scholar] [CrossRef]
- Ayala, A.; Muñoz, M.F.; Argüelles, S. Lipid peroxidation: Production, metabolism, and signaling mechanisms of malondialdehyde and 4−hydroxy−2−nonenal. Oxidative Med. Cell. Longev. 2014, 2014, 360438. [Google Scholar] [CrossRef]
- Halliwell, B. Free radicals and antioxidants: Updating a personal view. Nutr. Rev. 2012, 70, 257–265. [Google Scholar] [CrossRef]
- Sies, H. Oxidative stress: Oxidants and antioxidants. Exp. Physiol. 1997, 82, 291–295. [Google Scholar] [CrossRef]
- Zhang, R.; Kang, K.A.; Piao, M.J.; Kim, K.C.; Kim, A.D.; Chae, S.; Park, J.S.; Youn, U.J.; Hyun, J.W. Cytoprotective effect of the fruits of Lycium chinense Miller against oxidative stress−induced hepatotoxicity. J. Ethnopharmacol. 2010, 130, 299–306. [Google Scholar] [CrossRef]
- Klaassen, C.D.; Reisman, S.A. Nrf2 the rescue: Effects of the antioxidative/electrophilic response on the liver. Toxicol. Appl. Pharmacol. 2010, 244, 57–65. [Google Scholar] [CrossRef]
- Liang, L.; Gao, C.; Luo, M.; Wang, W.; Zhao, C.; Zu, Y.; Efferth, T.; Fu, Y. Dihydroquercetin (DHQ) induced HO−1 and NQO1 expression against oxidative stress through the Nrf2−dependent antioxidant pathway. J. Agric. Food Chem. 2013, 61, 2755–2761. [Google Scholar] [CrossRef]
- Nezu, M.; Suzuki, N. Roles of Nrf2 in protecting the kidney from oxidative damage. Int. J. Mol. Sci. 2020, 21, 2951. [Google Scholar] [CrossRef] [PubMed]
- Jiao, Z.; Chang, J.; Li, J.; Nie, D.; Cui, H.; Guo, D. Sulforaphane increases Nrf2 expression and protects alveolar epithelial cells against injury caused by cigarette smoke extract. Mol. Med. Rep. 2017, 16, 1241–1247. [Google Scholar] [CrossRef] [PubMed]
- Bergström, P.; Andersson, H.C.; Gao, Y.; Karlsson, J.O.; Nodin, C.; Anderson, M.F.; Nilsson, M.; Hammarsten, O. Repeated transient sulforaphane stimulation in astrocytes leads to prolonged Nrf2−mediated gene expression and protection from superoxide−induced damage. Neuropharmacology 2011, 60, 343–353. [Google Scholar] [CrossRef]
- Khaleel, S.A.; Raslan, N.A.; Alzokaky, A.A.; Ewees, M.G.; Ashour, A.A.; Abdel−Hamied, H.E.; Abd−Allah, A.R. Contrast media (meglumine diatrizoate) aggravates renal inflammation, oxidative DNA damage and apoptosis in diabetic rats which is restored by sulforaphane through Nrf2/HO−1 reactivation. Chem. Biol. Interact. 2019, 309, 108689. [Google Scholar] [CrossRef]
- Yao, H.; Du, Y.; Jiang, B.; Liao, Y.; Zhao, Y.; Yin, M.; Li, T.; Sheng, Y.; Ji, Y.; Du, M. Sulforaphene suppresses RANKL−induced osteoclastogenesis and LPS−induced bone erosion by activating Nrf2 signaling pathway. Free Radic. Biol. Med. 2023, 207, 48–62. [Google Scholar] [CrossRef]
- Ye, Q.; Yan, T.; Shen, J.; Shi, X.; Luo, F.; Ren, Y. Sulforaphene targets NLRP3 inflammasome to suppress M1 polarization of macrophages and inflammatory response in rheumatoid arthritis. J. Biochem. Mol. Toxicol. 2023, 37, e23362. [Google Scholar] [CrossRef]
- Hritz, I.; Mandrekar, P.; Velayudham, A.; Catalano, D.; Dolganiuc, A.; Kodys, K.; Kurt−Jones, E.; Szabo, G. The critical role of toll−like receptor (TLR) 4 in alcoholic liver disease is independent of the common TLR adapter MyD88. Hepatology 2008, 48, 1224–1231. [Google Scholar] [CrossRef] [PubMed]
- de Gonzalo−Calvo, D.; Neitzert, K.; Fernández, M.; Vega−Naredo, I.; Caballero, B.; García−Macía, M.; Suárez, F.M.; Rodríguez−Colunga, M.J.; Solano, J.J.; Coto−Montes, A. Differential inflammatory responses in aging and disease: TNF−alpha and IL−6 as possible biomarkers. Free Radic. Biol. Med. 2010, 49, 733–737. [Google Scholar] [CrossRef]
- Campisi, J. Cellular senescence: Putting the paradoxes in perspective. Curr. Opin. Genet. Dev. 2011, 21, 107–112. [Google Scholar] [CrossRef]
- Mosher, K.I.; Wyss−Coray, T. Microglial dysfunction in brain aging and Alzheimer’s disease. Biochem. Pharmacol. 2014, 88, 594–604. [Google Scholar] [CrossRef] [PubMed]
- Lee, J.B.; Lee, K.A.; Chang, J. Phenotypic changes induced by IL−12 priming regulate effector and memory CD8 T cell differentiation. Int. Immunol. 2007, 19, 1039–1048. [Google Scholar] [CrossRef] [PubMed][Green Version]
- Kuang, P.; Song, D.; Yuan, Q.; Lv, X.; Zhao, D.; Liang, H. Preparative separation and purification of sulforaphene from radish seeds by high−speed countercurrent chromatography. Food Chem. 2013, 136, 309–315. [Google Scholar] [CrossRef]
- Kuang, P.; Song, D.; Yuan, Q.; Yi, R.; Lv, X.; Liang, H. Separation and purification of sulforaphene from radish seeds using macroporous resin and preparative high−performance liquid chromatography. Food Chem. 2013, 136, 342–347. [Google Scholar] [CrossRef]
- James, N.; Kini, S.; Pai, S.; Shenoy, N.; Kabekkodu, S.P. Comparative evaluation of corneal storage medias used as tooth avulsion medias in maintaining the viability of periodontal ligament cells using the cell counting kit−8 assay. Clin. Cosmet. Investig. Dent. 2022, 14, 87–94. [Google Scholar] [CrossRef]
- Xia, T.; Yao, J.; Zhang, J.; Zheng, Y.; Song, J.; Wang, M. Protective effects of Shanxi aged vinegar against hydrogen peroxide−induced oxidative damage in LO2 cells through Nrf2−mediated antioxidant responses. RSC Adv. 2017, 7, 17377–17386. [Google Scholar] [CrossRef]
- Chazotte, B. Labeling nuclear DNA using DAPI. Cold Spring Harb. Protoc. 2011, 2011, 5556. [Google Scholar] [CrossRef] [PubMed]
- Wang, X.; Gong, Q.; Song, C.; Fang, J.; Yang, Y.; Liang, X.; Huang, X.; Liu, J. Berberine−photodynamic therapy sensitizes melanoma cells to cisplatin−induced apoptosis through ROS−mediated P38 MAPK pathways. Toxicol. Appl. Pharmacol. 2021, 418, 115484. [Google Scholar] [CrossRef]
- Li, Z.; Jiang, T.; Lu, Q.; Xu, K.; He, J.; Xie, L.; Chen, Z.; Zheng, Z.; Ye, L.; Xu, K.; et al. Berberine attenuated the cytotoxicity induced by t−BHP via inhibiting oxidative stress and mitochondria dysfunction in PC−12 cells. Cell Mol. Neurobiol. 2020, 40, 587–602. [Google Scholar] [CrossRef] [PubMed]
- Riccardi, C.; Nicoletti, I. Analysis of apoptosis by propidium iodide staining and flow cytometry. Nat. Protoc. 2006, 1, 1458–1461. [Google Scholar] [CrossRef] [PubMed]
- Xu, M.; Qi, Q.; Men, L.; Wang, S.; Li, M.; Xiao, M.; Chen, X.; Wang, S.; Wang, G.; Jia, H.; et al. Berberine protects Kawasaki disease−induced human coronary artery endothelial cells dysfunction by inhibiting of oxidative and endoplasmic reticulum stress. Vasc. Pharmacol. 2020, 127, 106660. [Google Scholar] [CrossRef] [PubMed]
- Liu, H.; Zhu, R.; Liu, C.; Ma, R.; Wang, L.; Chen, B.; Li, L.; Niu, J.; Zhao, D.; Mo, F.; et al. Evaluation of decalcification techniques for rat femurs using HE and immunohistochemical staining. Biomed. Res. Int. 2017, 2017, 9050754. [Google Scholar] [CrossRef]
- Xia, T.; Zhang, B.; Li, S.; Fang, B.; Duan, W.; Zhang, J.; Song, J.; Wang, M. Vinegar extract ameliorates alcohol−induced liver damage associated with the modulation of gut microbiota in mice. Food Funct. 2020, 11, 2898–2909. [Google Scholar] [CrossRef]
- Cruz−Jentoft, A.J.; Boland, B.; Rexach, L. Drug therapy optimization at the end of life. Drugs Aging 2012, 29, 511–521. [Google Scholar] [CrossRef]


| Groups | Kidney Index (mg/g) | Initial Body Weight (g) | Final Body Weight (g) |
|---|---|---|---|
| Control | 14.78 ± 0.79 | 23.9 ± 0.5 | 27.8 ± 1.0 |
| D−gal | 12.44 ± 0.86 ## | 22.4 ± 0.8 | 24.9 ± 1.3 ### |
| D−gal + SFE (10 mg/kg b.w.) | 13.41 ± 0.94 | 23.9 ± 1.0 | 25.2 ± 0.9 * |
| D−gal + SFE (30 mg/kg b.w.) | 13.51 ± 0.59 | 23.7 ± 0.6 | 26.8 ± 0.8 *** |
| D−gal + SFE (50 mg/kg b.w.) | 14.84 ± 1.56 ** | 22.7 ± 0.4 | 27.2 ± 1.0 *** |
| D−gal + NMN (100 mg/kg b.w.) | 13.35 ± 0.72 | 23.4 ± 0.8 | 26.9 ± 1.2 *** |
Disclaimer/Publisher’s Note: The statements, opinions and data contained in all publications are solely those of the individual author(s) and contributor(s) and not of MDPI and/or the editor(s). MDPI and/or the editor(s) disclaim responsibility for any injury to people or property resulting from any ideas, methods, instructions or products referred to in the content. |
© 2023 by the authors. Licensee MDPI, Basel, Switzerland. This article is an open access article distributed under the terms and conditions of the Creative Commons Attribution (CC BY) license (https://creativecommons.org/licenses/by/4.0/).
Share and Cite
Zhang, B.; Liu, P.; Sheng, H.; Guo, Y.; Han, Y.; Suo, L.; Yuan, Q. New Insight into the Potential Protective Function of Sulforaphene against ROS−Mediated Oxidative Stress Damage In Vitro and In Vivo. Int. J. Mol. Sci. 2023, 24, 13129. https://doi.org/10.3390/ijms241713129
Zhang B, Liu P, Sheng H, Guo Y, Han Y, Suo L, Yuan Q. New Insight into the Potential Protective Function of Sulforaphene against ROS−Mediated Oxidative Stress Damage In Vitro and In Vivo. International Journal of Molecular Sciences. 2023; 24(17):13129. https://doi.org/10.3390/ijms241713129
Chicago/Turabian StyleZhang, Bo, Pengtao Liu, Huakang Sheng, Yang Guo, Yongzhi Han, Lin Suo, and Qipeng Yuan. 2023. "New Insight into the Potential Protective Function of Sulforaphene against ROS−Mediated Oxidative Stress Damage In Vitro and In Vivo" International Journal of Molecular Sciences 24, no. 17: 13129. https://doi.org/10.3390/ijms241713129
APA StyleZhang, B., Liu, P., Sheng, H., Guo, Y., Han, Y., Suo, L., & Yuan, Q. (2023). New Insight into the Potential Protective Function of Sulforaphene against ROS−Mediated Oxidative Stress Damage In Vitro and In Vivo. International Journal of Molecular Sciences, 24(17), 13129. https://doi.org/10.3390/ijms241713129