Article

Probing the Interaction between Isoflucypram Fungicides and Human Serum Albumin: Multiple Spectroscopic and Molecular Modeling Investigations

State Key Laboratory for Biology of Plant Diseases and Insect Pests, Institute of Plant Protection, Chinese Academy of Agricultural Sciences, Beijing 100193, China
*
Authors to whom correspondence should be addressed.
Int. J. Mol. Sci. 2023, 24(15), 12521; https://doi.org/10.3390/ijms241512521
Submission received: 15 June 2023 / Revised: 23 July 2023 / Accepted: 27 July 2023 / Published: 7 August 2023
(This article belongs to the Section Molecular Biophysics)

Abstract

:
To better understand the potential toxicity risks of isoflucypram in humans, The interaction between isoflucypram and HSA (human serum albumin) was studied through molecular docking, molecular dynamics simulations, ultraviolet–visible absorption, fluorescence, synchronous fluorescence, three-dimensional fluorescence, Fourier transform infrared spectroscopies, and circular dichroism spectroscopies. The interaction details were studied using the molecular docking method and molecular dynamics simulation method. The results revealed that the effect of isoflucypram on human serum albumin was mixed (static and dynamic) quenching. Additionally, we were able to obtain important information on the number of binding sites, binding constants, and binding distance. The interaction between isoflucypram and human serum albumin occurred mainly through hydrogen bonds and van der Waals forces. Spectroscopic results showed that isoflucypram caused conformational changes in HSA (human serum albumin), in which the α-helix was transformed into a β-turn, β-sheet, and random coil, causing the HSA structure to loosen. By providing new insights into the mechanism of binding between isoflucypram and human serum albumin, our study has important implications for assessing the potential toxicity risks associated with isoflucypram exposure.

Graphical Abstract

1. Introduction

Pesticides are widely used in agriculture to protect crops from pests and diseases [1]. Their use has led to an increasing concern about their potential adverse effects on human health and the environment [2]. Toxicity assessments for humans are essential for any pesticide [3,4]. Isoflucypram (Figure 1), the first representative of a newly installed subclass of SDHIs (succinate dehydrogenase inhibitors) within the FRAC (Fungicide Resistance Action Committee) family, has shown remarkable and long-lasting efficacy against major foliar diseases in cereals, as reported by Desbordes et al. [5]. However, the essential role of the SDH (succinate dehydrogenase) complex as the molecular target of SDHIs in the energy metabolism of almost all extant eukaryotes, along with the lack of species specificity of these fungicides, raise concerns about their toxicity toward off-target organisms and, more generally, toward the environment. Yanicostas et al. [6] reviewed the current knowledge regarding the toxicity of nine commonly used SDHI fungicides, including isoflucypram, towards zebrafish (Danio rerio). The results indicated that these SDHIs cause multiple adverse effects in zebrafish embryos, including cardiovascular abnormalities, liver and kidney damage, and transcriptome changes. Chen et al. [7] studied isoflucypram cardiovascular toxicity in zebrafish, and Xiao et al. [8] investigated the chronic toxic effects of isoflufenacet on reproduction and intestinal energy metabolism in zebrafish. However, the toxicity, safety evaluation, and risk assessment of isoflucypram for humans have not been reported in the literature. Numerous scientific studies have documented the impact of drug binding with serum albumin on pharmacological and toxicological properties, making it a valuable tool for predicting in vivo toxicokinetics [9,10].
To investigate the impact of isoflucypram on the human body, HSA was chosen as the test substance. HSA is a highly abundant protein in blood plasma, with a concentration of approximately 35–50 g/L [11]. HSA is composed of a single chain and has a molecular weight of 66 kDa. It has a globular shape resembling a heart, with three similar domains labeled I, II, and III. Each domain consists of two helical subdomains that are connected by random coils [12,13]. Due to its unique structural and biochemical properties, HSA plays a crucial role in various physiological processes, including the transport of endogenous and exogenous ligands [14,15]. HSA has been shown to interact with a wide range of small molecules, including drugs, metabolites, and environmental toxins such as insecticides and fungicides [16,17]. Golianová et al. [16] Investigated the binding of conazole fungicides with serum albumins using spectroscopic methods complemented with molecular modeling. The interaction between the triazole fungicide tebuconazole and human serum albumin was investigated by Želonková et al. [17] using calorimetric and spectroscopic methods. These reports demonstrated that HSA can interact with pesticides, affecting their distribution, metabolism, and toxicity in the body [18].
In this study, molecular docking combined with molecular dynamics simulation was used to test the interaction between isoflucypram and HSA. Moreover, fluorescence spectroscopy was utilized to explore the underlying mechanisms, including the binding constant (K), thermodynamic parameters, and binding forces governing the interactions between isoflucypram and HSA under physiologically simulated conditions. In addition, we used UV-visible absorption (UV-vis), synchronous fluorescence, Fourier transform infrared (FT-IR), three-dimensional fluorescence (3D), and circular dichroism (CD) to discover the changes in the secondary structure of HSA in isoflucypram systems. Studying the interaction between HSA and isoflucypram is of great significance for the development of safer pesticides and the assessment of their exposure risks for humans.

2. Results and Discussion

2.1. Molecular Docking Studies

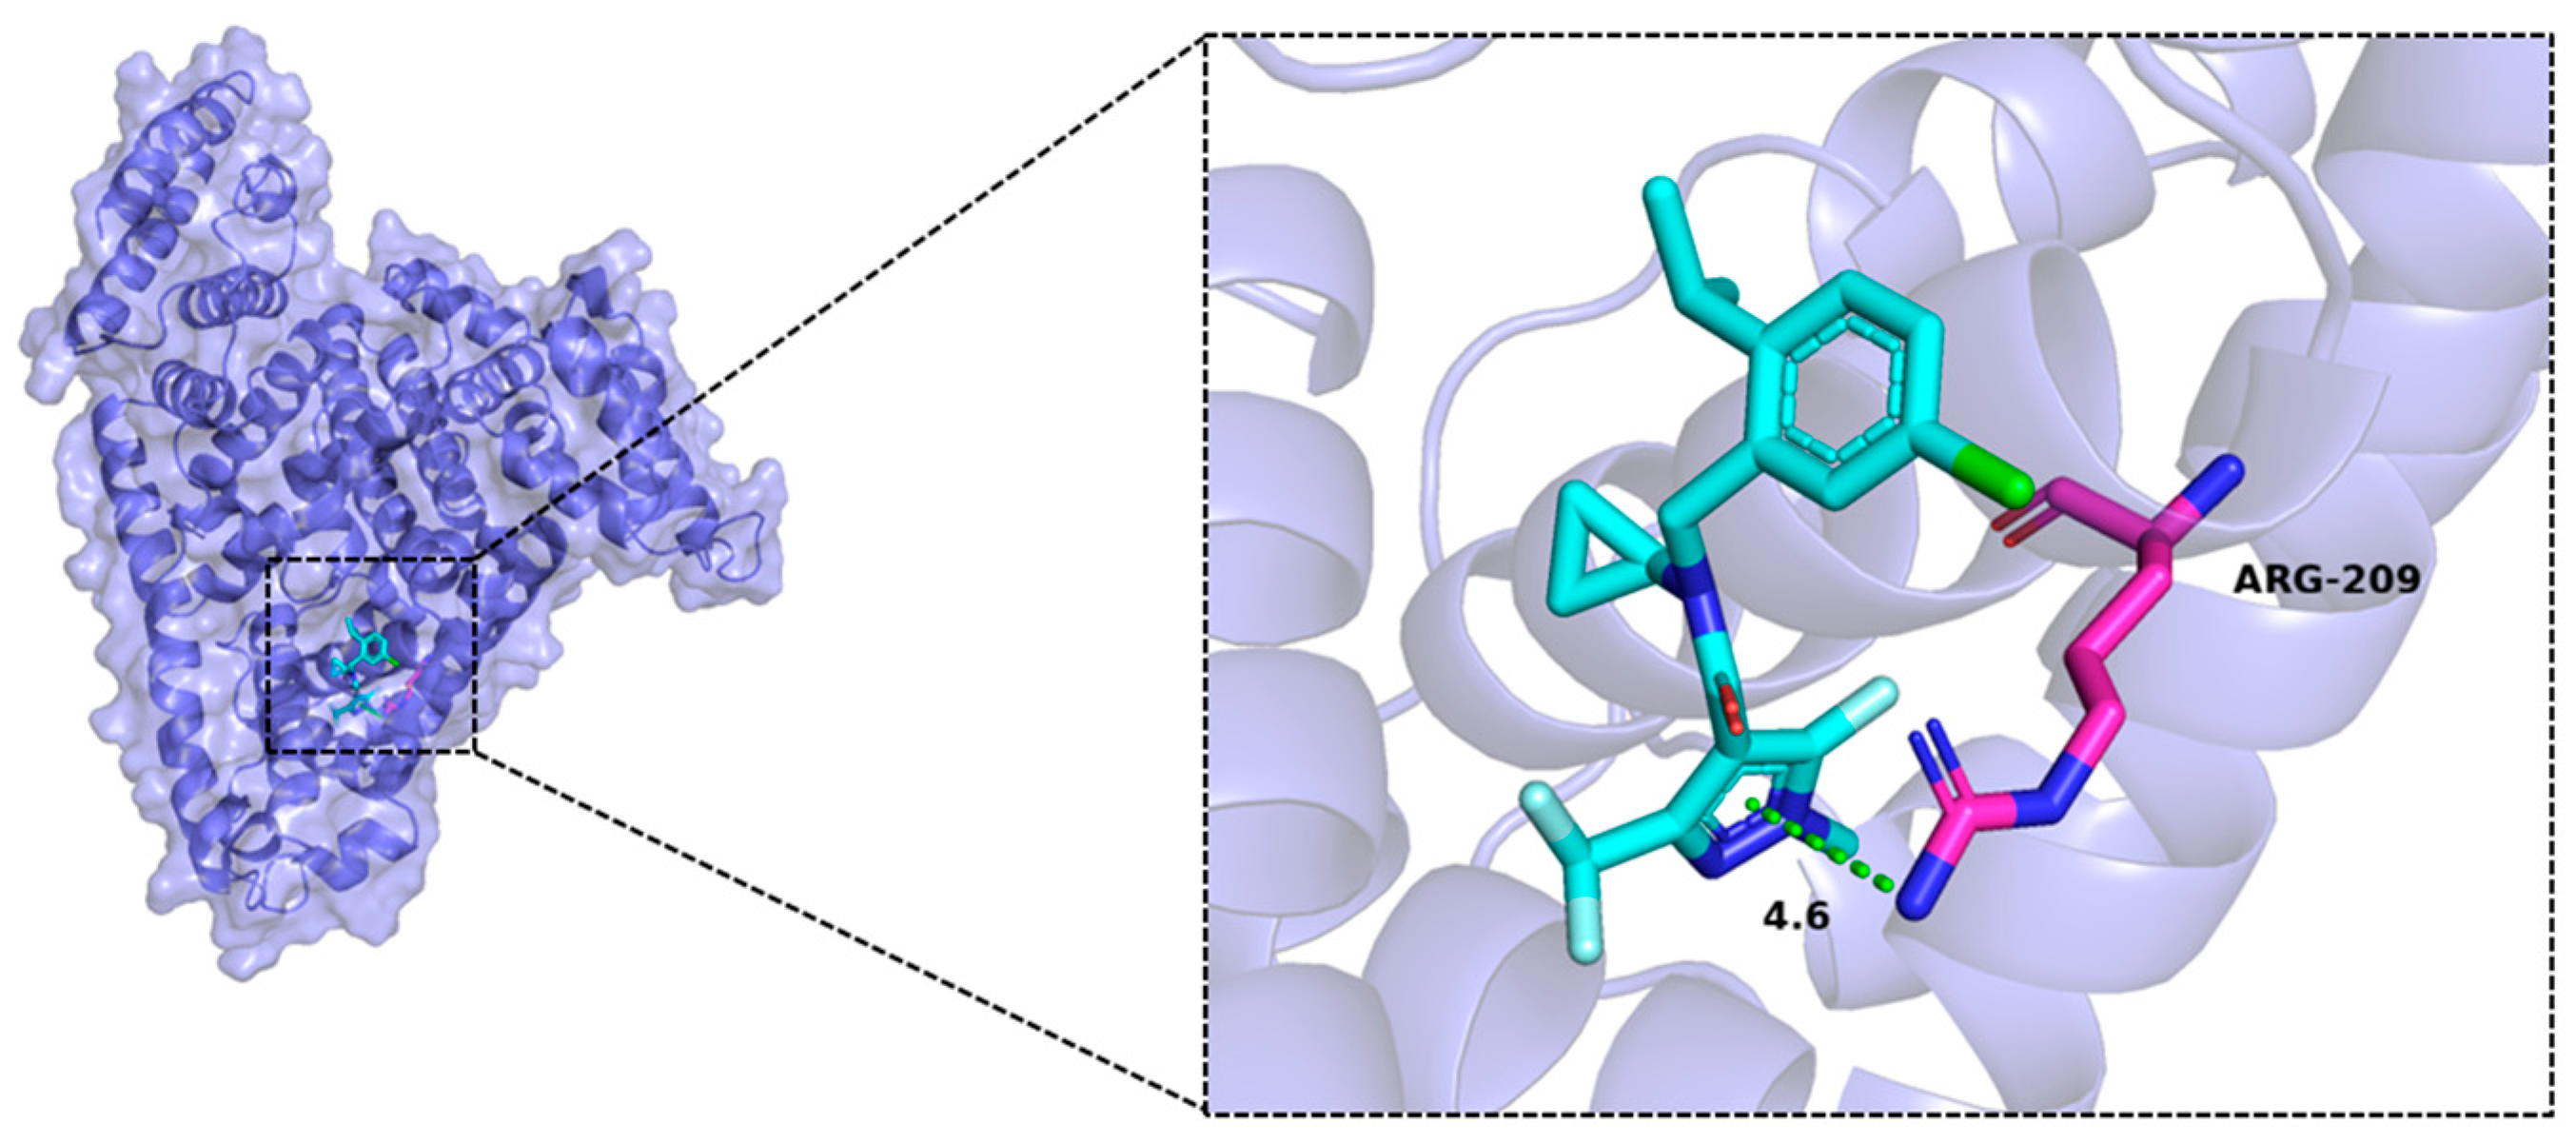
Figure 2 shows the best binding mode, which includes the interactions with amino acids surrounding the compound, as well as the bond distance. The HSA protein is represented as a slate cartoon model, and the ligand is shown as cyan sticks. The binding sites are depicted as magenta stick structures. Nonpolar hydrogen atoms are omitted. Hydrophobic interactions are represented as green dashed lines. Isoflucypram formed hydrophobic interactions with the Arg209 amino acid of HSA, with a bonding distance of 4.6 Å. Isoflucypram effectively bound to the active pocket of the protein with a binding energy of −8 kcal/mol, and its binding energy was less than −7 kcal/mol, indicating that the compound is capable of strong hydrophobic interactions with the protein binding pocket. Drug binding to HSA usually occurs at the Sudlow site I or II, which is a hydrophobic cavity that is capable of holding multiple drug molecules [19]. In light of the models of the complex of HSA with isoflucypram, the whole isoflucypram molecule may be localized in Sudlow’s site I of HSA. These results could serve as a structural foundation for further exploration of the binding mechanisms (e.g., fluorescence quenching and changes in thermodynamic parameters) between isoflucypram and HSA.

2.2. Molecular Dynamics Simulation Results

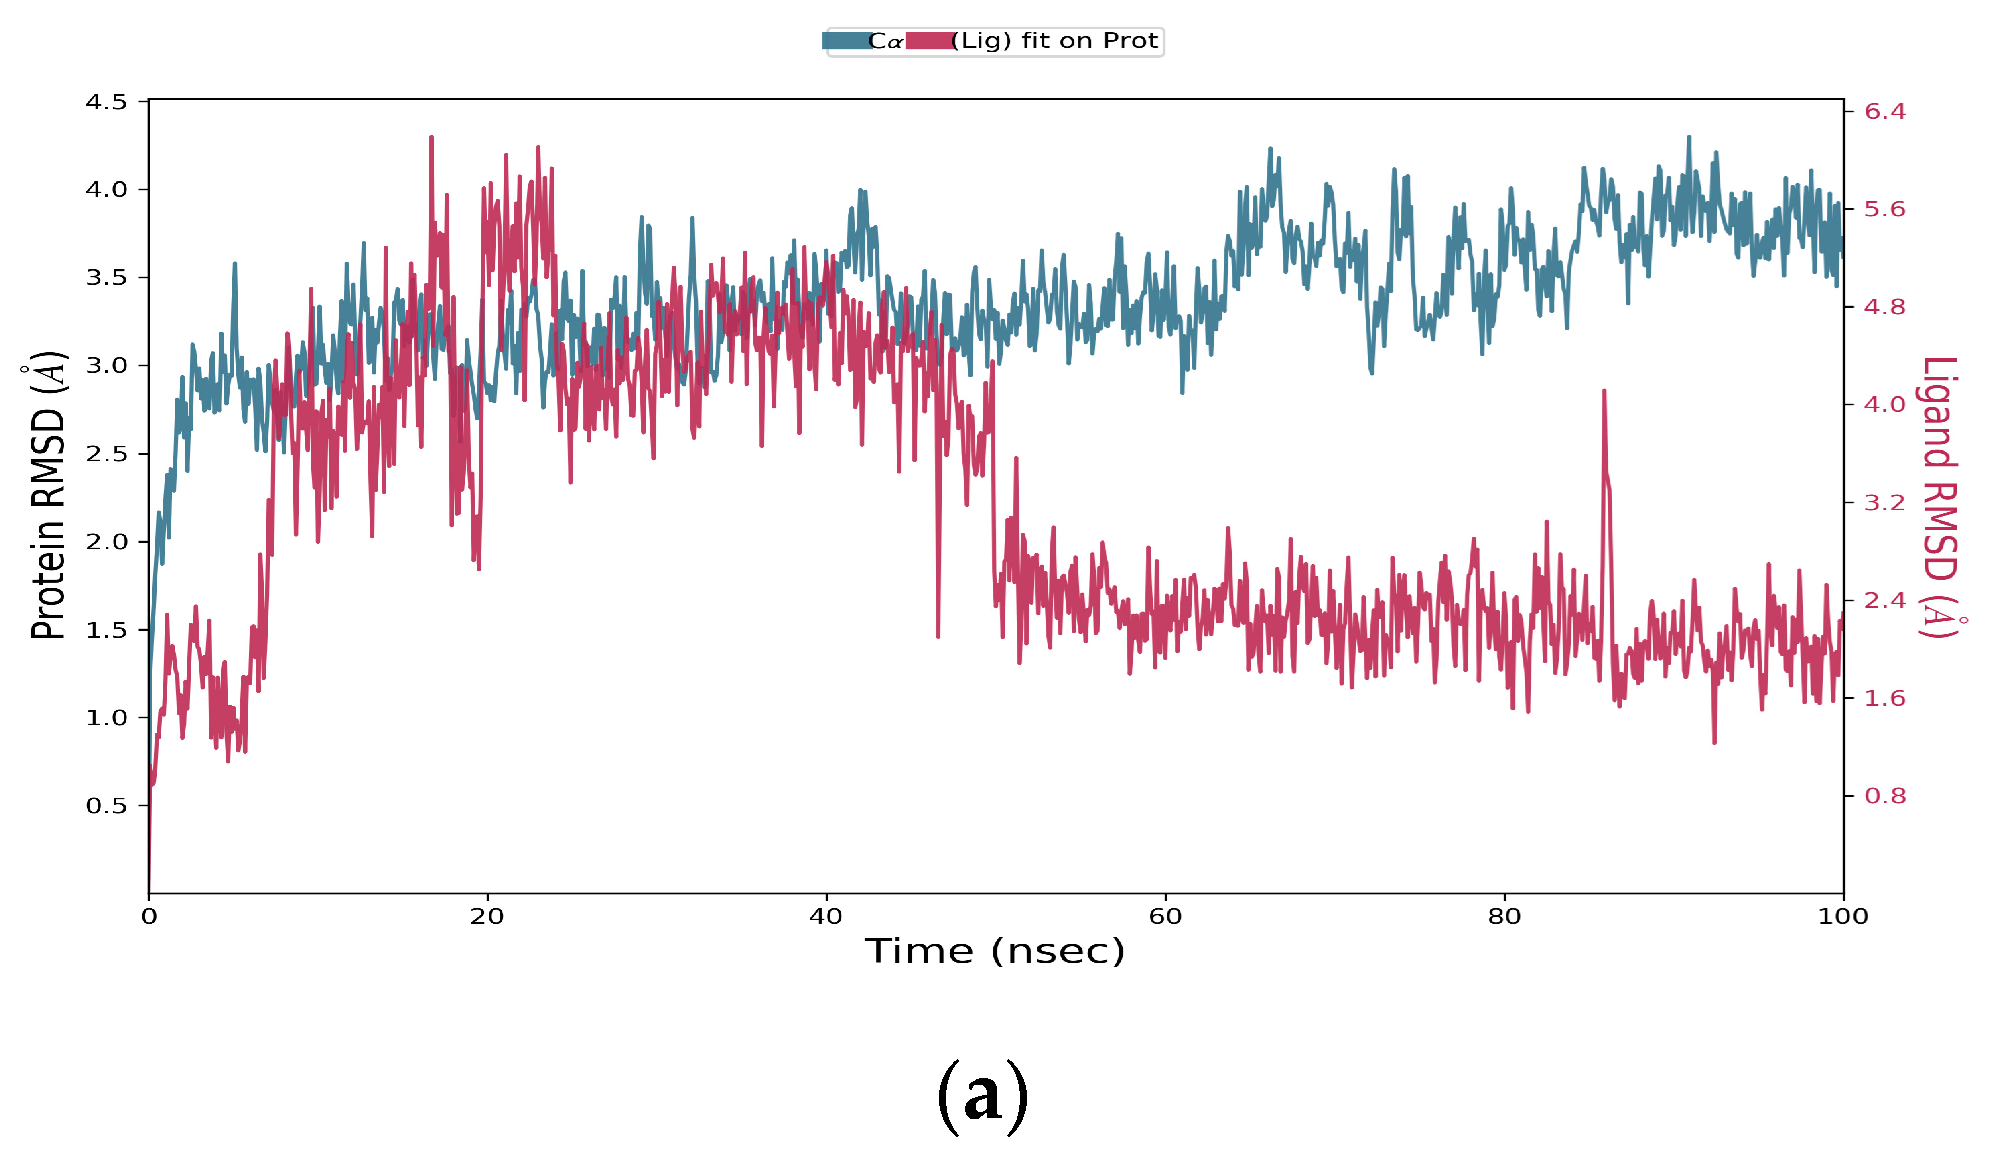
After a 100-ns molecular dynamics simulation of isoflucypram and HSA, a trajectory analysis was carried out. Firstly, the RMSDs of the trajectories of HSA and isoflucypram were extracted. As shown in Figure 3a, the protein and small molecule were in a relatively stable state after 85 ns. Regarding the observed variations in the RMSD value after 50 ns for the ligand in Figure 3a, we attribute this phenomenon to the inherent flexibility and dynamics of the ligand–protein complex. Throughout the simulation, the ligand may undergo slight conformational changes, resulting in fluctuations in the RMSD values. However, it is important to note that despite these variations, the overall stability and interaction between the ligand and protein remained relatively consistent. Therefore, we could undertake the following analysis for trajectories from 85 to 100 ns.
The RMSFs of track proteins and small molecules were extracted, as shown in Figure 3b,c. The green lines represent amino acid residues where small molecules form forces. The interaction mode of the stability interval (50–100 ns) of the kinetic trajectory was analyzed, as shown in Figure 3d. The amino acids that played important roles in small molecule binding included Phe206, Ala210, Lsy351, and Glu354, whose main roles are hydrophobic interactions, hydrogen bonding, and water bridges. The occupancy of interactions formed at 50–100 ns (number of frames forming interactions/total number of frames) was counted. The hydrophobic interaction of Lys351 led to occupancy of interactions at a frequency of 23%, indicating that the Lys351 amino acid played an important role in the binding process between isoflucypram and HSA.

2.3. Binding Mechanism

2.3.1. Fluorescence Quenching Spectra

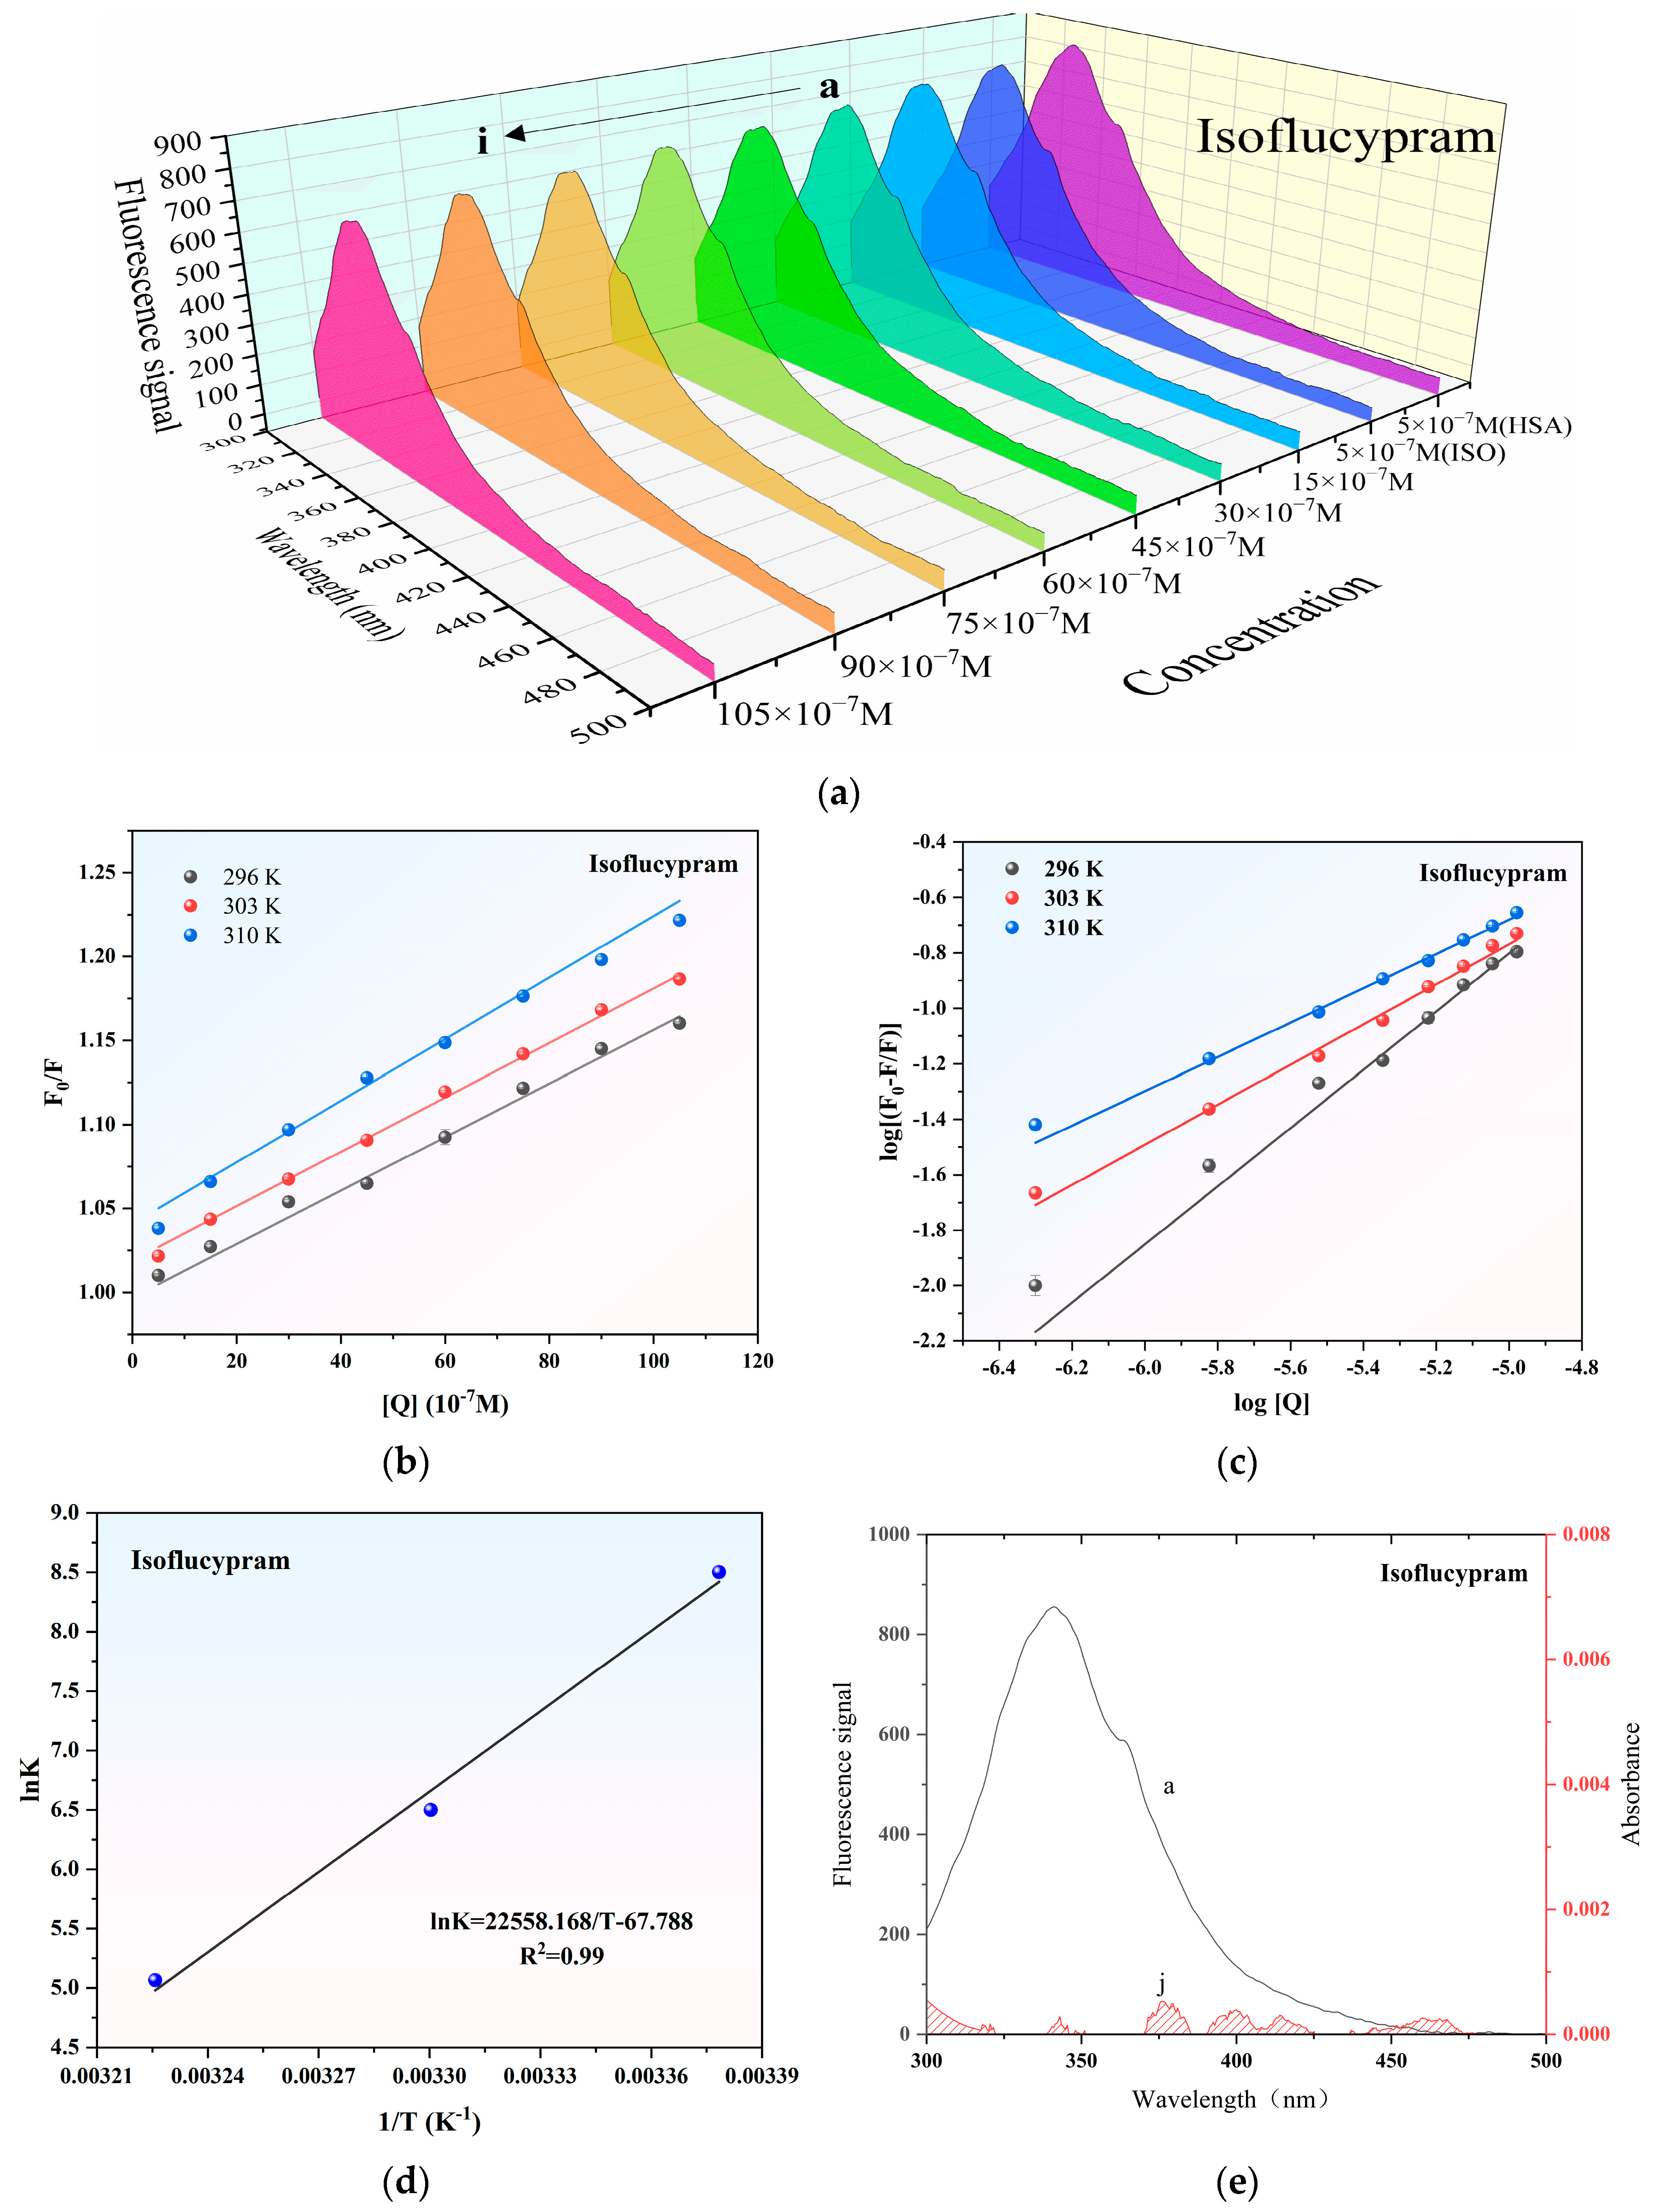
As displayed in Figure 4a, the HSA fluorescence emission spectra with (at 310 K) and without isoflucypram generated an obvious band absorption peak at 337 nm. The fluorescence intensity of HSA decreased with increasing isoflucypram concentrations, indicating that there was an interaction between the pesticide and HSA.

2.3.2. Fluorescence Quenching Mechanism

Quenching is typically categorized into two types: dynamic quenching and static quenching, which differ in their sensitivity to temperature and viscosity [20]. To qualitatively explore the quenching mechanism of HSA by isoflucypram, the fluorescence data were analyzed in depth using the Stern–Volmer equation, and the following relationship was found to exist between F0/F and [Q] [21,22]:
F0/F = 1 + Ksv[Q] = 1 + Kqτ0[Q]
The equation includes F0 and F, which represent the relative fluorescence intensities of HSA in the absence and presence of isoflucypram, respectively. Ksv represents the Stern–Volmer quenching constant. Kq indicates the quenching rate constant of the biomolecule. [Q] stands for the concentration of isoflucypram, and τ0 is the average lifetime of the molecule without the quencher (about 10−8 s).
Figure 4b shows the Stern–Volmer plots of the quenching of HSA fluorescence by isoflucypram at different temperatures. The calculated Stern–Volmer correlation and binding constants at different temperatures are listed in Table 1.
In the present system, the KSV values increased with increasing temperatures, which indicated that HSA collided with isoflucypram and achieved energy transfer. The quenching of HSA by isoflucypram initiated the dynamic quenching process. One way to differentiate between static quenching and dynamic quenching is to consider the biomolecule’s limiting diffusion constant, which was determined to be 2.0 × 10¹⁰ L·mol−1·s−1. If the quenching constant (Kq) is higher than 2.0 × 10¹⁰ L·mol−1·s−1, it indicates static quenching, whereas if Kq is lower than this value, it suggests dynamic quenching. Based on the data provided in Table 1, it can be inferred that the quenching mechanism between isoflucypram and HSA is partially static, as the Kq values were higher than 2.0 × 10¹⁰ L·mol−1·s−1 at 296 K, 303 K, and 310 K. Thus, the interaction mechanism between isoflucypram and HSA should be a dynamic and static mixing mechanism.

2.3.3. Determination of Binding Constants and the Number of Binding Sites

The binding information between isoflucypram and HSA was obtained using the formula below, including the number of binding sites (n) and binding constants (Ka) [23]:
log[(F0 − F)/F] = logKa + nlog[Q]
The equation relates the relative fluorescence intensities of HSA in the absence (F0) and presence (F) of isoflucypram, where Ka represents the binding constant of the interaction, n represents the number of binding sites, and [Q] represents the concentration of isoflucypram. By utilizing the formula, the log[(F0 − F)/F] versus log[Q] curve was generated through calculations (Figure 4c). The numbers of binding sites and binding constants at various temperatures were determined using a double-logarithm algorithm curve. The results of the calculated binding constants and binding sites are presented in Table 1.
The results suggested that the n values of isoflucypram were less than two, which may indicate that HSA had one binding site for isoflucypram. The binding constant decreased with increasing temperature. During the process of pesticide spraying, isoflucypram droplets are dispersed in the air or isoflucypram in material residues (in food or drinking water), entering the body through the mouth or nose, and are later absorbed into the bloodstream, where isoflucypram interacts with HSA during transport and metabolism.

2.3.4. Thermodynamic Parameters and Binding Forces Analysis

The thermodynamic parameters, enthalpy change, entropy change, and free energy change are the main basis for determining the binding mode [24]. The Van’t Hoff equation was used to determine the main types of isoflucypram–HSA interactions and to calculate their thermodynamic constants [25]:
lnK = −(ΔH0/RT) + ΔS0/R
ΔG0 = ΔH0 − TΔS0
where K is the binding constant at the respective temperature, R is the molar gas constant, and T is the experimental temperature. Utilizing the Van’t Hoff equation, the lnK vs. 1/T curve was obtained (Figure 4d). ΔG0, ΔH0, and ΔS0 were calculated using the slope and intercept. It can be seen from Table 2 that ΔG0 < 0, ΔH0 < 0, and ΔS0 < 0. The thermodynamic rules of the binding force between large molecules and small molecules showed that hydrogen bonding and van der Waals forces contributed greatly to the interaction when ΔH0 < 0 and ΔS0 < 0 [26]. For ΔG0 < 0, the interaction was thermodynamically favorable, i.e., the interaction tended to occur spontaneously.

2.3.5. Energy Transfer and Binding Distance

The non-radiative energy transfer between isoflucypram and HSA was explained using the Förster energy transfer theory, and the binding distance was calculated [27]. The efficiency of energy transfer, the critical energy transfer distance, and the energy transfer distance between the donor and the acceptor had the following relationship:
E = 1 − F/F0 = R06/(R06 + r6)
where E represents the transfer efficiency between the donor and acceptor, r denotes the average distance separating the donor and acceptor, and R0 represents the critical distance at which the transfer efficiency reaches 50%. R06 can be calculated using the following equation:
R06 = 8.8 × 10⁻²⁵ K2N−4φJ
where K2 denotes the spatial orientation factor of the dipole, N represents the refractive index of the medium, φ denotes the quantum yield of tryptophan in HSA, and J represents the overlap integral between the fluorescence emission spectrum of HSA and the absorption spectrum of carbamate pesticides. The calculation of J can be expressed using the following equation:
J = ∑F(λ)ε(λ)λ4Δλ/∑F(λ)Δλ
where F(λ) represents the corrected fluorescence signal of the donor within the wavelength range from λ to λ + Δλ, and ε(λ) denotes the extinction coefficient of the acceptor at wavelength λ. The quantum yield of tryptophan in HSA is 0.118 [28]. The average refractive index of the medium is 1.336, and the spatial orientation factor of the dipole, denoted as K2, is equal to 2/3 [29]. Figure 4e displays the fluorescence spectrum of HSA overlapped with the absorption spectrum of isoflucypram at 310 K, while Table 2 provides the binding distances. Thus, from the Eqs, we obtained the values of J, E, R0, and r (Table 2). Binding distances (r) of less than 8 indicated the occurrence of non-radiative energy transfer between isoflucypram and HSA. The results were consistent with the occurrence of a static quenching mechanism between isoflucypram and HSA.

2.4. Conformational Changes in HSA

2.4.1. UV-Visible Absorption Spectra and Analysis

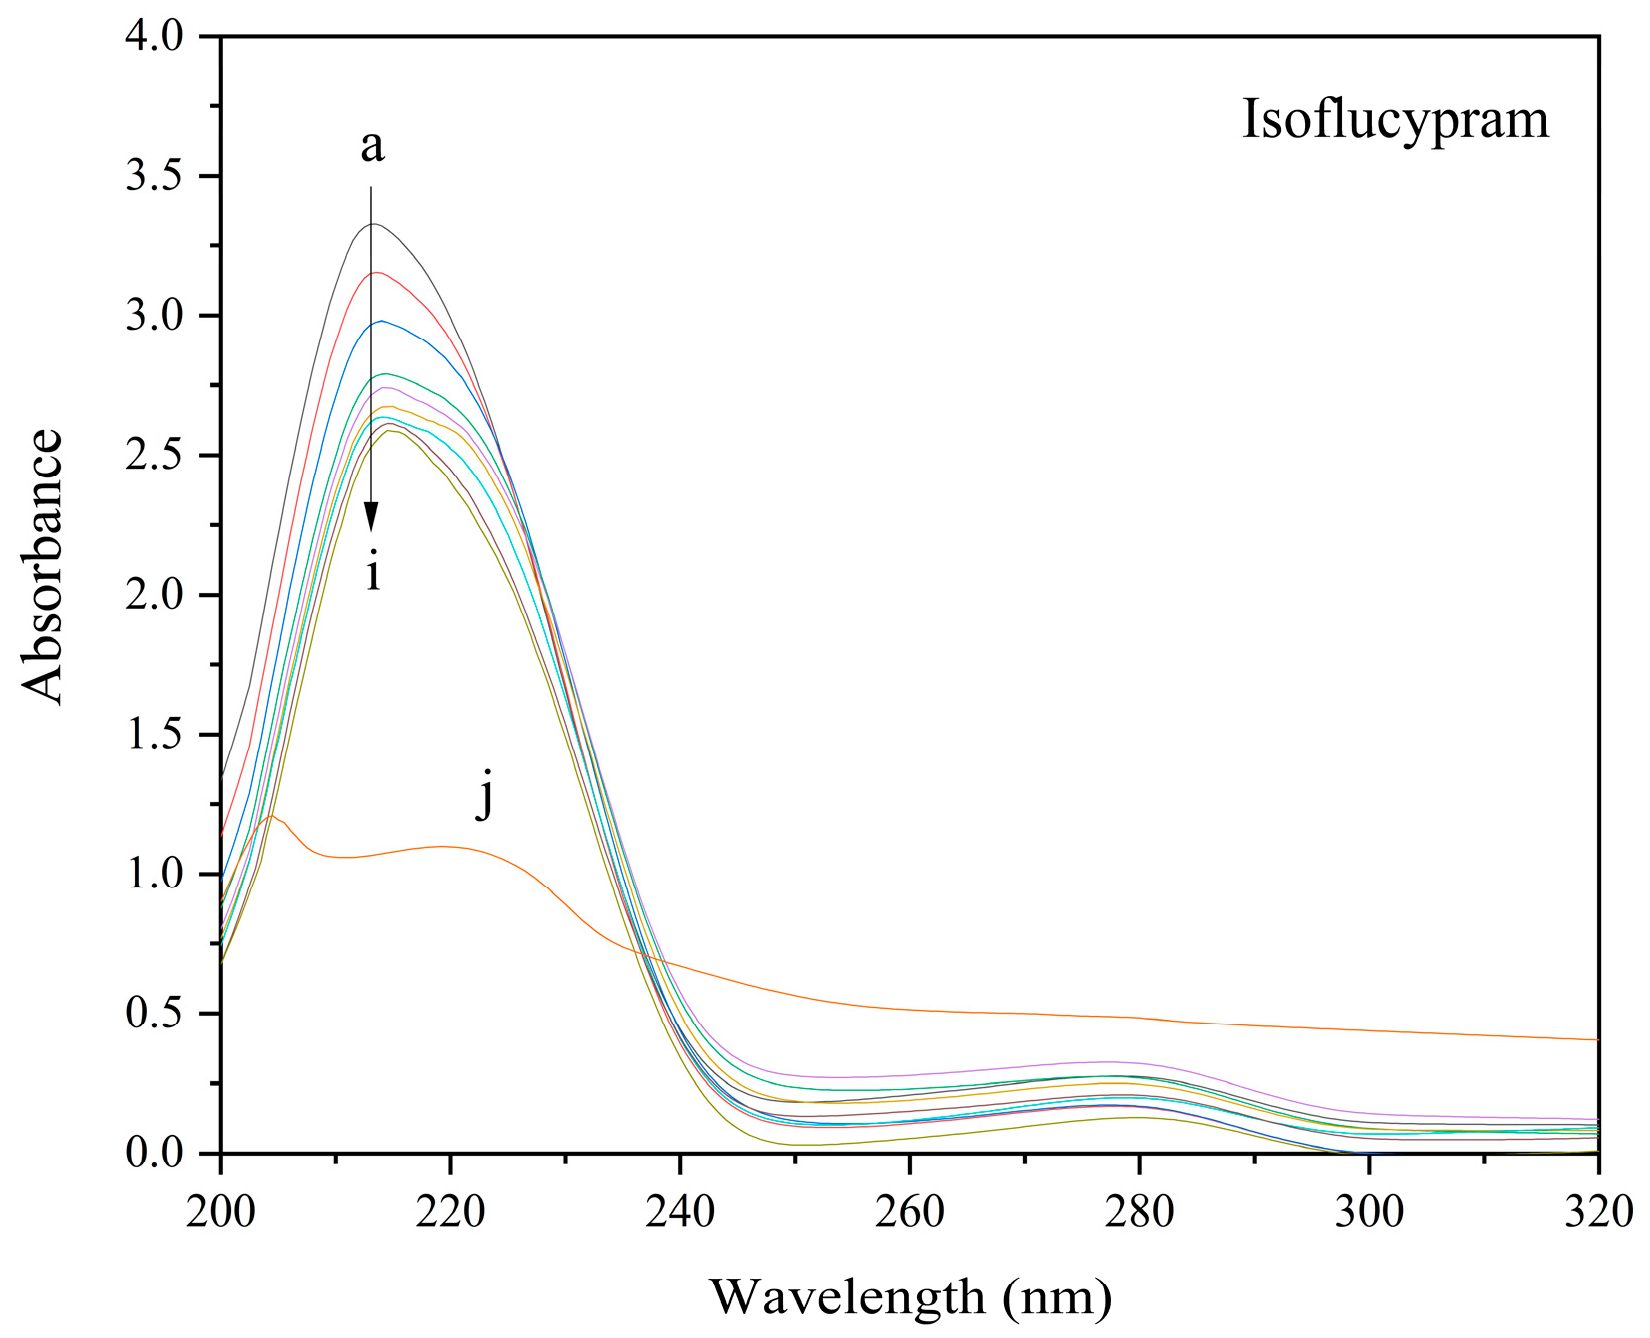
Using UV-vis absorption to investigate protein–drug interactions and ground state complex formation is a simple and readily accessible method [30]. According to the UV-vis spectra shown in Figure 5, HSA contained two distinctive absorption peaks located at approximately 214 nm and 278 nm. The modest absorption peak at approximately 278 nm was caused by the aromatic amino acids, and the significant absorption peak at approximately 214 nm was due to the absorption of the peptide skeleton structure of HSA (Trp, Tyr, and Phe) [31]. The UV-vis absorption signal of the peak at 214 nm exhibited a decrease in intensity with an increase in the concentration of isoflucypram. Additionally, the absorption signal of the peak at 278 nm did not change significantly. Notably, a red shift phenomenon was observed, whereby the maximum absorption wavelength shifted from 214 nm to approximately 216 nm. These results indicated that the polarity of the microenvironment near the peptide skeleton increased, and the microenvironment near the aromatic amino acids changed slightly. Distinguishing between dynamic and static quenching is possible using UV-vis spectra. Specifically, in dynamic quenching, the absorption spectrum of the fluorophore remains unchanged, whereas in static quenching, the absorption constantly changes [32]. Based on the UV-vis absorption spectrum of HSA with a range of isoflucypram concentrations, it can be inferred that the fluorescence quenching of HSA by isoflucypram was due to static quenching.

2.4.2. Synchronous Fluorescence Spectra and Analysis

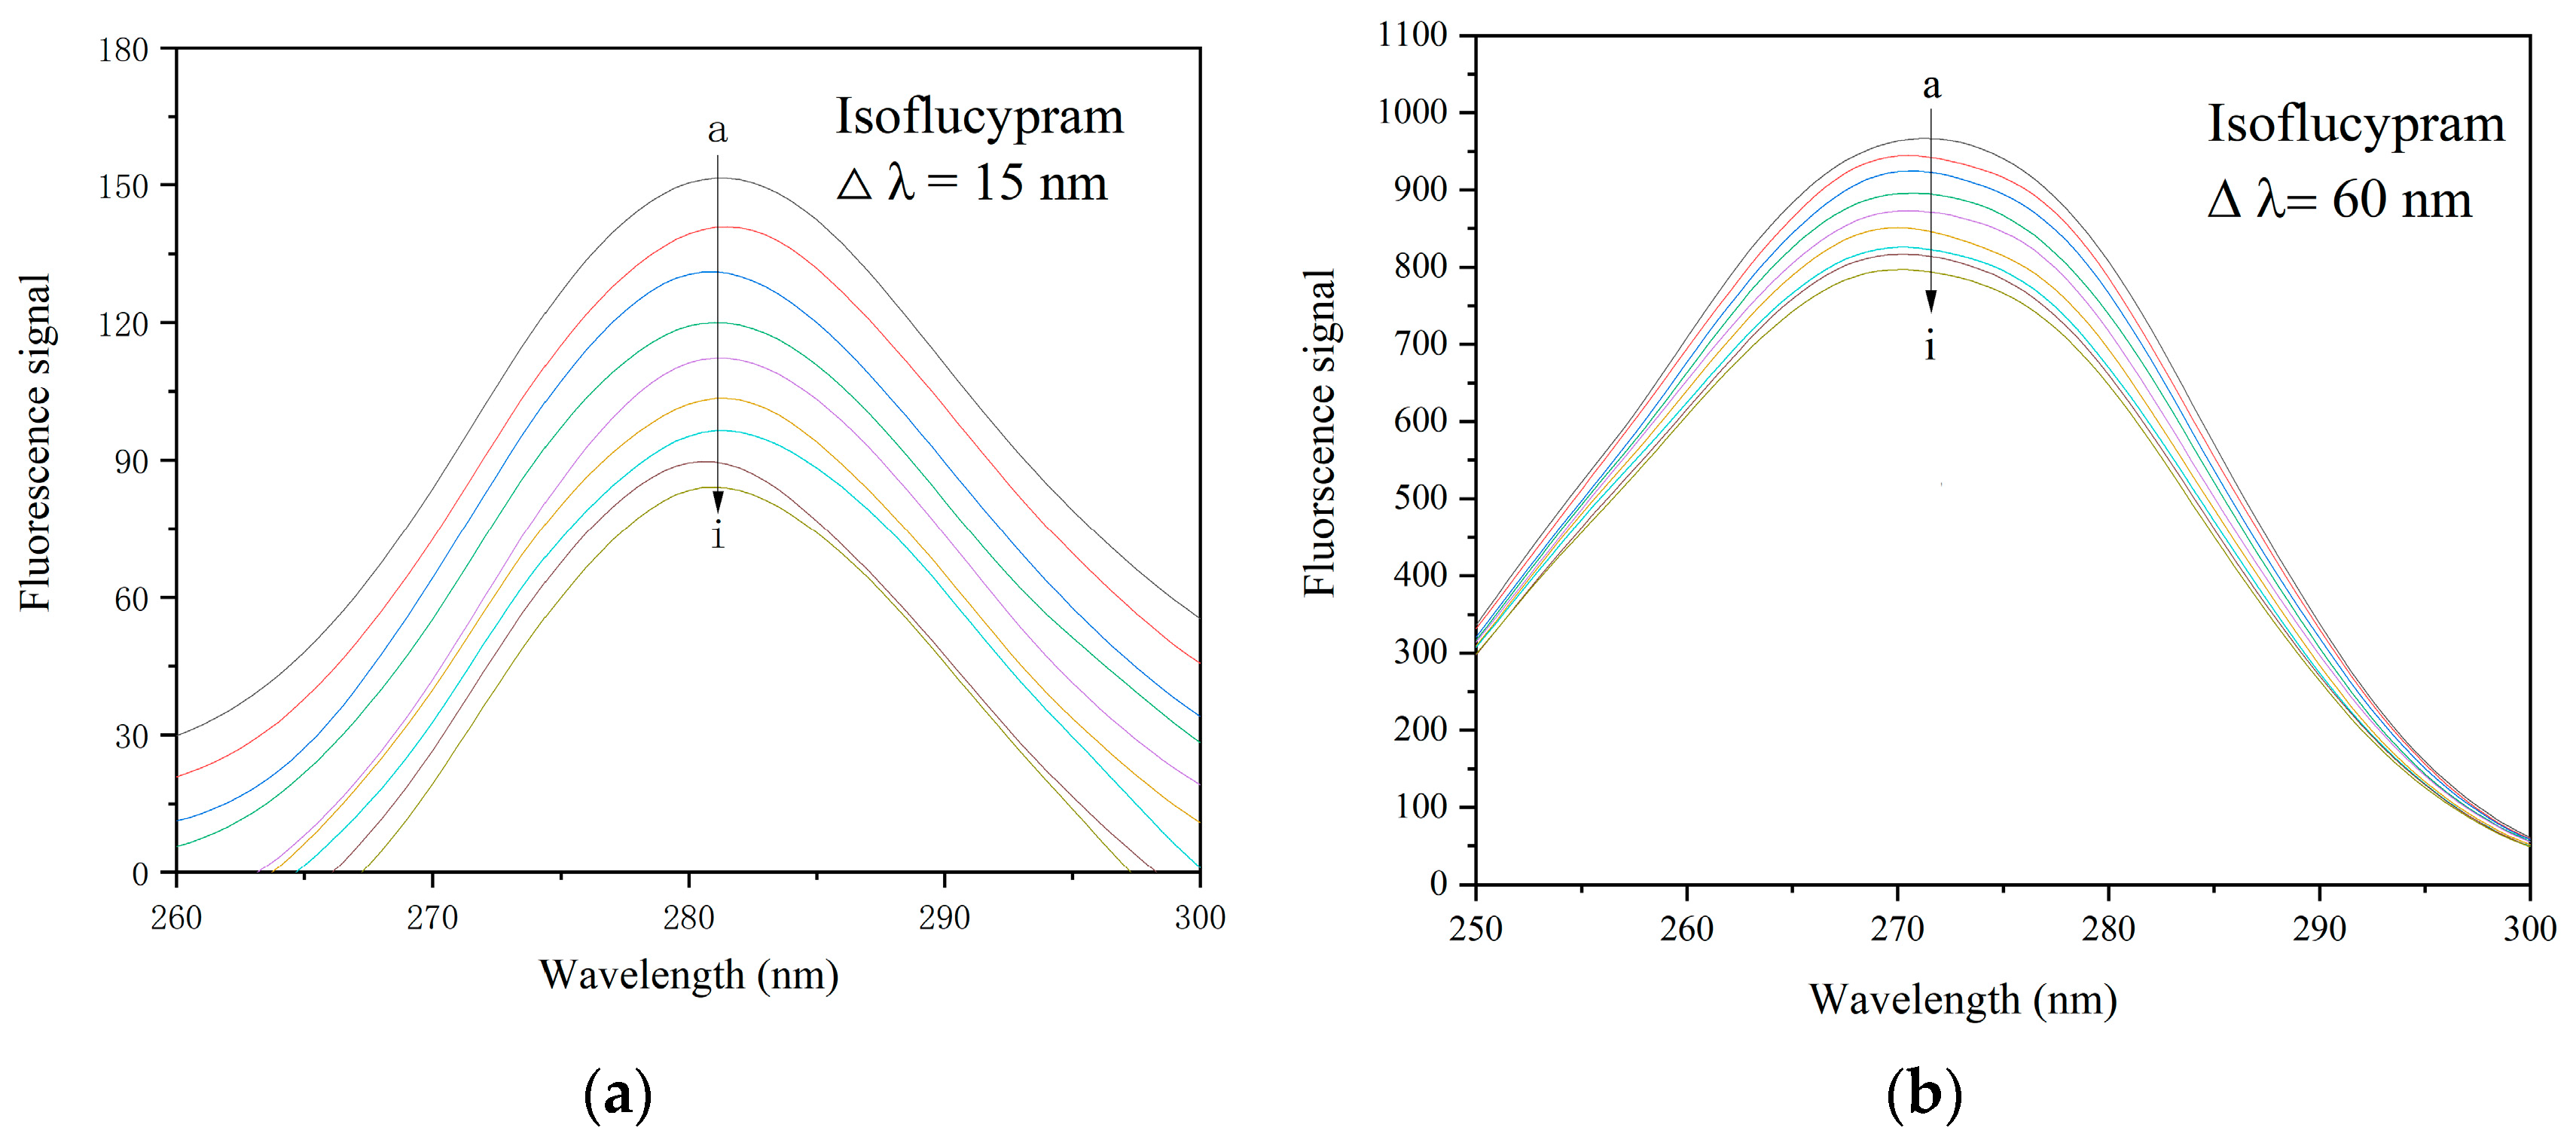
Synchronous fluorescence spectroscopy is a sensitive technique for probing changes in ligand binding pocket conformation and polarity [33]. Miller [34] proposed a long-held theory that, when Δλ is stabilized at 15 nm and 60 nm, the synchronous fluorescence of HSA exhibits the characteristic information of Tyr and Trp residues, respectively. Because the maximum emission wavelength of amino acid residues might reflect the hydrophobicity of their surrounding environment, the influence of pesticides on HSA conformation could be established by the change in emission wavelength [25]. Based on Figure 6, it can be observed that the maximum fluorescence emission peak of the protein decreased as the isoflucypram concentration increased under the spectrum of Δλ = 15 nm and Δλ = 60 nm. This indicated that the fluorescence of the Tyr and Trp residues in HSA was quenched, and there was a slight change in the microenvironment surrounding these residues.

2.4.3. Three-Dimensional Fluorescence Spectra and Analysis

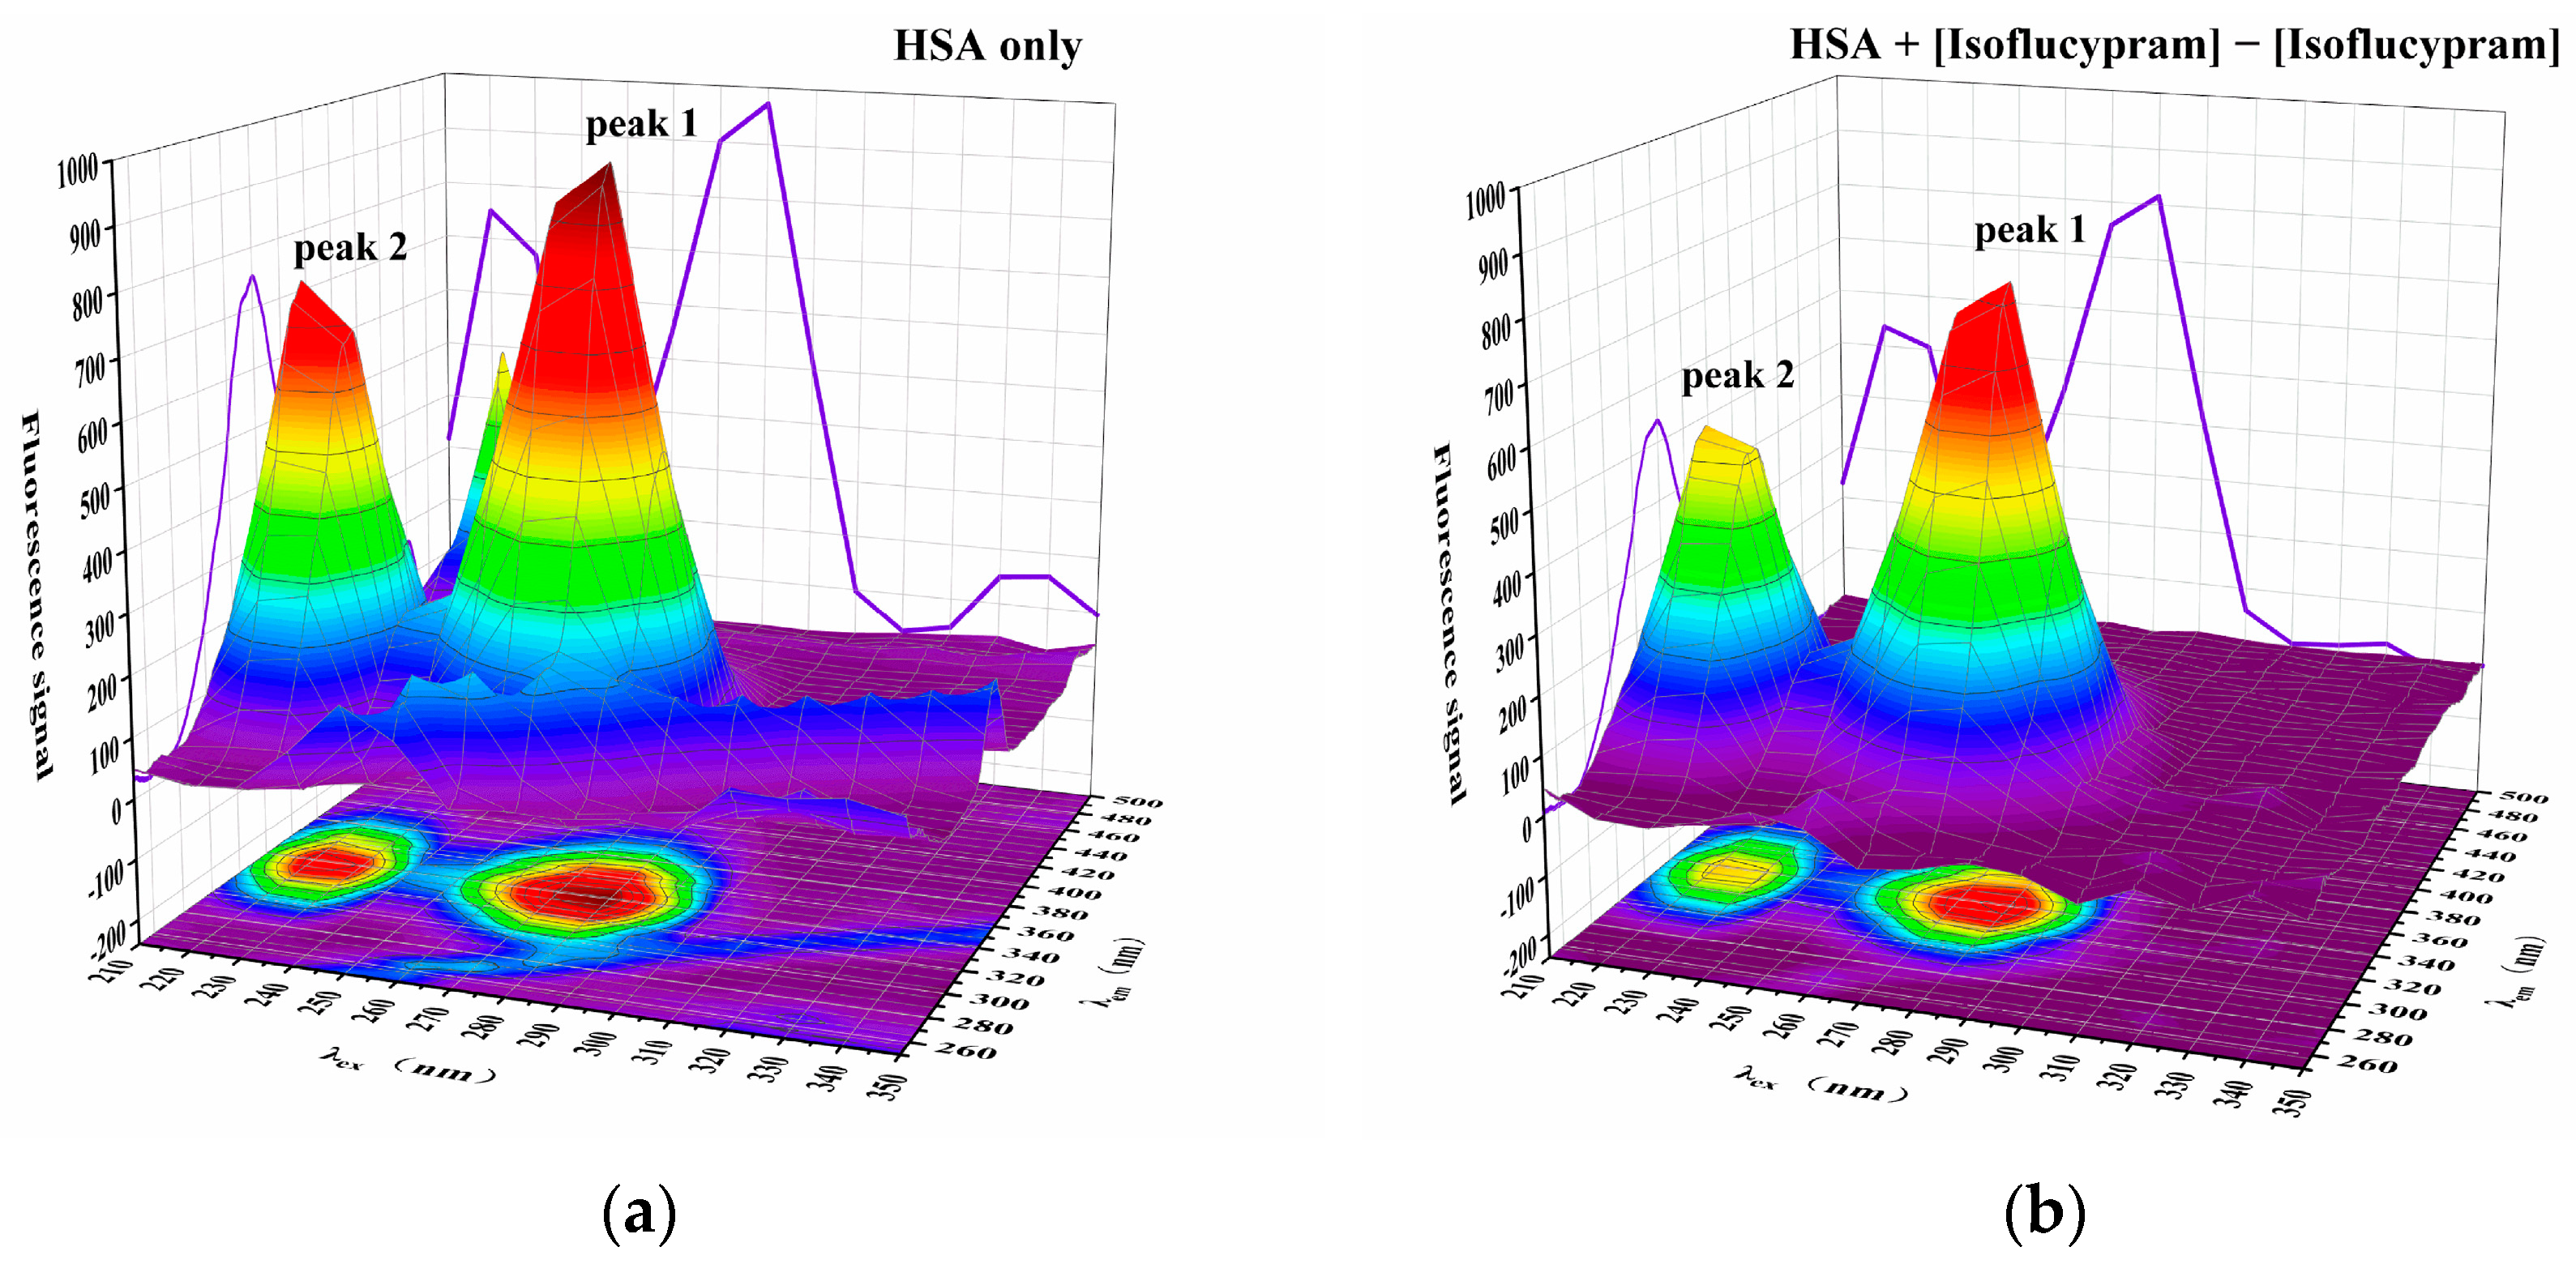
Protein conformational changes can be elucidated using three-dimensional (3D) fluorescence spectrum analysis [35]. Figure 7 displays the three-dimensional fluorescence spectra of conformational changes in HSA both before and after the addition of isoflucypram (a and b, respectively). The spectrum properties of the tryptophan and tyrosine residues were mainly revealed in peak 1, whereas the fluorescence spectral behavior of the polypeptide backbone structures was mainly demonstrated in peak 2. The fluorescence signal of peak 1 clearly decreased with the addition of isoflucypram, showing an increase in the polarity of the environment around the tryptophan and tyrosine residues. The fluorescence signal of peak 2 decreased, suggesting that the polypeptide structure of HSA had been altered.

2.4.4. FT-IR Spectra and Analysis

Infrared spectroscopy can reveal the amide bands of proteins and uncover the vibrations of peptides. For the characterization of protein structural changes, especially the determination of secondary structures, FT-IR spectroscopy is widely used [27]. Since the intensity of the amide I band demonstrates sensitive dependency on the protein backbone, several studies have concentrated on this band [36,37]. IR band frequencies resulting from amide I band (1600–1700 cm−1) vibrations provide a large amount of information about the secondary protein structure. The amide I peak has been further divided into four structural units: α-helix (1650–1658 cm−1), β-sheet (1610–1640 cm−1), β-turn (1660–1700 cm−1), and random coil (1640–1650 cm−1) [38].
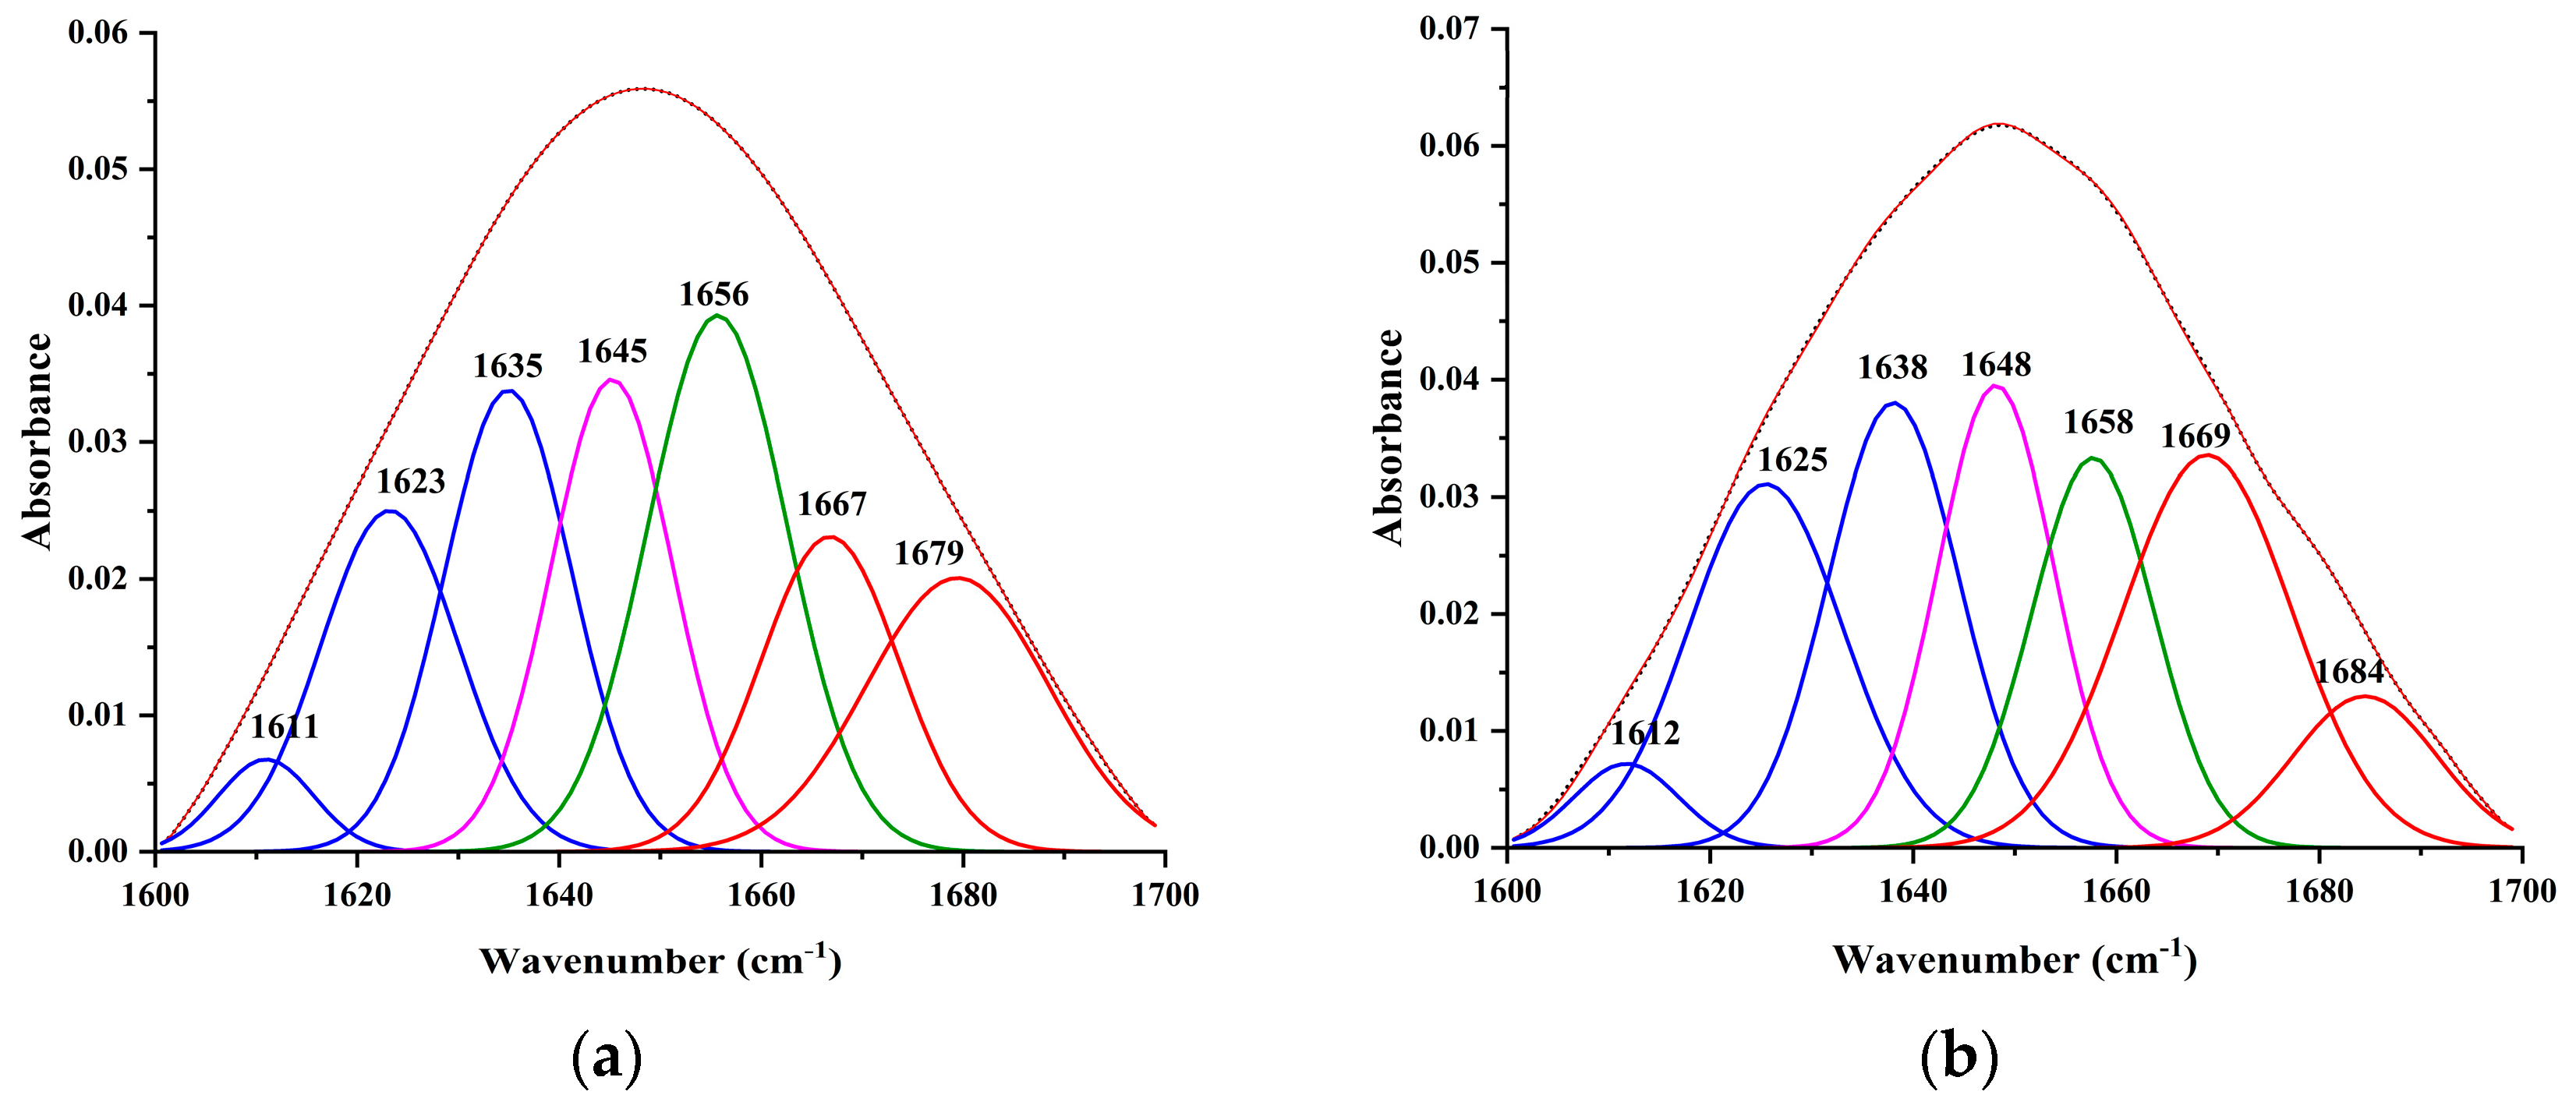
The FT-IR fitting curves for HSA in the presence and absence of ligands are displayed in Figure 8. With the addition of isoflucypram, the peak at 1610.96 cm−1 shifted to 1611.74 cm−1, the peak at 1623.22 cm−1 shifted to 1625.48 cm−1, the peak at 1634.95 cm−1 shifted to 1638.07 cm−1, the peak at 1645.22 cm−1 shifted to 1648.13 cm−1, the peak at 1655.67 cm−1 changed to 1657.71, the peak at 1666.79 cm−1 changed to 1668.95 cm−1, and the peak at 1679.42 cm−1 increased to 1684.49 cm−1. The positions of these peaks were red-shifted, indicating that the secondary structure of HSA was altered by the addition of ISO. These adjustments in peak position showed that ligand binding to HSA had some effect on the protein’s structural dynamics. Due to interactions with the addition of isoflucypram (Table 3), the content of the α-helix clearly dropped from 22.04% to 15.22%. In contrast, the content of the β-turn, β-sheet, and the random coil increased from 33.63% to 39.35%, 27.49% to 28.24%, and 16.84% to 17.19%, respectively. These results indicated that with the addition of isoflucypram, the secondary structure of HSA was altered from an α-helix to a β-turn, β-sheet, and random coil, and the structure of HSA loosened. The above findings further clarified that isoflucypram and HSA can be combined.

2.4.5. CD Spectrum and Analysis

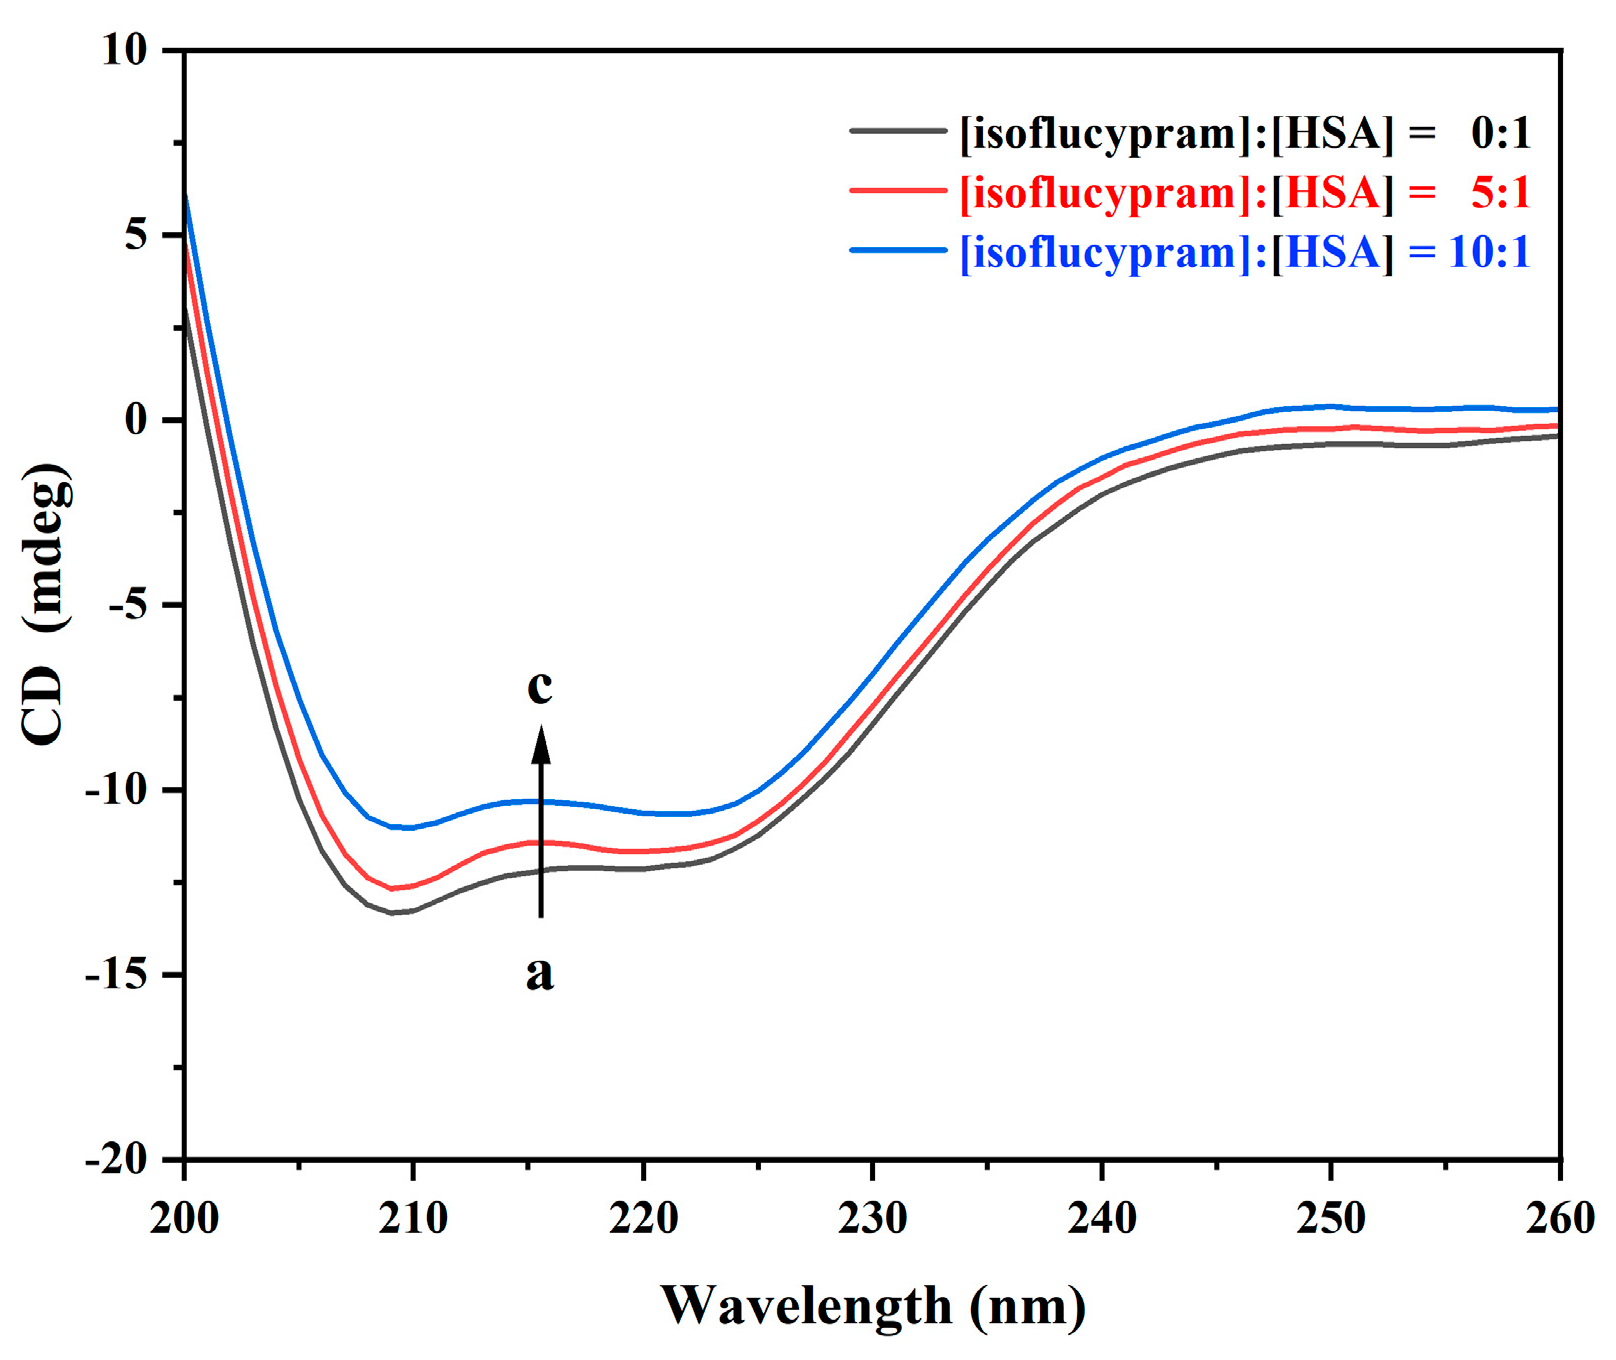
Circular dichroism (CD) spectroscopy is a valuable method for analyzing changes in the secondary structure of proteins [39]. As shown in Figure 9, the CD spectrum of HSA exhibited a negative Cotton effect at 208 nm and 222 nm, indicating the presence of an α-helical structure, which is a typical secondary structure of proteins. However, the negative Cotton effect of HSA at these wavelengths was diminished with the addition of isoflucypram. This decrease suggested a change in the protein’s secondary structure induced by the drug. Although the negative Cotton effect of HSA was reduced by isoflucypram, the shape of the CD spectrum did not change, indicating that the protein’s secondary structure was still dominated by the α-helix structure. The mean residue ellipticity (MRE) is a commonly used parameter for quantifying the magnitude of protein CD spectra. It can provide valuable information on the degree of structural change induced by a drug or other perturbations. The mean residue ellipticity (MRE) in the following formula is commonly used to represent the extent of protein circular dichroism in the study of circular dichroism:
MRE = ObservedCD(mdeg)/(10 Cpnl)
In this equation, Cp is the molar concentration of HAS (2.0 × 10⁻⁶ M), n is the number of amino acid residues (585 for HSA), and l is the path length (1 mm). The α-helix contents of the free and bound HSA were calculated from MRE values at 208 nm using the following equation [40]:
α − helix(%) = [(−MRE208 − 4000) × 100]/(33,000 − 4000)
In the equation, MRE208 is the actual MRE value measured at 208 nm, 4000 refers to the MRE value of the random coil conformation at 208 nm, and 33,000 is the MRE value of a pure α-helix at 208 nm.
Figure 9 shows the CD spectra of HSA at 200–260 nm, with and without isoflucypram. By using the above formula, we found that the α-helix content of HSA was calculated to be reduced from 55.85% to 52.12% and 42.66% at isoflucypram/HSA molar ratios of 5:1 and 10:1, respectively. The decreasing α-helix content suggested that the binding of isoflucypram to HSA induced a modicum of unfolding in the constituent polypeptides, thereby changing the secondary HSA structure. HSA is the most significant protein for storage and transport in the human blood circulatory system [41]. Alterations in the secondary structure of HSA may affect the transport and metabolism of other compounds in the blood.

3. Materials and Methods

3.1. Reagents and Chemicals

Isoflucypram was obtained from the Dr. Ehenstorfer GmbH company (Augsbur, Germany). HSA (purity 96%, with a molar mass of 66.5 kDa) was purchased from Beijing Solarbio Science & Technology Co., Ltd. (Beijing, China) and dissolved in 0.02 M phosphate-buffered saline (PBS, pH 7.4), which was bought from Leagene Biotechnology Corporation (Beijing, China) and stored at 4 °C in the dark. The maximum amount of ethanol added to the HSA solution was 3% to ensure that it would not have an impact on the HSA. The water used in all of the tests was double distilled, and all the other reagents were of analytical grade.

3.2. Molecular Docking

Molecular docking is one of the most important tools for studying drug–protein interactions [42,43]. Molecular docking technology is based on the “Key–Lock principle” [44], in which rigid docking, semi-flexible docking, and flexible docking are the main molecular docking methods. The X-ray crystal structure of HSA was downloaded from the RCSB Protein data bank (http://www.rcsb.org/ (accessed on 6 July 2023)) with PDB ID: 1AO6 at a 2.50 Å resolution. The protonation state of isoflucypram was set at pH = 7.4, and the compounds were expanded to 3D structures using Open Babel [45]. The HSA had the water molecules removed, polar hydrogen was added, Gasteiger charges were added, and the atom type was assigned as the AD4 type by AutoDock Tools (ADT3). Isoflucypram was identified in ligand pdb files after following the same steps as those for HSA. The grid spacing parameter (1 Å) and a grid box of 50, 48, and 52 Å were used to investigate the most likely binding position. AutoDock Vina (1.2.0) was used to run the blind docking calculations [46,47]. The number of modes was set to nine to find the most likely binding position. After the analysis, the most reasonable site for the binding of isoflucypram and HSA was selected. We selected Pymol to visualize the complex [48].

3.3. Molecular Dynamics Simulation

The molecular dynamics simulations were carried out using Desmond/Maestro noncommercial version 2022.1 as the molecular dynamic software [49]. TIP3P water molecules were added to the systems, which were then neutralized by a 0.15 M NaCl solution. After the minimization and relaxation of the system, the production simulation was performed for 100 ns in an isothermal–isobaric ensemble at 310 K and 1 bar. The trajectory coordinates were recorded every 100 ps. The molecular dynamics analysis was performed using the Simulation Interaction Diagram from Desmond.

3.4. Fluorescence Spectroscopy

All the fluorescence spectra were obtained using a FL6500 fluorescence spectrophotometer (PerkinElmer, America) equipped with 1.0 cm quartz cells. Fluorescence titrations were conducted by fixing the HSA concentration at 5 × 10⁻⁷ M while varying the isoflucypram concentration from 0 to 105 × 10−7 M. An excitation wavelength of 280 nm was employed, and the emission spectra were recorded from 300 nm to 500 nm. The excitation and emission slit widths were 20 nm. The fluorescence signals of a series of assay samples were recorded after preheating for 2 min at 296 K, 303 K, and 310 K. The following equation was used to account for the inner filter effect in the fluorescence signals [50,51]:
Fcor = Fobsexp[Aex + Aem/2]
In this formula, Fcor and Fobs are the corrected and observed fluorescence signals, respectively, and Aex and Aem are the system absorbances at excitation and emission wavelengths, respectively.

3.5. UV-Vis Absorption Spectroscopy

UV-vis absorption spectra were acquired using a UV-vis spectrophotometer (UV1800, Shimadzu, Japan) with 10 mm quartz cells. The UV-vis spectra of HSA with the addition of different isoflucypram concentrations were recorded in the range of 200–320 nm at 310 K. The experiment was performed by keeping the concentration of HSA constant at 5.0 × 10⁻⁶ M while varying the concentration of isoflucypram from 0 to 175 × 10−6 M at 310 K. The wavelength interval was set to 0.5 nm, and the slit width was set to 2 nm.

3.6. Synchronous Fluorescence Spectroscopy

Synchronous fluorescence spectra of HSA in the absence and presence of different isoflucypram concentrations were recorded by scanning the excitation and emission spectra simultaneously, in the range of 200 to 300 nm at 310 K. The wavelength intervals (Δλ) between excitation and emission were set to 15 nm and 60 nm, respectively. The concentration of HSA was kept at 2 × 10⁻⁶ M with 0 to 18 × 10−6 M pesticide when Δλ = 15 nm, and was kept at 2 × 10⁻⁶ M with 0 to 48 × 10−6 M pesticide when Δλ = 60 nm.

3.7. Three-Dimensional Fluorescence Spectroscopy

The fluorescence spectra of a mixture of 1 × 10⁻⁴ M HSA and 1 × 10⁻² M isoflucypram were measured at 310 K using a three-dimensional fluorescence spectrometer. The emission wavelength was recorded from 250 nm to 500 nm. The slit widths for excitation and emission were both 20 nm, and the initial excitation wavelength was set at 210 nm with a 1 nm step.

3.8. Fourier Transform Infrared Spectroscopy

FT-IR spectra were recorded on a Nicolet IS5 FT-IR spectrometer (Thermo Fisher Scientific, Waltham, MA, USA). Prior to the FT-IR spectroscopy measurements, the solutions were preheated at 310 K for 3 min. In a buffer of 0.02 M PBS, the FT-IR spectra of HSA (2.0 × 10⁻⁴ M) in the absence and presence of isoflucypram (2.0 × 10⁻⁴ M) were collected, and background spectra were collected before each measurement. At a resolution of 4 cm−1 and an average of 64 scans, all the spectra were collected between 1800 and 700 cm−1.

3.9. CD Spectroscopy

CD spectra were collected using a CD spectrometer (Chirascan, Applied Photophysics Ltd., UK). The spectra were recorded in a 1 mm path-length cell under a nitrogen atmosphere. The CD spectra of HSA were recorded at a wavelength between 200 nm and 260 nm in the absence and presence of isoflucypram (pH = 7.4) at 310 K. The HSA concentration was kept constant at 2 × 10⁻⁶ M, and the ratios of pesticide to HSA were 0:1, 5:1, and 10:1.

4. Conclusions

The molecular docking and molecular dynamics simulation results showed that the HSA binding of isoflucypram was due to binding forces that included hydrophobic interactions, hydrogen bonding, and water bridges. The multispectral research focused on two aspects: a discussion of the interaction mechanisms and a conformational alteration study. The mechanism of the interaction between isoflucypram and HSA was mixed (static and dynamic) quenching. The distance (r) between the binding position of isoflucypram and HSA was 20.17 Å. The interaction between isoflucypram and HSA tended to occur spontaneously in thermodynamics. UV-visible absorption, synchronous fluorescence, and 3D fluorescence spectra supported the idea that the Tyr and Trp microenvironment near the aromatic amino acids of HSA and the polypeptide structure changed slightly. CD spectra and FT-IR spectra showed that the α-helix content of HSA was reduced, and the β-turn, β-sheet, and random coil contents were increased after the addition of isoflucypram. These results further elucidated that isoflucypram can bind with HSA. This study suggests that human exposure to isoflucypram may affect metabolism by influencing the structure of HSA. Finally, these research results support our assessment of the toxicity risks, showing that isoflucypram exposure poses a risk to human health, which can inform future research.

Author Contributions

Conceptualization, H.Y. and X.Y.; methodology, X.L., H.Y. and X.Y.; software, X.L.; validation, D.Y. and S.C.; formal analysis, H.Y. and X.Y.; investigation, X.L. and X.Y.; resources, H.Y. and X.Y.; data curation, X.L.; writing—original draft preparation, X.L. and X.Y.; writing—review and editing, X.Y. and H.Y.; visualization, S.C. and D.Y.; supervision, H.Y.; project administration, X.Y.; funding acquisition, X.Y. and H.Y. All authors have read and agreed to the published version of the manuscript.

Funding

This research was funded by the National Natural Science Foundation of China (NSFC) (No. 32072468).

Institutional Review Board Statement

Not applicable.

Informed Consent Statement

Not applicable.

Data Availability Statement

The data are contained within the article.

Conflicts of Interest

The authors declare no conflict of interest.

References

  1. Storck, V.; Gallego, S.; Vasileiadis, S.; Hussain, S.; Beguet, J.; Rouard, N.; Baguelin, C.; Perruchon, C.; Devers-Lamrani, M.; Karpouzas, D.G. Insights into the Function and Horizontal Transfer of Isoproturon Degradation Genes (pdmAB) in a Biobed System. Appl. Environ. Microb. 2020, 86, e00474-20. [Google Scholar] [CrossRef]
  2. Ranz, R.E.R. Insecticides: Impact and Benefits of Its Use for Humanity, 3rd ed.; IntechOpen: London, UK, 2022; pp. 245–270. [Google Scholar]
  3. Da Costa, G.V.; Neto, M.F.A.; Da Silva, A.K.P.; De Sa, E.M.F.; Cancela, L.C.F.; Vega, J.S.; Lobato, C.M.; Zuliani, J.P.; Espejo-Roman, J.M.; Campos, J.M.; et al. Identification of Potential Insect Growth Inhibitor against Aedes aegypti: A Bioinformatics Approach. Int. J. Mol. Sci. 2022, 23, 8218. [Google Scholar] [CrossRef]
  4. Clark, R.D. Predicting mammalian metabolism and toxicity of pesticides in silico. Pest Manag. Sci. 2018, 74, 1992–2003. [Google Scholar] [CrossRef] [Green Version]
  5. Desbordes, P.; Essigmann, B.; Gary, S.; Gutbrod, O.; Maue, M.; Schwarz, H.G. Isoflucypram, the first representative of a new succinate dehydrogenase inhibitor fungicide subclass: Its chemical discovery and unusual binding mode. Pest Manag. Sci. 2020, 76, 3340–3347. [Google Scholar] [CrossRef]
  6. Yanicostas, C.; Soussi-Yanicostas, N. SDHI Fungicide Toxicity and Associated Adverse Outcome Pathways: What Can Zebrafish Tell Us? Int. J. Mol. Sci. 2021, 22, 12362. [Google Scholar] [CrossRef]
  7. Chen, X.; Li, W.H. Isoflucypram cardiovascular toxicity in zebrafish (Danio rerio). Sci. Total Environ. 2021, 787, 147529. [Google Scholar] [CrossRef]
  8. Xiao, P.; Liu, X.; Zhang, H.; Li, W.H. Chronic toxic effects of isoflucypram on reproduction and intestinal energy metabolism in zebrafish (Danio rerio). Environ. Pollut. 2022, 315, 120479. [Google Scholar] [CrossRef]
  9. Ascenzi, P.; Fanali, G.; Fasano, M.; Pallottini, V.; Trezza, V. Clinical relevance of drug binding to plasma proteins. J. Mol. Struct. 2014, 1077, 4–13. [Google Scholar] [CrossRef]
  10. Zhu, C.L.; Liu, F.R.; Wei, Y.L.; Zhang, F.; Pan, T.; Ye, Y.W.; Shen, Y.Z. Evaluating the potential risk by probing the site-selective binding of rutin-Pr(III) complex to human serum albumin. Food Chem. Toxicol. 2021, 148, 111927. [Google Scholar] [CrossRef]
  11. Szkudlarek, A.; Pentak, D.; Ploch, A.; Pozycka, J.; Maciazek-Jurczyk, M. In Vitro Investigation of the Interaction of Tolbutamide and Losartan with Human Serum Albumin in Hyperglycemia States. Molecules 2017, 22, 2249. [Google Scholar] [CrossRef] [Green Version]
  12. Curry, S. Lessons from the Crystallographic Analysis of Small Molecule Binding to Human Serum Albumin. Drug Metab. Pharmacokinet. 2009, 24, 342–357. [Google Scholar] [CrossRef] [Green Version]
  13. Sugio, S.; Kashima, A.; Mochizuki, S.; Noda, M.; Kobayashi, K. Crystal structure of human serum albumin at 2.5 angstrom resolution. Protein Eng. 1999, 12, 439–446. [Google Scholar] [CrossRef]
  14. Hu, Y.J.; Liu, Y.; Xiao, X.H. Investigation of the Interaction between Berberine and Human Serum Albumin. Biomacromolecules 2009, 10, 517–521. [Google Scholar] [CrossRef]
  15. Ploch-Jankowska, A.; Pentak, D.; Nycz, J.E. A Comprehensive Spectroscopic Analysis of the Ibuprofen Binding with Human Serum Albumin, Part II. Sci. Pharm. 2021, 89, 30. [Google Scholar] [CrossRef]
  16. Golianova, K.; Havadej, S.; Verebova, V.; Ulicny, J.; Holeckova, B.; Stanicova, J. Interaction of Conazole Pesticides Epoxiconazole and Prothioconazole with Human and Bovine Serum Albumin Studied Using Spectroscopic Methods and Molecular Modeling. Int. J. Mol. Sci. 2021, 22, 1925. [Google Scholar] [CrossRef]
  17. Zelonkova, K.; Havadej, S.; Verebova, V.; Holeckova, B.; Ulicny, J.; Stanicova, J. Fungicide Tebuconazole Influences the Structure of Human Serum Albumin Molecule. Molecules 2019, 24, 3190. [Google Scholar] [CrossRef] [Green Version]
  18. Sun, X.W.; Ferguson, H.N.; Hagerman, A.E. Conformation and Aggregation of Human Serum Albumin in the Presence of Green Tea Polyphenol (EGCg) and/or Palmitic Acid. Biomolecules 2019, 9, 705. [Google Scholar] [CrossRef] [Green Version]
  19. Jelicic, M.L.; Brusac, E.; Klaric, D.A.; Nigovic, B.; Turk, N.; Mornar, A. A chromatographic approach to development of 5-aminosalicylate/folic acid fixed-dose combinations for treatment of Crohn’s disease and ulcerative colitis. Sci. Rep. 2020, 10, 20838. [Google Scholar] [CrossRef]
  20. Pan, X.R.; Qin, P.F.; Liu, R.T.; Wang, J. Characterizing the Interaction between Tartrazine and Two Serum Albumins by a Hybrid Spectroscopic Approach. J. Agric. Food Chem. 2011, 59, 6650–6656. [Google Scholar] [CrossRef]
  21. Lakowicz, J.R.; Masters, B.R. Principles of Fluorescence Spectroscopy, 3rd ed.; Springer: Boston, MA, USA, 2006; pp. 278–281. [Google Scholar]
  22. Smolkova, R.; Zelenak, V.; Smolko, L.; Kuchar, J.; Rabajdova, M.; Ferencakova, M.; Marekova, M. Novel zinc complexes of a non-steroidal anti-inflammatory drug, niflumic acid: Structural characterization, human-DNA and albumin binding properties. Eur. J. Med. Chem. 2018, 153, 131–139. [Google Scholar] [CrossRef]
  23. Xu, L.; Hu, Y.X.; Li, Y.C.; Liu, Y.F.; Zhang, L.; Ai, H.X.; Liu, H.S. Study on the interaction of paeoniflorin with human serum albumin (HSA) by spectroscopic and molecular docking techniques. Chem. Cent. J. 2017, 11, 116. [Google Scholar] [CrossRef] [Green Version]
  24. Tang, Q.; Peng, X.J.; Cao, H.Y.; Yang, Y.J.; Ma, J.; Wang, J.Y.; Zheng, X.F. Site-Directed Mutagenesis of Myoglobin for Studies of Their Interaction with Iron(III) by Multi-Spectroscopic Techniques. J. Spectrosc. 2013, 2013, 314345. [Google Scholar] [CrossRef] [Green Version]
  25. Xu, L.; Hu, Y.X.; Li, Y.C.; Zhang, L.; Ai, H.X.; Liu, H.S.; Liu, Y.F.; Sang, Y.L. Study on the interaction of tussilagone with human serum albumin (HSA) by spectroscopic and molecular docking techniques. J. Mol. Struct. 2017, 1149, 645–654. [Google Scholar] [CrossRef]
  26. Zhou, W.N.; Peng, C.Y.; Wang, D.S.; Li, J.L.; Tu, Z.C.; Zhang, L. Interaction Mechanism between OVA and Flavonoids with Different Hydroxyl Groups on B-Ring and Effect on Antioxidant Activity. Foods 2022, 11, 1302. [Google Scholar] [CrossRef]
  27. Shahabadi, N.; Khorshidi, A.; Moghadam, N.H. Study on the interaction of the epilepsy drug, zonisamide with human serum albumin (HSA) by spectroscopic and molecular docking techniques. Spectrochim. Acta A 2013, 114, 627–632. [Google Scholar] [CrossRef]
  28. Zhu, M.Q.; Wang, L.J.; Wang, Y.; Zhou, J.; Ding, J.; Li, W.; Xin, Y.; Fan, S.S.; Wang, Z.; Wang, Y. Biointeractions of Herbicide Atrazine with Human Serum Albumin: UV-Vis, Fluorescence and Circular Dichroism Approaches. Int. J. Environ. Res. Public Health. 2018, 15, 116. [Google Scholar] [CrossRef] [Green Version]
  29. Lin, H.; Lan, J.F.; Guan, M.; Sheng, F.L.; Zhang, H.X. Spectroscopic investigation of interaction between mangiferin and bovine serum albumin. Spectrochim. Acta A 2009, 73, 936–941. [Google Scholar] [CrossRef]
  30. Lemli, B.; Derdak, D.; Laczay, P.; Kovacs, D.; Kunsagi-Mate, S. Noncovalent Interaction of Tilmicosin with Bovine Serum Albumin. Molecules 2018, 23, 1915. [Google Scholar] [CrossRef] [Green Version]
  31. Wang, K.; Wang, Z.; Xie, Y.H.; Xue, X.G.; Tang, S.F.; Hou, X.M. Molecular mechanism investigation on the interaction of Clothianidin with human serum albumin. Spectrosc. Lett. 2019, 52, 246–252. [Google Scholar] [CrossRef]
  32. Xu, H.L.; Yao, N.N.; Xu, H.R.; Wang, T.S.; Li, G.Y.; Li, Z.Q. Characterization of the Interaction between Eupatorin and Bovine Serum Albumin by Spectroscopic and Molecular Modeling Methods. Int. J. Mol. Sci. 2013, 14, 14185–14203. [Google Scholar] [CrossRef] [Green Version]
  33. Hashempour, S.; Shahabadi, N.; Adewoye, A.; Murphy, B.; Rouse, C.; Salvatore, B.A.; Stratton, C.; Mahdavian, E. Binding Studies of AICAR and Human Serum Albumin by Spectroscopic, Theoretical, and Computational Methodologies. Molecules 2020, 25, 5410. [Google Scholar] [CrossRef]
  34. Miller, J.N. Capillary separation methods: A key to high efficiency and improved detection capabilities. Analyst 1984, 109, 191–198. [Google Scholar] [CrossRef]
  35. Xiong, X.N.; He, J.W.; Yang, H.Q.; Tang, P.X.; Tang, B.; Sun, Q.M.; Li, H. Investigation on the interaction of antibacterial drug moxifloxacin hydrochloride with human serum albumin using multi-spectroscopic approaches, molecular docking and dynamical simulation. RSC Adv. 2017, 7, 48942–48951. [Google Scholar] [CrossRef] [Green Version]
  36. Barth, A.; Zscherp, C. What vibrations tell us about proteins. Q. Rev. Biophys. 2002, 35, 369–430. [Google Scholar] [CrossRef]
  37. Barth, A. Infrared spectroscopy of proteins. Biochim. Biophys. Acta BBA Bioenerg. 2007, 1767, 1073–1101. [Google Scholar] [CrossRef] [Green Version]
  38. Wang, Q.; Sun, Q.M.; Ma, X.L.; Rao, Z.S.; Li, H. Probing the binding interaction of human serum albumin with three bioactive constituents of Eriobotrta japonica leaves: Spectroscopic and molecular modeling approaches. J. Photochem. Photobiol. B 2015, 148, 268–276. [Google Scholar] [CrossRef]
  39. Szczukowski, L.; Krzyzak, E.; Zborowska, A.; Zajac, P.; Potyrak, K.; Peregrym, K.; Wiatrak, B.; Marciniak, A.; Swiatek, P. Design, Synthesis and Comprehensive Investigations of Pyrrolo[3,4-d]pyridazinone-Based 1,3,4-Oxadiazole as New Class of Selective COX-2 Inhibitors. Int. J. Mol. Sci. 2020, 21, 9623. [Google Scholar] [CrossRef]
  40. Shahabadi, N.; Hadidi, S.; Feizi, F. Study on the interaction of antiviral drug ‘Tenofovif’ with human serum albumin by spectral and molecular modeling methods. Spectrochim. Acta A 2015, 138, 169–175. [Google Scholar] [CrossRef]
  41. Xu, J.H.; Wang, M.Y.; Zheng, Y.Z.; Tang, L. Spectroscopic Technique-Based Comparative Investigation on the Interaction of Theaflavins with Native and Glycated Human Serum Albumin. Molecules 2019, 24, 3171. [Google Scholar] [CrossRef] [Green Version]
  42. Li, Z.Q.; Zhao, L.D.; Sun, Q.M.; Gan, N.; Zhang, Q.Y.; Yang, J.; Yi, B.; Liao, X.X.; Zhu, D.L.; Li, H. Study on the interaction between 2,6-dihydroxybenzoic acid nicotine salt and human serum albumin by multi-spectroscopy and molecular dynamics simulation. Spectrochim. Acta A 2022, 270, 120868. [Google Scholar] [CrossRef]
  43. Wu, J.; Bi, S.Y.; Sun, X.Y.; Zhao, R.; Wang, J.H.; Zhou, H.F. Study on the interaction of fisetholz with BSA/HSA by multi-spectroscopic, cyclic voltammetric, and molecular docking technique. J. Biomol. Struct. Dyn. 2019, 37, 3496–3505. [Google Scholar] [CrossRef]
  44. Fischer, E. Einfluss der Configuration auf die Wirkung der Enzyme. Berichte Dtsch. Chem. Ges. 2006, 27, 2985–2993. [Google Scholar] [CrossRef] [Green Version]
  45. O’Boyle, N.M.; Banck, M.; James, C.A.; Morley, C.; Vandermeersch, T.; Hutchison, G.R. Open Babel: An open chemical toolbox. J. Cheminform. 2011, 3, 33. [Google Scholar] [CrossRef] [Green Version]
  46. Eberhardt, J.; Santos-Martins, D.; Tillack, A.F.; Forli, S. AutoDock Vina 1.2.0: New Docking Methods, Expanded Force Field, and Python Bindings. J. Chem. Inf. Model. 2021, 61, 3891–3898. [Google Scholar] [CrossRef]
  47. Trott, O.; Olson, A.J. Software News and Update AutoDock Vina: Improving the Speed and Accuracy of Docking with a New Scoring Function, Efficient Optimization, and Multithreading. J. Comput. Chem. 2010, 31, 455–461. [Google Scholar]
  48. Lashkov, A.A.; Tolmachev, I.V.; Eistrikh-Heller, P.A.; Rubinsky, S.V. PyFepRestr: Plugin to PyMOL Molecular Graphics System for Calculating the Free Energy of Ligand-Receptor Binding. Crystallogr. Rep. 2021, 66, 861–865. [Google Scholar] [CrossRef]
  49. Bowers, K.J.; Chow, D.E.; Xu, H.; Dror, R.O.; Eastwood, M.P.; Gregersen, B.A.; Klepeis, J.L.; Kolossvary, I.; Moraes, M.A.; Sacerdoti, F.D.; et al. In Scalable Algorithms for Molecular Dynamics Simulations on Commodity Clusters. In Proceedings of the 2006 ACM/IEEE Conference on Supercomputing, New York, NY, USA, 11–17 November 2006. [Google Scholar]
  50. Gu, Q.; Kenny, J.E. Improvement of Inner Filter Effect Correction Based on Determination of Effective Geometric Parameters Using a Conventional Fluorimeter. Anal. Chem. 2009, 81, 420–426. [Google Scholar] [CrossRef]
  51. Wang, W.J.; Gan, N.; Sun, Q.M.; Wu, D.; Gan, R.X.; Zhang, M.; Tang, P.X.; Li, H. Study on the interaction of ertugliflozin with human serum albumin in vitro by multispectroscopic methods, molecular docking, and molecular dynamics simulation. Spectrochim. Acta A 2019, 219, 83–90. [Google Scholar] [CrossRef]
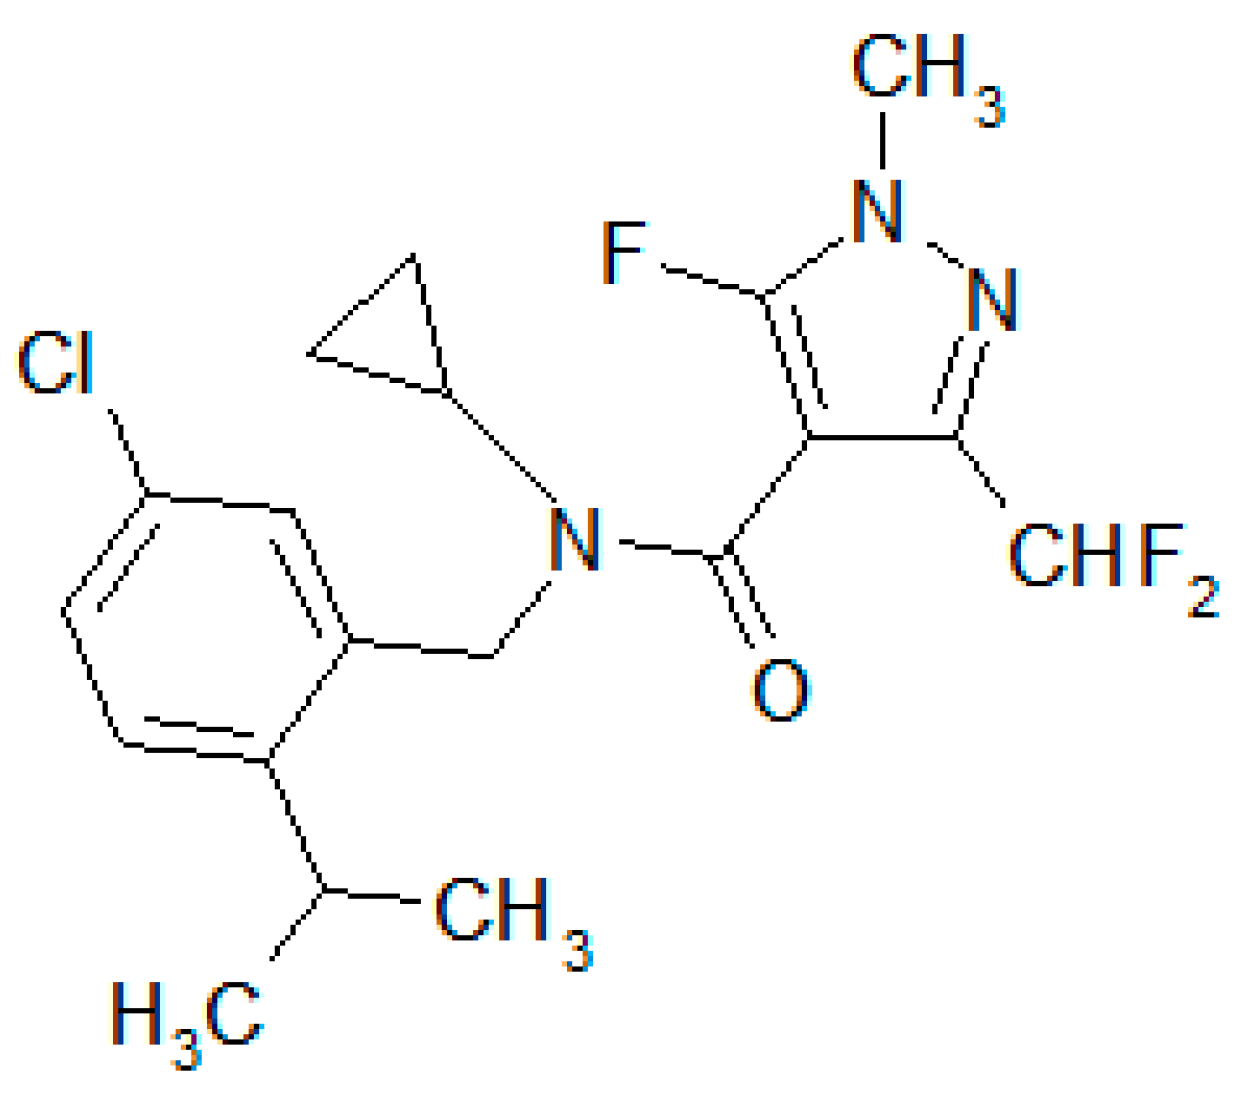
Figure 1. Chemical structure of isoflucypram.
Ijms 24 12521 g001
Figure 2. Schematic diagram of the optimal isoflucypram–HSA conformation generated by AutoDock Vina 1.1.2.
Ijms 24 12521 g002
Figure 3. Molecular dynamics simulation results for isoflucypram and HSA. (a) RMSD; (b) HSA RMSF; (c) isoflucypram RMSF; (d) the connection between the ligand and protein.
Ijms 24 12521 g003aIjms 24 12521 g003b
Figure 4. Fluorescence spectroscopy of the interaction between isoflucypram and HSA. (a) Fluorescence emission spectra of the interaction between isoflucypram and HSA. (b) Stern–Volmer plots of the interaction. (c) Plots of log[(F0 − F)/F] versus log[Q] of the interaction. (d) Plot of lnK versus 1/T based on the Van’t Hoff equation. (e) HSA’s fluorescence spectrum overlaps with isoflucypram’s UV-vis absorption spectrum. (a–i) 5 × 10⁻⁷ M HSA with the presence of 0–105 × 10−7 M isoflucypram; (j) 5 × 10⁻⁷ M isoflucypram; [Q]—isoflucypram concentration; F0/F—HSA fluorescence signal in the presence or absence of isoflucypram. K—binding constant (Ka); T—absolute temperature, pH = 7.4.
Ijms 24 12521 g004
Figure 5. Ultraviolet-visible spectra of HSA in the presence of various concentrations of isoflucypram. (a) 5 × 10⁻⁶ M HSA only; (b–i) 5 × 10⁻⁶ M HSA in the presence of 5, 25, 50, 75, 100, 125, 150, and 175 × 10−6 M isoflucypram; (j) 5 × 10⁻⁶ M isoflucypram only, pH = 7.4, T = 310 K.
Ijms 24 12521 g005
Figure 6. Synchronous fluorescence spectrum of HSA in the absence and presence of a range of concentrations of isoflucypram. (a–i) HSA with various concentrations of isoflucypram. The HSA concentration is 2 × 10⁻⁶, pH = 7.4, T = 310 K. (a) When Δλ is 15 nm, the ratio of isoflucypram to HSA is 0:1, 2:1, 3:1, 4:1, 5:1, 6:1, 7:1, 8:1, and 9:1. (b) When Δλ is 60 nm, the ratio of isoflucypram to HSA is 0:1, 3:1, 6:1, 9:1, 12:1, 15:1, 18:1, 21:1, and 24:1.
Ijms 24 12521 g006
Figure 7. Three-dimensional fluorescence spectra of HSA in the absence and presence of isoflucypram. (a) 1 × 10⁻⁴ M has; (b) 1 × 10⁻⁴ M HSA with 1 × 10⁻² M isoflucypram, pH = 7.4, T = 310 K.
Ijms 24 12521 g007
Figure 8. Curve-fitting of amide I region (1700–1600 cm−1) and determination of the secondary structure of free HAS. (a) 4 × 10⁻⁴ M HSA only; (b) 4 × 10⁻⁴ M HSA. The molar ratio of isoflucypram to HSA was 1:1, pH = 7.4, T = 310 K.
Ijms 24 12521 g008
Figure 9. Circular dichroism spectra of HSA with various concentrations of isoflucypram. (a) 2 × 10⁻⁶ M HSA only, (bc) 2 × 10⁻⁶ M HSA. The molar ratios for isoflucypram to HSA were 5:1 and 10:1, pH = 7.4, T = 310 K.
Ijms 24 12521 g009
Table 1. Stern–Volmer correlation constants and binding constants associated with the HSA–isoflucypram systems, as determined using fluorescence spectroscopy.
T (K)Ksv (104 M−1)R2Kq (1012 M−1·s−1)nKa (103 M−1)
296 K1.593 ± 0.0730.994 1.593 ± 0.0730.901 ± 0.0114.923 ± 0.619
303 K1.619 ± 0.0270.999 1.619 ± 0.0270.803 ± 0.0060.664 ± 0.037
310 K1.832 ± 0.0760.995 1.832 ± 0.0760.577 ± 0.0060.158 ± 0.011
Table 2. Thermodynamic parameters, binding distance, and non-radiative energy transfer of the HSA–isoflucypram system, as determined using fluorescence spectroscopy.
T (K)ΔH0
(KJ·mol−1)
ΔS0
(J·mol−1·K−1)
ΔG0
(KJ·mol−1)
J
(cm3·L·mol−1)
R0
(nm)
Er
(nm)
310 K−187.549−563.59−12.8361.183 × 10−171.1703.67%2.017
Table 3. Average percentages of the secondary structures of HSA after the addition of isoflucypram.
Secondary Structures (%)Only HSAIsoflucypram + HSA
α-helix22.04%15.22%
β-sheet33.63%39.35%
β-turn27.49%28.24%
random coil16.84%17.19%
Disclaimer/Publisher’s Note: The statements, opinions and data contained in all publications are solely those of the individual author(s) and contributor(s) and not of MDPI and/or the editor(s). MDPI and/or the editor(s) disclaim responsibility for any injury to people or property resulting from any ideas, methods, instructions or products referred to in the content.