
Proteomic Analysis of Dysfunctional Liver Sinusoidal Endothelial Cells Reveals Substantial Differences in Most Common Experimental Models of Chronic Liver Diseases

 , , ,
, , , 
Abstract
1. Introduction
2. Results
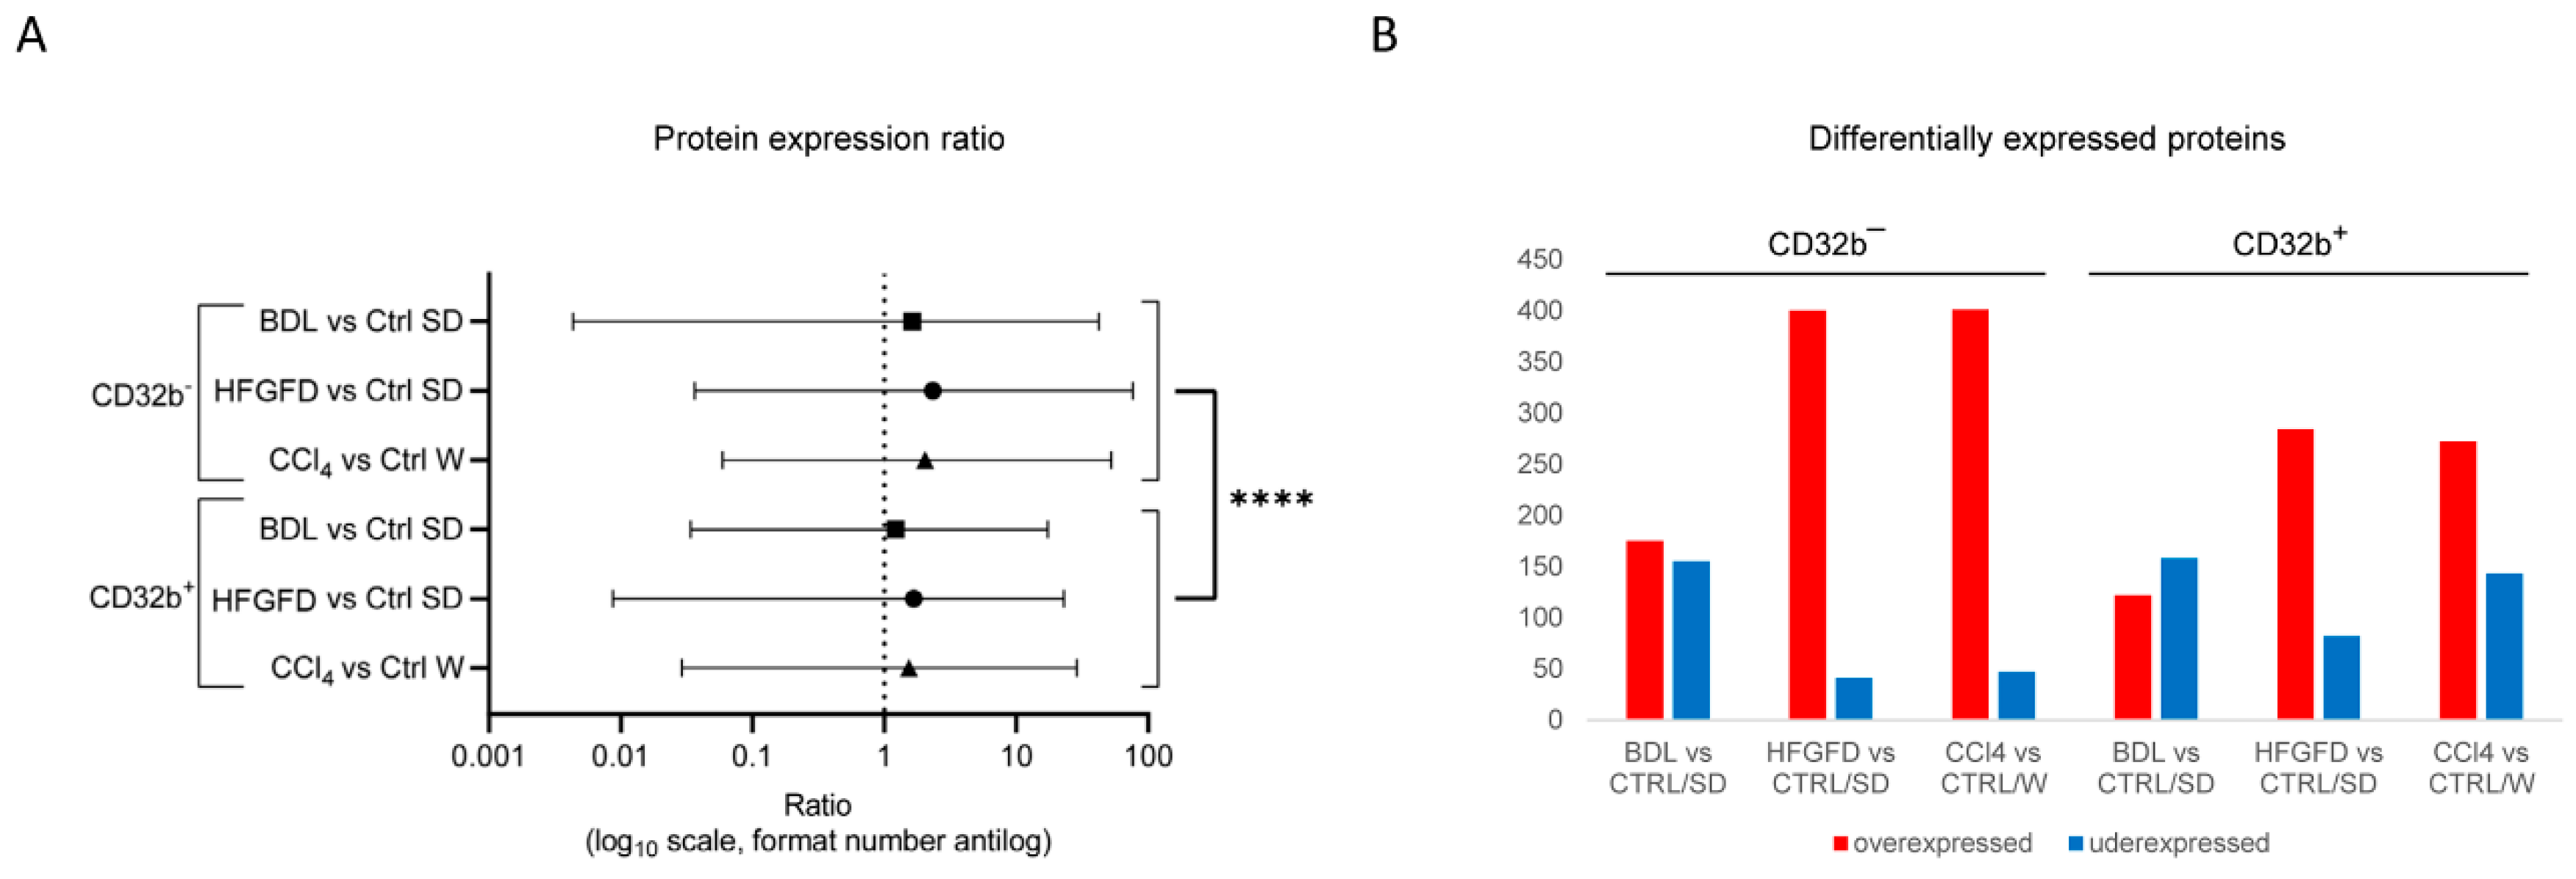
2.1. LSEC Sorting
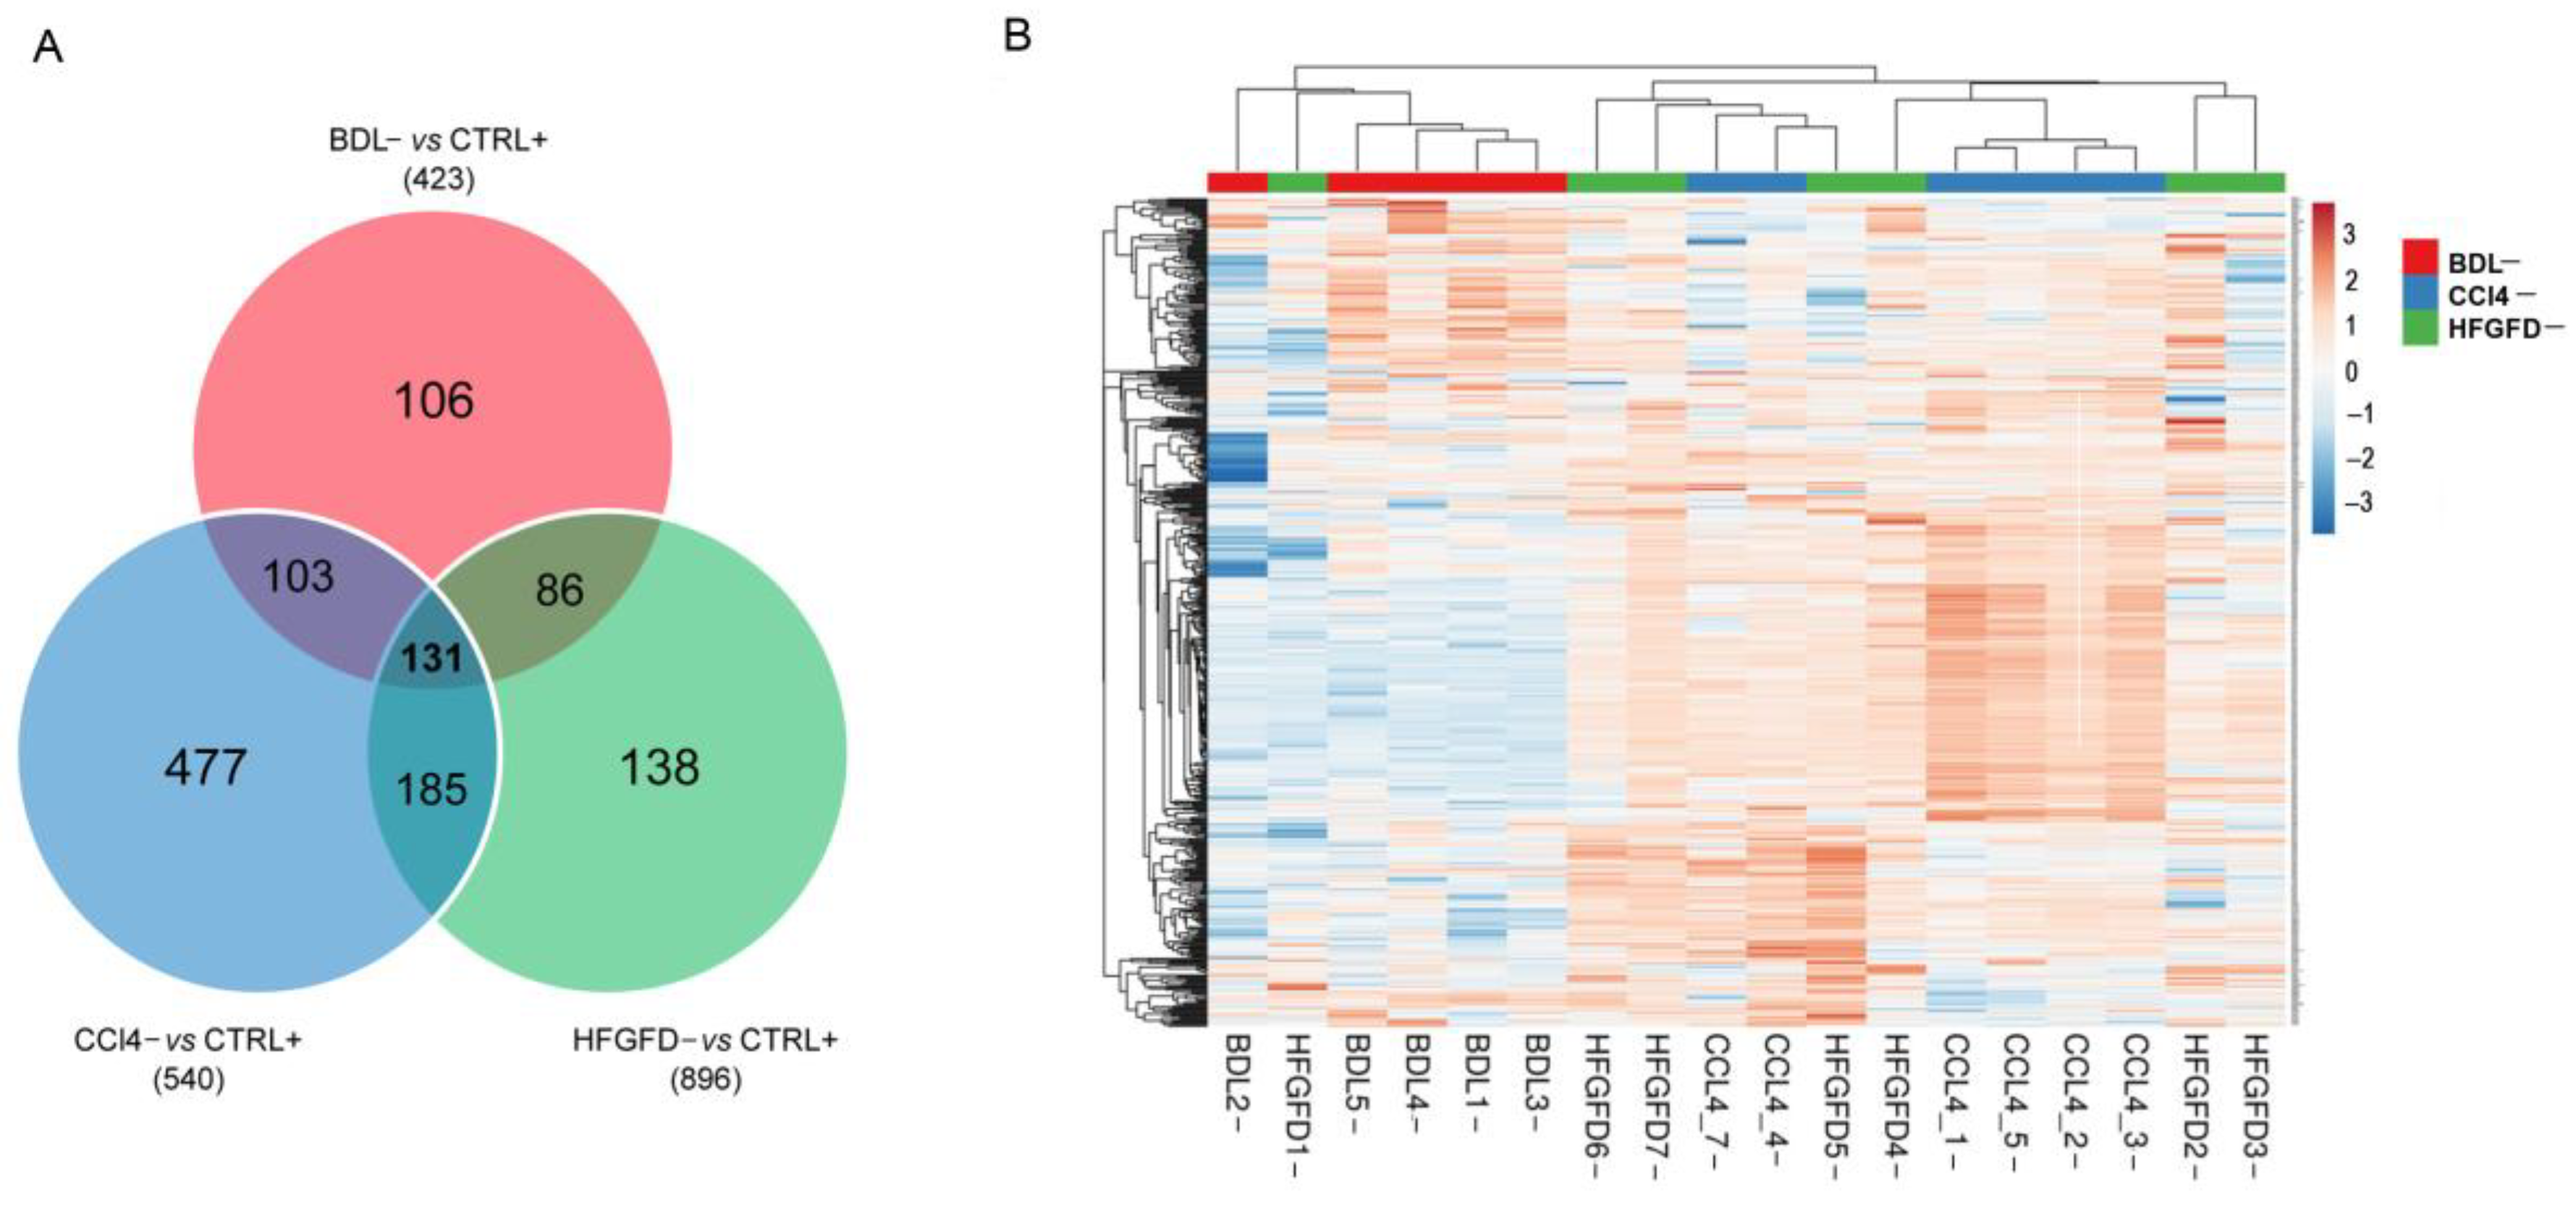
2.2. Differential Proteomic Expression
2.3. Biological Significance
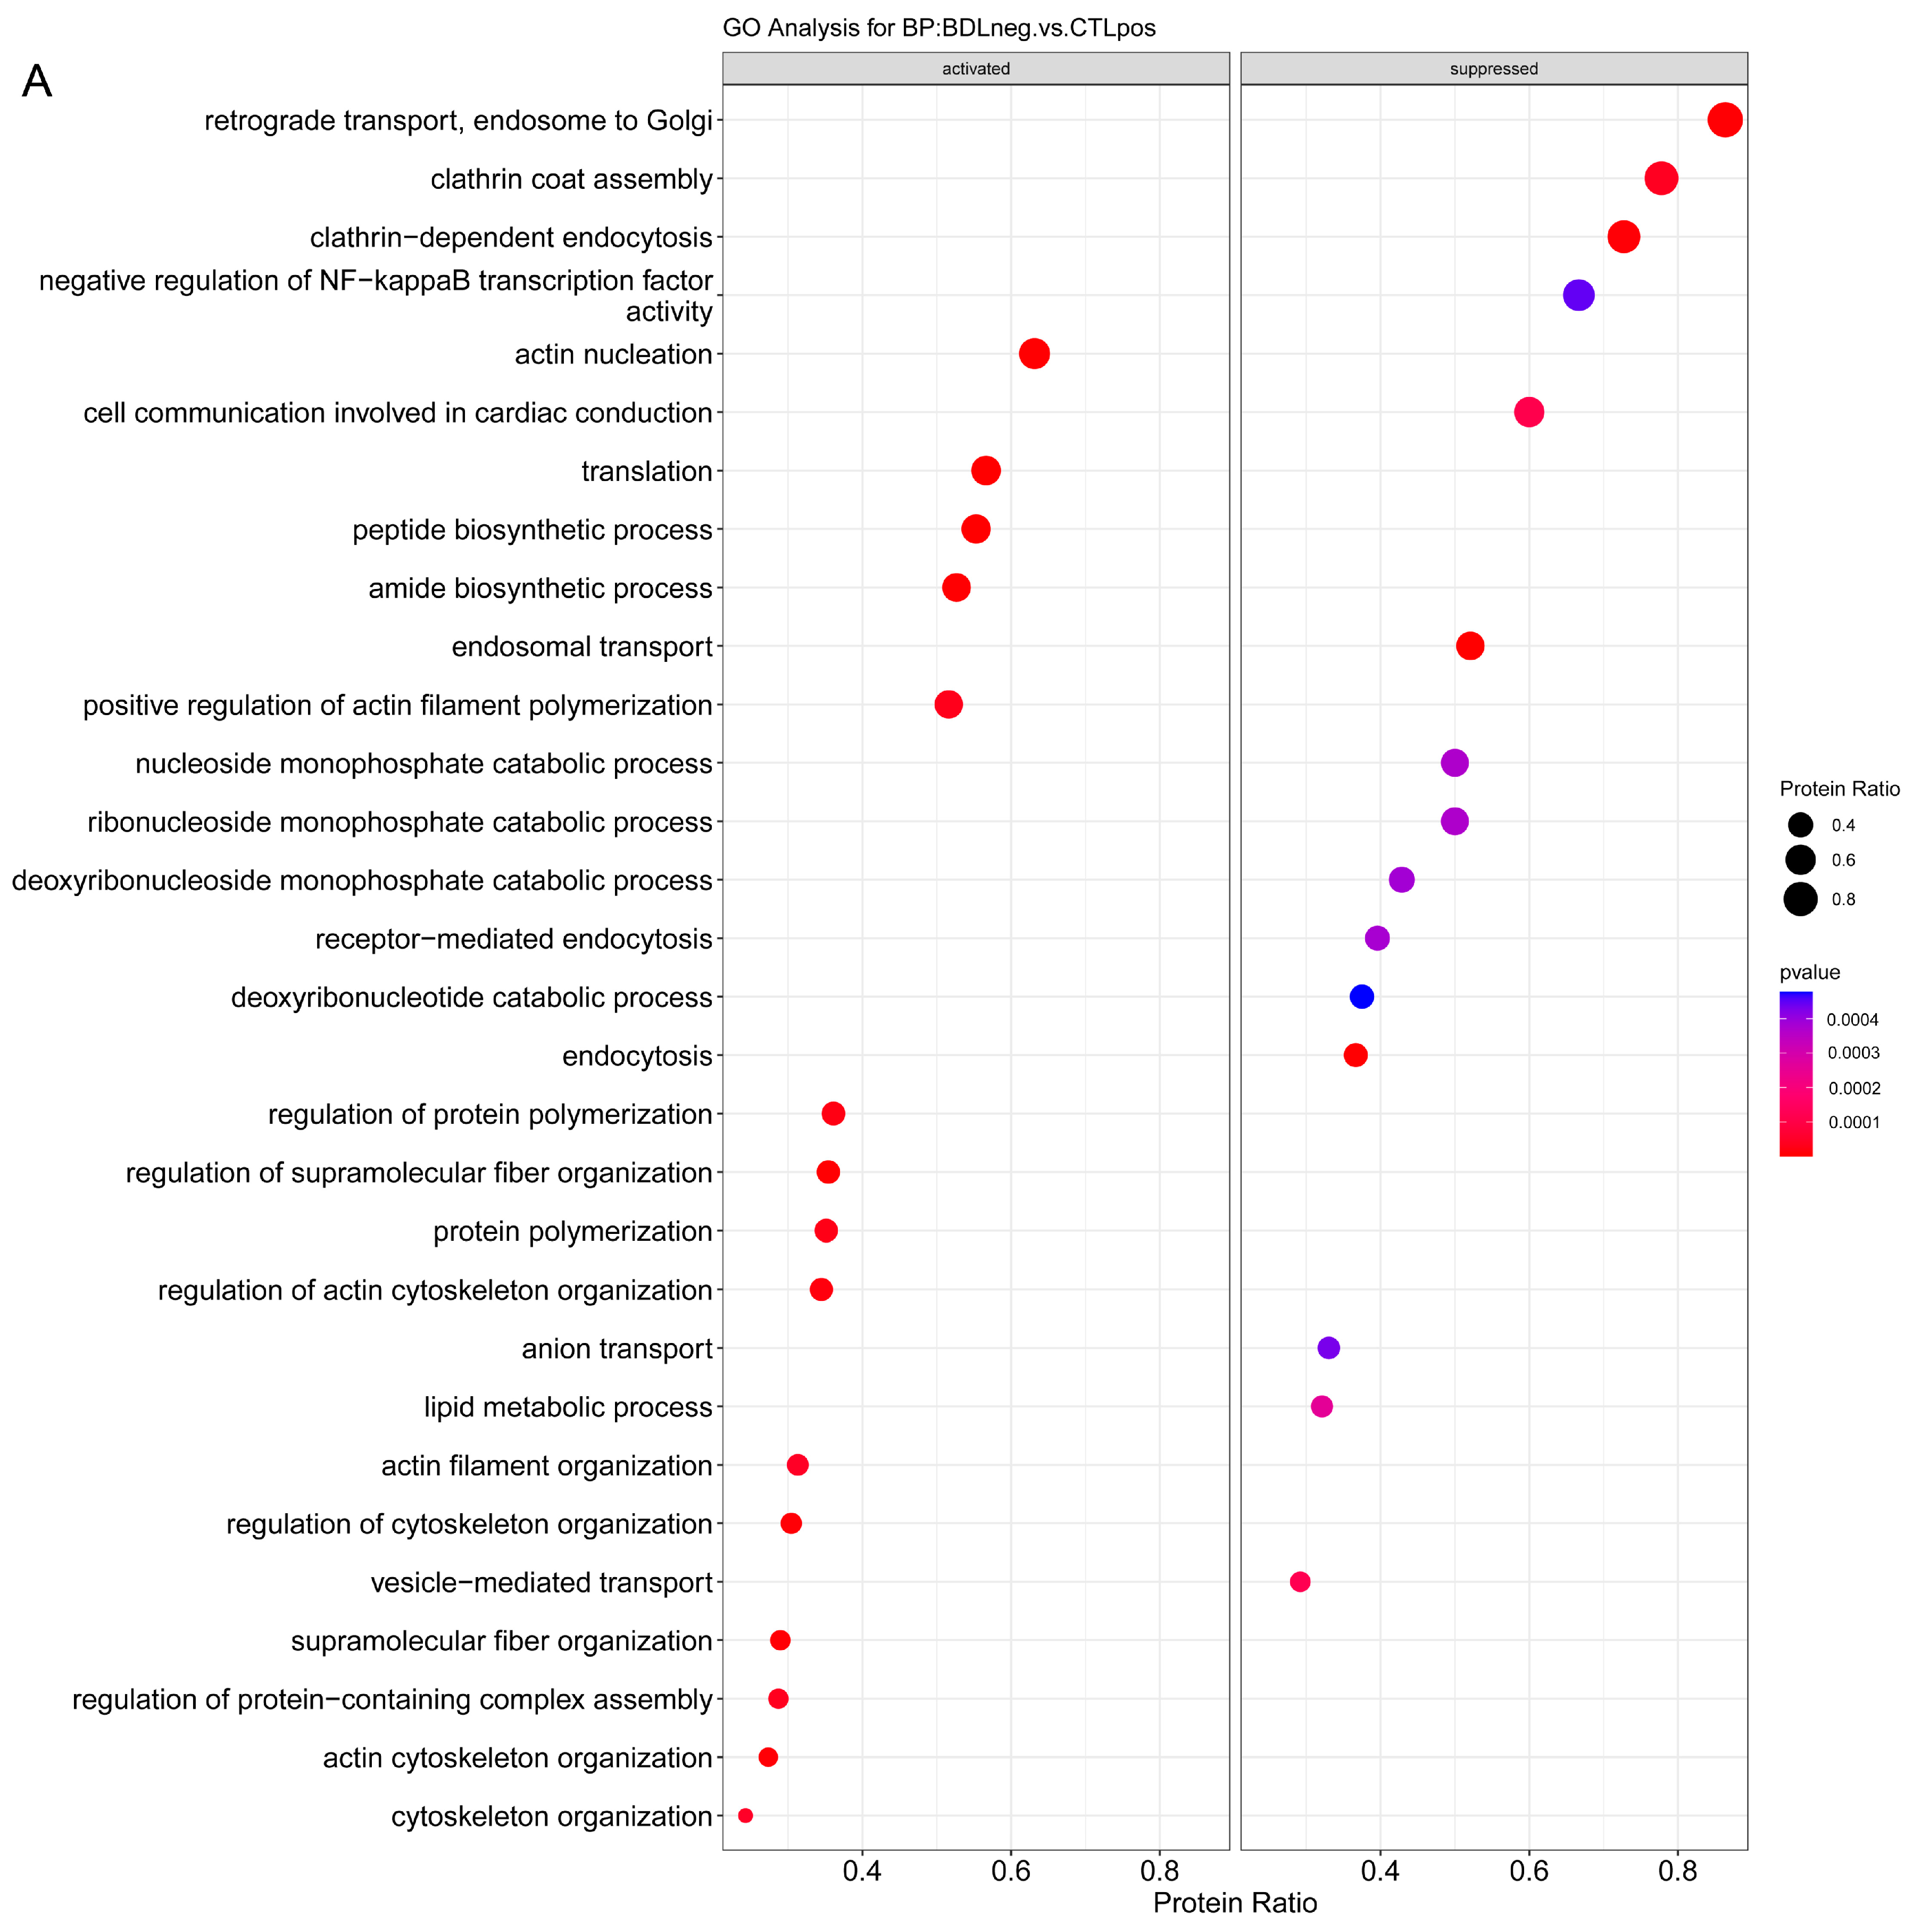
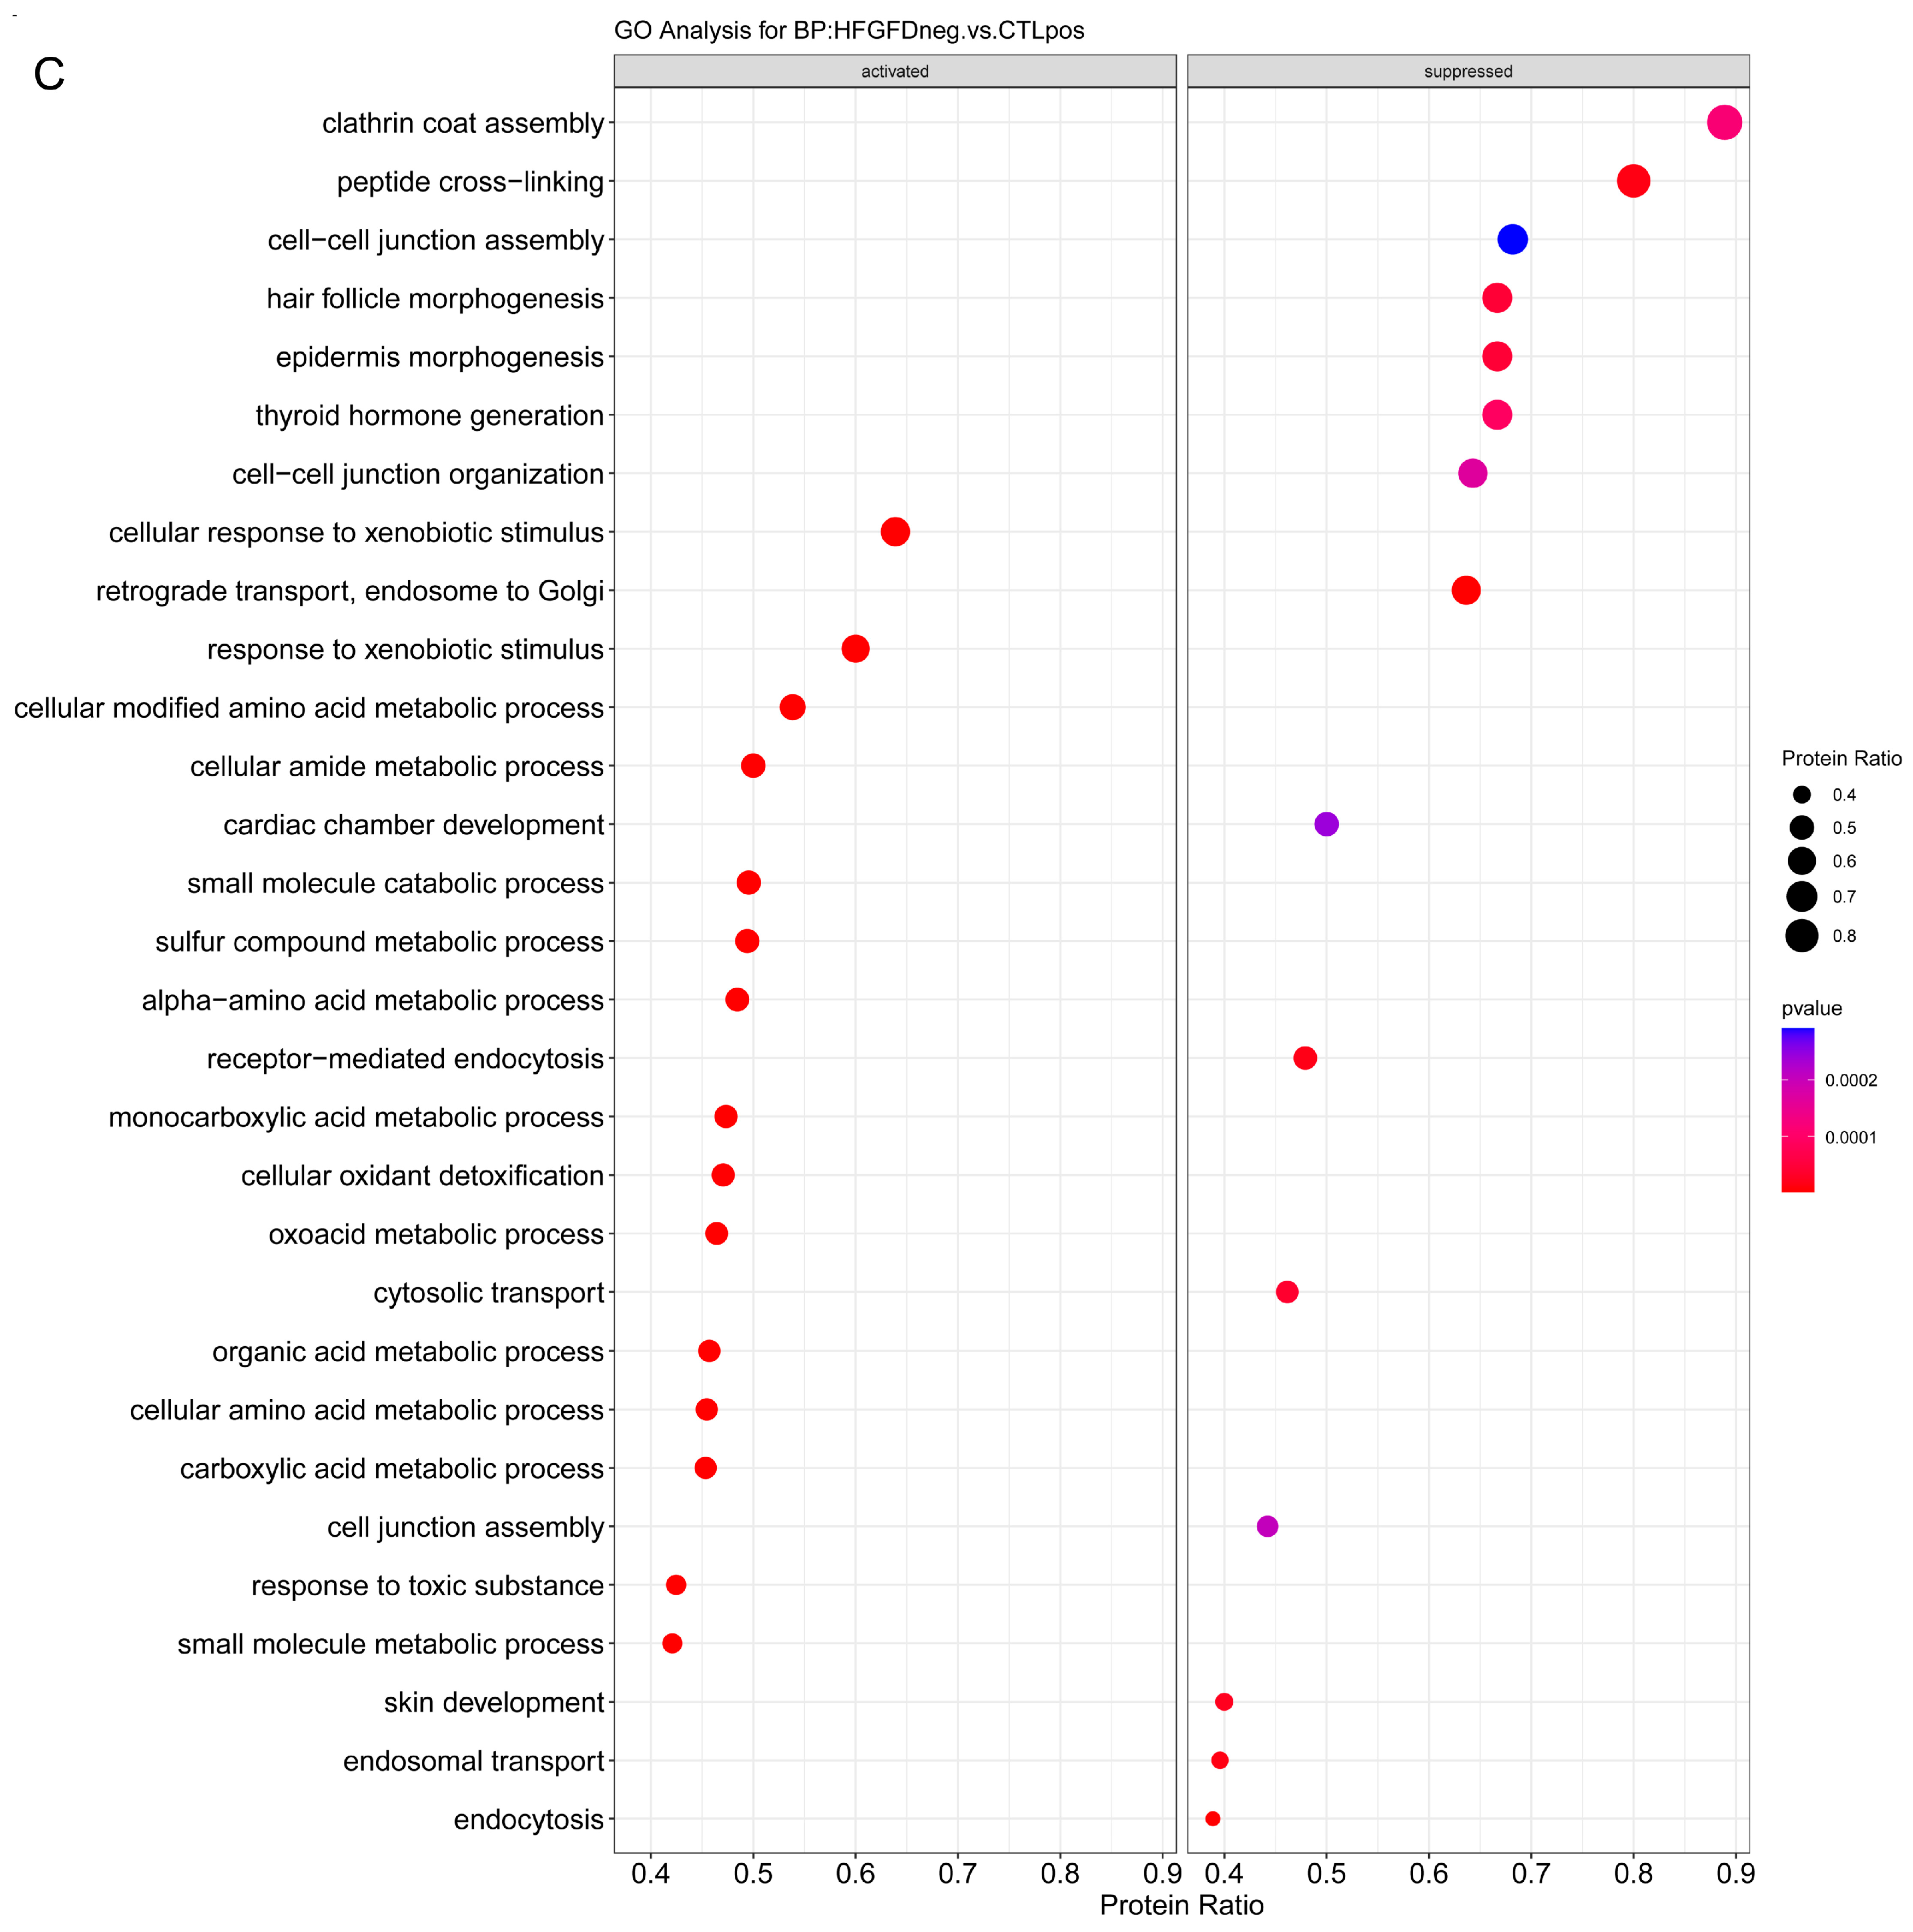
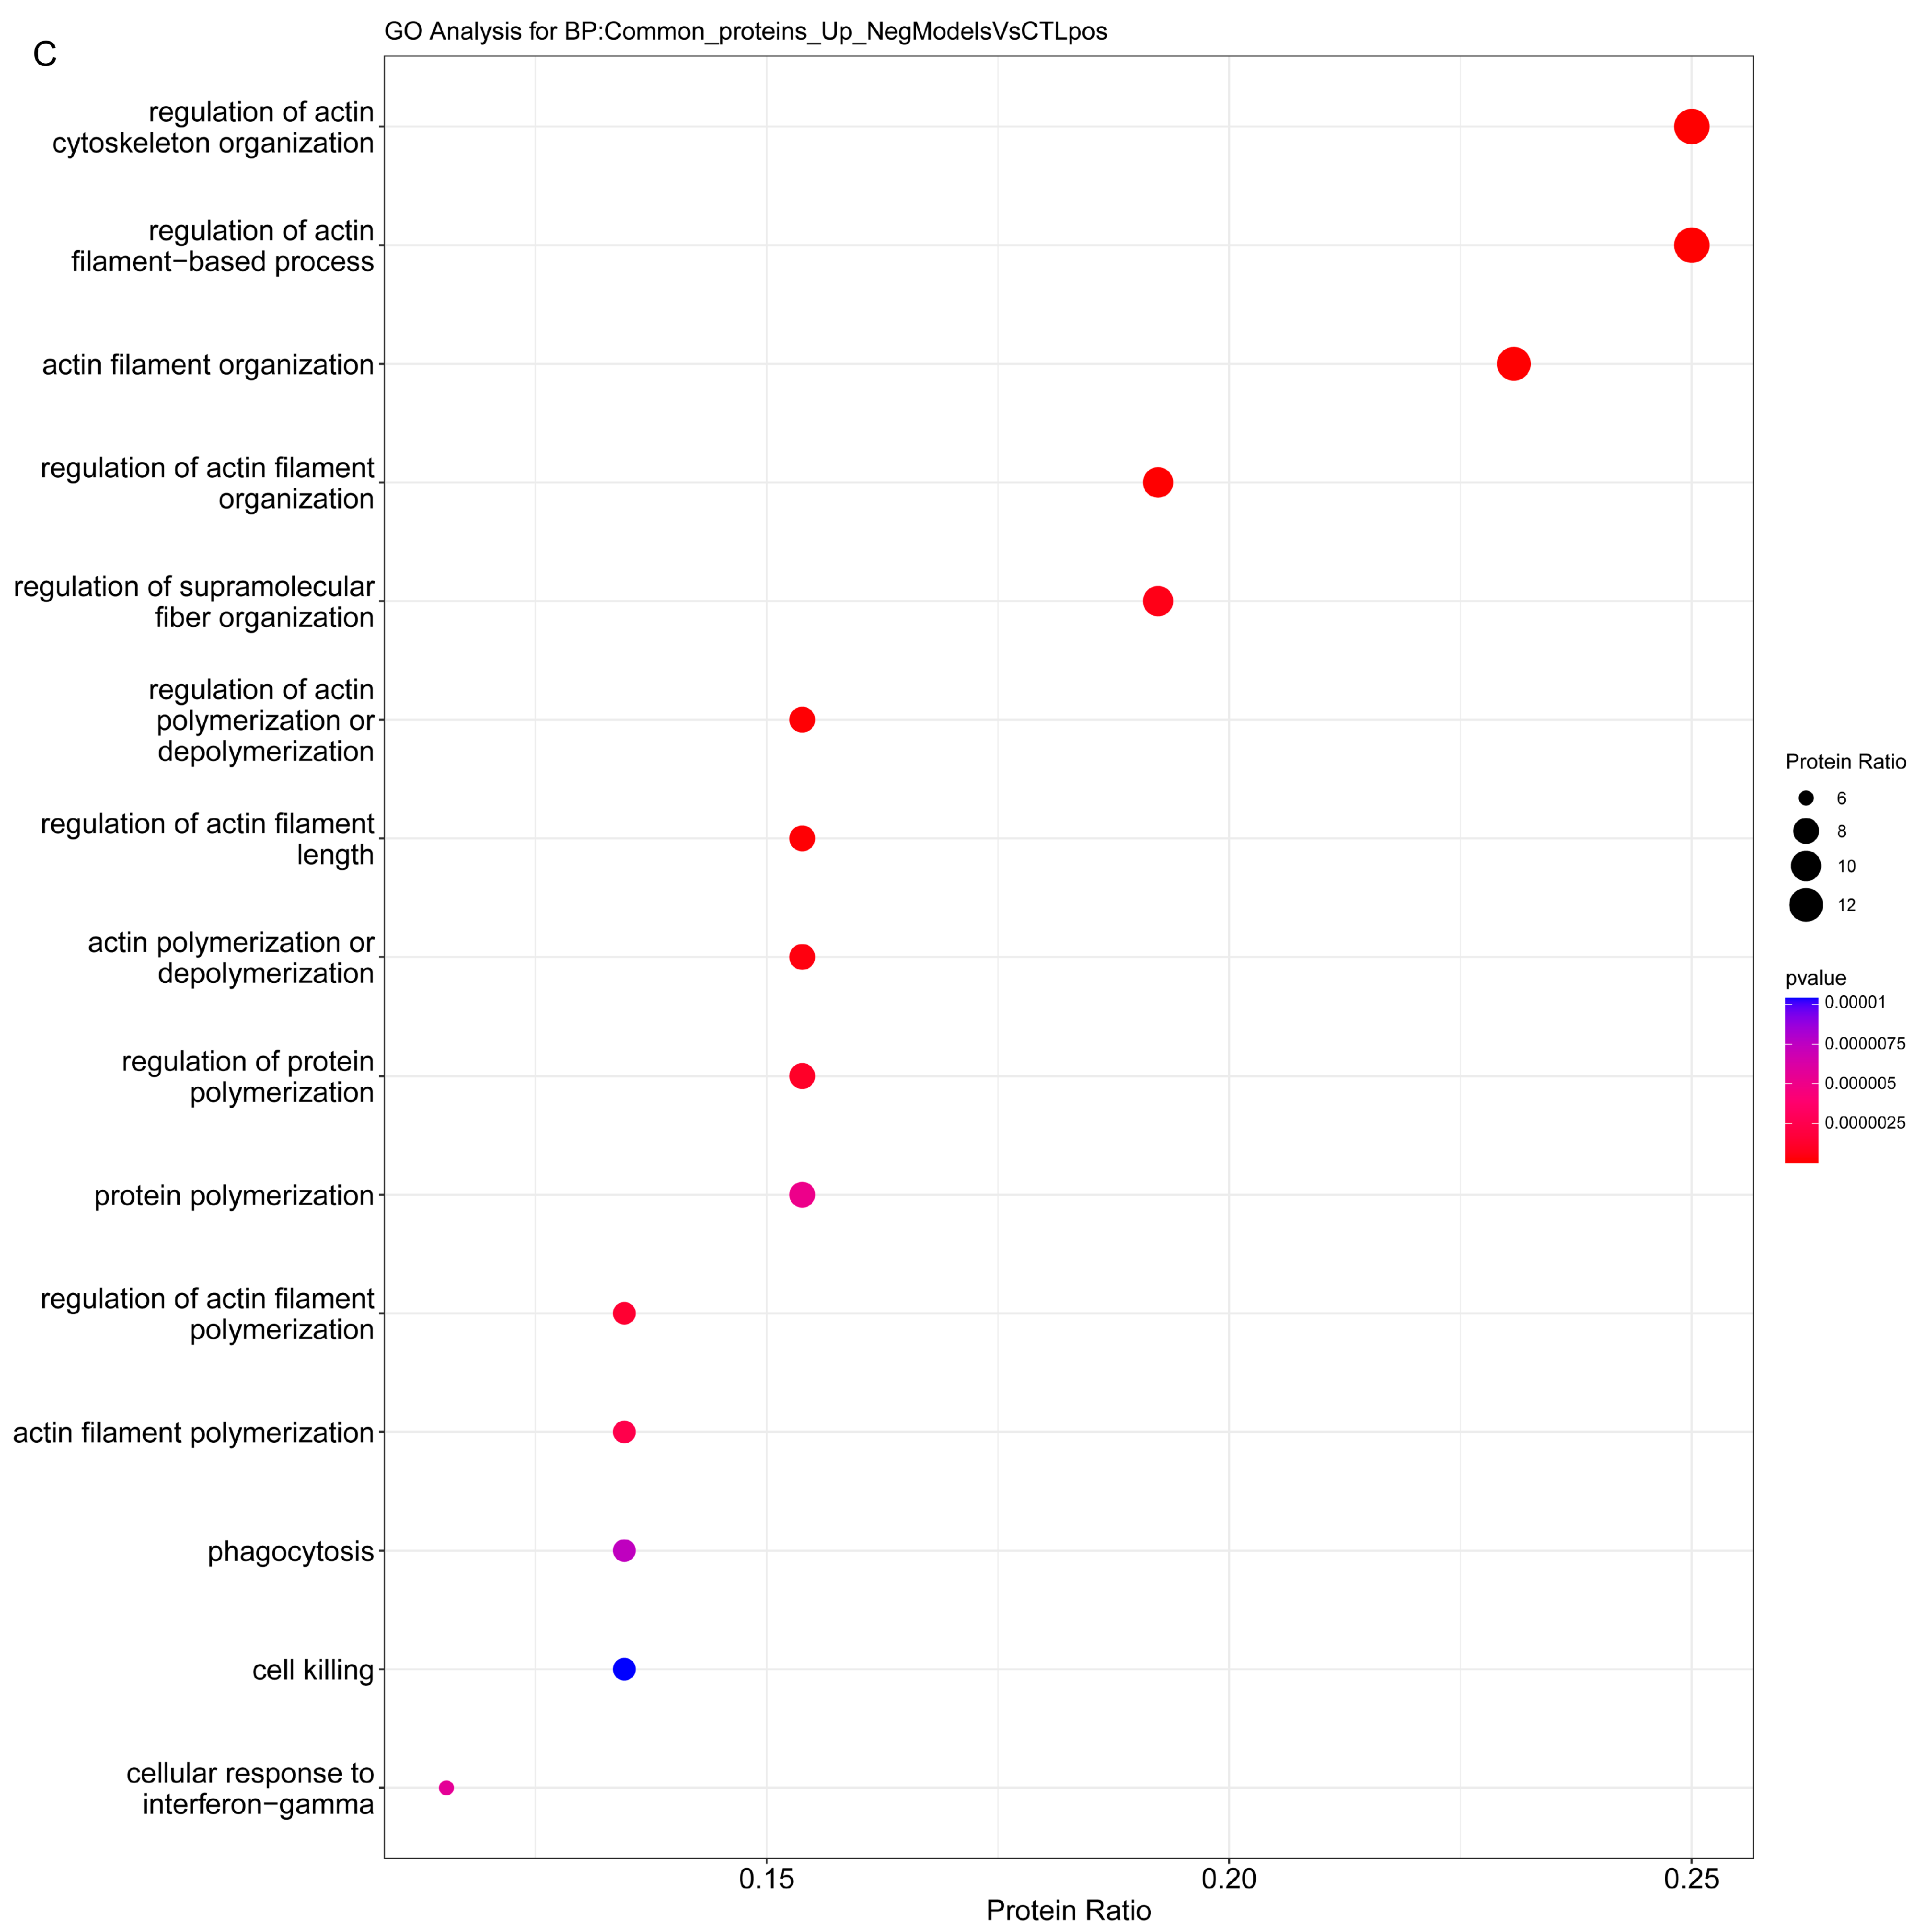
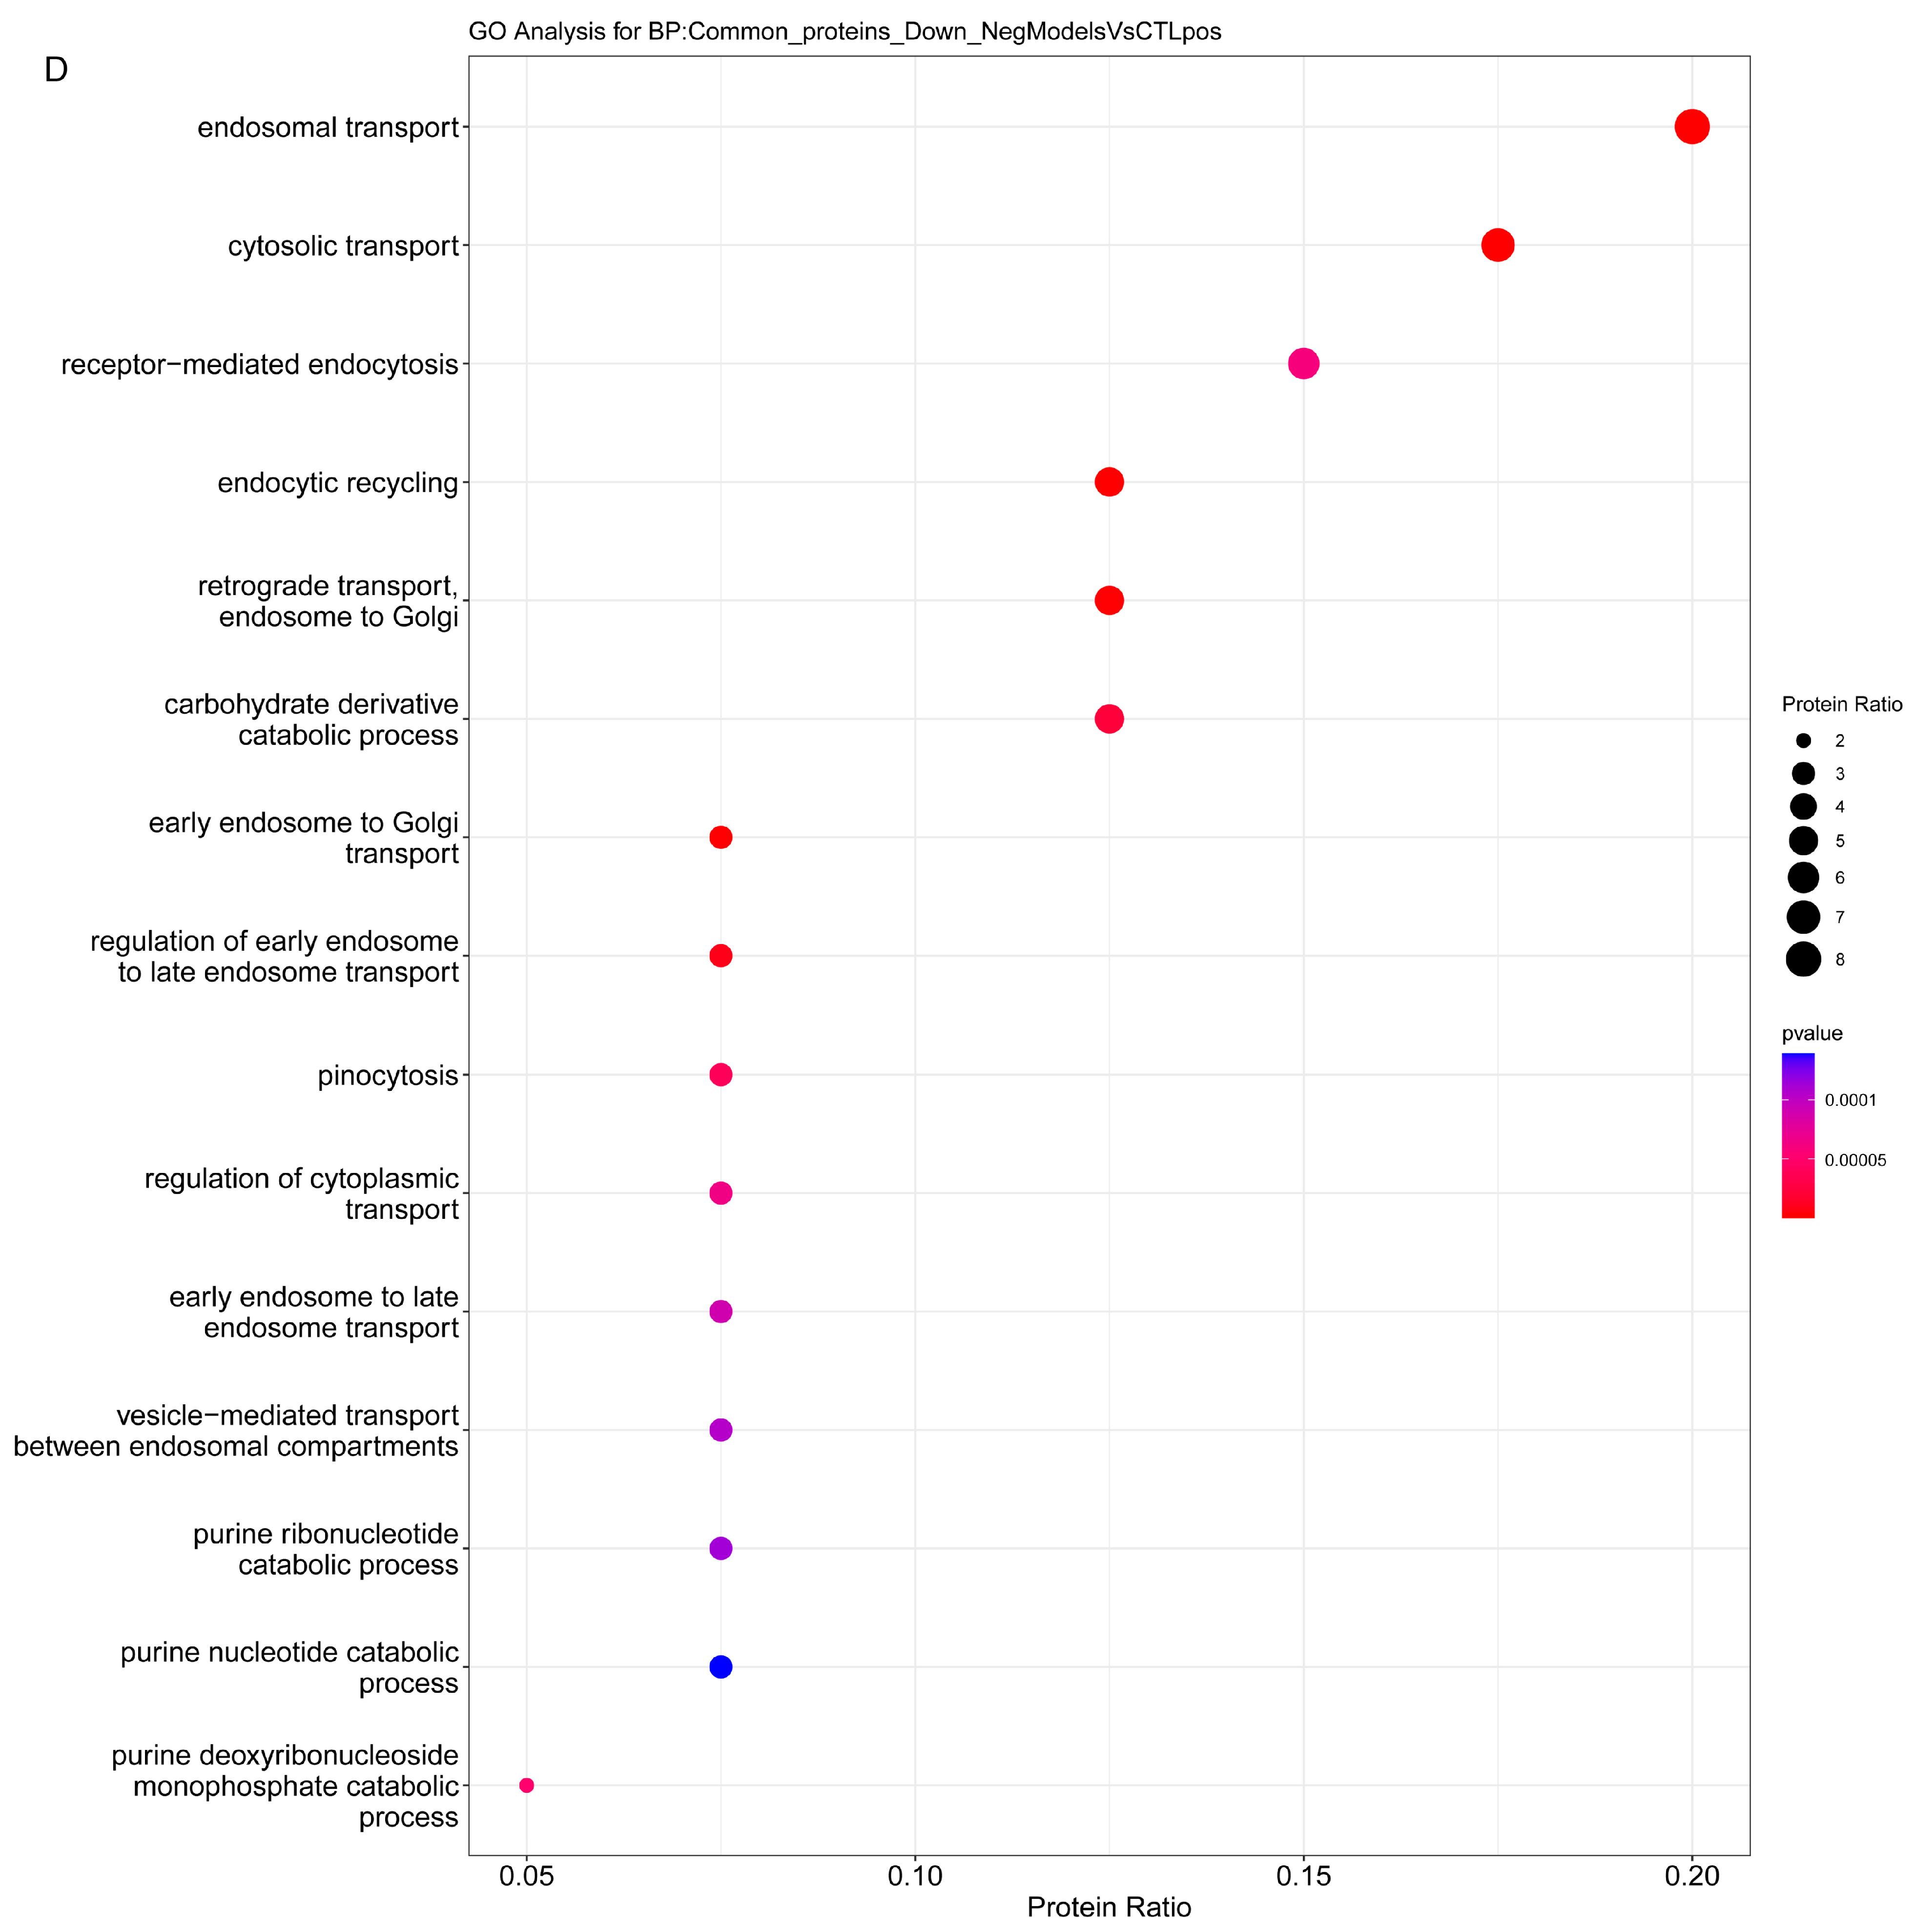
2.3.1. Enrichment Analysis
2.3.2. Overrepresentation Analysis
3. Discussion
4. Material and Methods
4.1. Experimental Models of Liver Disease
4.2. LSEC Isolation
4.3. Fluorescence-Activated Cell Sorting
4.4. Differential Proteomic Study
4.5. Immunohistochemistry
4.6. Analysis of the Biological Significance
4.7. Biostatistical Analysis
Supplementary Materials
Author Contributions
Funding
Institutional Review Board Statement
Informed Consent Statement
Data Availability Statement
Acknowledgments
Conflicts of Interest
References
- Tsochatzis, E.A.; Bosch, J.; Burroughs, A.K. Liver cirrhosis. Lancet 2014, 383, 1749–1761. [Google Scholar] [CrossRef]
- Paik, J.M.; Golabi, P.; Younossi, Y.; Mishra, A.; Younossi, Z.M. Changes in the Global Burden of Chronic Liver Diseases from 2012 to 2017: The Growing Impact of NAFLD. Hepatology 2020, 72, 1605–1616. [Google Scholar] [CrossRef]
- Fernández-Iglesias, A.; Gracia-Sancho, J. How to face chronic liver disease: The sinusoidal perspective. Front. Med. 2017, 4, 7. [Google Scholar] [CrossRef]
- Li, H. Intercellular crosstalk of liver sinusoidal endothelial cells in liver fibrosis, cirrhosis and hepatocellular carcinoma. Dig. Liver Dis. 2022, 54, 598–613. [Google Scholar] [CrossRef]
- Ezhilarasan, D.; Najimi, M. Intercellular communication among liver cells in the perisinusoidal space of the injured liver: Pathophysiology and therapeutic directions. J. Cell. Physiol. 2023, 238, 70–81. [Google Scholar] [CrossRef]
- Sørensen, K.K.; Simon-Santamaria, J.; McCuskey, R.S.; Smedsrød, B. Liver sinusoidal endothelial cells. Compr. Physiol. 2015, 5, 1751–1774. [Google Scholar]
- Poisson, J.; Lemoinne, S.; Boulanger, C.; Durand, F.; Moreau, R.; Valla, D.; Rautou, P.-E. Liver sinusoidal endothelial cells: Physiology and role in liver diseases. J. Hepatol. 2017, 66, 212–227. [Google Scholar] [CrossRef] [PubMed]
- Deleve, L.D.; Wang, X.; Hu, L.; Mccuskey, M.K.; Mccuskey, R.S. Rat liver sinusoidal endothelial cell phenotype is maintained by paracrine and autocrine regulation. Am. J. Physiol. Gastrointest. Liver Physiol. 2004, 287, 757–763. [Google Scholar] [CrossRef]
- Elvevold, K.; Smedsrød, B.; Martinez, I. The liver sinusoidal endothelial cell: A cell type of controversial and confusing identity. Am. J. Physiol. Gastrointest. Liver Physiol. 2008, 294, 391–400. [Google Scholar] [CrossRef] [PubMed]
- Ohmura, T.; Enomoto, K.; Satoh, H.; Sawada, N.; Mori, M. Establishment of a Novel Monoclonal Antibody, SE-1, Which Specifically Reacts with Rat Hepatic Sinusoidal Endothelial Cells. J. Histochem. Cytochem. 1993, 41, 1253–1257. [Google Scholar] [CrossRef] [PubMed]
- Bhandari, S.; Larsen, A.K.; McCourt, P.; Smedsrød, B.; Sørensen, K.K. The Scavenger Function of Liver Sinusoidal Endothelial Cells in Health and Disease. Front. Physiol. 2021, 12. [Google Scholar] [CrossRef] [PubMed]
- DeLeve, L.D.; Maretti-Mira, A.C. Liver Sinusoidal Endothelial Cell: An Update. Semin. Liver Dis. 2017, 37, 377–387. [Google Scholar]
- Urashima, S.; Tsutsumi, M.; Nakase, K.T.; Wang, H.-S.; Takada, A. Studies on capillarization of the hepatic sinusoids in alcoholic liver disease. Alcohol Alcohol. 1993, 28, 77–84. [Google Scholar] [CrossRef] [PubMed]
- Xu, B.; Broome, U.; Uzunel, M.; Nava, S.; Ge, X.; Kumagai-Braesch, M.; Hultenby, K.; Christensson, B.; Ericzon, B.-G.; Holgersson, J.; et al. Capillarization of Hepatic Sinusoid by Liver Endothelial Cell-Reactive Autoantibodies in Patients with Cirrhosis and Chronic Hepatitis. Am. J. Pathol. 2003, 163, 1275–1289. [Google Scholar] [CrossRef] [PubMed]
- Nevzorova, Y.A.; Boyer-Diaz, Z.; Cubero, F.J.; Gracia-Sancho, J. Animal models for liver disease—A practical approach for translational research. J. Hepatol. 2020, 73, 423–440. [Google Scholar] [CrossRef] [PubMed]
- Lalor, P.F.; Lai, W.K.; Curbishley, S.M.; Shetty, S.; Adams, D.H. Human hepatic sinusoidal endothelial cells can be distinguished by expression of phenotypic markers related to their specialised functions in vivo. World J. Gastroenterol. 2006, 12, 5429–5439. [Google Scholar] [CrossRef]
- Manicardi, N.; Fernández-Iglesias, A.; Abad-Jordà, L.; Royo, F.; Azkargorta, M.; Ortega-Ribera, M.; Sanfeliu-Redondo, D.; Martínez-Alcocer, A.; Elortza, F.; Hessheimer, A.J.; et al. Transcriptomic profiling of the liver sinusoidal endothelium during cirrhosis reveals stage-specific secretory signature. Cancers 2021, 13, 2688. [Google Scholar] [CrossRef]
- Garcia-Lezana, T.; Raurell, I.; Bravo, M.; Torres-Arauz, M.; María Teresa Salcedo, M.; Santiago, A.; Schoenenberger, A.; Manichanh, C.; Genescà, J.; Martell, M.; et al. Restoration of a Healthy Intestinal Microbiota Normalizes Portal Hypertension in a Rat Model of Nonalcoholic Steatohepatitis. Hepatology 2018, 67, 1485–1498. [Google Scholar] [CrossRef]
- Gracia-Sancho, J.; Caparrós, E.; Fernández-Iglesias, A.; Francés, R. Role of liver sinusoidalendothelial cells in liver diseases. Nat. Rev. Gastroenterol. Hepatol. 2021, 18, 411–431. [Google Scholar] [CrossRef]
- Bravo, M.; Raurell, I.; Hide, D.; Fernández-Iglesias, A.; Gil, M.; Barberá, A.; Salcedo, M.T.; Augustin, S.; Genescà, J.; Martell, M. Restoration of liver sinusoidal cell phenotypes by statins improves portal hypertension and histology in rats with NASH. Sci. Rep. 2019, 9, 20183. [Google Scholar] [CrossRef]
- Strauss, O.; Phillips, A.; Ruggiero, K.; Bartlett, A.; Dunbar, P.R. Immunofluorescence identifies distinct subsets of endothelial cells in the human liver. Sci. Rep. 2017, 7, 44356. [Google Scholar] [CrossRef]
- MacParland, S.A.; Liu, J.C.; Ma, X.Z.; Innes, B.T.; Bartczak, A.M.; Gage, B.K.; Manuel, J.; Khuu, N.; Echeverri, J.; Linares, I.; et al. Single cell RNA sequencing of human liver reveals distinct intrahepatic macrophage populations. Nat. Commun. 2018, 9, 4383. [Google Scholar] [CrossRef]
- Tripathi, D.M.; Hassan, M.; Siddiqui, H.; Kaur, I.; Rawal, P.; Bihari, C.; Kaur, S.; Sarin, S.K. Cirrhotic Endothelial Progenitor Cells Enhance Liver Angiogenesis and Fibrosis and Aggravate Portal Hypertension in Bile Duct-Ligated Cirrhotic Rats. Front. Physiol. 2020, 11, 617. [Google Scholar] [CrossRef] [PubMed]
- Elvevold, K.; Simon-Santamaria, J.; Hasvold, H.; McCourt, P.; Smedsrød, B.; Sørensen, K.K. Liver sinusoidal endothelial cells depend on mannose receptor-mediated recruitment of lysosomal enzymes for normal degradation capacity. Hepatology 2008, 48, 2007–2015. [Google Scholar] [CrossRef]
- Gruenberg, J. The endocytic pathway: A mosaic of domains. Nat. Rev. Mol. Cell Biol. 2001, 2, 721–730. [Google Scholar] [CrossRef] [PubMed]
- Géraud, C.; Schledzewski, K.; Demory, A.; Klein, D.; Kaus, M.; Peyre, F.; Sticht, C.; Evdokimov, K.; Lu, S.; Schmieder, A.; et al. Liver sinusoidal endothelium: A microenvironment-dependent differentiation program in rat including the novel junctional protein liver endothelial differentiation-associated protein-1. Hepatology 2010, 52, 313–326. [Google Scholar] [CrossRef] [PubMed]
- Yokomori, H.; Yoshimura, K.; Funakoshi, S.; Nagai, T.; Fujimaki, K.; Nomura, M.; Ishii, H.; Oda, M. Rho modulates hepatic sinusoidal endothelial fenestrae via regulation of the actin cytoskeleton in rat endothelial cells. Lab. Investig. 2004, 84, 857–864. [Google Scholar] [CrossRef]
- Zapotoczny, B.; Szafranska, K.; Lekka, M.; Ahluwalia, B.S.; McCourt, P. Tuning of Liver Sieve: The Interplay between Actin and Myosin Regulatory Light Chain Regulates Fenestration Size and Number in Murine Liver Sinusoidal Endothelial Cells. Int. J. Mol. Sci. 2022, 23, 9850. [Google Scholar] [CrossRef]
- Martino JDi Mascalchi, P.; Legros, P.; Lacomme, S.; Gontier, E.; Bioulac-Sage, P.; Balabaud, C.; Moreau, V.; Saltel, F. Actin Depolymerization in Dedifferentiated Liver Sinusoidal Endothelial Cells Promotes Fenestrae Re-Formation. Hepatol. Commun. 2019, 3, 213–219. [Google Scholar] [CrossRef]
- Hide, D.; Gil, M.; Andrade, F.; Rafael, D.; Raurell, I.; Bravo, M.; Martell, M. Simvastatin-loaded polymeric micelles are more effective and less toxic than conventional statins in a pre-clinical model of advanced chronic liver disease. Nanomed. Nanotechnol. Biol. Med. 2020, 29, 102267. [Google Scholar] [CrossRef]
- Mousavi, S.A.; Sporstøl, M.; Fladeby, C.; Kjeken, R.; Barois, N.; Berg, T. Receptor-mediated endocytosis of immune complexes in rat liver sinusoidal endothelial cells is mediated by FcγRIIb2. Hepatology 2007, 46, 871–884. [Google Scholar] [CrossRef] [PubMed]
- Beck, P.L.; Lee, S.S. Vitamin K1 improves survival in bile-duct-ligated rats with cirrhosis. J. Hepatol. 1995, 23, 235. [Google Scholar] [CrossRef] [PubMed]
- Rodríguez, S.; Raurell, I.; Ezkurdia, N.; Augustin, S.; Esteban, R.; Genescà, J.; Martell, M. The renal effects of droxidopa are maintained in propranolol treated cirrhotic rats. Liver Int. 2015, 35, 326–334. [Google Scholar] [CrossRef] [PubMed]
- Subramanian, A.; Tamayo, P.; Mootha, V.K.; Mukherjee, S.; Ebert, B.L.; Gillette, M.A.; Paulovich, A.; Pomeroy, S.L.; Golub, T.R.; Lander, E.S.; et al. Gene set enrichment analysis: A knowledge-based approach for interpreting genome-wide expression profiles. Proc. Natl. Acad. Sci. USA 2005, 102, 15545–15550. [Google Scholar] [CrossRef]
- Yu, G.; Wang, L.G.; Han, Y.; He, Q.Y. ClusterProfiler: An R package for comparing biological themes among gene clusters. Omics A J. Integr. Biol. 2012, 16, 284–287. [Google Scholar] [CrossRef]


| Model/Strain | N | N of Isolated LSEC | LSEC CD32b+ (%) | LSEC CD32b− (%) |
|---|---|---|---|---|
| CTRL/SD | 6 | 1,235,600 ± 188,804 | 95.5 ± 1.3 | 4.5 ± 1.3 |
| CTRL/W | 5 | 1,074,100 ± 240,424 | 94.3 ± 0.6 | 5.7 ± 0.6 |
| BDL/SD | 7 | 319,000 ± 124,439 | 55.4 ± 8.7 | 44.6 ± 8.7 **** |
| HFGFD/SD | 7 | 1,774,100 ± 373,974 | 83.1 ± 4.5 | 16.9 ± 4.5 |
| CCl4/W | 7 | 3,319,375 ± 585,295 | 94.0 ± 0.7 | 6.0 ± 0.7 |
| Up-Regulated | |||
|---|---|---|---|
| Pathway | Accession # | Symbol | Protein Name |
| Actin cytoskeleton organization | Q91ZN1 | Coro 1a | Coronin-1A |
| B2GV73 | Arpc3 | Actin-related protein 2/3 complex subunit 3 | |
| P35465 | Pak1 | Serine/threonine-protein kinase PAK 1 | |
| Q5RKI0 | Wdr1 | WD repeat-containing protein 1 | |
| Q6AYC4 | Capg | Actin regulatory protein CAP-G | |
| O08719 | Evl | Ena/vasodilator-stimulated phosphoprotein-like | |
| G3V7Q7 | Iqgap1 | IQ motif-containing GTPase-activating protein 1 | |
| Q68FP1 | Gsn | Gelsolin | |
| B0BMY7 | Twf2 | Twinfilin actin-binding protein 2 | |
| Q5M860 | Arhgdib | Rho GDP dissociation inhibitor beta | |
| Q99N37 | Arhgap17 | Rho GTPase-activating protein 17 | |
| Q64303 | Pak2 | Serine/threonine-protein kinase PAK 2 | |
| Q68FX4 | Hcls1 | Hematopoietic cell specific Lyn substrate 1 | |
| P48675 | Des | Desmin | |
| P31000 | Vim | Vimentin | |
| Q5XI38 | Lcp1 | Lymphocyte cytosolic protein 1 | |
| Immune regulation | Q5RKI0 | Wdr1 | WD repeat-containing protein 1 |
| P04157 | Ptprc | Receptor-type tyrosine-protein phosphatase C, CD45 | |
| P81718 | Ptpn6 | Tyrosine-protein phosphatase non-receptor type 6 | |
| P01026 | C3 | Complement C3 | |
| G3V726 | Gzmm | Granzyme M | |
| Q91ZN1 | Coro1a | Coronin-1A | |
| Q64725 | Syk | Tyrosine-protein kinase SYK | |
| P32577 | Csk | Tyrosine-protein kinase CSK | |
| P04041 | Gpx1 | Glutathione peroxidase 1 | |
| Q5XI38 | Lcp1 | Lymphocyte cytosolic protein 1 | |
| P04797 | Gapdh | Glyceraldehyde-3-phosphate dehydrogenase | |
| Down-Regulated | |||
| Pathway | Accession # | Symbol | Protein Name |
| Endocytosis | Q8R491 | Edh3 | EH domain-containing protein 3 |
| Q641Z6 | Edh1 | EH domain-containing protein 1 | |
| Q8R3Z7 | Edh4 | EH domain-containing protein 4 | |
| B1H267 | Snx5 | Sorting nexin-5 | |
| A3RLA8 | Fcgr2b | Fc gamma receptor 2B, CD32b | |
| Q5U211 | Snx3 | Sorting nexin-3 | |
| B2RYP4 | Snx2 | Sorting nexin-2 | |
| Q99N27 | Snx1 | Sorting nexin-1 | |
| O88797 | Dab2 | Disabled homolog 2 | |
| Q6AYE2 | Sh3glb1 | Endophilin-B1 | |
| P62744 | Ap2s1 | AP-2 complex subunit sigma | |
| B0BNK1 | Rab5 | Member RAS oncogene family | |
| P07154 | Ctsl | Procathepsin L | |
| P63045 | Vamp2 | Vesicle-associated membrane protein 2 | |
| Metabolic- Catabolic | Q920P6 | Ada | Adenosine deaminase |
| Q9JKB7 | Gda | Guanine deaminase | |
| Q8R491 | Ehd3 | EH domain-containing protein 3 | |
| O88797 | Dab2 | Disabled homolog 2 | |
| Q6AYE2 | Sh3glb1 | Endophilin-B1 | |
| Q99N27 | Snx1 | Sorting nexin-1 | |
| Q6IRK9 | Cpq | Carboxypeptidase Q Liver annexin-like protein 1 | |
| P07154 | Ctsl | Procathepsin L | |
| D3ZF77 | Akr1c15 | Aldo-keto reductase family 1 member C15 | |
| F1LR10 | Lima1 | LIM domain and actin-binding protein 1 | |
| Q6IMY6 | Lipa | Lipase | |
| P50442 | Gatm | Glycine amidinotransferase | |
| Q01062 | Pde2a | cGMP-dependent 3′,5′-cyclic phosphodiesterase | |
| Q9EPB1 | Dpp7, Dpp2 | Dipeptidyl peptidase 2 Dipeptidyl peptidase 7 | |
| Q9EQV6 | Tpp1, Cln2 | Tripeptidyl-peptidase | |
| Q6AXR4 | Hexb | Beta-hexosaminidase subunit beta | |
Disclaimer/Publisher’s Note: The statements, opinions and data contained in all publications are solely those of the individual author(s) and contributor(s) and not of MDPI and/or the editor(s). MDPI and/or the editor(s) disclaim responsibility for any injury to people or property resulting from any ideas, methods, instructions or products referred to in the content. |
© 2023 by the authors. Licensee MDPI, Basel, Switzerland. This article is an open access article distributed under the terms and conditions of the Creative Commons Attribution (CC BY) license (https://creativecommons.org/licenses/by/4.0/).
Share and Cite
Gil, M.; Azkargorta, M.; Fuster, C.; Martínez-Gómez, M.; Raurell, I.; Barberá, A.; Pericàs, J.M.; Hide, D.; Elortza, F.; Genescà, J.; et al. Proteomic Analysis of Dysfunctional Liver Sinusoidal Endothelial Cells Reveals Substantial Differences in Most Common Experimental Models of Chronic Liver Diseases. Int. J. Mol. Sci. 2023, 24, 11904. https://doi.org/10.3390/ijms241511904
Gil M, Azkargorta M, Fuster C, Martínez-Gómez M, Raurell I, Barberá A, Pericàs JM, Hide D, Elortza F, Genescà J, et al. Proteomic Analysis of Dysfunctional Liver Sinusoidal Endothelial Cells Reveals Substantial Differences in Most Common Experimental Models of Chronic Liver Diseases. International Journal of Molecular Sciences. 2023; 24(15):11904. https://doi.org/10.3390/ijms241511904
Chicago/Turabian StyleGil, Mar, Mikel Azkargorta, Carla Fuster, María Martínez-Gómez, Imma Raurell, Aurora Barberá, Juan Manuel Pericàs, Diana Hide, Felix Elortza, Joan Genescà, and et al. 2023. "Proteomic Analysis of Dysfunctional Liver Sinusoidal Endothelial Cells Reveals Substantial Differences in Most Common Experimental Models of Chronic Liver Diseases" International Journal of Molecular Sciences 24, no. 15: 11904. https://doi.org/10.3390/ijms241511904
APA StyleGil, M., Azkargorta, M., Fuster, C., Martínez-Gómez, M., Raurell, I., Barberá, A., Pericàs, J. M., Hide, D., Elortza, F., Genescà, J., & Martell, M. (2023). Proteomic Analysis of Dysfunctional Liver Sinusoidal Endothelial Cells Reveals Substantial Differences in Most Common Experimental Models of Chronic Liver Diseases. International Journal of Molecular Sciences, 24(15), 11904. https://doi.org/10.3390/ijms241511904