
Insights into the SARS-CoV-2 ORF6 Mechanism of Action

 ,
,  ,
,  ,
,  , ,
, ,  , , , and
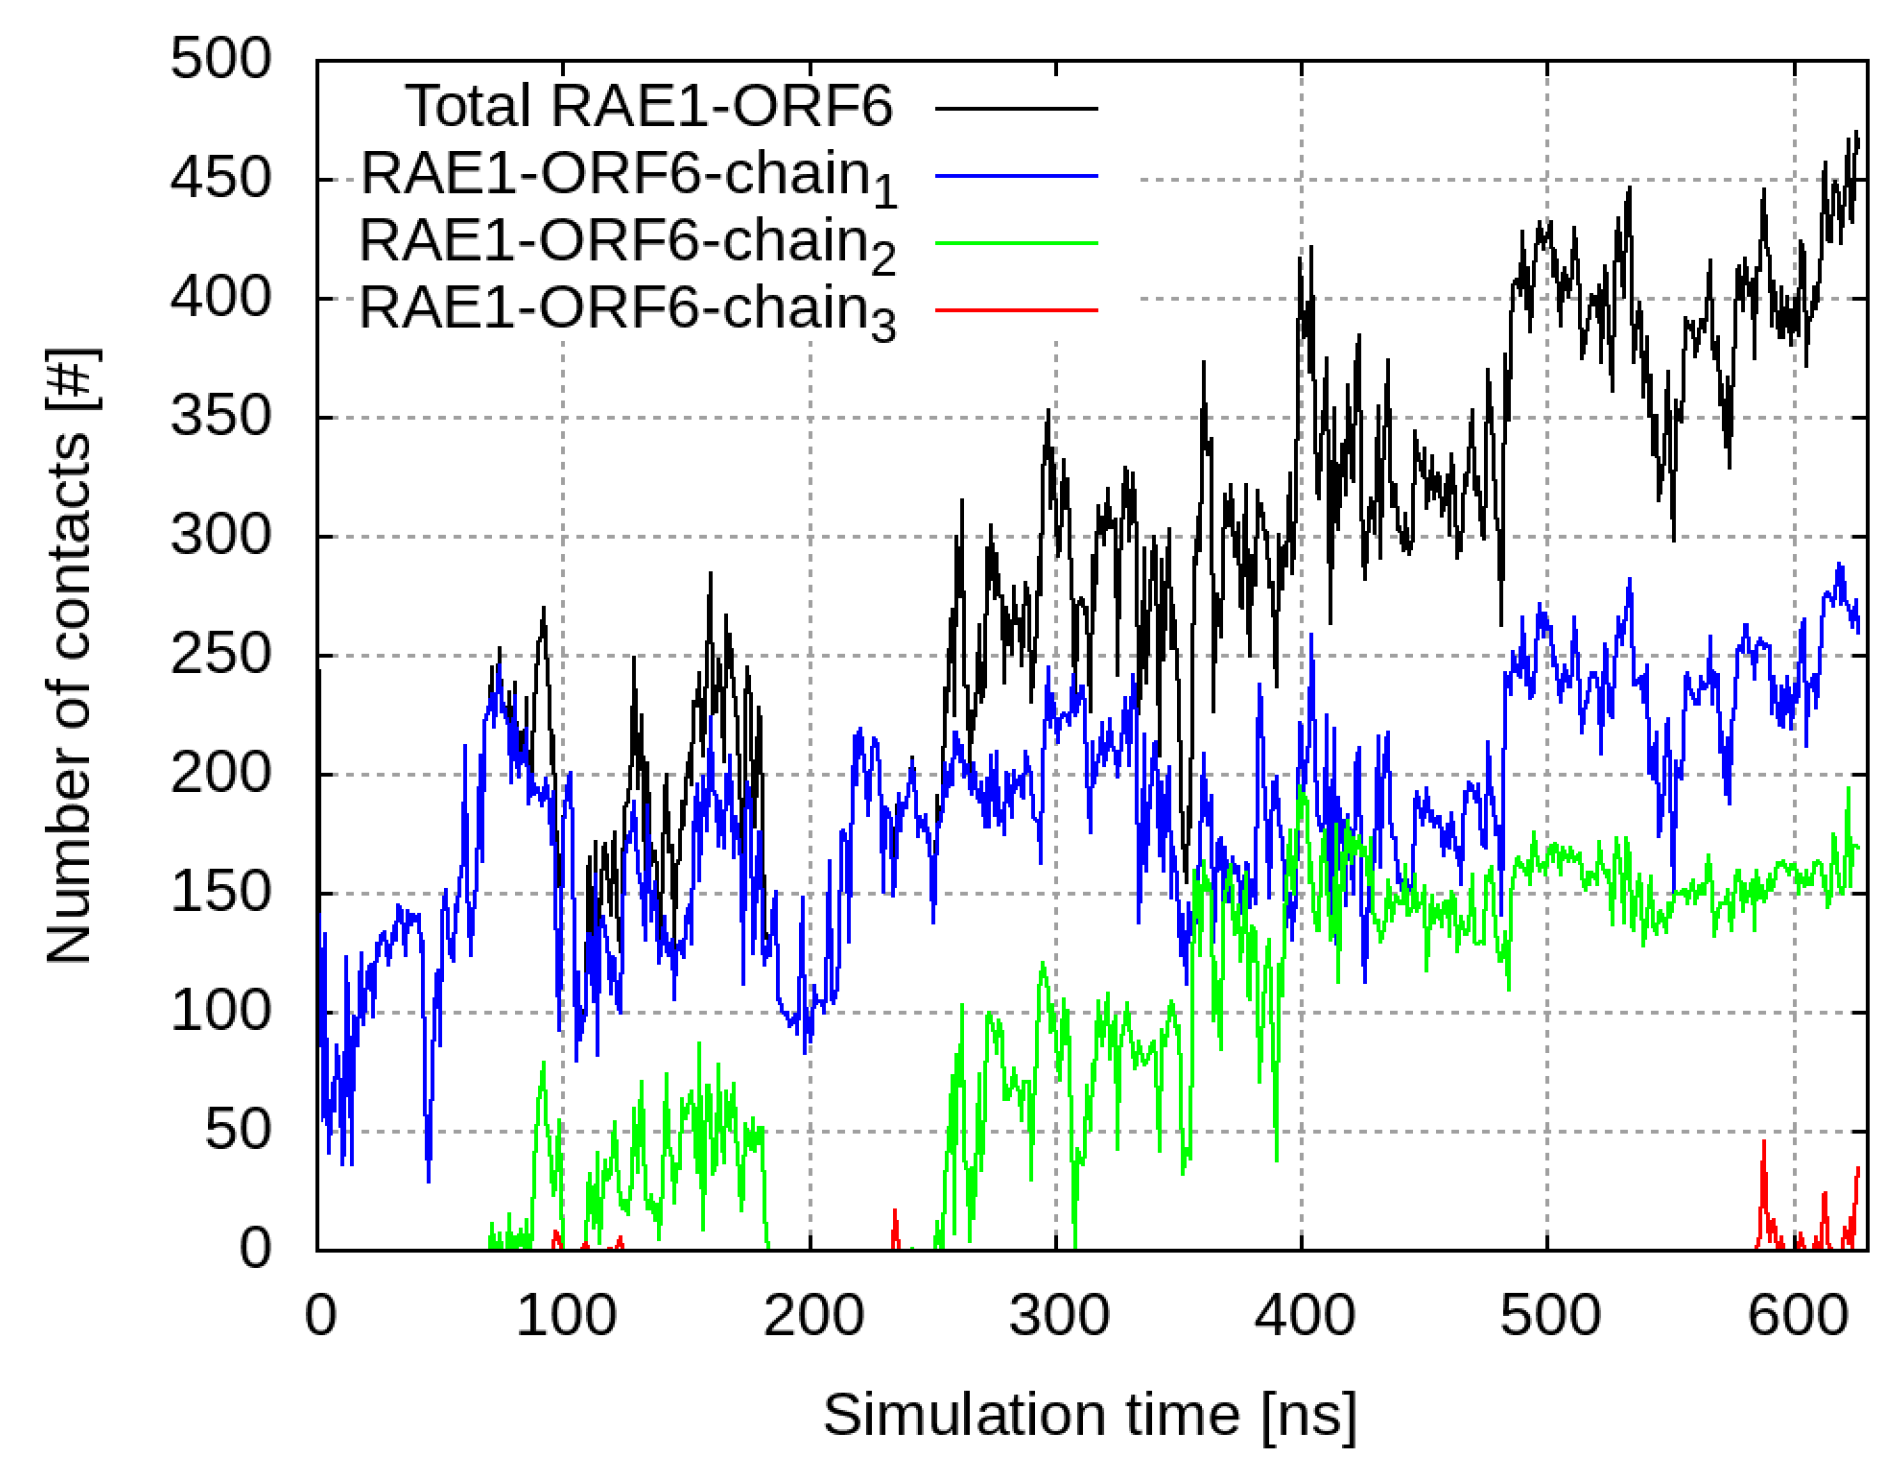
Abstract
1. Introduction
2. Results
2.1. Structure of ORF6 in Water Solvent
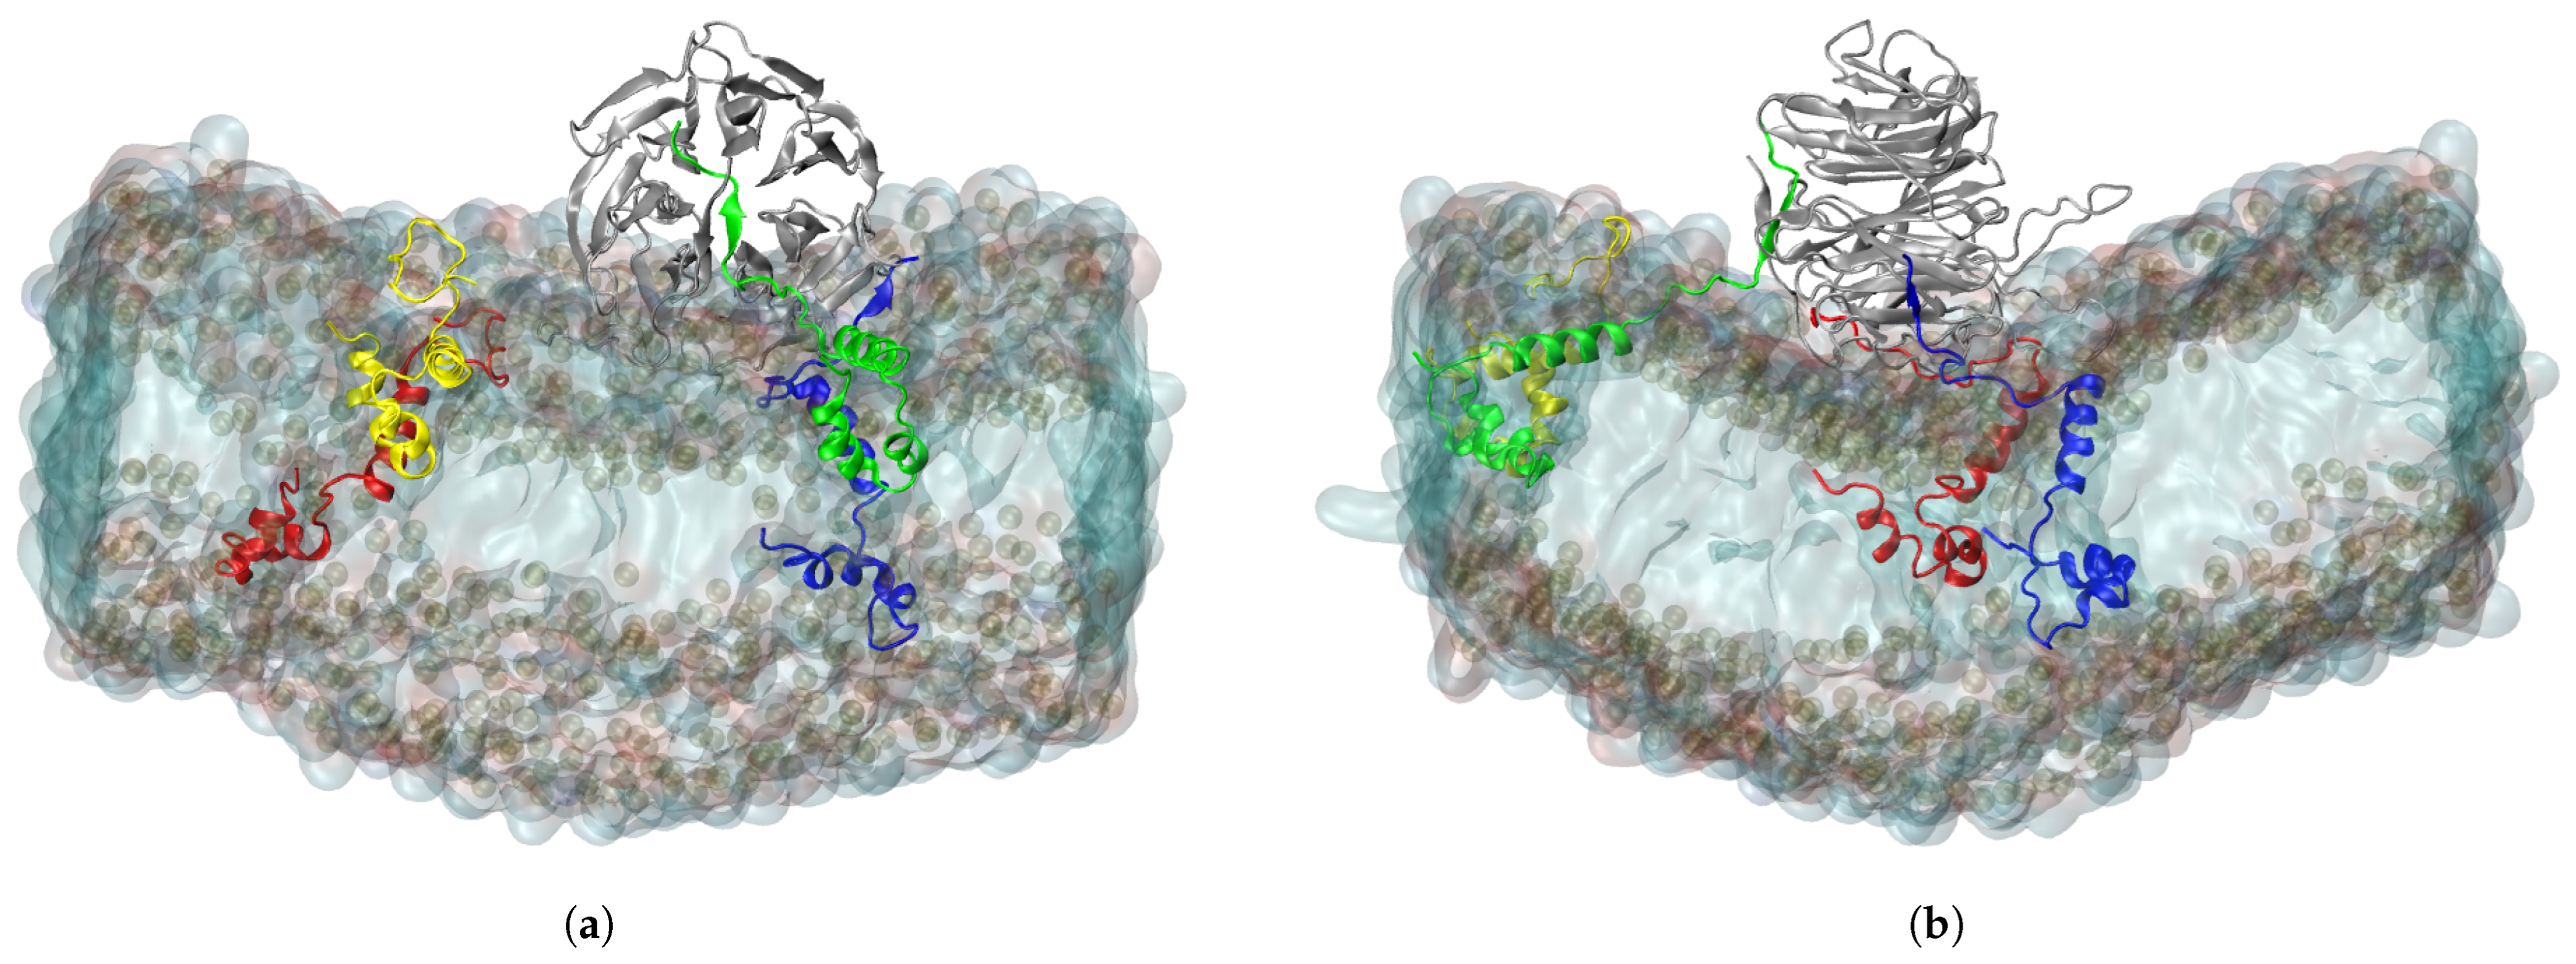
2.2. Structure of ORF6 in an ER Membrane
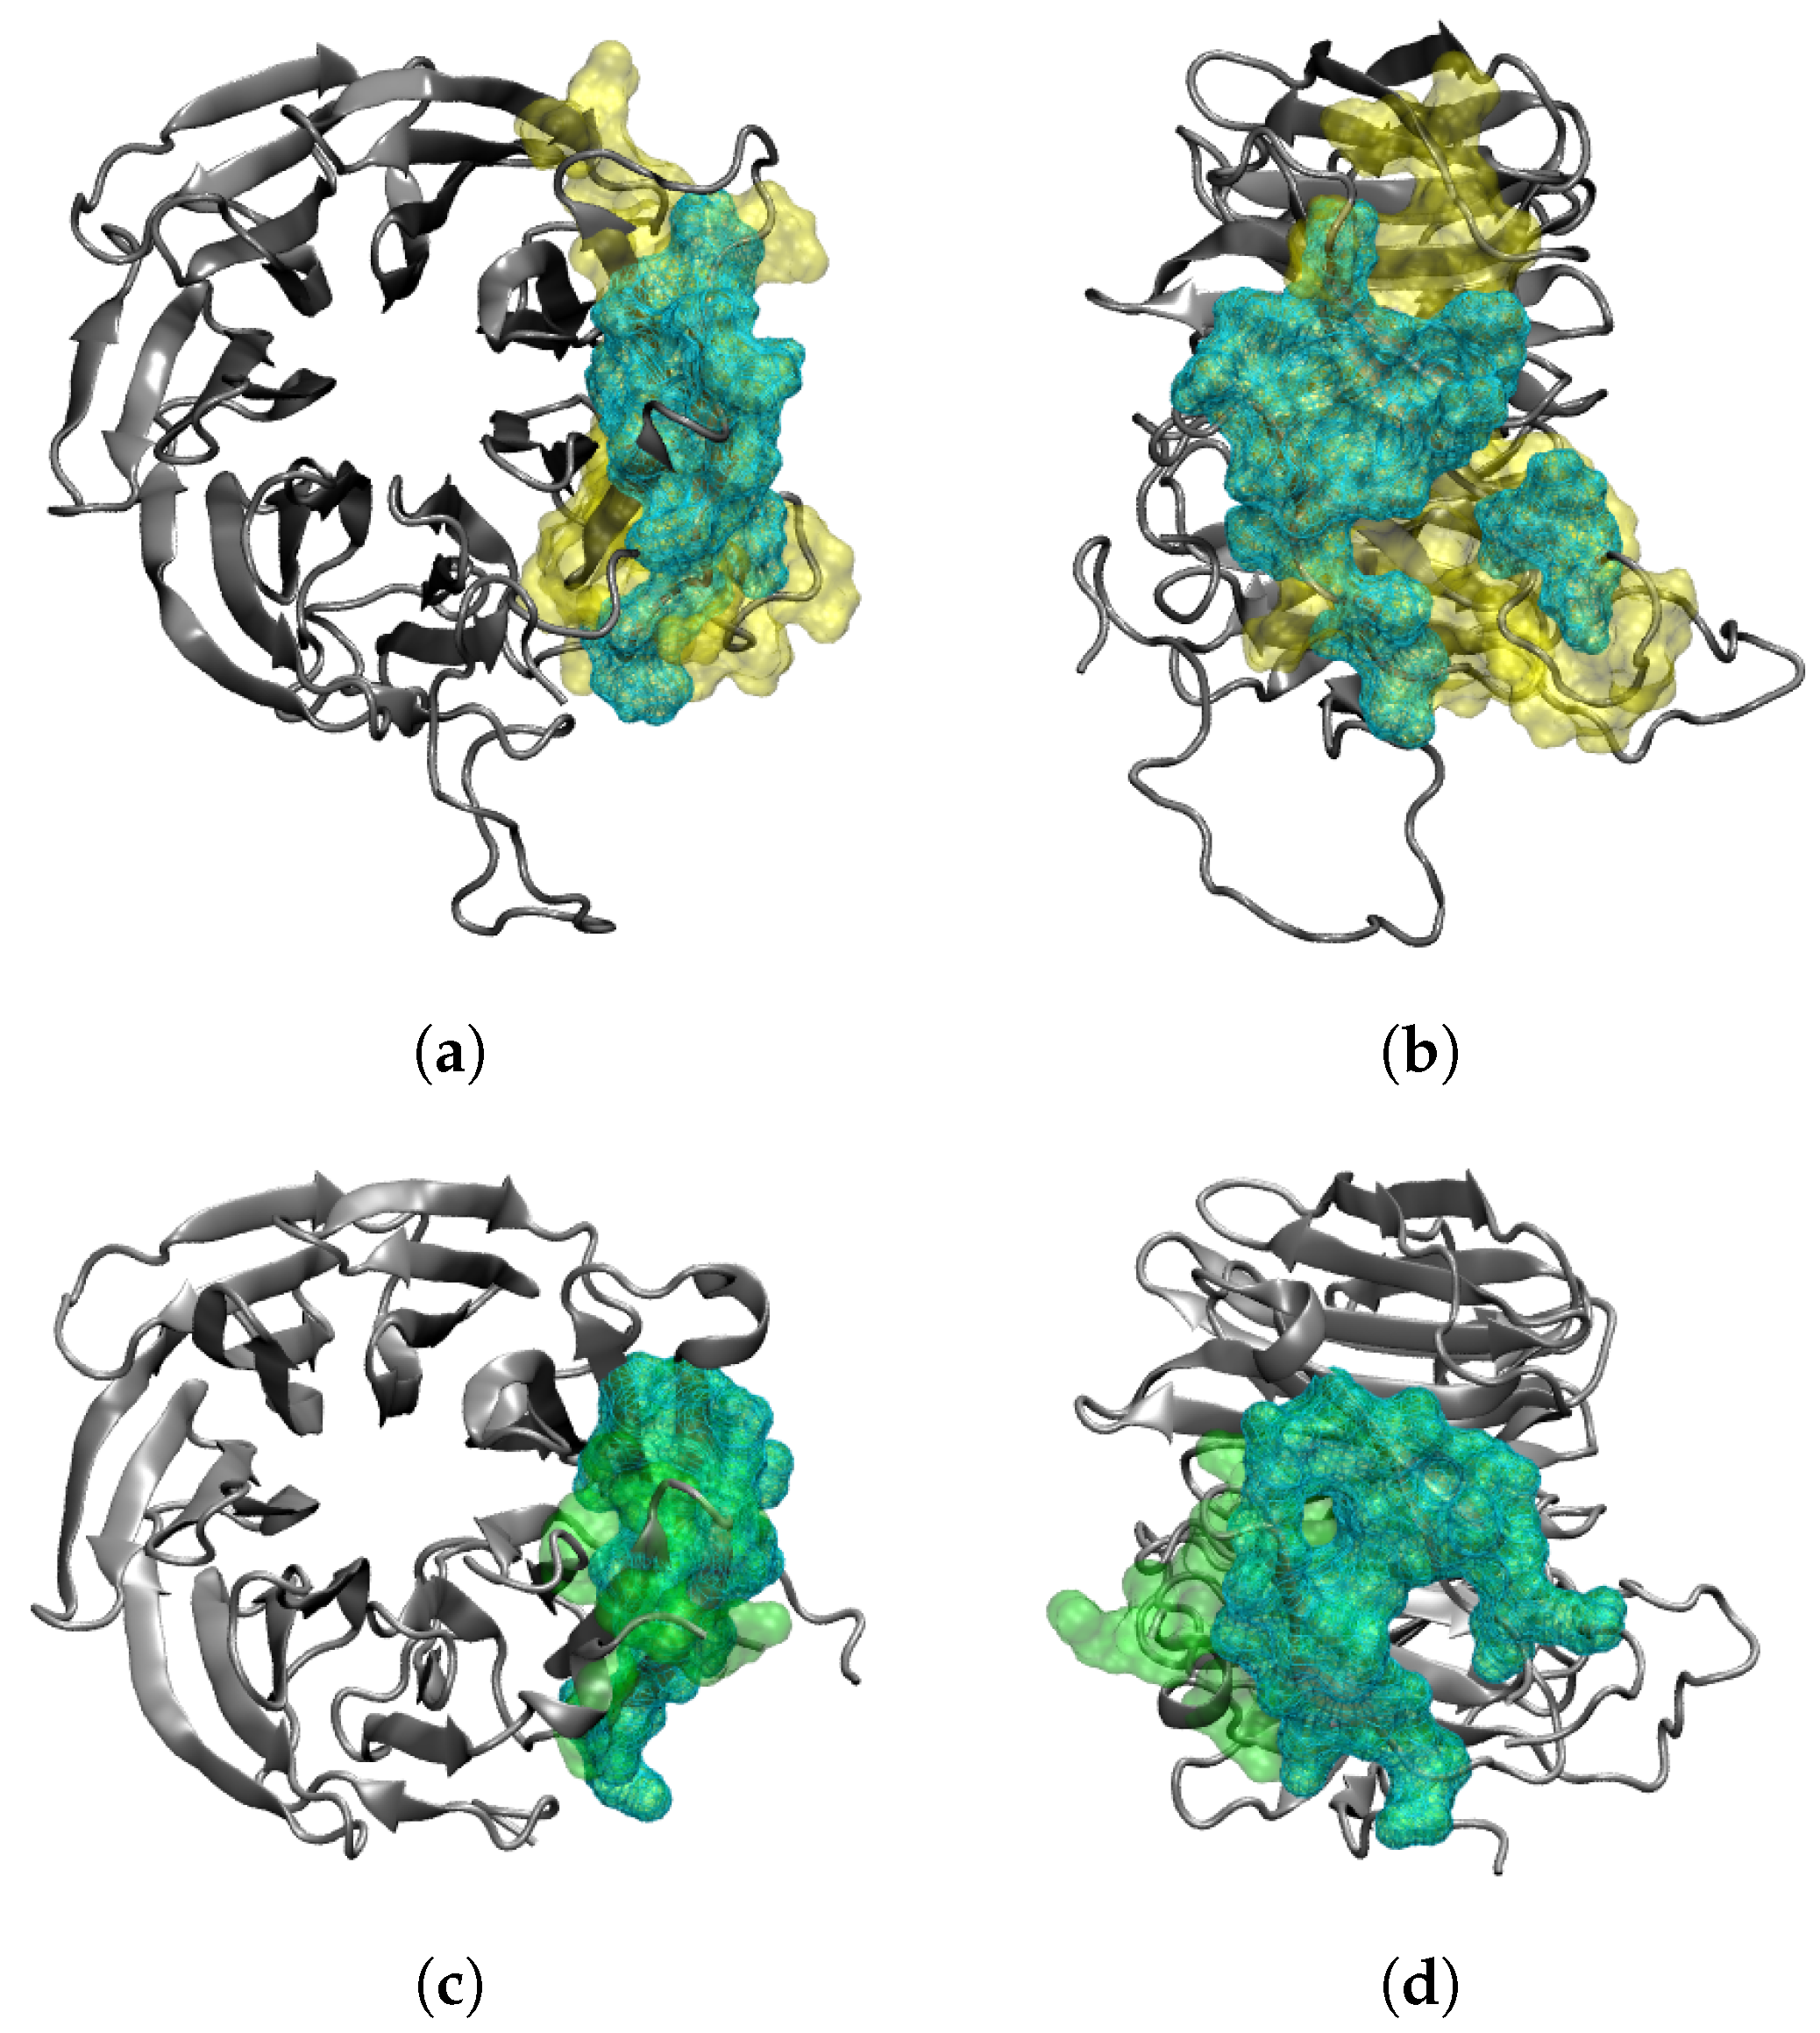
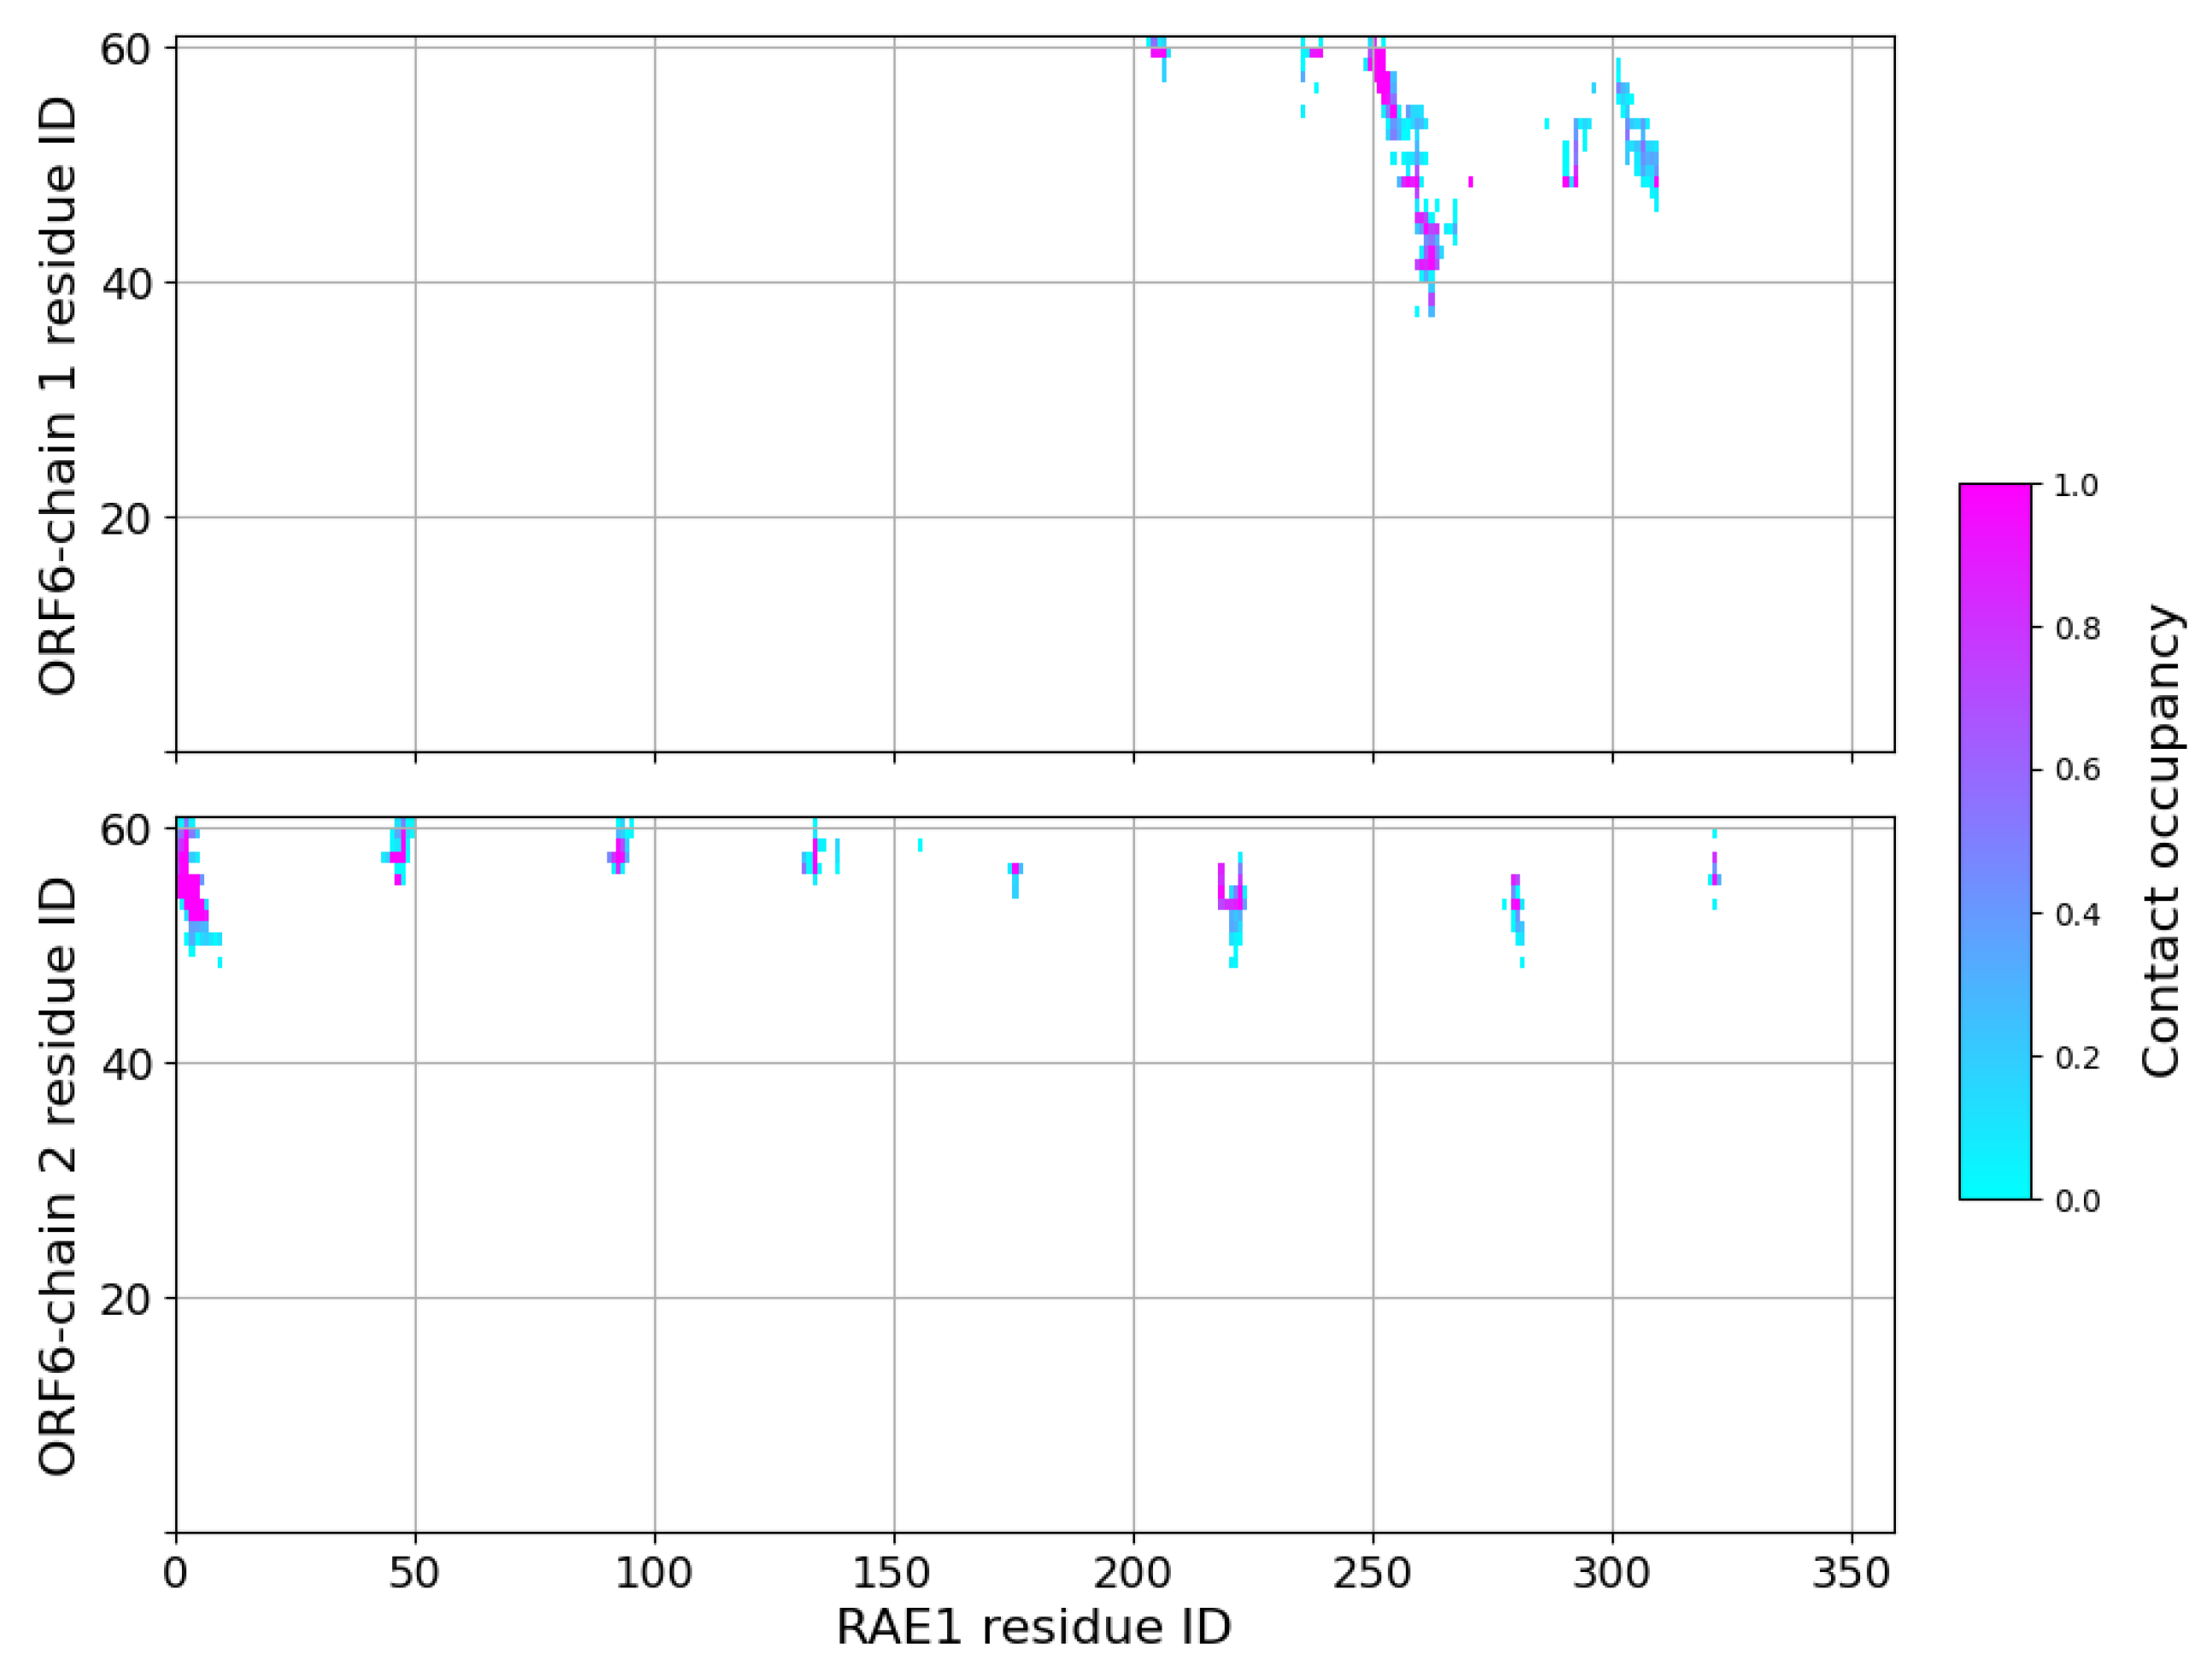
2.3. Interaction of RAE1 and ORF6
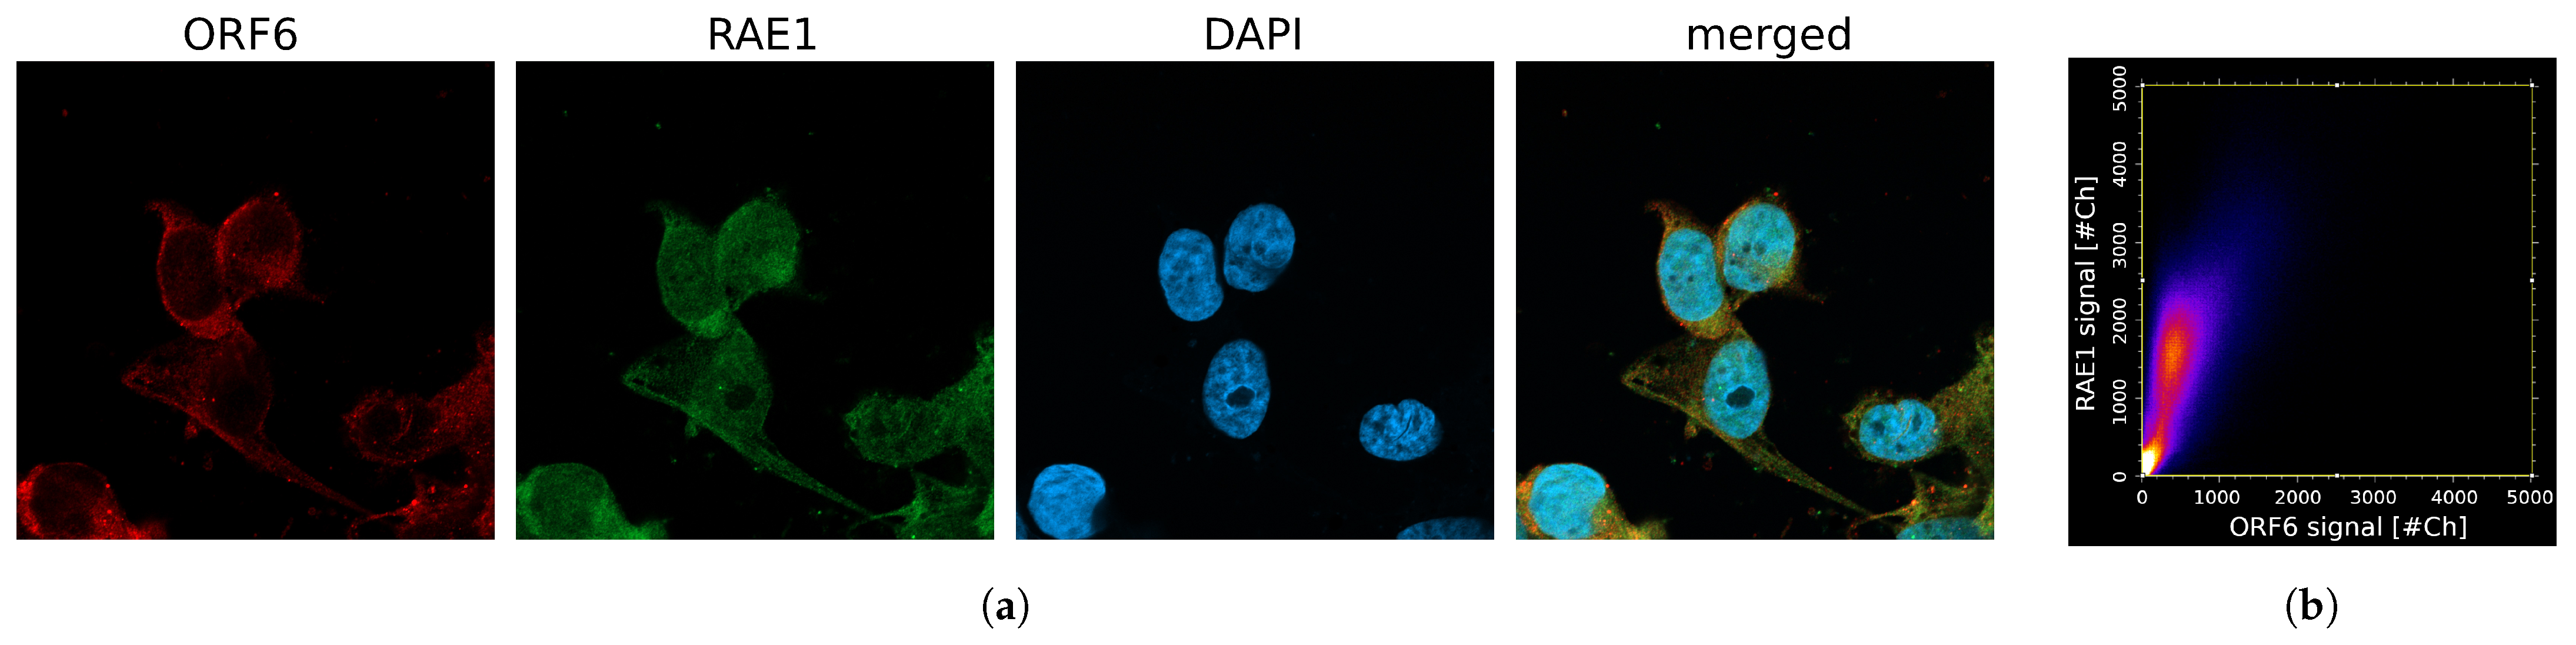
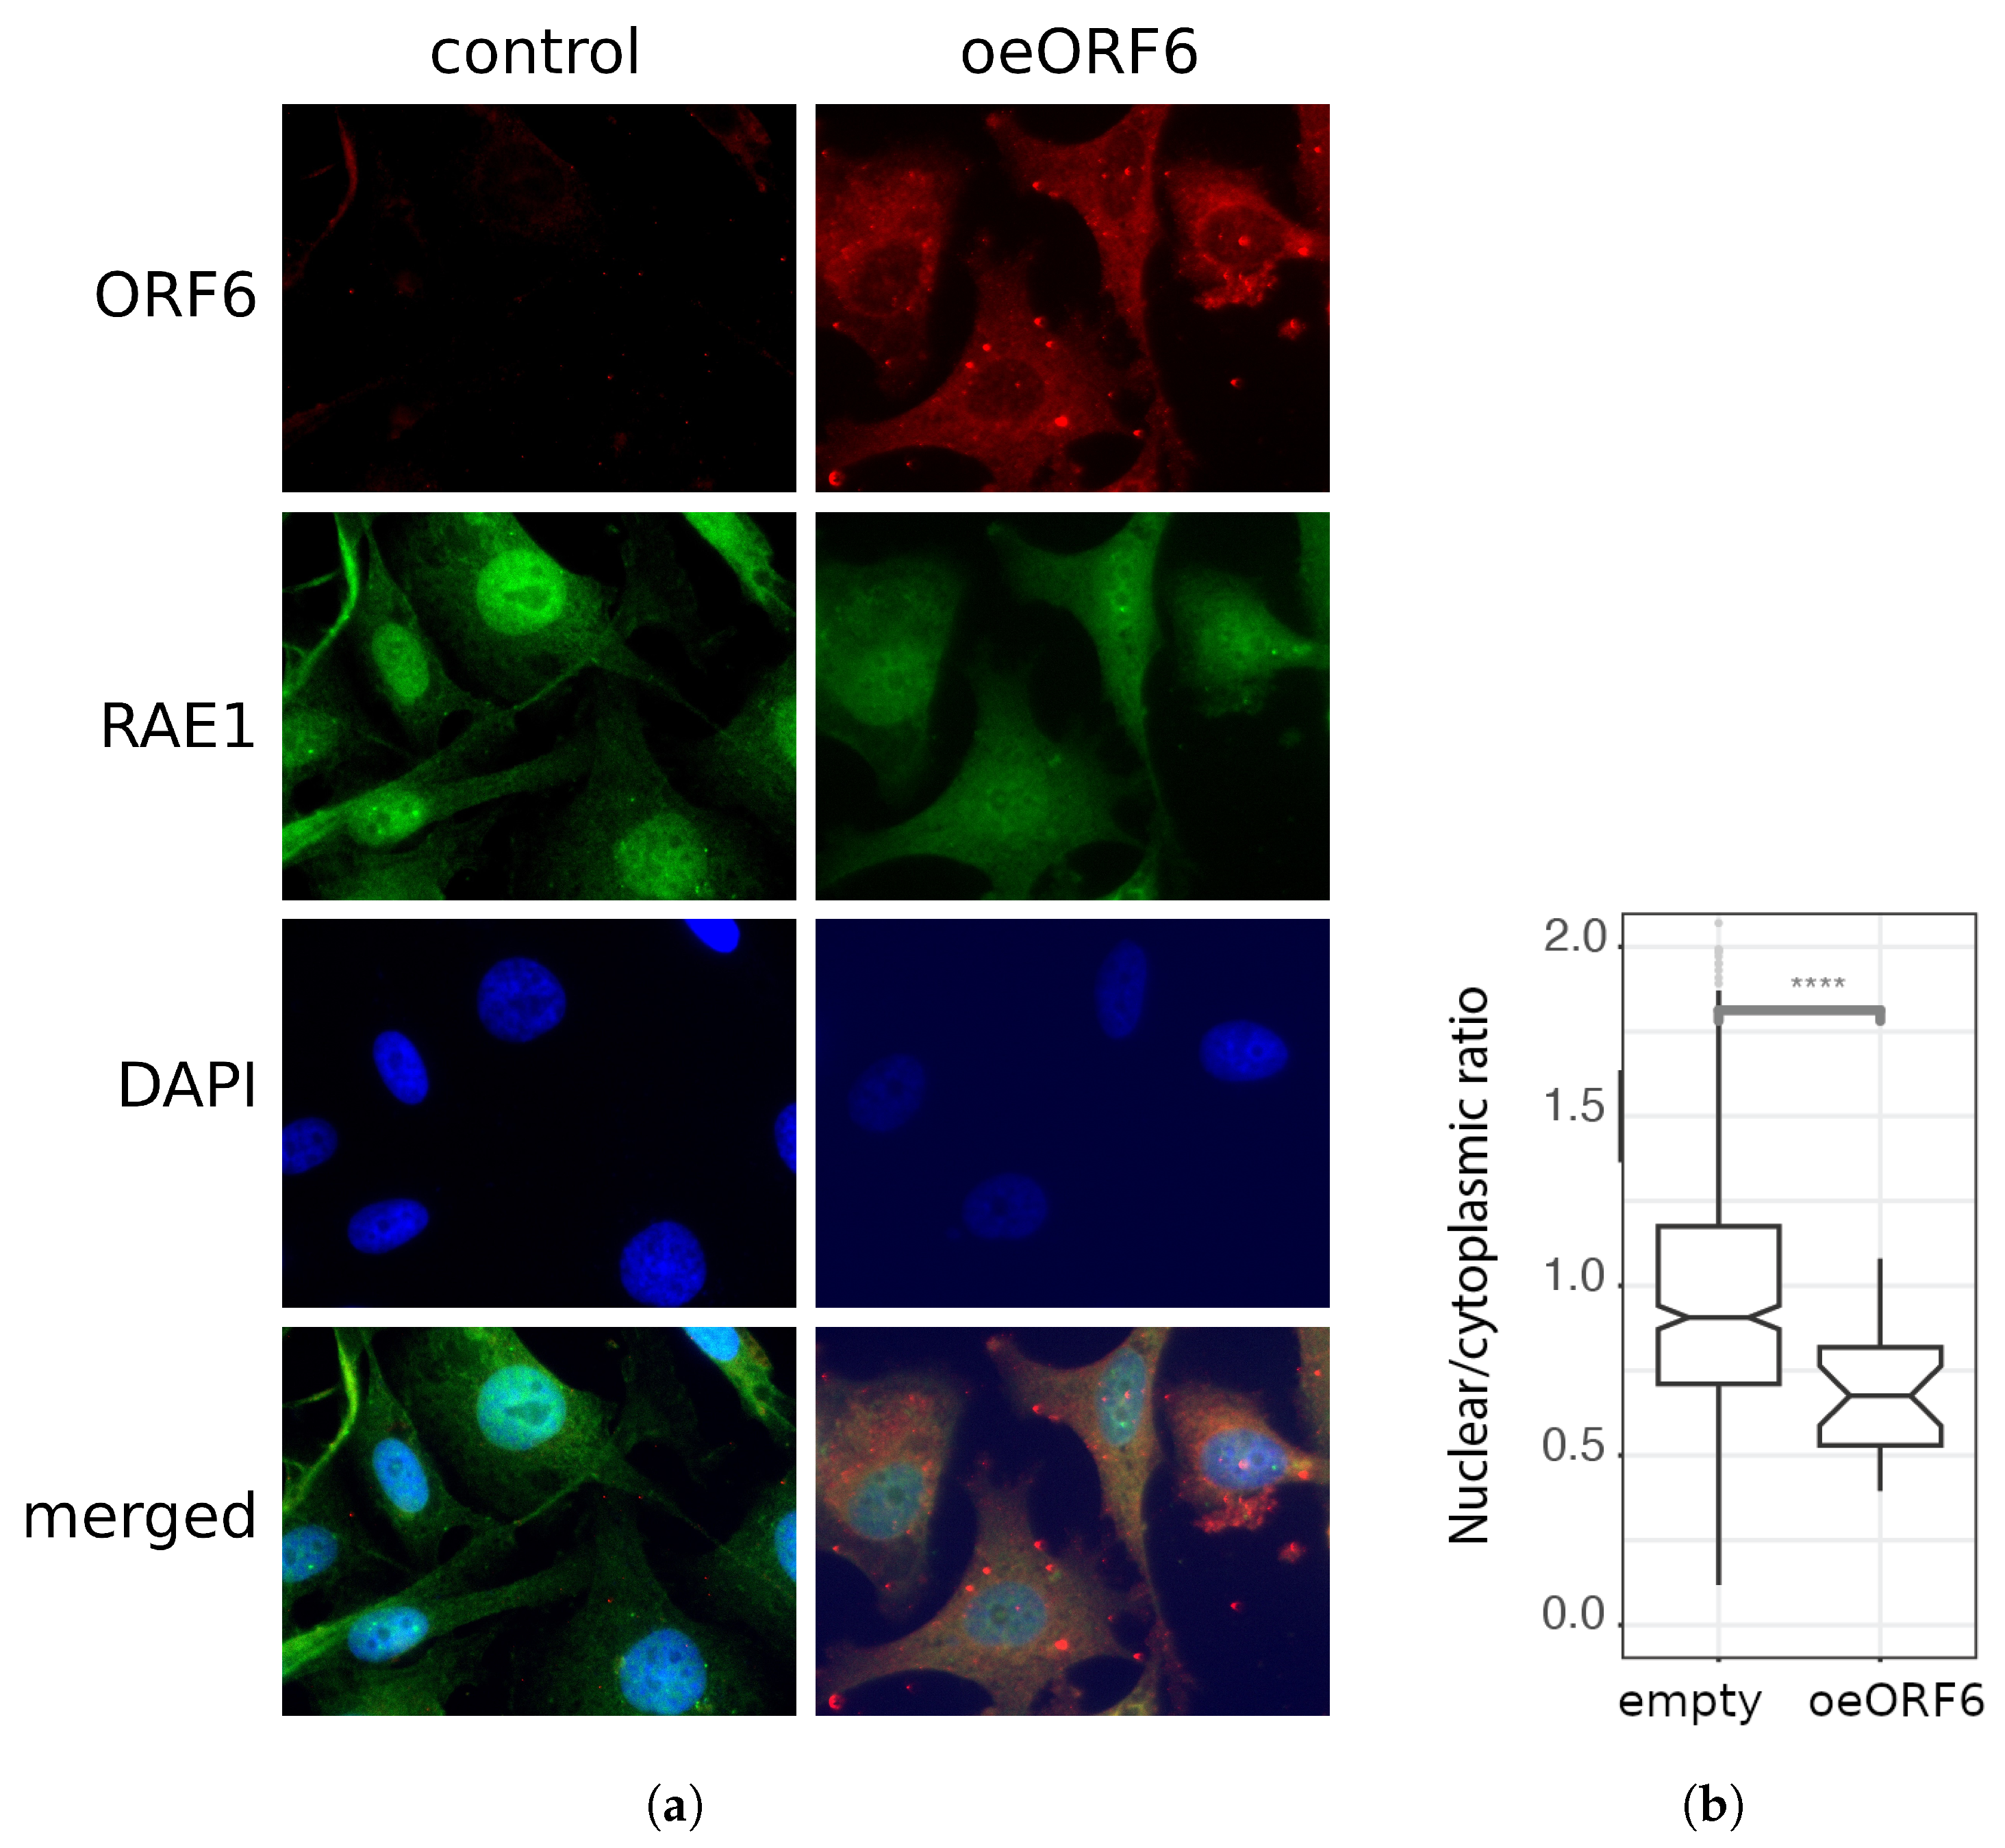
2.4. Co-Localization between RAE1 and ORF6
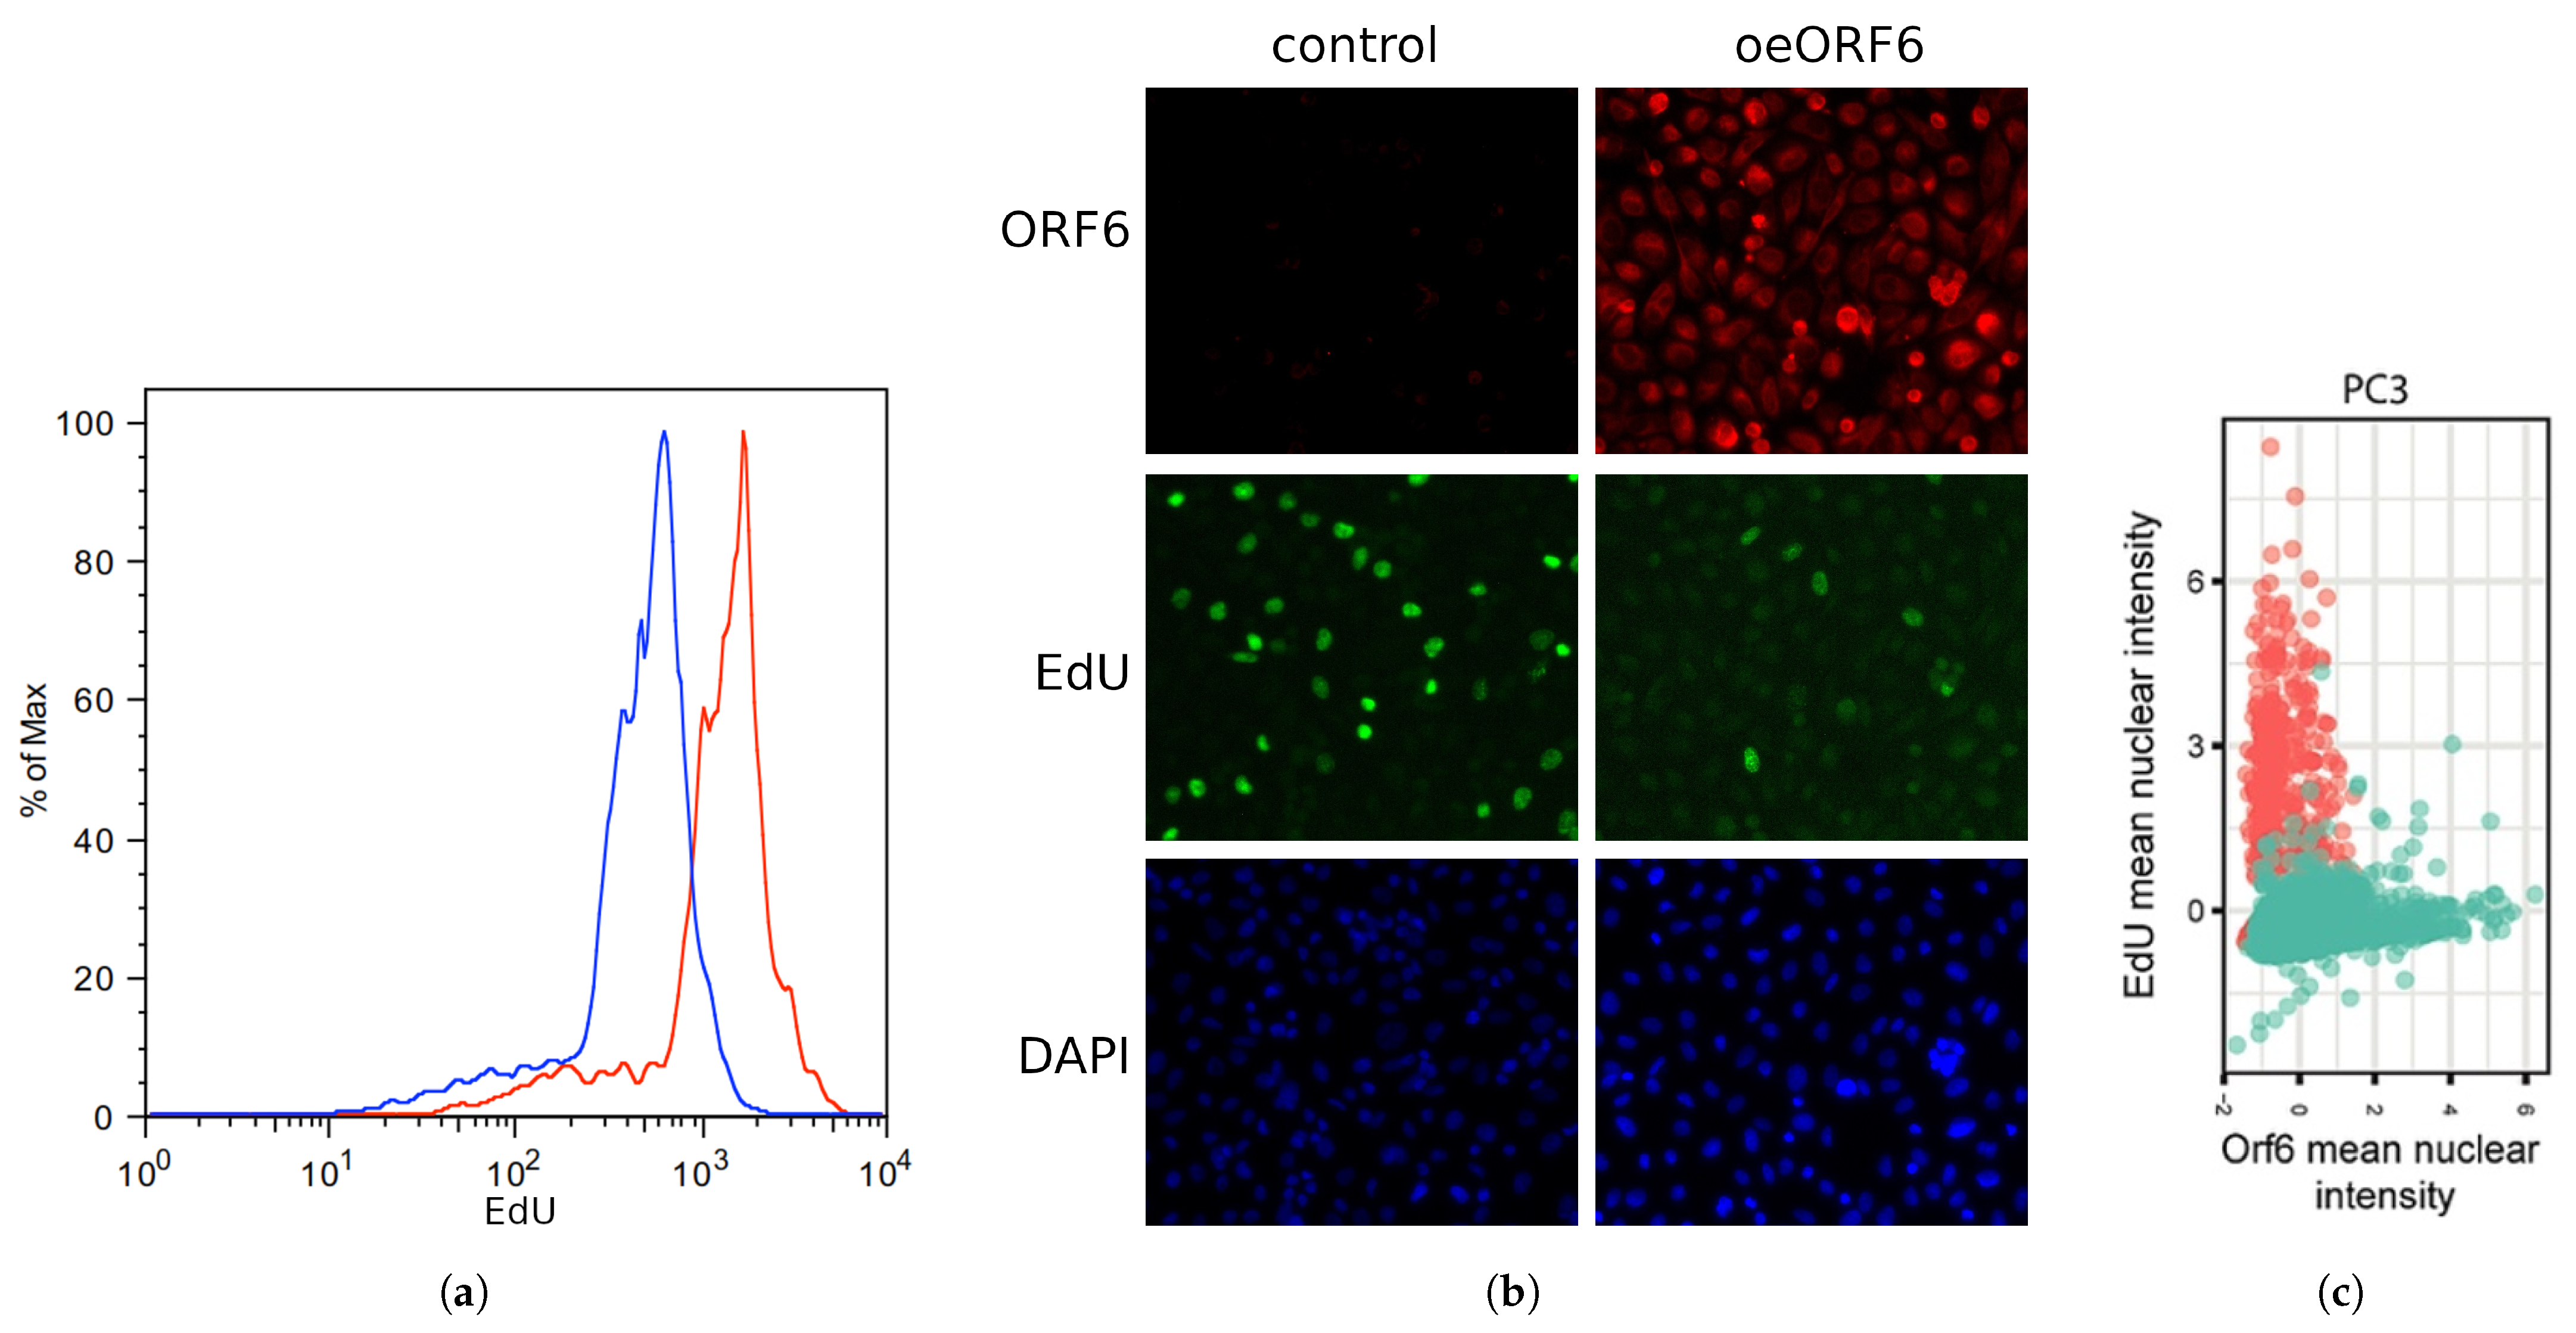
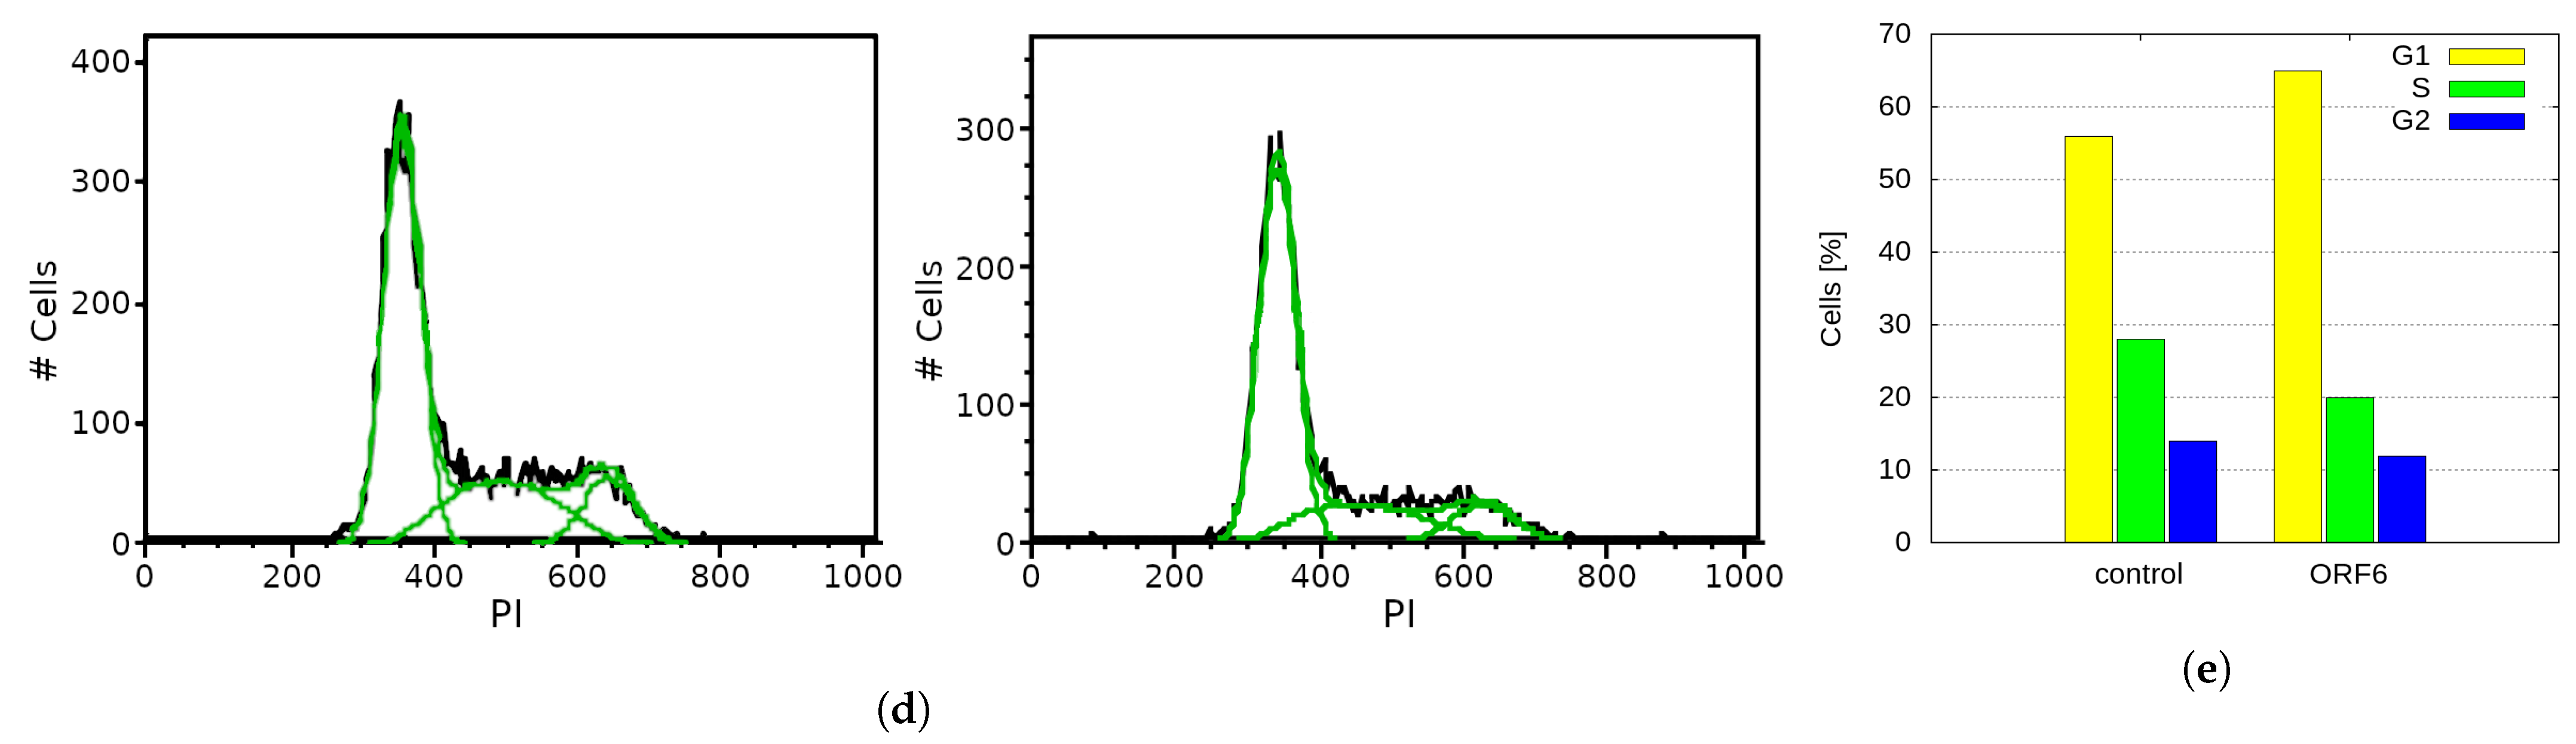
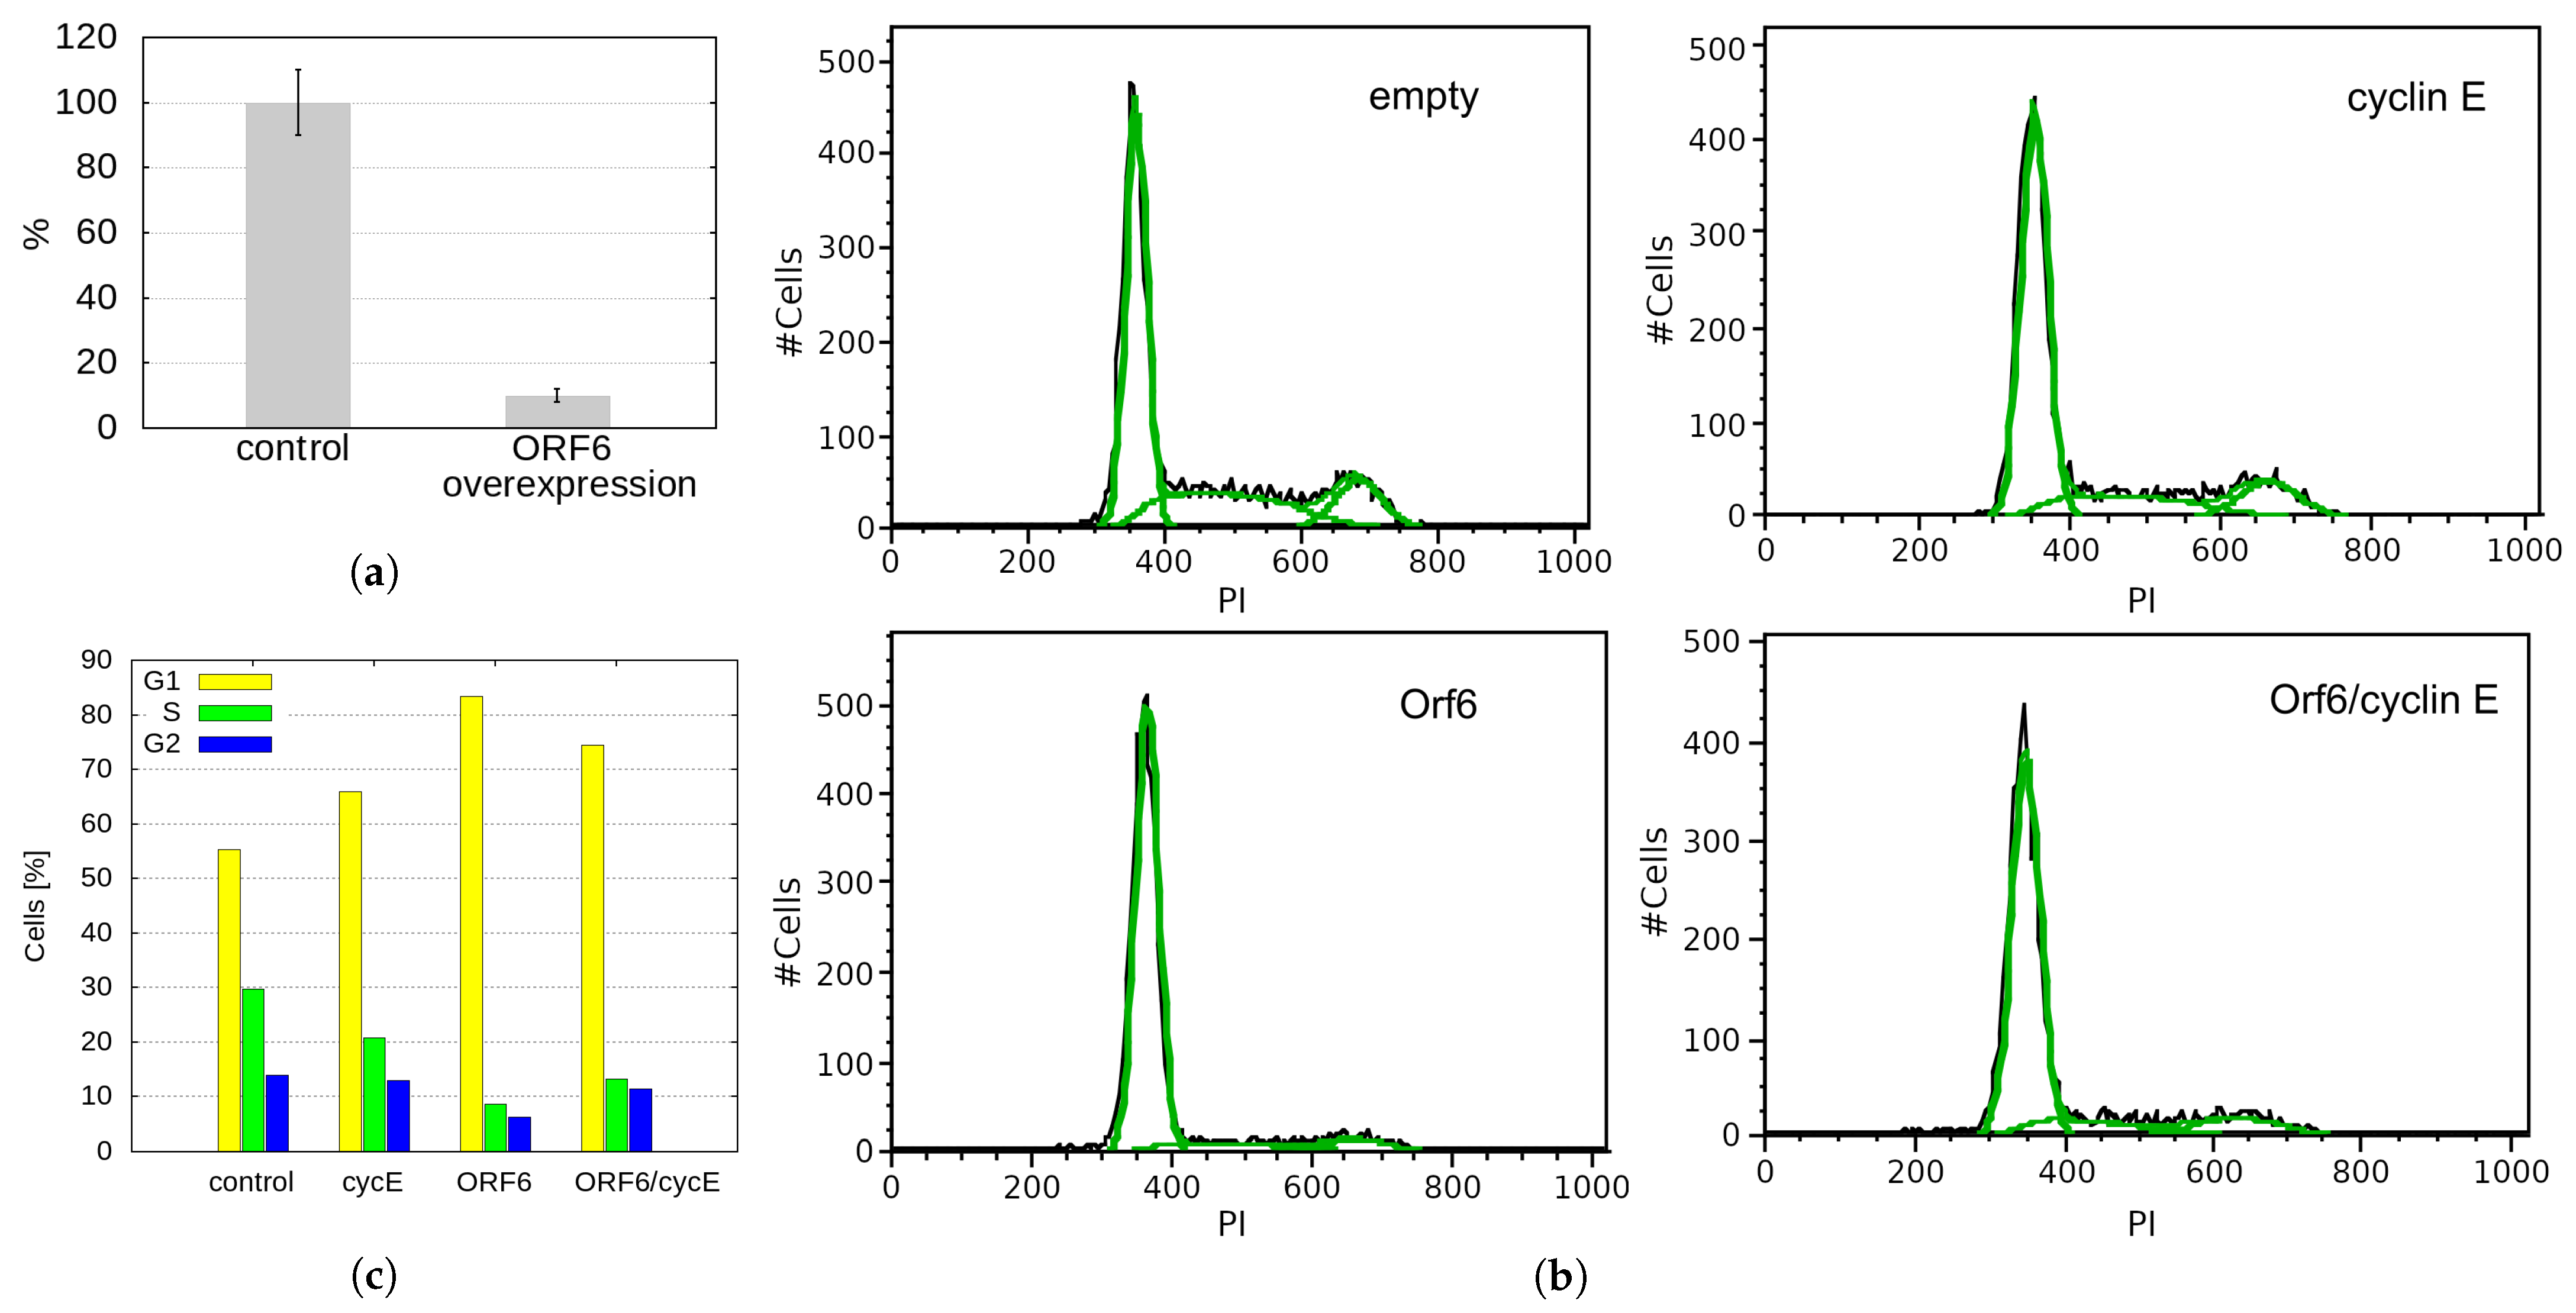
2.5. Overexpression of SARS-CoV-2 ORF6 Inhibits Cell Cycle Progression
2.6. ORF6 Overexpression Inhibits Proliferation by Decreasing Cyclin E Levels
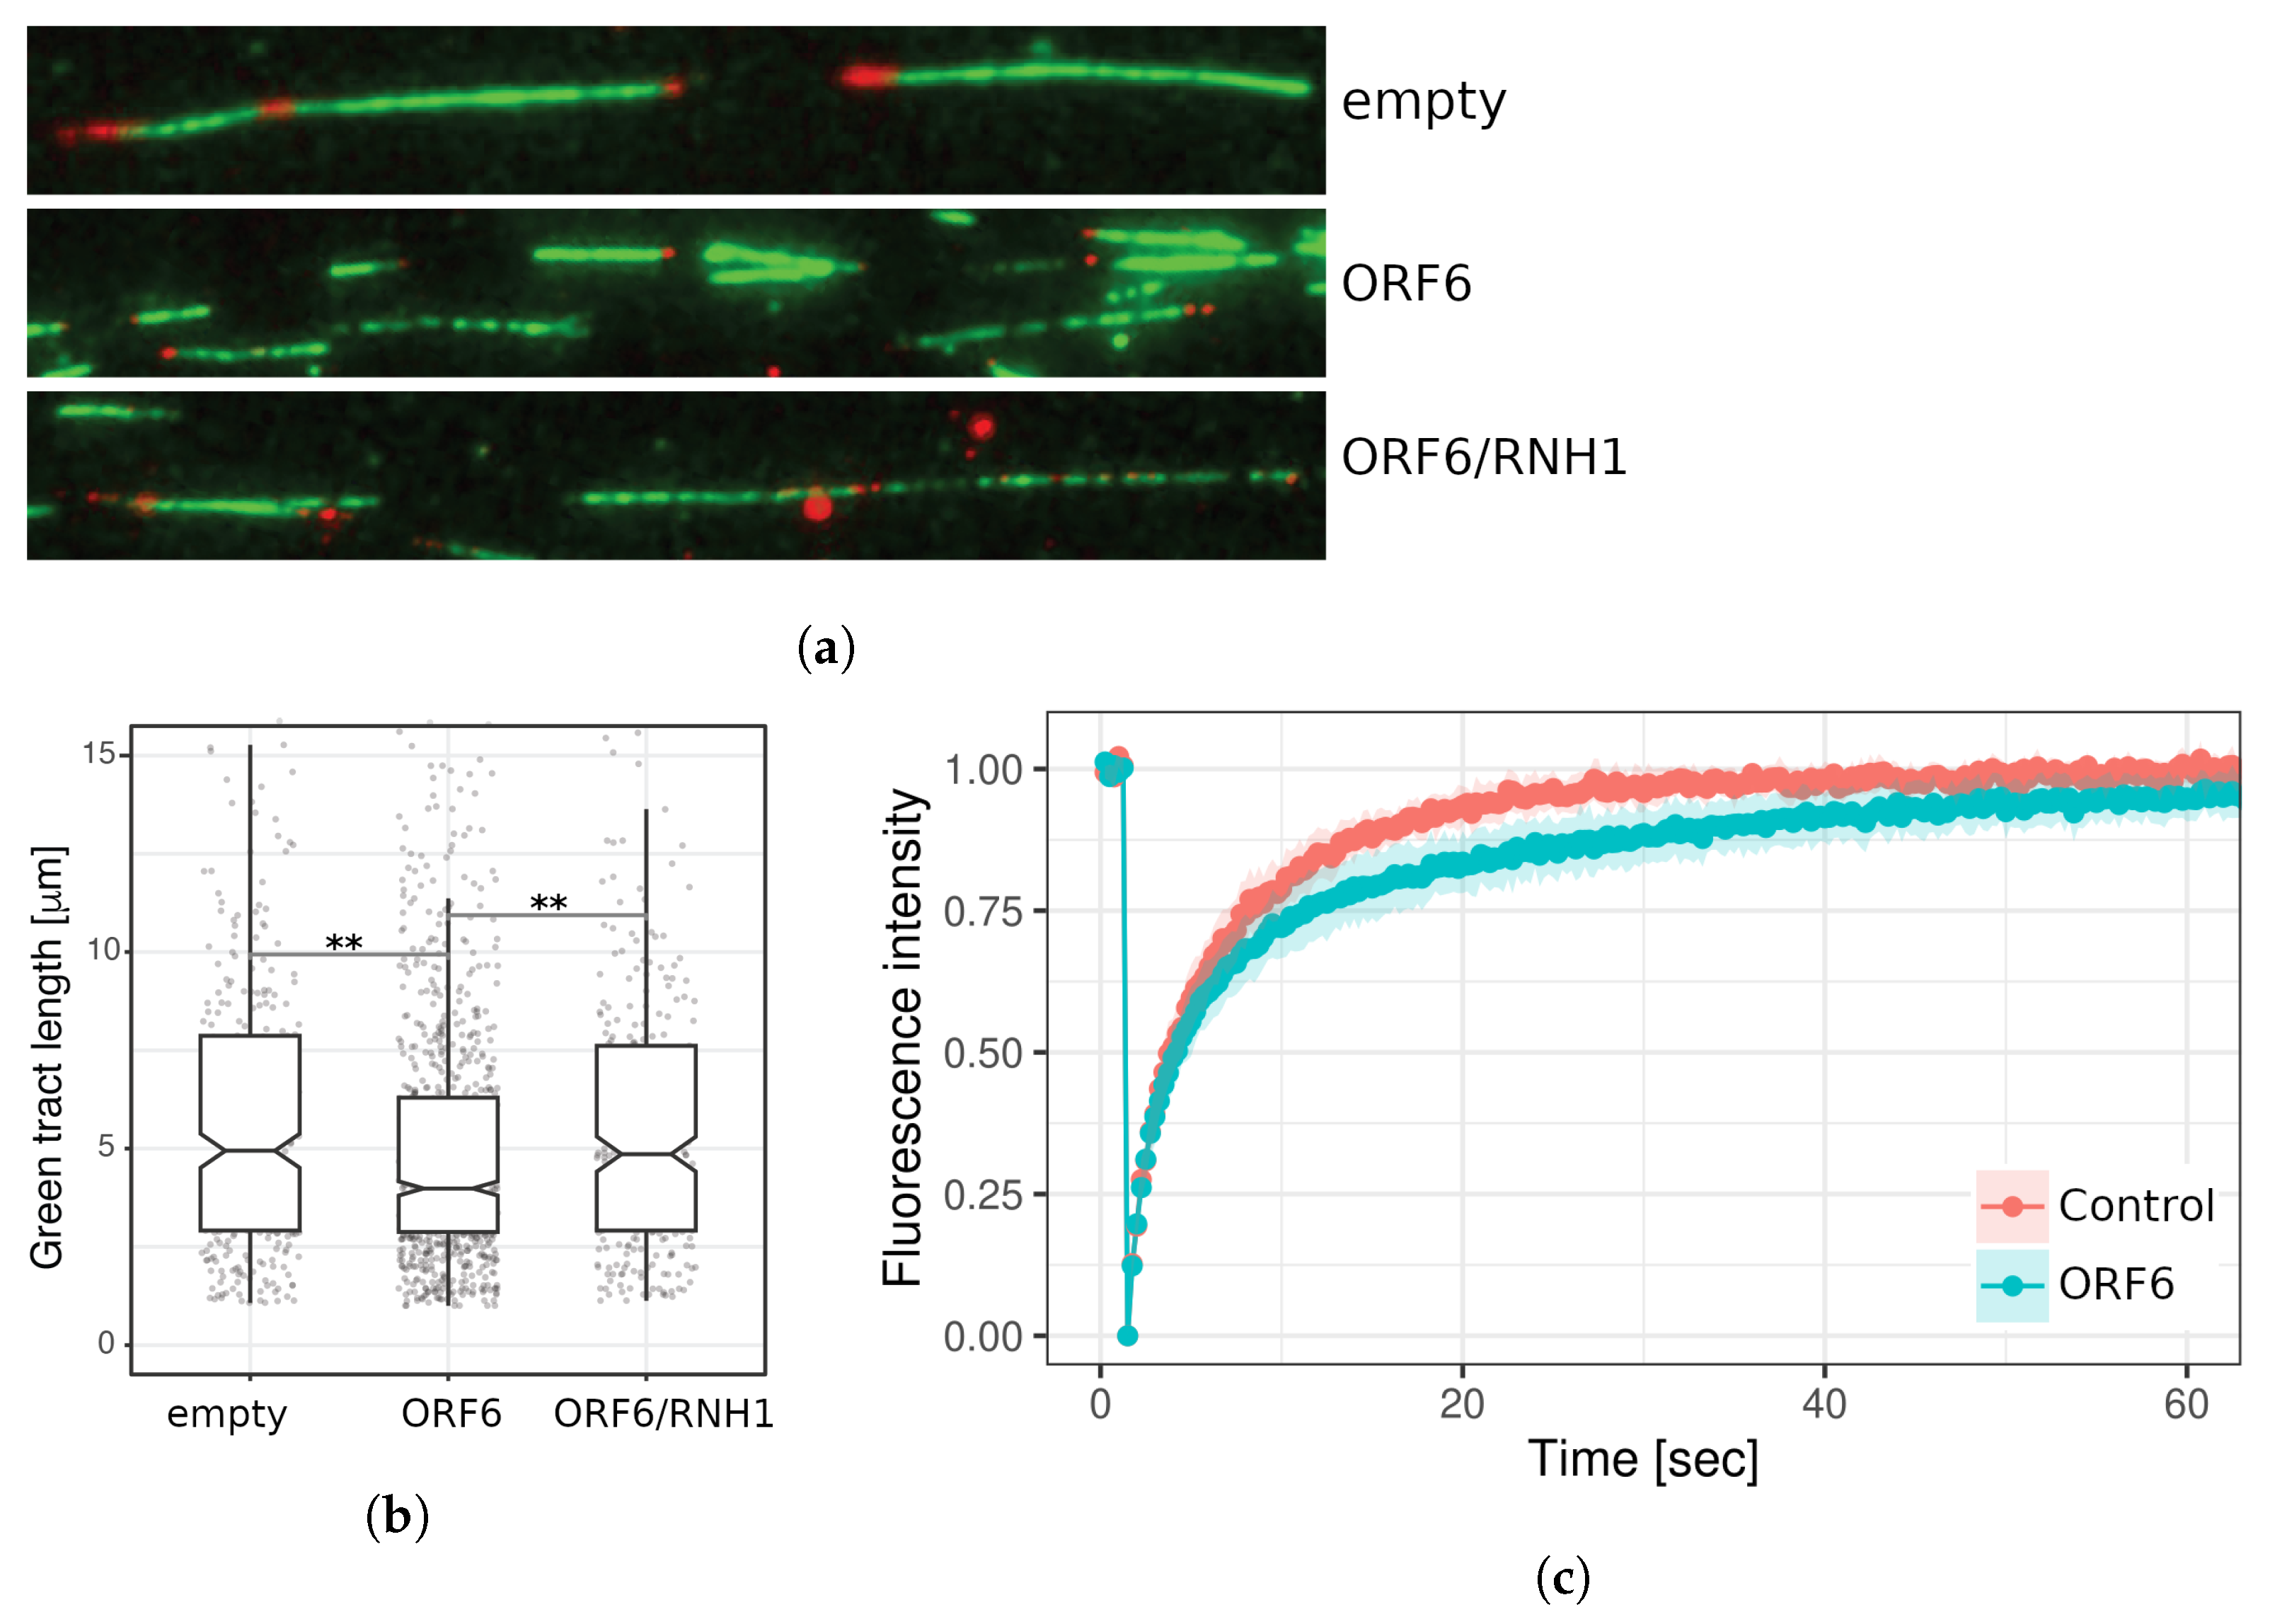
2.7. ORF6 Overexpression Causes Accumulation of R-Loops, Which Impedes Progression of Active Replication Forks
3. Discussion
4. Materials and Methods
4.1. MD Simulation Protocol
4.2. Input Structural Models
4.2.1. SARS-CoV-2 ORF6 Protein
4.2.2. SARS-CoV-2 ORF6 Embedded in a Model ER Membrane
4.3. Modelling the Interaction of SARS-CoV-2 ORF6 and RAE1
4.4. MD Data Analysis
4.5. Cell Culture, Plasmids and Antibodies
4.6. Quantitative Real-Time PCR Analysis
4.7. 5-Ethynyl-2’-deoxyuridine (EdU) Labelling
4.8. Flow Cytometry
4.9. Immunofluorescent Microscopy
4.10. Fluorescence Recovery after Photobleaching (FRAP) Analysis
4.11. DNA Fibre Labeling
5. Conclusions
Supplementary Materials
Author Contributions
Funding
Institutional Review Board Statement
Informed Consent Statement
Data Availability Statement
Acknowledgments
Conflicts of Interest
Abbreviations
| aa | amino acids |
| CHOL | cholesterol |
| ER | endoplasmic reticulum |
| GA | Golgi apparatus |
| MD | molecular dynamics |
| NUP98 | nucleoporin 98 |
| oeORF6 | ORF6-overexpressing cells |
| ORF6 | open reading frame 6 |
| PI | propidium iodide |
| POPC | 1-palmitoyl-2-oleoyl-sn-glycero-3-phosphocholine |
| POPE | 1-palmitoyl-2-oleoyl-sn-glycero-3-phosphoethanolamine |
| POPI | 1-palmitoyl-2-oleoyl-sn-glycero-3-phosphoinositol |
| RAE1 | ribonucleic acid export 1 |
| R | radius of gyration |
| RMSD | root mean square deviation |
| RMSF | root mean square fluctuations |
| SASA | solvent accessible surface area |
References
- Wu, F.; Zhao, S.; Yu, B.; Chen, Y.M.; Wang, W.; Song, Z.G.; Hu, Y.; Tao, Z.W.; Tian, J.H.; Pei, Y.Y.; et al. A new coronavirus associated with human respiratory disease in China. Nature 2020, 579, 265–269. [Google Scholar] [CrossRef]
- Bai, C.; Zhong, Q.; Gao, G. Overview of SARS-CoV-2 genome-encoded proteins. Sci. China Life Sci. 2022, 65, 280–294. [Google Scholar] [CrossRef] [PubMed]
- Zandi, M.; Shafaati, M.; Kalantar-Neyestanaki, D.; Pourghadamyari, H.; Fani, M.; Soltani, S.; Kaleji, H.; Abbasi, S. The role of SARS-CoV-2 accessory proteins in immune evasion. Biomed. Pharmacother. 2022, 156, 113889. [Google Scholar] [CrossRef] [PubMed]
- Redondo, N.; Zaldívar-López, S.; Garrido, J.J.; Montoya, M. SARS-CoV-2 Accessory Proteins in Viral Pathogenesis: Knowns and Unknowns. Front. Immunol. 2021, 12. [Google Scholar] [CrossRef]
- Kimura, I.; Konno, Y.; Uriu, K.; Hopfensperger, K.; Sauter, D.; Nakagawa, S.; Sato, K. Sarbecovirus ORF6 proteins hamper induction of interferon signaling. Cell Rep. 2021, 34, 108916. [Google Scholar] [CrossRef]
- Grellet, E.; L’Hôte, I.; Goulet, A.; Imbert, I. Replication of the coronavirus genome: A paradox among positive-strand RNA viruses. J. Biol. Chem. 2022, 298, 101923. [Google Scholar] [CrossRef]
- Mironov, A.A.; Savin, M.A.; Beznoussenko, G.V. COVID-19 Biogenesis and Intracellular Transport. Int. J. Mol. Sci. 2023, 24, 4523. [Google Scholar] [CrossRef]
- Rashid, F.; Xie, Z.; Suleman, M.; Shah, A.; Khan, S.; Luo, S. Roles and functions of SARS-CoV-2 proteins in host immune evasion. Front. Immunol. 2022, 13, 940756. [Google Scholar] [CrossRef]
- Zhang, D.; Zhu, L.; Wang, Y.; Li, P.; Gao, Y. Translational Control of COVID-19 and Its Therapeutic Implication. Front. Immunol. 2022, 13, 857490. [Google Scholar] [CrossRef]
- Yan, W.; Zheng, Y.; Zeng, X.; He, B.; Cheng, W. Structural biology of SARS-CoV-2: Open the door for novel therapies. Signal Transduct. Target. Ther. 2022, 7, 26. [Google Scholar] [CrossRef] [PubMed]
- Harrison, A.G.; Lin, T.; Wang, P. Mechanisms of SARS-CoV-2 Transmission and Pathogenesis. Trends Immunol. 2020, 41, 1100–1115. [Google Scholar] [CrossRef]
- Brant, A.C.; Tian, W.; Majerciak, V.; Yang, W.; Zheng, Z.M. SARS-CoV-2: From its discovery to genome structure, transcription, and replication. Cell Biosci. 2021, 11, 136. [Google Scholar] [CrossRef] [PubMed]
- Frieman, M.; Yount, B.; Heise, M.; Kopecky-Bromberg, S.A.; Palese, P.; Baric, R.S. Severe Acute Respiratory Syndrome Coronavirus ORF6 Antagonizes STAT1 Function by Sequestering Nuclear Import Factors on the Rough Endoplasmic Reticulum/Golgi Membrane. J. Virol. 2007, 81, 9812–9824. [Google Scholar] [CrossRef]
- Kopecky-Bromberg, S.A.; Martínez-Sobrido, L.; Frieman, M.; Baric, R.A.; Palese, P. Severe Acute Respiratory Syndrome Coronavirus Open Reading Frame (ORF) 3b, ORF 6, and Nucleocapsid Proteins Function as Interferon Antagonists. J. Virol. 2007, 81, 548–557. [Google Scholar] [CrossRef] [PubMed]
- Miorin, L.; Kehrer, T.; Sanchez-Aparicio, M.T.; Zhang, K.; Cohen, P.; Patel, R.S.; Cupic, A.; Makio, T.; Mei, M.; Moreno, E.; et al. SARS-CoV-2 Orf6 hijacks Nup98 to block STAT nuclear import and antagonize interferon signaling. Proc. Natl. Acad. Sci. USA 2020, 117, 28344–28354. [Google Scholar] [CrossRef] [PubMed]
- Li, T.; Wen, Y.; Guo, H.; Yang, T.; Yang, H.; Ji, X. Molecular Mechanism of SARS-CoVs Orf6 Targeting the Rae1–Nup98 Complex to Compete With mRNA Nuclear Export. Front. Mol. Biosci. 2022, 8, 813248. [Google Scholar] [CrossRef] [PubMed]
- Yuen, C.K.; Lam, J.Y.; Wong, W.M.; Mak, L.F.; Wang, X.; Chu, H.; Cai, J.P.; Jin, D.Y.; To, K.K.W.; Chan, J.F.W.; et al. SARS-CoV-2 nsp13, nsp14, nsp15 and orf6 function as potent interferon antagonists. Emerg. Microbes Infect. 2020, 9, 1418–1428. [Google Scholar] [CrossRef] [PubMed]
- Miyamoto, Y.; Itoh, Y.; Suzuki, T.; Tanaka, T.; Sakai, Y.; Koido, M.; Hata, C.; Wang, C.X.; Otani, M.; Moriishi, K.; et al. SARS-CoV-2 ORF6 disrupts nucleocytoplasmic trafficking to advance viral replication. Commun. Biol. 2022, 5, 483. [Google Scholar] [CrossRef]
- Lee, J.G.; Huang, W.; Lee, H.; van de Leemput, J.; Kane, M.A.; Han, Z. Characterization of SARS-CoV-2 proteins reveals Orf6 pathogenicity, subcellular localization, host interactions and attenuation by Selinexor. Cell Biosci. 2021, 11, 58. [Google Scholar] [CrossRef] [PubMed]
- Lei, X.; Dong, X.; Ma, R.; Wang, W.; Xiao, X.; Tian, Z.; Wang, C.; Wang, Y.; Li, L.; Ren, L.; et al. Activation and evasion of type I interferon responses by SARS-CoV-2. Nat. Commun. 2020, 11, 3810. [Google Scholar] [CrossRef]
- Zhang, J.; Cruz-cosme, R.; Zhuang, M.W.; Liu, D.; Liu, Y.; Teng, S.; Wang, P.H.; Tang, Q. A systemic and molecular study of subcellular localization of SARS-CoV-2 proteins. Signal Transduct. Target. Ther. 2020, 5, 269. [Google Scholar] [CrossRef]
- Morais da Silva, M.; Lira de Lucena, A.S.; Paiva Júnior, S.d.S.L.; Florêncio De Carvalho, V.M.; Santana de Oliveira, P.S.; da Rosa, M.M.; Barreto de Melo Rego, M.J.; Pitta, M.G.d.R.; Pereira, M.C. Cell death mechanisms involved in cell injury caused by SARS-CoV-2. Rev. Med. Virol. 2022, 32, e2292. [Google Scholar] [CrossRef] [PubMed]
- Kaur, M.; Sharma, A.; Kumar, S.; Singh, G.; Barnwal, R.P. SARS-CoV-2: Insights into its structural intricacies and functional aspects for drug and vaccine development. Int. J. Biol. Macromol. 2021, 179, 45–60. [Google Scholar] [CrossRef] [PubMed]
- Netland, J.; Ferraro, D.; Pewe, L.; Olivares, H.; Gallagher, T.; Perlman, S. Enhancement of Murine Coronavirus Replication by Severe Acute Respiratory Syndrome Coronavirus Protein 6 Requires the N-Terminal Hydrophobic Region but Not C-Terminal Sorting Motifs. J. Virol. 2007, 81, 11520–11525. [Google Scholar] [CrossRef]
- Zhao, J.; Falcón, A.; Zhou, H.; Netland, J.; Enjuanes, L.; Breña, P.P.; Perlman, S. Severe Acute Respiratory Syndrome Coronavirus Protein 6 Is Required for Optimal Replication. J. Virol. 2009, 83, 2368–2373. [Google Scholar] [CrossRef]
- Gordon, D.E.; Jang, G.M.; Bouhaddou, M.; Xu, J.; Obernier, K.; White, K.M.; O’Meara, M.J.; Rezelj, V.V.; Guo, J.Z.; Swaney, D.L.; et al. A SARS-CoV-2 protein interaction map reveals targets for drug repurposing. Nature 2020, 583, 459–468. [Google Scholar] [CrossRef] [PubMed]
- Kato, K.; Ikliptikawati, D.K.; Kobayashi, A.; Kondo, H.; Lim, K.; Hazawa, M.; Wong, R.W. Overexpression of SARS-CoV-2 protein ORF6 dislocates RAE1 and NUP98 from the nuclear pore complex. Biochem. Biophys. Res. Commun. 2021, 536, 59–66. [Google Scholar] [CrossRef]
- Addetia, A.; Lieberman, N.A.P.; Phung, Q.; Hsiang, T.Y.; Xie, H.; Roychoudhury, P.; Shrestha, L.; Loprieno, M.A.; Huang, M.L.; Gale, M.; et al. SARS-CoV-2 ORF6 Disrupts Bidirectional Nucleocytoplasmic Transport through Interactions with Rae1 and Nup98. mBio 2021, 12, e00065-21. [Google Scholar] [CrossRef]
- Wong, H.T.; Cheung, V.; Salamango, D.J. Decoupling SARS-CoV-2 ORF6 localization and interferon antagonism. J. Cell Sci. 2022, 135, jcs259666. [Google Scholar] [CrossRef]
- Gao, X.; Tian, H.; Zhu, K.; Li, Q.; Hao, W.; Wang, L.; Qin, B.; Deng, H.; Cui, S. Structural basis for Sarbecovirus ORF6 mediated blockage of nucleocytoplasmic transport. Nat. Commun. 2022, 13, 4782. [Google Scholar] [CrossRef]
- Ren, Y.; Seo, H.S.; Blobel, G.; Hoelz, A. Structural and functional analysis of the interaction between the nucleoporin Nup98 and the mRNA export factor Rae1. Proc. Natl. Acad. Sci. USA 2010, 107, 10406–10411. [Google Scholar] [CrossRef] [PubMed]
- Quan, B.; Seo, H.S.; Blobel, G.; Ren, Y. Vesiculoviral matrix (M) protein occupies nucleic acid binding site at nucleoporin pair (Rae1•Nup98). Proc. Natl. Acad. Sci. USA 2014, 111, 9127–9132. [Google Scholar] [CrossRef]
- Salic, A.; Mitchison, T.J. A chemical method for fast and sensitive detection of DNA synthesis in vivo. Proc. Natl. Acad. Sci. USA 2008, 105, 2415–2420. [Google Scholar] [CrossRef]
- Sunwoo, H.H.; Suresh, M.R. Chapter 9.13—Cancer Markers. In The Immunoassay Handbook, 4th ed.; Wild, D., Ed.; Elsevier: Oxford, UK, 2013; pp. 833–856. [Google Scholar] [CrossRef]
- Sitterlin, D. Characterization of the Drosophila Rae1 protein as a G1 phase regulator of the cell cycle. Gene 2004, 326, 107–116. [Google Scholar] [CrossRef]
- Jimeno, S.; Rondón, A.G.; Luna, R.; Aguilera, A. The yeast THO complex and mRNA export factors link RNA metabolism with transcription and genome instability. EMBO J. 2002, 21, 3526–3535. [Google Scholar] [CrossRef] [PubMed]
- Zenklusen, D.; Vinciguerra, P.; Wyss, J.C.; Stutz, F. Stable mRNP Formation and Export Require Cotranscriptional Recruitment of the mRNA Export Factors Yra1p and Sub2p by Hpr1p. Mol. Cell. Biol. 2002, 22, 8241–8253. [Google Scholar] [CrossRef] [PubMed]
- Domínguez-Sánchez, M.S.; Barroso, S.; Gímez-González, B.; Luna, R.; Aguilera, A. Genome Instability and Transcription Elongation Impairment in Human Cells Depleted of THO/TREX. PLoS Genet. 2011, 7, e1002386. [Google Scholar] [CrossRef] [PubMed]
- Gómez-González, B.; García-Rubio, M.; Bermejo, R.; Gaillard, H.; Shirahige, K.; Marín, A.; Foiani, M.; Aguilera, A. Genome-wide function of THO/TREX in active genes prevents R-loop-dependent replication obstacles. EMBO J. 2011, 30, 3106–3119. [Google Scholar] [CrossRef]
- Sollier, J.; Cimprich, K.A. Breaking bad: R-loops and genome integrity. Trends Cell Biol. 2015, 25, 514–522. [Google Scholar] [CrossRef]
- Gaillard, H.; Aguilera, A. Transcription as a Threat to Genome Integrity. Annu. Rev. Biochem. 2016, 85, 291–317. [Google Scholar] [CrossRef]
- Tuduri, S.; Crabbé, L.; Conti, C.; Tourrière, H.; Holtgreve-Grez, H.; Jauch, A.; Pantesco, V.; De Vos, J.; Thomas, A.; Theillet, C.; et al. Topoisomerase I suppresses genomic instability by preventing interference between replication and transcription. Nat. Cell Biol. 2009, 11, 1315–1324. [Google Scholar] [CrossRef] [PubMed]
- Pritchard, C.E.; Fornerod, M.; Kasper, L.H.; van Deursen, J.M. RAE1 Is a Shuttling mRNA Export Factor That Binds to a GLEBS-like NUP98 Motif at the Nuclear Pore Complex through Multiple Domains. J. Cell Biol. 1999, 145, 237–254. [Google Scholar] [CrossRef] [PubMed]
- Hall, R.; Guedán, A.; Yap, M.W.; Young, G.R.; Harvey, R.; Stoye, J.P.; Bishop, K.N. SARS-CoV-2 ORF6 disrupts innate immune signalling by inhibiting cellular mRNA export. PLoS Pathog. 2022, 18, e1010349. [Google Scholar] [CrossRef] [PubMed]
- Feng, H.; Tian, H.; Wang, Y.; Zhang, Q.; Lin, N.; Liu, S.; Yu, Y.; Deng, H.; Gao, P. Molecular mechanism underlying selective inhibition of mRNA nuclear export by herpesvirus protein ORF10. Proc. Natl. Acad. Sci. USA 2020, 117, 26719–26727. [Google Scholar] [CrossRef]
- Skourti-Stathaki, K.; Proudfoot, N.; Gromak, N. Human Senataxin Resolves RNA/DNA Hybrids Formed at Transcriptional Pause Sites to Promote Xrn2-Dependent Termination. Mol. Cell 2011, 42, 794–805. [Google Scholar] [CrossRef]
- Crossley, M.P.; Bocek, M.; Cimprich, K.A. R-Loops as Cellular Regulators and Genomic Threats. Mol. Cell 2019, 73, 398–411. [Google Scholar] [CrossRef]
- Santos-Pereira, J.M.; Aguilera, A. R loops: New modulators of genome dynamics and function. Nat. Rev. Genet. 2015, 16, 583–597. [Google Scholar] [CrossRef]
- Gan, W.; Guan, Z.; Liu, J.; Gui, T.; Shen, K.; Manley, J.L.; Li, X. R-loop-mediated genomic instability is caused by impairment of replication fork progression. Genes Dev. 2011, 25, 2041–2056. [Google Scholar] [CrossRef]
- Helmrich, A.; Ballarino, M.; Tora, L. Collisions between Replication and Transcription Complexes Cause Common Fragile Site Instability at the Longest Human Genes. Mol. Cell 2011, 44, 966–977. [Google Scholar] [CrossRef]
- Hamperl, S.; Cimprich, K.A. The contribution of co-transcriptional RNA:DNA hybrid structures to DNA damage and genome instability. DNA Repair 2014, 19, 84–94. [Google Scholar] [CrossRef]
- Jackson, B.R.; Noerenberg, M.; Whitehouse, A. A Novel Mechanism Inducing Genome Instability in Kaposi’s Sarcoma-Associated Herpesvirus Infected Cells. PLoS Pathog. 2014, 10, e1004098. [Google Scholar] [CrossRef] [PubMed]
- Gioia, U.; Tavella, S.; Martínez-Orellana, P.; Cicio, G.; Colliva, A.; Ceccon, M.; Cabrini, M.; Henriques, A.C.; Fumagalli, V.; Paldino, A.; et al. SARS-CoV-2 infection induces DNA damage, through CHK1 degradation and impaired 53BP1 recruitment, and cellular senescence. Nat. Cell Biol. 2023, 25, 550–564. [Google Scholar] [CrossRef] [PubMed]
- Abraham, M.J.; Murtola, T.; Schulz, R.; Páll, S.; Smith, J.C.; Hess, B.; Lindahl, E. GROMACS: High performance molecular simulations through multi-level parallelism from laptops to supercomputers. SoftwareX 2015, 1, 19–25. [Google Scholar] [CrossRef]
- Huang, J.; Rauscher, S.; Nawrocki, G.; Ran, T.; Feig, M.; de Groot, B.L.; Grubmüller, H.; MacKerell, A.D., Jr. CHARMM36m: An improved force field for folded and intrinsically disordered proteins. Nat. Methods 2016, 14, 71–73. [Google Scholar] [CrossRef]
- Klauda, J.B.; Venable, R.M.; Freites, J.A.; O’Connor, J.W.; Tobias, D.J.; Mondragon-Ramirez, C.; Vorobyov, I.; MacKerell, A.D.J.; Pastor, R.W. Update of the CHARMM All-Atom Additive Force Field for Lipids: Validation on Six Lipid Types. J. Phys. Chem. B 2010, 114, 7830–7843. [Google Scholar] [CrossRef]
- Berendsen, H.J.C.; Postma, J.P.M.; van Gunsteren, W.F.; DiNola, A.; Haak, J.R. Molecular dynamics with coupling to an external bath. J. Chem. Phys. 1984, 81, 3684. [Google Scholar] [CrossRef]
- Bussi, G.; Donadio, D.; Parrinello, M. Canonical sampling through velocity rescaling. J. Chem. Phys. 2007, 126, 014101. [Google Scholar] [CrossRef]
- Parrinello, M.; Rahman, A. Crystal Structure and Pair Potentials: A Molecular-Dynamics Study. Phys. Rev. Lett. 1980, 45, 1196. [Google Scholar] [CrossRef]
- Hess, B. P-LINCS: A Parallel Linear Constraint Solver for Molecular Simulation. J. Chem. Theory Comput. 2008, 4, 116–122. [Google Scholar] [CrossRef]
- EXCALATE4COV Public Data Repository. Available online: https://ds-814.cr.cnaf.infn.it:8443/ex4cov-public/Molecular_Dynamics/ORF6/ (accessed on 9 July 2023).
- Casares, D.; Escribá, P.V.; Rosselló, C.A. Membrane Lipid Composition: Effect on Membrane and Organelle Structure, Function and Compartmentalization and Therapeutic Avenues. Int. J. Mol. Sci. 2019, 20, 2167. [Google Scholar] [CrossRef]
- Wu, E.L.; Cheng, X.; Jo, S.; Rui, H.; Song, K.C.; Dávila-Contreras, E.M.; Qi, Y.; Lee, J.; Monje-Galvan, V.; Venable, R.M.; et al. CHARMM-GUI Membrane Builder toward realistic biological membrane simulations. J. Comput. Chem. 2014, 35, 1997–2004. [Google Scholar] [CrossRef] [PubMed]
- Jo, S.; Kim, T.; Iyer, V.G.; Im, W. CHARMM-GUI: A web-based graphical user interface for CHARMM. J. Comput. Chem. 2008, 29, 1859–1865. [Google Scholar] [CrossRef]
- Emsley, P.; Cowtan, K. Coot: Model-building tools for molecular graphics. Acta Crystallogr. Sect. D 2004, 60, 2126–2132. [Google Scholar] [CrossRef] [PubMed]
- Daura, X.; Gademann, K.; Jaun, B.; Seebach, D.; van Gunsteren, W.F.; Mark, A.E. Peptide Folding: When Simulation Meets Experiment. Angew. Chem. Int. Ed. 1999, 38, 236–240. [Google Scholar] [CrossRef]
- Frishman, D.; Argos, P. Knowledge-based secondary structure assignment. Proteins Struct. Funct. Genet. 1995, 23, 566–579. [Google Scholar] [CrossRef]
- Humphrey, W.; Dalke, A.; Schulten, K. VMD—Visual Molecular Dynamics. J. Mol. Graph. 1996, 14, 33–38. [Google Scholar] [CrossRef]
- Prendergast, L.; McClurg, U.L.; Hristova, R.; Berlinguer-Palmini, R.; Greener, S.; Veitch, K.; Hernandez, I.; Pasero, P.; Rico, D.; Higgins, J.M.G.; et al. Resolution of R-loops by INO80 promotes DNA replication and maintains cancer cell proliferation and viability. Nat. Commun. 2020, 11, 4534. [Google Scholar] [CrossRef]
- Stirling, D.R.; Swain-Bowden, M.J.; Lucas, A.M.; Carpenter, A.E.; Cimini, B.A.; Goodman, A. CellProfiler 4: Improvements in speed, utility and usability. BMC Bioinform. 2021, 22, 433. [Google Scholar] [CrossRef]
- Danovski, G.; Dyankova, T.; Stoynov, S. CellTool: An open source software combining bio-image analysis and mathematical modeling. bioRxiv 2018. [Google Scholar] [CrossRef]
- Schwab, R.A.; Niedzwiedz, W. Visualization of DNA Replication in the Vertebrate Model System DT40 using the DNA Fiber Technique. J. Vis. Exp. 2011, 56, e3255. [Google Scholar] [CrossRef]
- Kirilov, T.; Gospodinov, A.; Kirilov, K. An algorithm and application to efficiently analyse DNA fibre data. Biotechnol. Biotechnol. Equip. 2023, 37, 2206488. [Google Scholar] [CrossRef]


Disclaimer/Publisher’s Note: The statements, opinions and data contained in all publications are solely those of the individual author(s) and contributor(s) and not of MDPI and/or the editor(s). MDPI and/or the editor(s) disclaim responsibility for any injury to people or property resulting from any ideas, methods, instructions or products referred to in the content. |
© 2023 by the authors. Licensee MDPI, Basel, Switzerland. This article is an open access article distributed under the terms and conditions of the Creative Commons Attribution (CC BY) license (https://creativecommons.org/licenses/by/4.0/).
Share and Cite
Krachmarova, E.; Petkov, P.; Lilkova, E.; Ilieva, N.; Rangelov, M.; Todorova, N.; Malinova, K.; Hristova, R.; Nacheva, G.; Gospodinov, A.; et al. Insights into the SARS-CoV-2 ORF6 Mechanism of Action. Int. J. Mol. Sci. 2023, 24, 11589. https://doi.org/10.3390/ijms241411589
Krachmarova E, Petkov P, Lilkova E, Ilieva N, Rangelov M, Todorova N, Malinova K, Hristova R, Nacheva G, Gospodinov A, et al. Insights into the SARS-CoV-2 ORF6 Mechanism of Action. International Journal of Molecular Sciences. 2023; 24(14):11589. https://doi.org/10.3390/ijms241411589
Chicago/Turabian StyleKrachmarova, Elena, Peicho Petkov, Elena Lilkova, Nevena Ilieva, Miroslav Rangelov, Nadezhda Todorova, Kristina Malinova, Rossitsa Hristova, Genoveva Nacheva, Anastas Gospodinov, and et al. 2023. "Insights into the SARS-CoV-2 ORF6 Mechanism of Action" International Journal of Molecular Sciences 24, no. 14: 11589. https://doi.org/10.3390/ijms241411589
APA StyleKrachmarova, E., Petkov, P., Lilkova, E., Ilieva, N., Rangelov, M., Todorova, N., Malinova, K., Hristova, R., Nacheva, G., Gospodinov, A., & Litov, L. (2023). Insights into the SARS-CoV-2 ORF6 Mechanism of Action. International Journal of Molecular Sciences, 24(14), 11589. https://doi.org/10.3390/ijms241411589