
Calcitonin Gene-Related Peptide mRNA Synthesis in Trigeminal Ganglion Neurons after Cortical Spreading Depolarization


 and
and 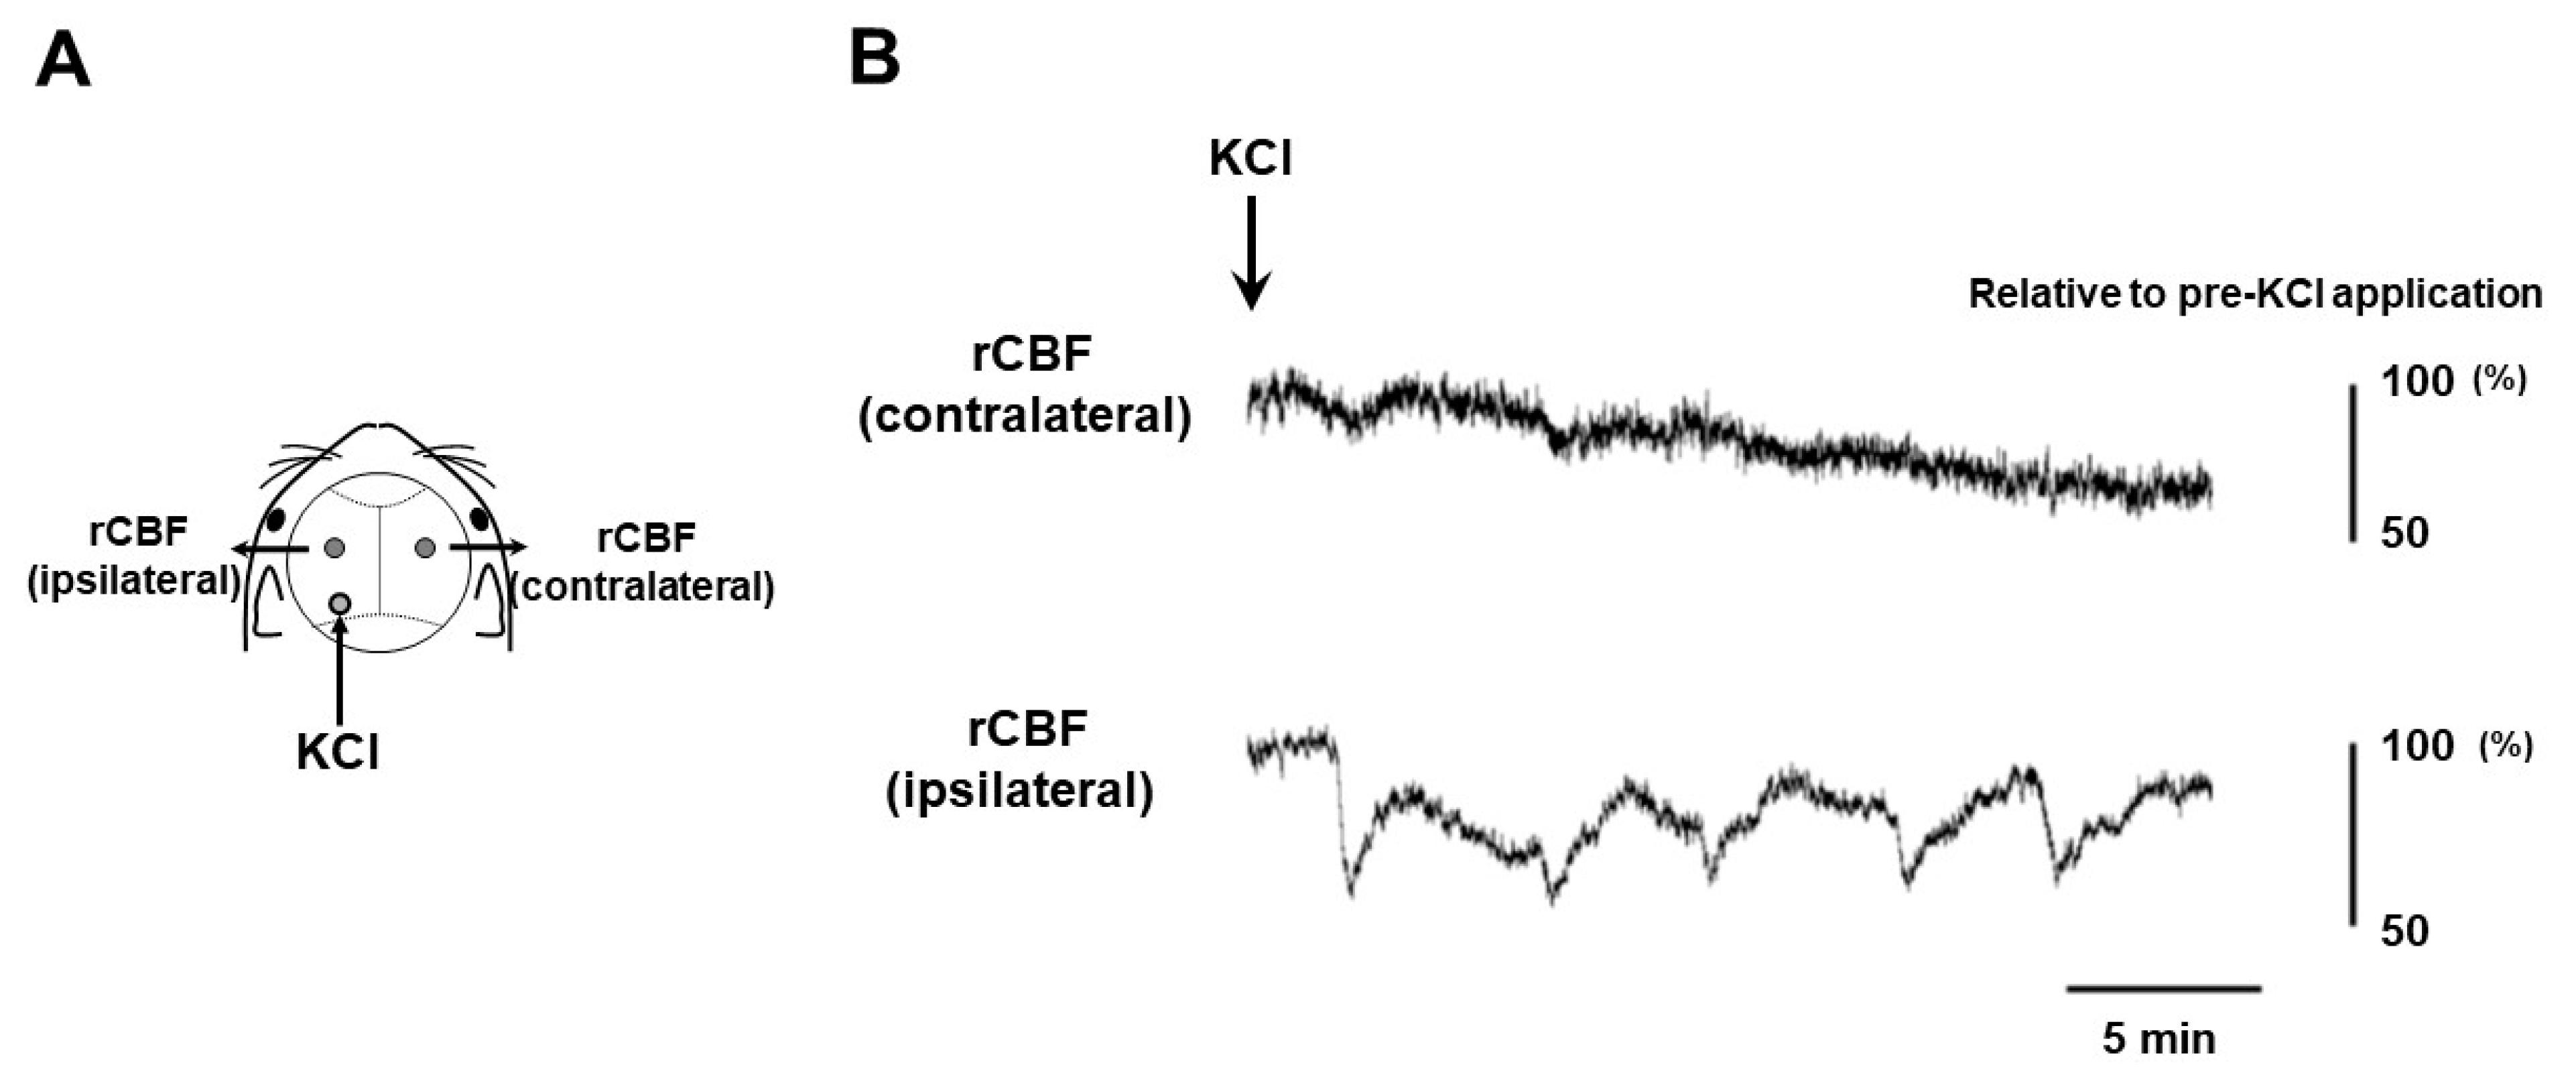
Abstract
1. Introduction
2. Results
2.1. CSD Induction
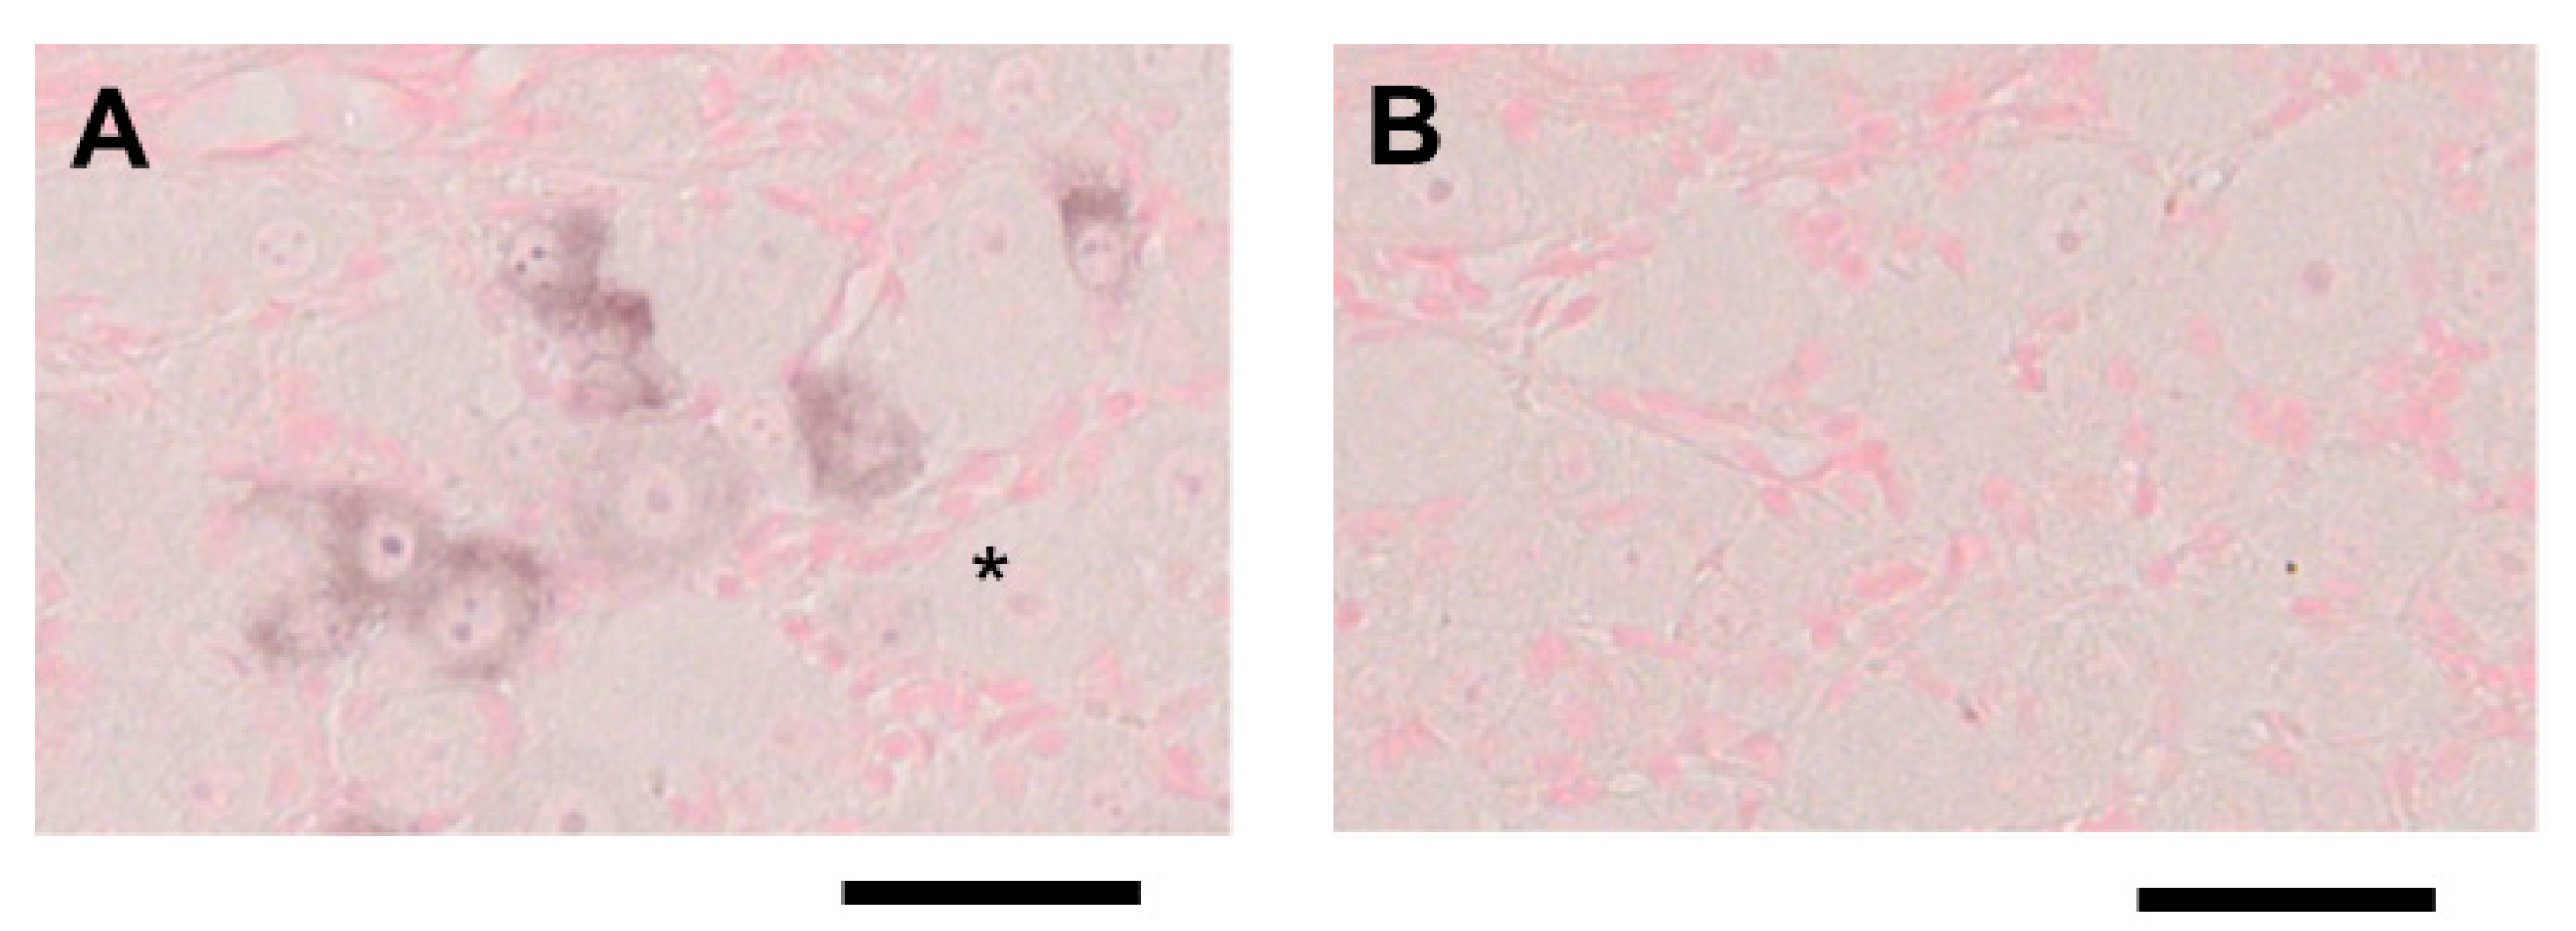
2.2. ISH for Mouse CGRP mRNA in TG Tissue
2.3. Density of CGRP mRNA-Synthesizing TG Neurons after CSD
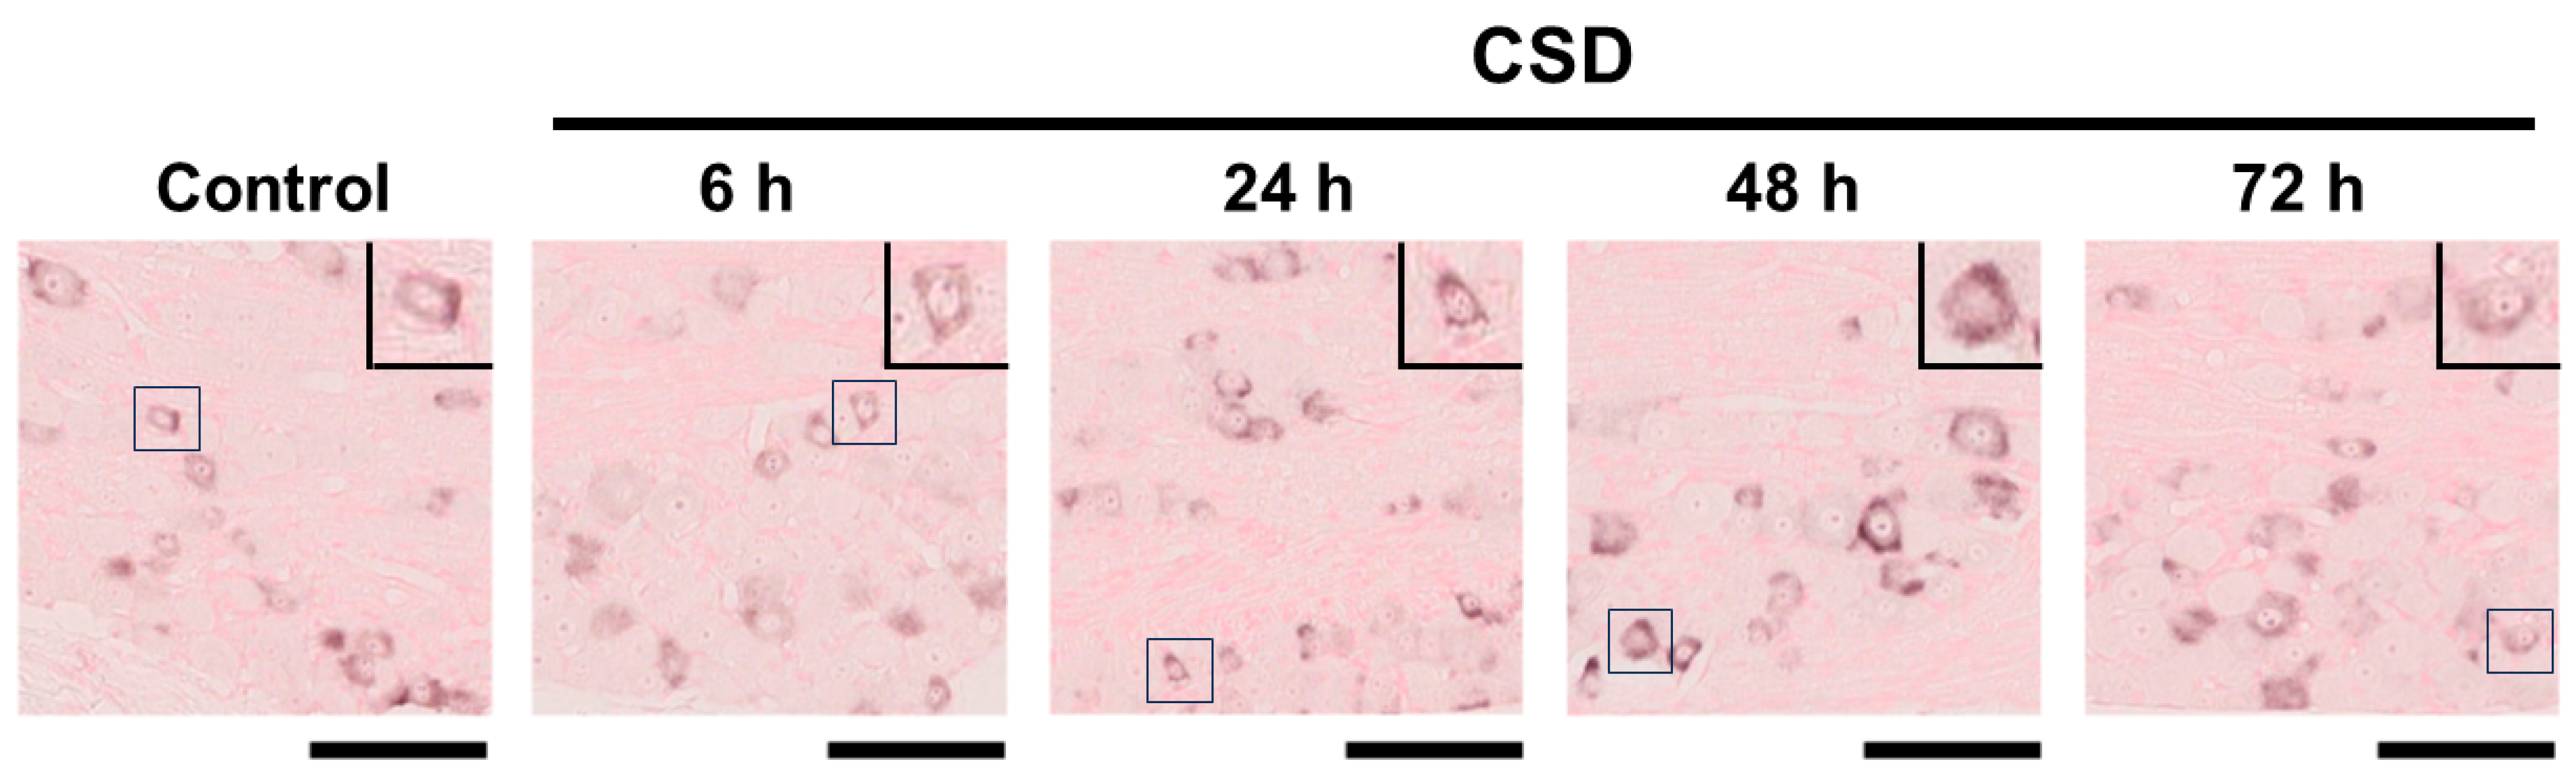
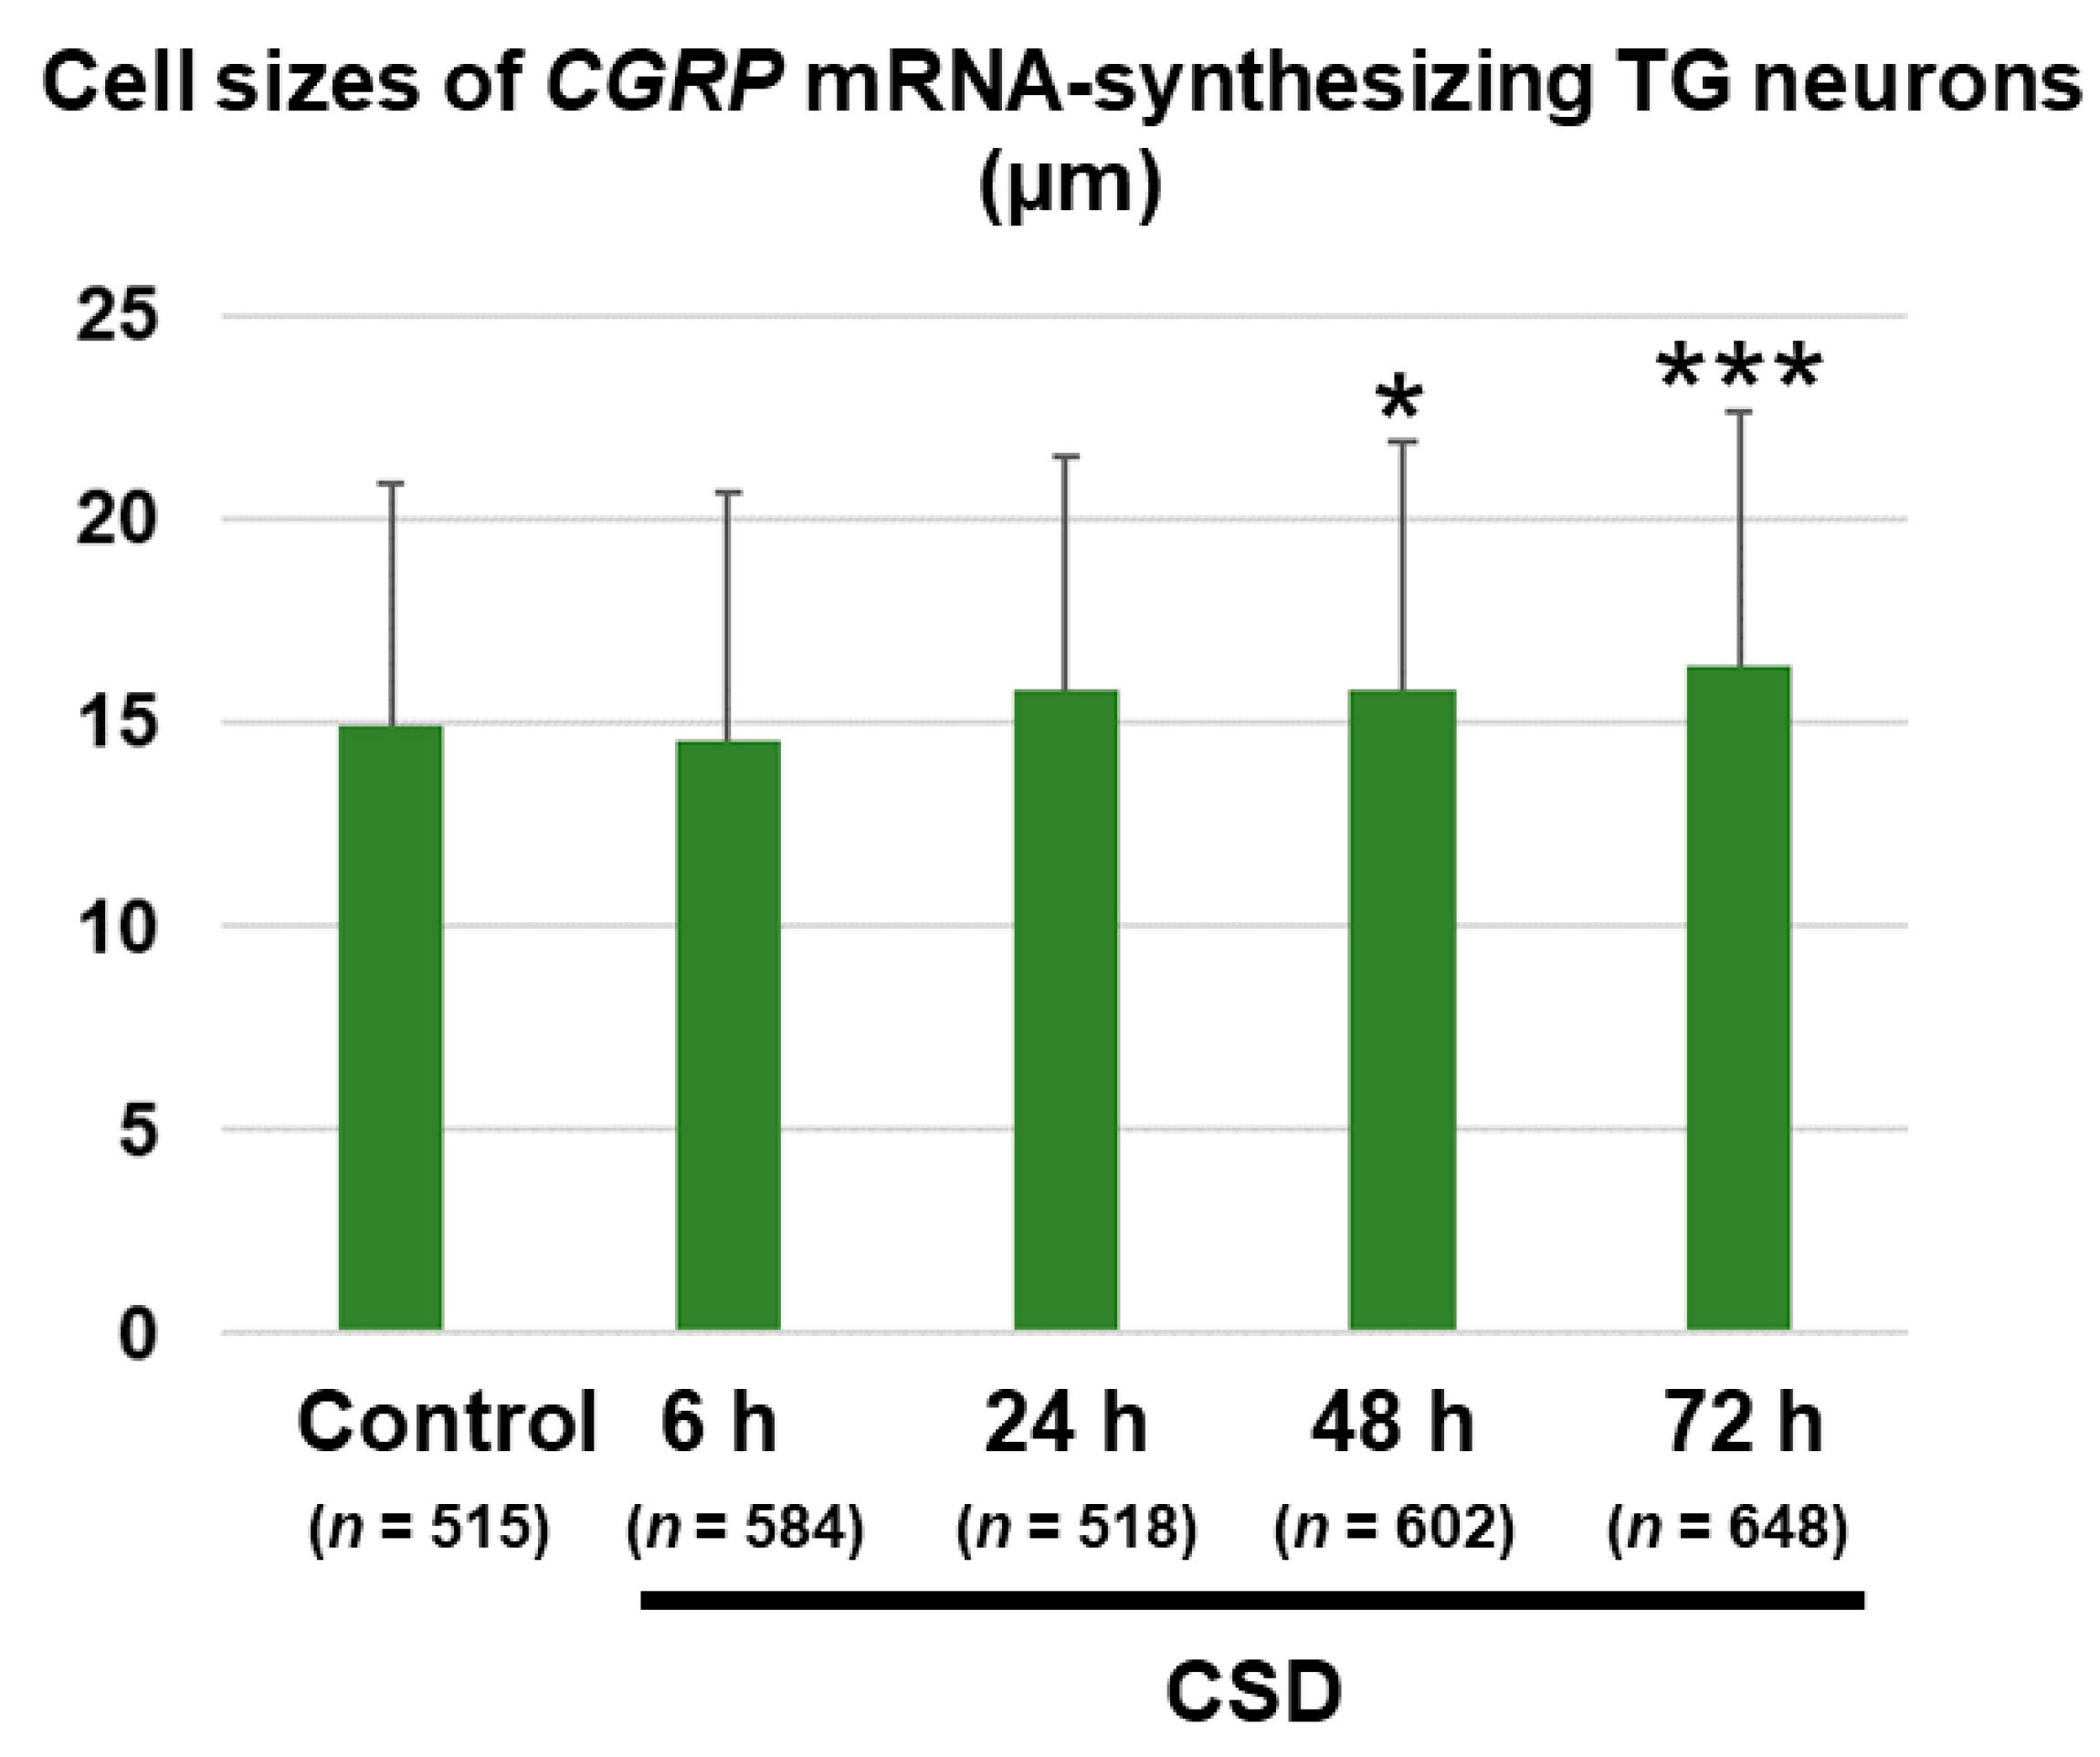
2.4. Cell Size Changes in CGRP mRNA-Synthesizing TG Neurons after CSD
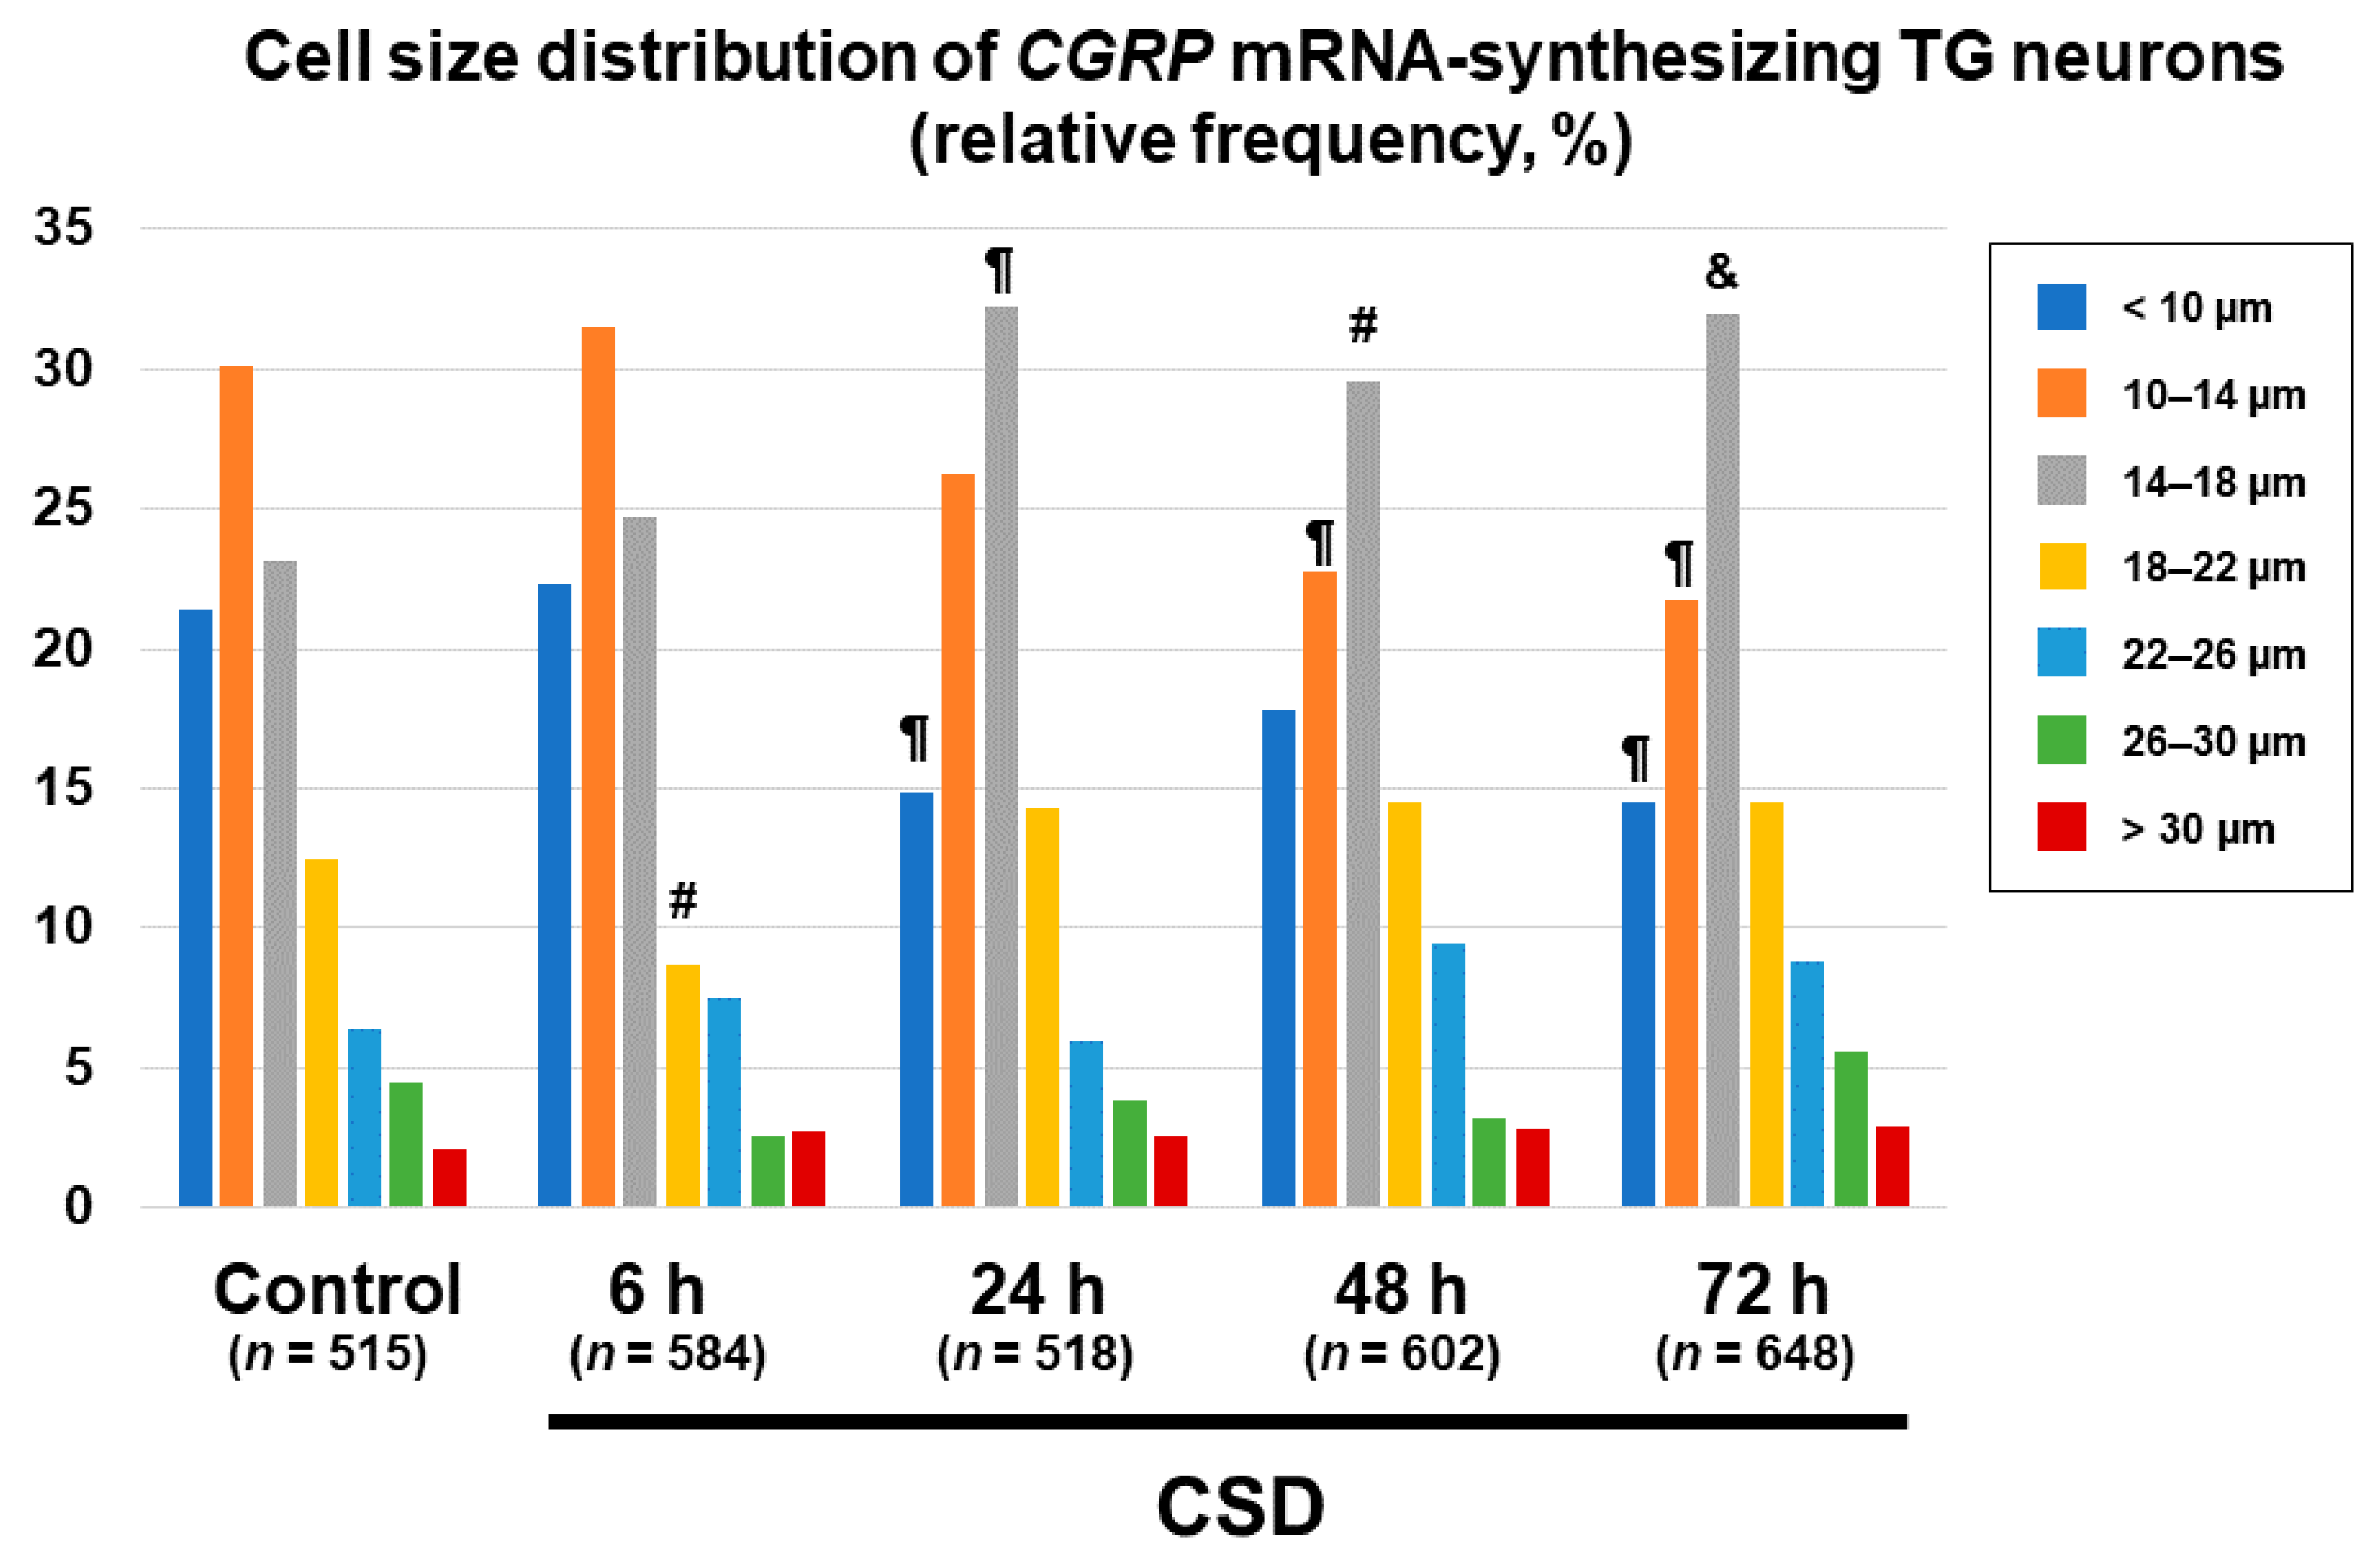
2.5. Changes in Cell Size Distributions of CGRP mRNA-Synthesizing TG Neurons after CSD
3. Discussion
4. Materials and Methods
4.1. Animals
4.2. CSD Induction
4.3. TG Tissue Excision
4.4. Mouse TG ISH
- CGRP: 5′-gaaaggctgatgaaagacacatatatttgcatccttcttagtattgaaaaacccttctccctttgacaggagctaaagctaagtgcagaataagttgcctattgtgcatcgtgttgtatgtgactctgtatccaataaacatgacagcatggttctggcttatctggtagcaaatatggtccccataaaccatcctgttgatgttgatgactctgctaaacctcaaggggatatgaaacactgcctcttgctcttctggggacacatggtaa-3′.
4.5. Statistical Analyses
Author Contributions
Funding
Institutional Review Board Statement
Informed Consent Statement
Data Availability Statement
Conflicts of Interest
References
- Steiner, T.J.; Stovner, L.J.; Jensen, R.; Uluduz, D.; Katsarava, Z. Lifting The Burden: The Global Campaign against Headache. Migraine remains second among the world’s causes of disability, and first among young women: Findings from GBD2019. J. Headache Pain 2020, 21, 137. [Google Scholar] [CrossRef] [PubMed]
- Ashina, M. Migraine. N. Engl. J. Med. 2020, 383, 1866–1876. [Google Scholar] [CrossRef]
- Dreier, J.P.; Fabricius, M.; Ayata, C.; Sakowitz, O.W.; Shuttleworth, C.W.; Dohmen, C.; Graf, R.; Vajkoczy, P.; Helbok, R.; Suzuki, M.; et al. Recording, analysis, and interpretation of spreading depolarizations in neurointensive care: Review and recommendations of the COSBID research group. J. Cereb. Blood Flow Metab. 2017, 37, 1595–1625. [Google Scholar] [CrossRef] [PubMed]
- Lauritzen, M.; Jorgensen, M.B.; Diemer, N.H.; Gjedde, A.; Hansen, A.J. Persistent oligemia of rat cerebral cortex in the wake of spreading depression. Ann. Neurol. 1982, 12, 469–474. [Google Scholar] [CrossRef] [PubMed]
- Olesen, J.; Friberg, L.; Olsen, T.S.; Iversen, H.K.; Lassen, N.A.; Andersen, A.R.; Karle, A. Timing and topography of cerebral blood flow, aura, and headache during migraine attacks. Ann. Neurol. 1990, 28, 791–798. [Google Scholar] [CrossRef]
- Olesen, J.; Larsen, B.; Lauritzen, M. Focal hyperemia followed by spreading oligemia and impaired activation of rCBF in classic migraine. Ann. Neurol. 1981, 9, 344–352. [Google Scholar] [CrossRef]
- Cao, Y.; Welch, K.M.; Aurora, S.; Vikingstad, E.M. Functional MRI-BOLD of visually triggered headache in patients with migraine. Arch. Neurol. 1999, 56, 548–554. [Google Scholar] [CrossRef]
- Andersen, A.R.; Friberg, L.; Olsen, T.S.; Olesen, J. Delayed hyperemia following hypoperfusion in classic migraine. Single photon emission computed tomographic demonstration. Arch. Neurol. 1988, 45, 154–159. [Google Scholar] [CrossRef]
- Bowyer, S.M.; Aurora, K.S.; Moran, J.E.; Tepley, N.; Welch, K.M. Magnetoencephalographic fields from patients with spontaneous and induced migraine aura. Ann. Neurol. 2001, 50, 582–587. [Google Scholar] [CrossRef]
- Hadjikhani, N.; Sanchez Del Rio, M.; Wu, O.; Schwartz, D.; Bakker, D.; Fischl, B.; Kwong, K.K.; Cutrer, F.M.; Rosen, B.R.; Tootell, R.B.; et al. Mechanisms of migraine aura revealed by functional MRI in human visual cortex. Proc. Natl. Acad. Sci. USA 2001, 98, 4687–4692. [Google Scholar] [CrossRef]
- Zhang, X.; Levy, D.; Noseda, R.; Kainz, V.; Jakubowski, M.; Burstein, R. Activation of meningeal nociceptors by cortical spreading depression: Implications for migraine with aura. J. Neurosci. 2010, 30, 8807–8814. [Google Scholar] [CrossRef] [PubMed]
- Zhang, X.; Levy, D.; Kainz, V.; Noseda, R.; Jakubowski, M.; Burstein, R. Activation of central trigeminovascular neurons by cortical spreading depression. Ann. Neurol. 2011, 69, 855–865. [Google Scholar] [CrossRef] [PubMed]
- Karatas, H.; Erdener, S.E.; Gursoy-Ozdemir, Y.; Lule, S.; Eren-Kocak, E.; Sen, Z.D.; Dalkara, T. Spreading depression triggers headache by activating neuronal Panx1 channels. Science 2013, 339, 1092–1095. [Google Scholar] [CrossRef]
- Carneiro-Nascimento, S.; Levy, D. Cortical spreading depression and meningeal nociception. Neurobiol. Pain 2022, 11, 100091. [Google Scholar] [CrossRef] [PubMed]
- Moskowitz, M.A.; Nozaki, K.; Kraig, R.P. Neocortical spreading depression provokes the expression of c-fos protein-like immunoreactivity within trigeminal nucleus caudalis via trigeminovascular mechanisms. J. Neurosci. 1993, 13, 1167–1177. [Google Scholar] [CrossRef] [PubMed]
- Bolay, H.; Reuter, U.; Dunn, A.K.; Huang, Z.; Boas, D.A.; Moskowitz, M.A. Intrinsic brain activity triggers trigeminal meningeal afferents in a migraine model. Nat. Med. 2002, 8, 136–142. [Google Scholar] [CrossRef]
- Ayata, C.; Jin, H.; Kudo, C.; Dalkara, T.; Moskowitz, M.A. Suppression of cortical spreading depression in migraine prophylaxis. Ann. Neurol. 2006, 59, 652–661. [Google Scholar] [CrossRef]
- Ayata, C. Pearls and pitfalls in experimental models of spreading depression. Cephalalgia 2013, 33, 604–613. [Google Scholar] [CrossRef]
- Mayberg, M.; Langer, R.S.; Zervas, N.T.; Moskowitz, M.A. Perivascular meningeal projections from cat trigeminal ganglia: Possible pathway for vascular headaches in man. Science 1981, 213, 228–230. [Google Scholar] [CrossRef]
- Ashina, M.; Hansen, J.M.; Do, T.P.; Melo-Carrillo, A.; Burstein, R.; Moskowitz, M.A. Migraine and the trigeminovascular system-40 years and counting. Lancet Neurol. 2019, 18, 795–804. [Google Scholar] [CrossRef]
- Edvinsson, L.; Haanes, K.A.; Warfvinge, K.; Krause, D.N. CGRP as the target of new migraine therapies—Successful translation from bench to clinic. Nat. Rev. Neurol. 2018, 14, 338–350. [Google Scholar] [CrossRef] [PubMed]
- Buzzi, M.G.; Carter, W.B.; Shimizu, T.; Heath, H., 3rd; Moskowitz, M.A. Dihydroergotamine and sumatriptan attenuate levels of CGRP in plasma in rat superior sagittal sinus during electrical stimulation of the trigeminal ganglion. Neuropharmacology 1991, 30, 1193–1200. [Google Scholar] [CrossRef] [PubMed]
- Messlinger, K.; Hanesch, U.; Kurosawa, M.; Pawlak, M.; Schmidt, R.F. Calcitonin gene related peptide released from dural nerve fibers mediates increase of meningeal blood flow in the rat. Can. J. Physiol. Pharmacol. 1995, 73, 1020–1024. [Google Scholar] [CrossRef] [PubMed]
- Eltorp, C.T.; Jansen-Olesen, I.; Hansen, A.J. Release of calcitonin gene-related peptide (CGRP) from guinea pig dura mater in vitro is inhibited by sumatriptan but unaffected by nitric oxide. Cephalalgia 2000, 20, 838–844. [Google Scholar] [CrossRef]
- Bullock, C.M.; Wookey, P.; Bennett, A.; Mobasheri, A.; Dickerson, I.; Kelly, S. Peripheral calcitonin gene-related peptide receptor activation and mechanical sensitization of the joint in rat models of osteoarthritis pain. Arthritis Rheumatol. 2014, 66, 2188–2200. [Google Scholar] [CrossRef]
- Chatchaisak, D.; Connor, M.; Srikiatkhachorn, A.; Chetsawang, B. The potentiating effect of calcitonin gene-related peptide on transient receptor potential vanilloid-1 activity and the electrophysiological responses of rat trigeminal neurons to nociceptive stimuli. J. Physiol. Sci. 2018, 68, 261–268. [Google Scholar] [CrossRef]
- Cornelison, L.E.; Hawkins, J.L.; Durham, P.L. Elevated levels of calcitonin gene-related peptide in upper spinal cord promotes sensitization of primary trigeminal nociceptive neurons. Neuroscience 2016, 339, 491–501. [Google Scholar] [CrossRef]
- Iyengar, S.; Johnson, K.W.; Ossipov, M.H.; Aurora, S.K. CGRP and the Trigeminal System in Migraine. Headache 2019, 59, 659–681. [Google Scholar] [CrossRef]
- Li, D.; Ren, Y.; Xu, X.; Zou, X.; Fang, L.; Lin, Q. Sensitization of primary afferent nociceptors induced by intradermal capsaicin involves the peripheral release of calcitonin gene-related Peptide driven by dorsal root reflexes. J. Pain 2008, 9, 1155–1168. [Google Scholar] [CrossRef]
- Zhang, L.; Hoff, A.O.; Wimalawansa, S.J.; Cote, G.J.; Gagel, R.F.; Westlund, K.N. Arthritic calcitonin/α calcitonin gene-related peptide knockout mice have reduced nociceptive hypersensitivity. Pain 2001, 89, 265–273. [Google Scholar] [CrossRef]
- Wang, Y.; Tye, A.E.; Zhao, J.; Ma, D.; Raddant, A.C.; Bu, F.; Spector, B.L.; Winslow, N.K.; Wang, M.; Russo, A.F. Induction of calcitonin gene-related peptide expression in rats by cortical spreading depression. Cephalalgia 2019, 39, 333–341. [Google Scholar] [CrossRef]
- Bu, F.; Yuan, M.; Ma, D.; Zhu, Y.; Wang, M. Inhibition of NR2A reduces calcitonin gene-related peptide gene expression induced by cortical spreading depression in rat amygdala. Neuropeptides 2020, 84, 102097. [Google Scholar] [CrossRef] [PubMed]
- Volobueva, M.N.; Suleymanova, E.M.; Smirnova, M.P.; Bolshakov, A.P.; Vinogradova, L.V. A Single Episode of Cortical Spreading Depolarization Increases mRNA Levels of Proinflammatory Cytokines, Calcitonin Gene-Related Peptide and Pannexin-1 Channels in the Cerebral Cortex. Int. J. Mol. Sci. 2022, 24, 85. [Google Scholar] [CrossRef] [PubMed]
- Tozzi, A.; de Iure, A.; Di Filippo, M.; Costa, C.; Caproni, S.; Pisani, A.; Bonsi, P.; Picconi, B.; Cupini, L.M.; Materazzi, S.; et al. Critical role of calcitonin gene-related peptide receptors in cortical spreading depression. Proc. Natl. Acad. Sci. USA 2012, 109, 18985–18990. [Google Scholar] [CrossRef]
- Won, L.; Kraig, R.P. Insulin-like growth factor-1 inhibits spreading depression-induced trigeminal calcitonin gene related peptide, oxidative stress & neuronal activation in rat. Brain Res. 2020, 1732, 146673. [Google Scholar]
- Yisarakun, W.; Chantong, C.; Supornsilpchai, W.; Thongtan, T.; Srikiatkhachorn, A.; Reuangwechvorachai, P.; Maneesri-le Grand, S. Up-regulation of calcitonin gene-related peptide in trigeminal ganglion following chronic exposure to paracetamol in a CSD migraine animal model. Neuropeptides 2015, 51, 9–16. [Google Scholar] [CrossRef]
- Tsai, S.H.; Tew, J.M.; McLean, J.H.; Shipley, M.T. Cerebral arterial innervation by nerve fibers containing calcitonin gene-related peptide (CGRP): I. Distribution and origin of CGRP perivascular innervation in the rat. J. Comp. Neurol. 1988, 271, 435–444. [Google Scholar] [CrossRef]
- Nozaki, K.; Uemura, Y.; Okamoto, S.; Kikuchi, H.; Mizuno, N. Origins and distribution of cerebrovascular nerve fibers showing calcitonin gene-related peptide-like immunoreactivity in the major cerebral artery of the dog. J. Comp. Neurol. 1990, 297, 219–226. [Google Scholar] [CrossRef]
- Eftekhari, S.; Warfvinge, K.; Blixt, F.W.; Edvinsson, L. Differentiation of nerve fibers storing CGRP and CGRP receptors in the peripheral trigeminovascular system. J. Pain 2013, 14, 1289–1303. [Google Scholar] [CrossRef] [PubMed]
- Eftekhari, S.; Salvatore, C.A.; Johansson, S.; Chen, T.B.; Zeng, Z.; Edvinsson, L. Localization of CGRP, CGRP receptor, PACAP and glutamate in trigeminal ganglion. Relation to the blood-brain barrier. Brain Res. 2015, 1600, 93–109. [Google Scholar] [CrossRef]
- Melo-Carrillo, A.; Strassman, A.M.; Nir, R.R.; Schain, A.J.; Noseda, R.; Stratton, J.; Burstein, R. Fremanezumab-A Humanized Monoclonal Anti-CGRP Antibody-Inhibits Thinly Myelinated (Aδ) but Not Unmyelinated (C) Meningeal Nociceptors. J. Neurosci. 2017, 37, 10587–10596. [Google Scholar] [CrossRef] [PubMed]
- Ebine, T.; Toriumi, H.; Shimizu, T.; Unekawa, M.; Takizawa, T.; Kayama, Y.; Shibata, M.; Suzuki, N. Alterations in the threshold of the potassium concentration to evoke cortical spreading depression during the natural estrous cycle in mice. Neurosci. Res. 2016, 112, 57–62. [Google Scholar] [CrossRef] [PubMed]
- van Casteren, D.S.; Kurth, T.; Danser, A.H.J.; Terwindt, G.M.; MaassenVanDenBrink, A. Sex Differences in Response to Triptans: A Systematic Review and Meta-Analysis. Neurology 2021, 96, 162–170. [Google Scholar] [CrossRef]
- White, T.G.; Powell, K.; Shah, K.A.; Woo, H.H.; Narayan, R.K.; Li, C. Trigeminal Nerve Control of Cerebral Blood Flow: A Brief Review. Front. Neurosci. 2021, 15, 649910. [Google Scholar] [CrossRef] [PubMed]
- Takizawa, T.; Qin, T.; Lopes de Morais, A.; Sugimoto, K.; Chung, J.Y.; Morsett, L.; Mulder, I.; Fischer, P.; Suzuki, T.; Anzabi, M.; et al. Non-invasively triggered spreading depolarizations induce a rapid pro-inflammatory response in cerebral cortex. J. Cereb. Blood Flow Metab. 2020, 40, 1117–1131. [Google Scholar] [CrossRef]


Disclaimer/Publisher’s Note: The statements, opinions and data contained in all publications are solely those of the individual author(s) and contributor(s) and not of MDPI and/or the editor(s). MDPI and/or the editor(s) disclaim responsibility for any injury to people or property resulting from any ideas, methods, instructions or products referred to in the content. |
© 2023 by the authors. Licensee MDPI, Basel, Switzerland. This article is an open access article distributed under the terms and conditions of the Creative Commons Attribution (CC BY) license (https://creativecommons.org/licenses/by/4.0/).
Share and Cite
Shibata, M.; Kitagawa, S.; Unekawa, M.; Takizawa, T.; Nakahara, J. Calcitonin Gene-Related Peptide mRNA Synthesis in Trigeminal Ganglion Neurons after Cortical Spreading Depolarization. Int. J. Mol. Sci. 2023, 24, 11578. https://doi.org/10.3390/ijms241411578
Shibata M, Kitagawa S, Unekawa M, Takizawa T, Nakahara J. Calcitonin Gene-Related Peptide mRNA Synthesis in Trigeminal Ganglion Neurons after Cortical Spreading Depolarization. International Journal of Molecular Sciences. 2023; 24(14):11578. https://doi.org/10.3390/ijms241411578
Chicago/Turabian StyleShibata, Mamoru, Satoshi Kitagawa, Miyuki Unekawa, Tsubasa Takizawa, and Jin Nakahara. 2023. "Calcitonin Gene-Related Peptide mRNA Synthesis in Trigeminal Ganglion Neurons after Cortical Spreading Depolarization" International Journal of Molecular Sciences 24, no. 14: 11578. https://doi.org/10.3390/ijms241411578
APA StyleShibata, M., Kitagawa, S., Unekawa, M., Takizawa, T., & Nakahara, J. (2023). Calcitonin Gene-Related Peptide mRNA Synthesis in Trigeminal Ganglion Neurons after Cortical Spreading Depolarization. International Journal of Molecular Sciences, 24(14), 11578. https://doi.org/10.3390/ijms241411578