
N-Acetylcysteine-Loaded Magnetic Nanoparticles for Magnetic Resonance Imaging

 , , ,
, , ,  , , , and
Abstract
1. Introduction
2. Results
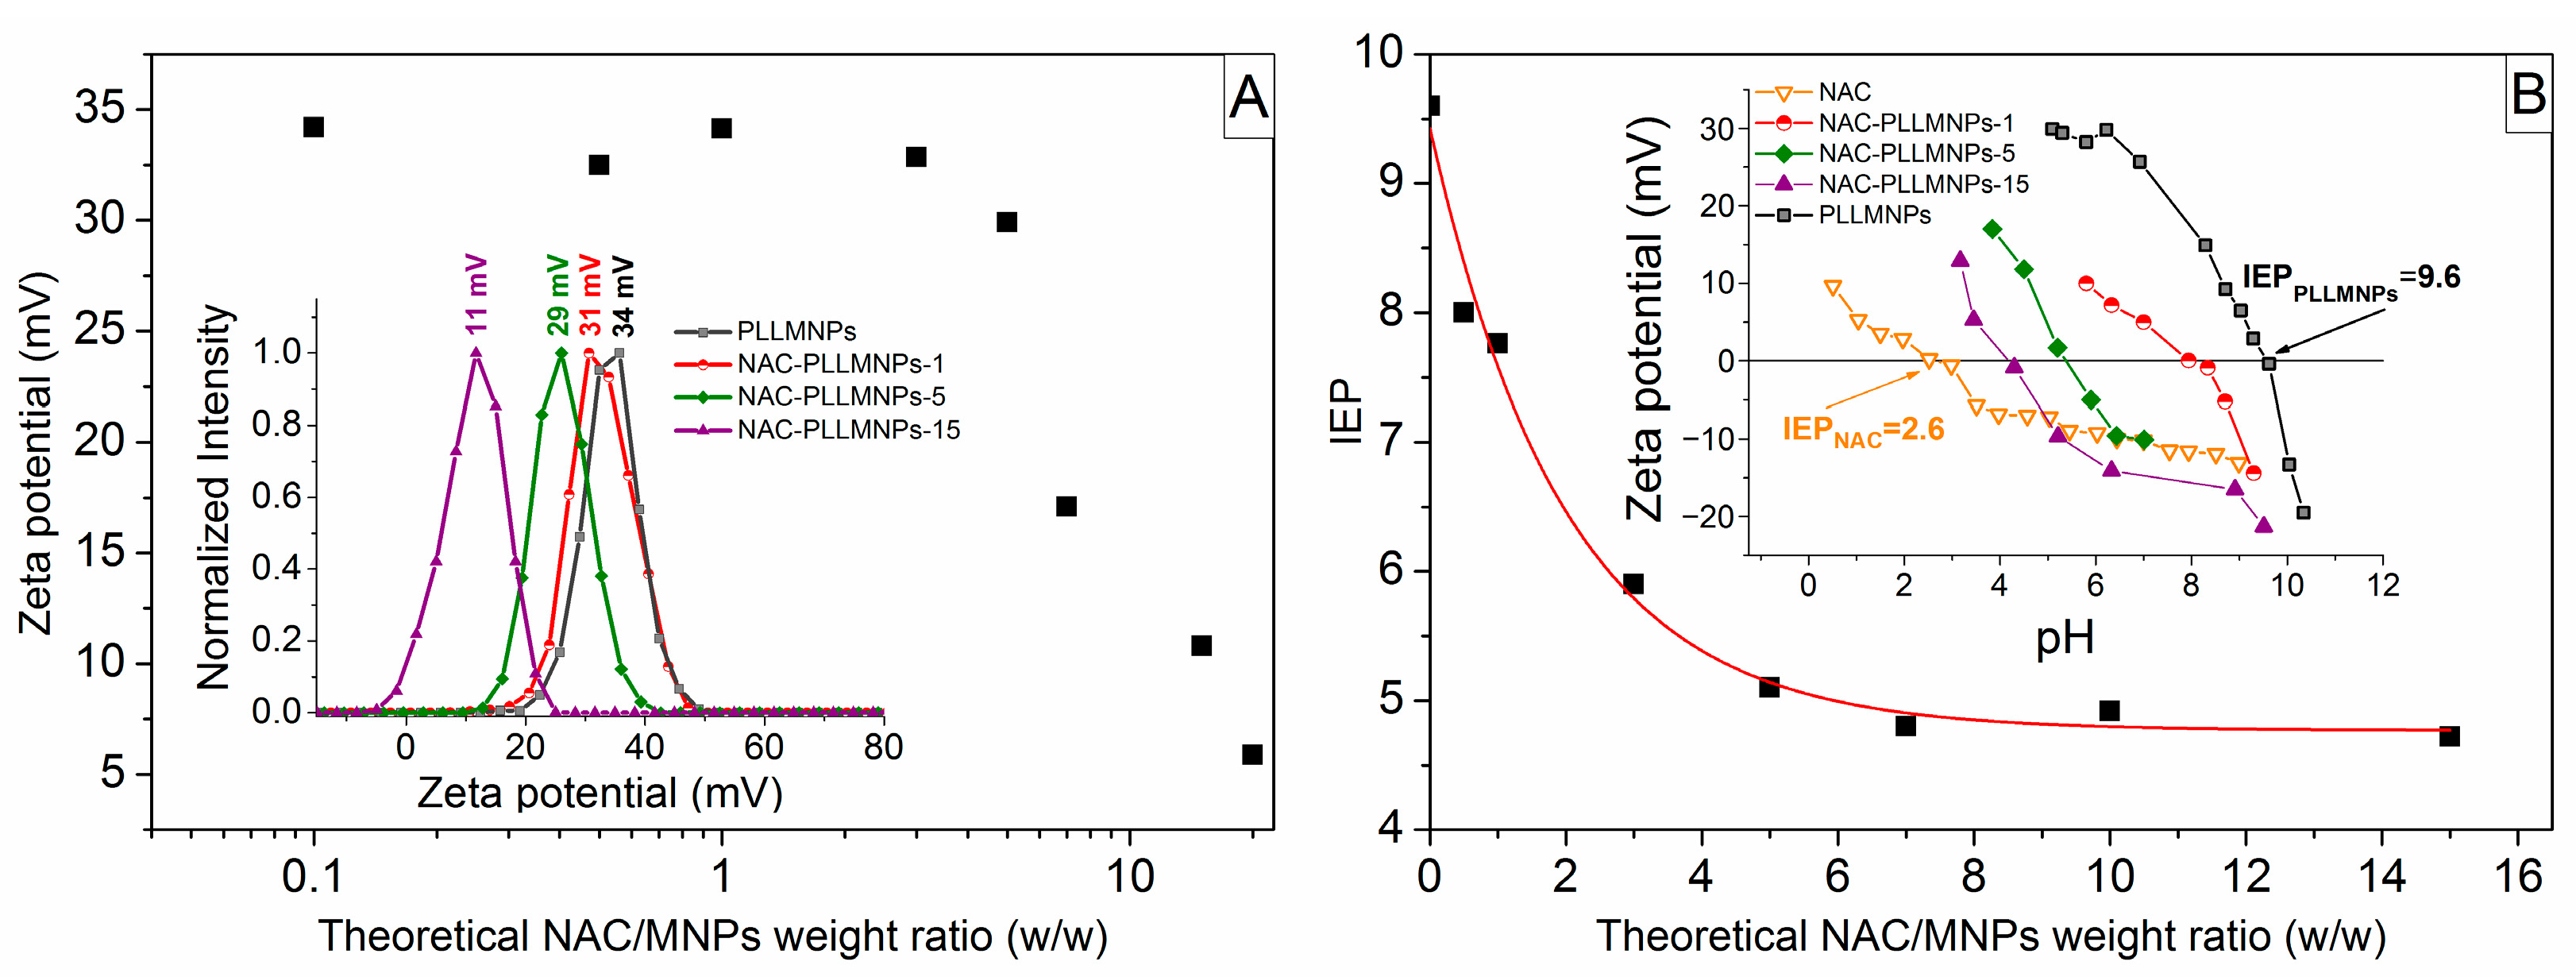
2.1. Zeta Potential Measurements
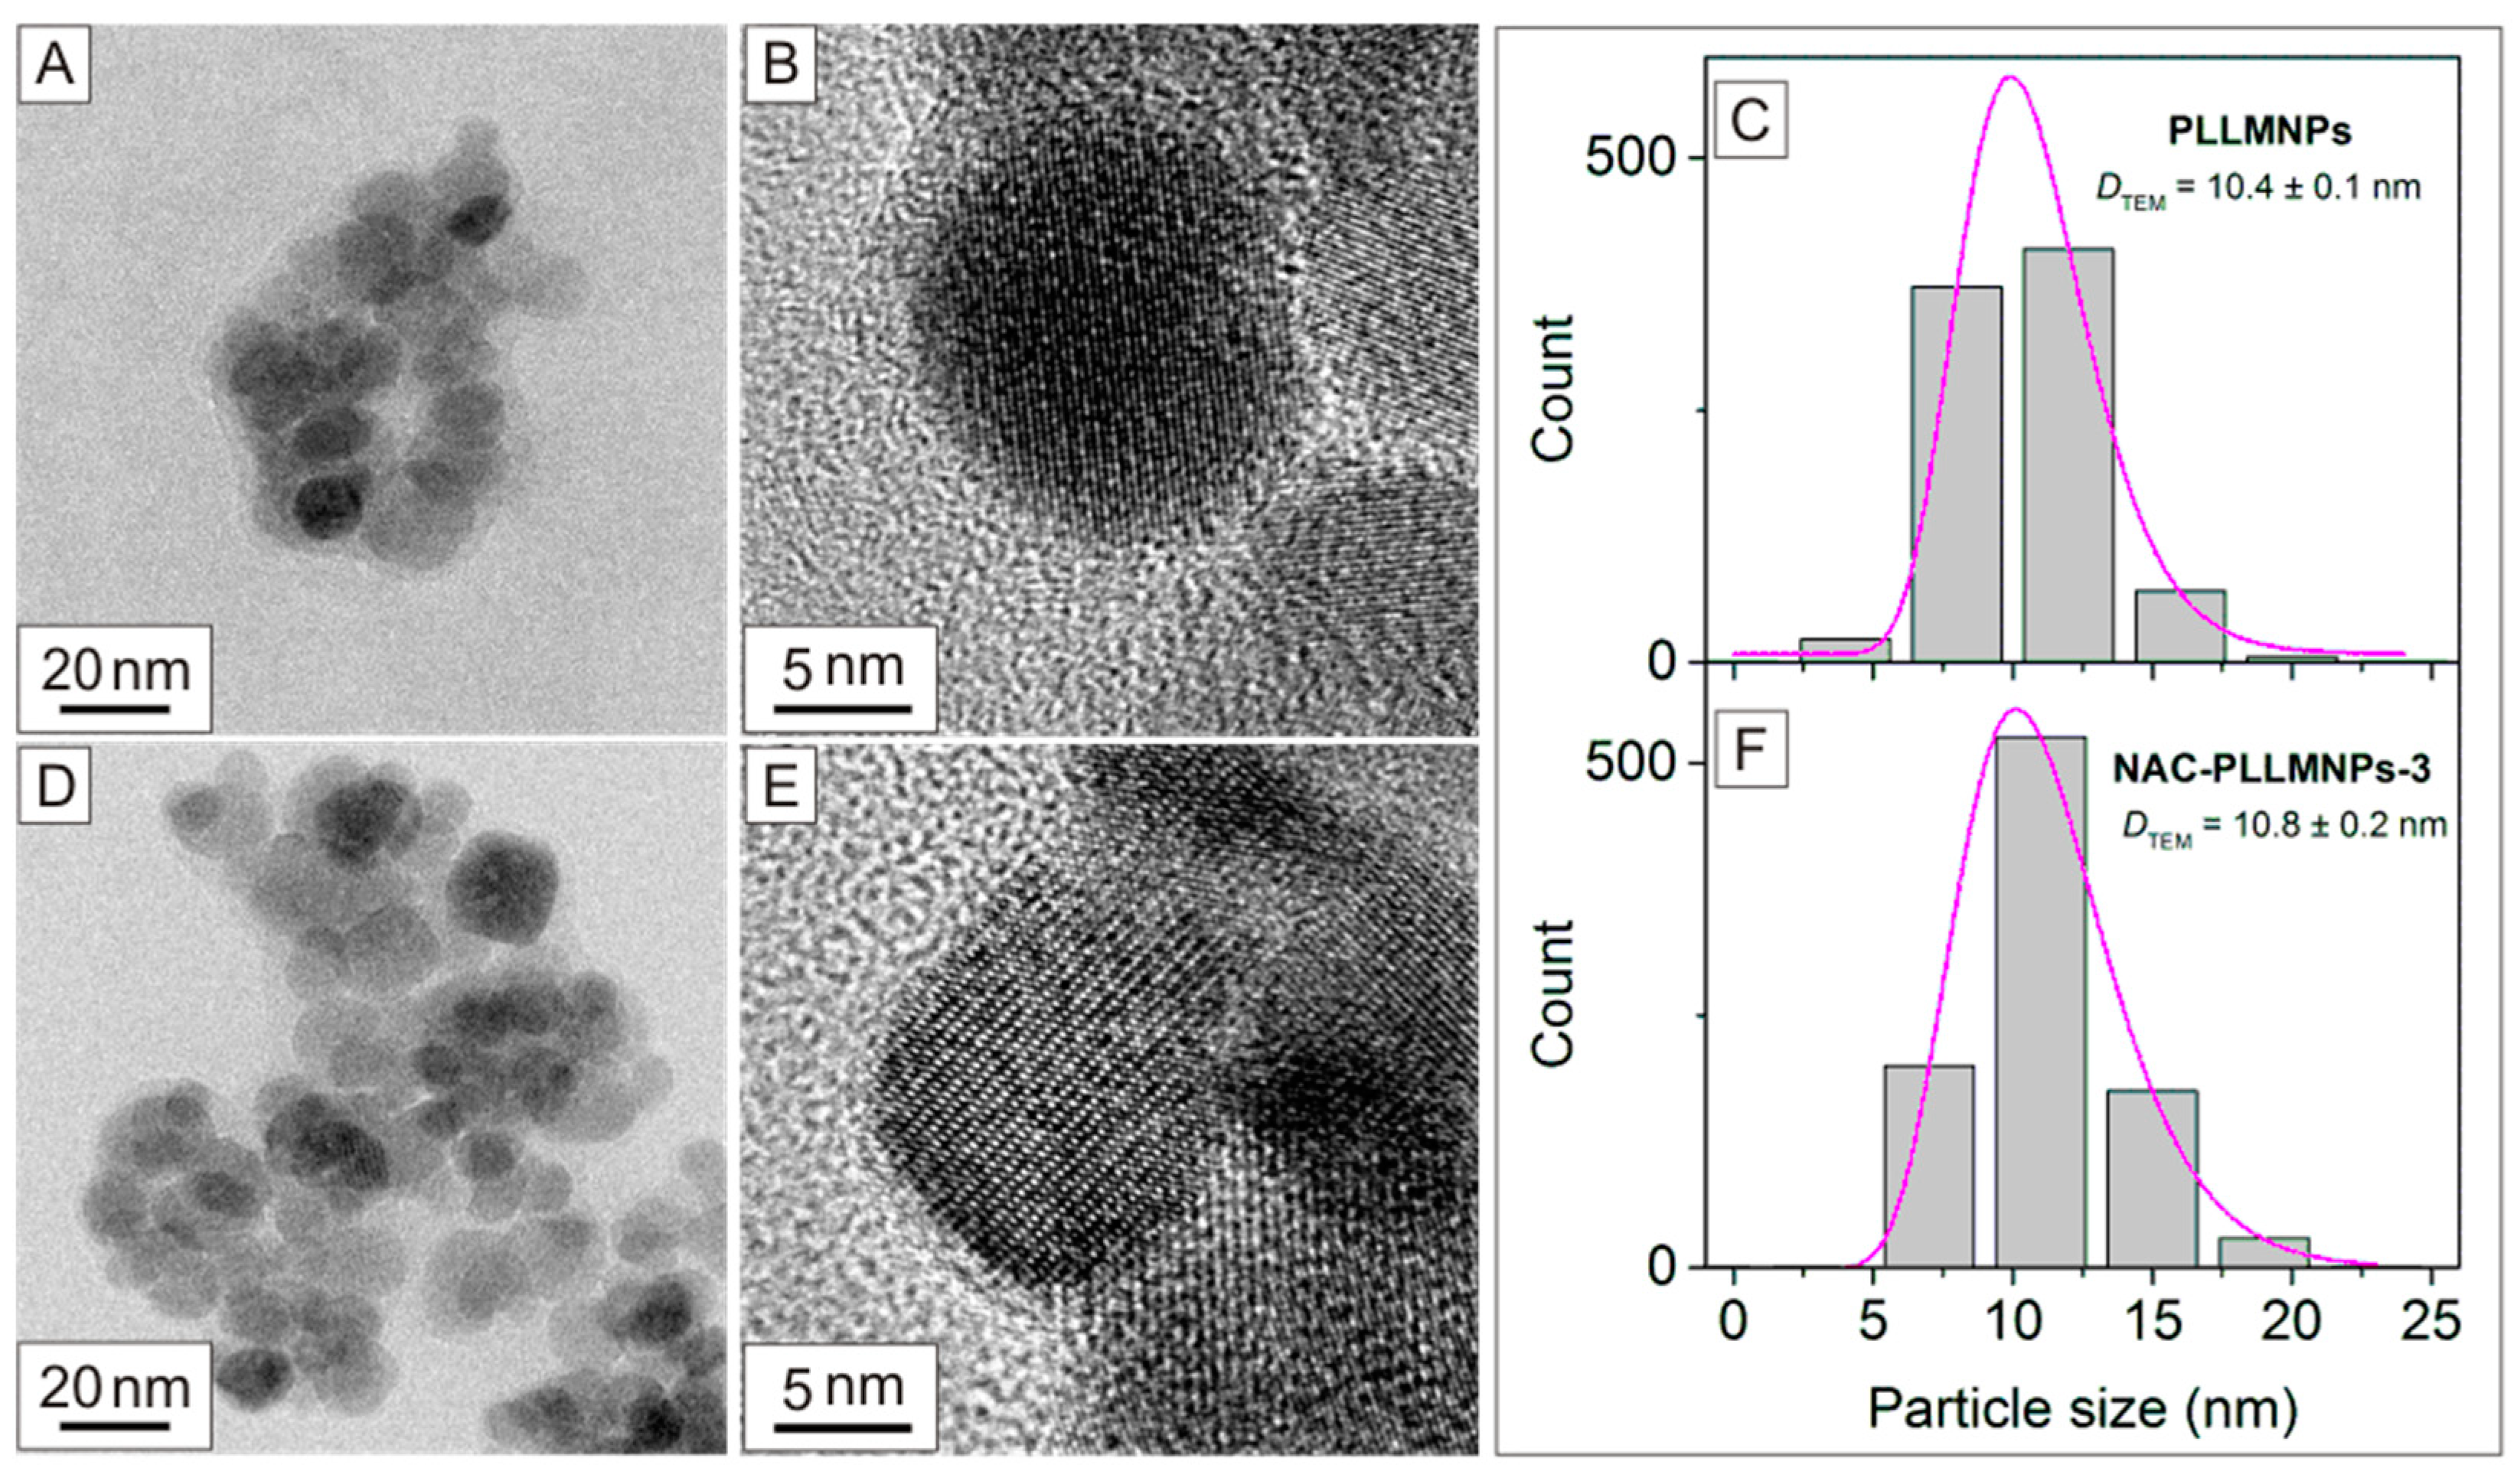
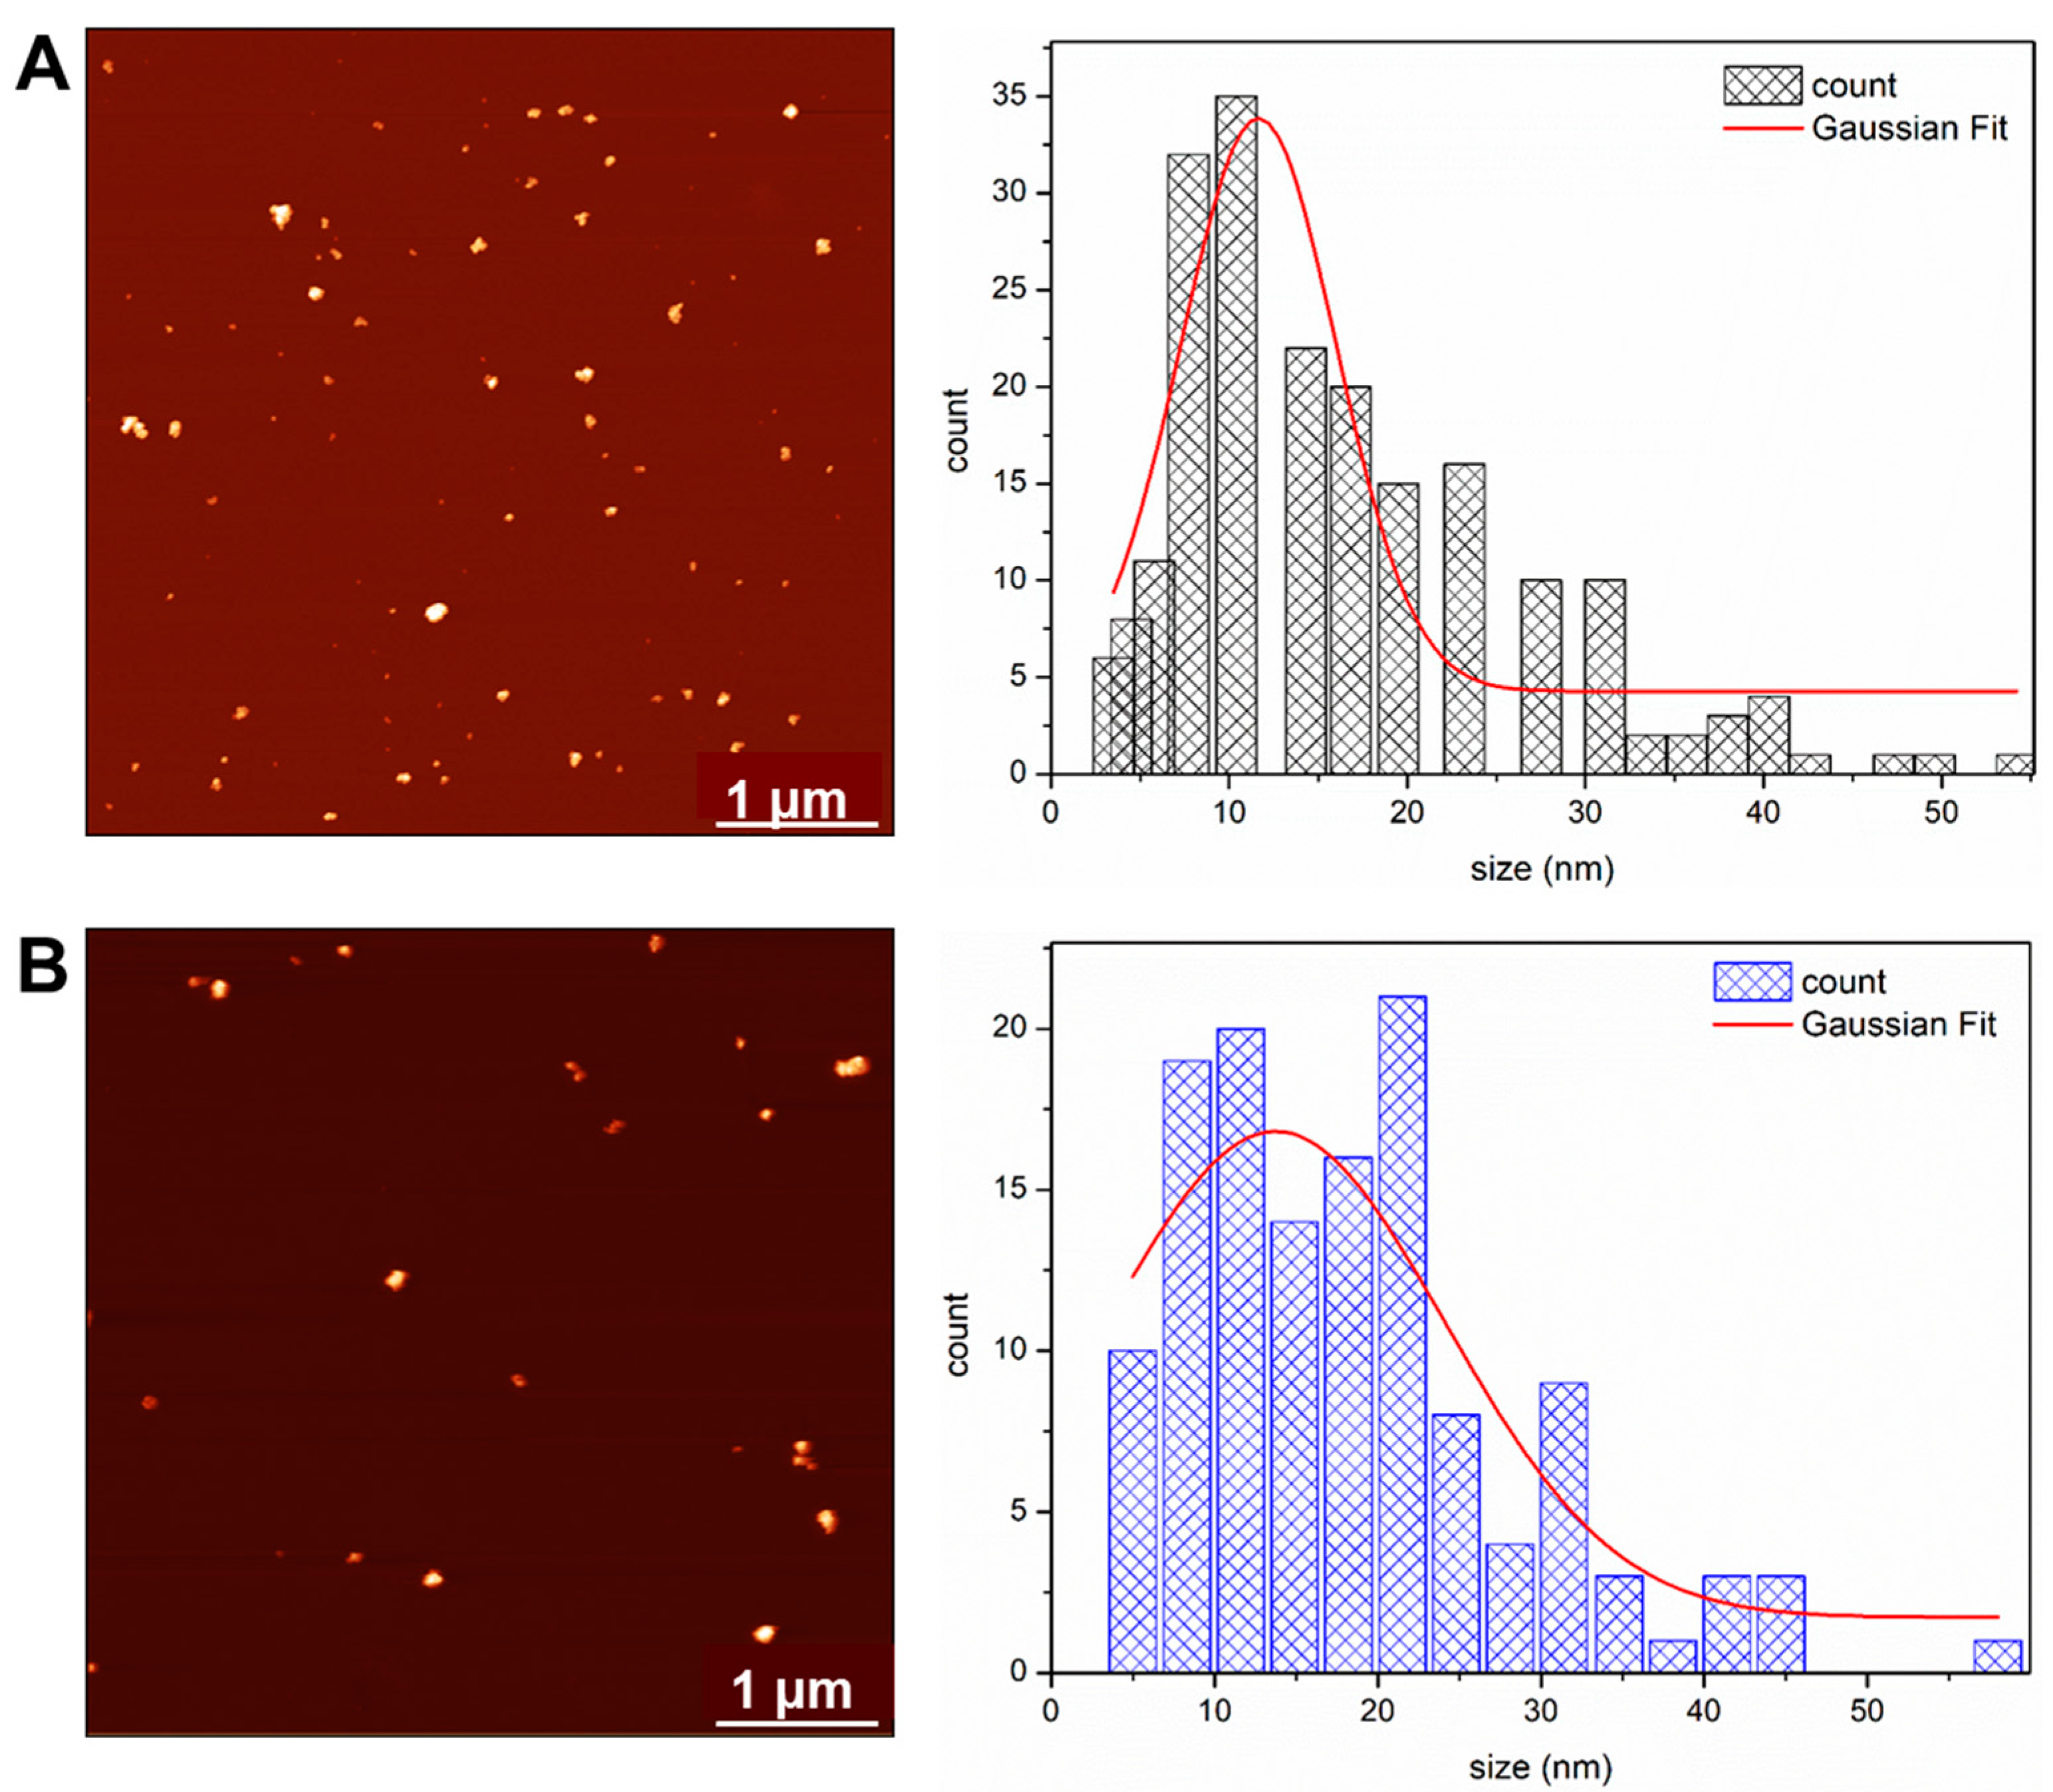
2.2. Morphology and Size Distribution
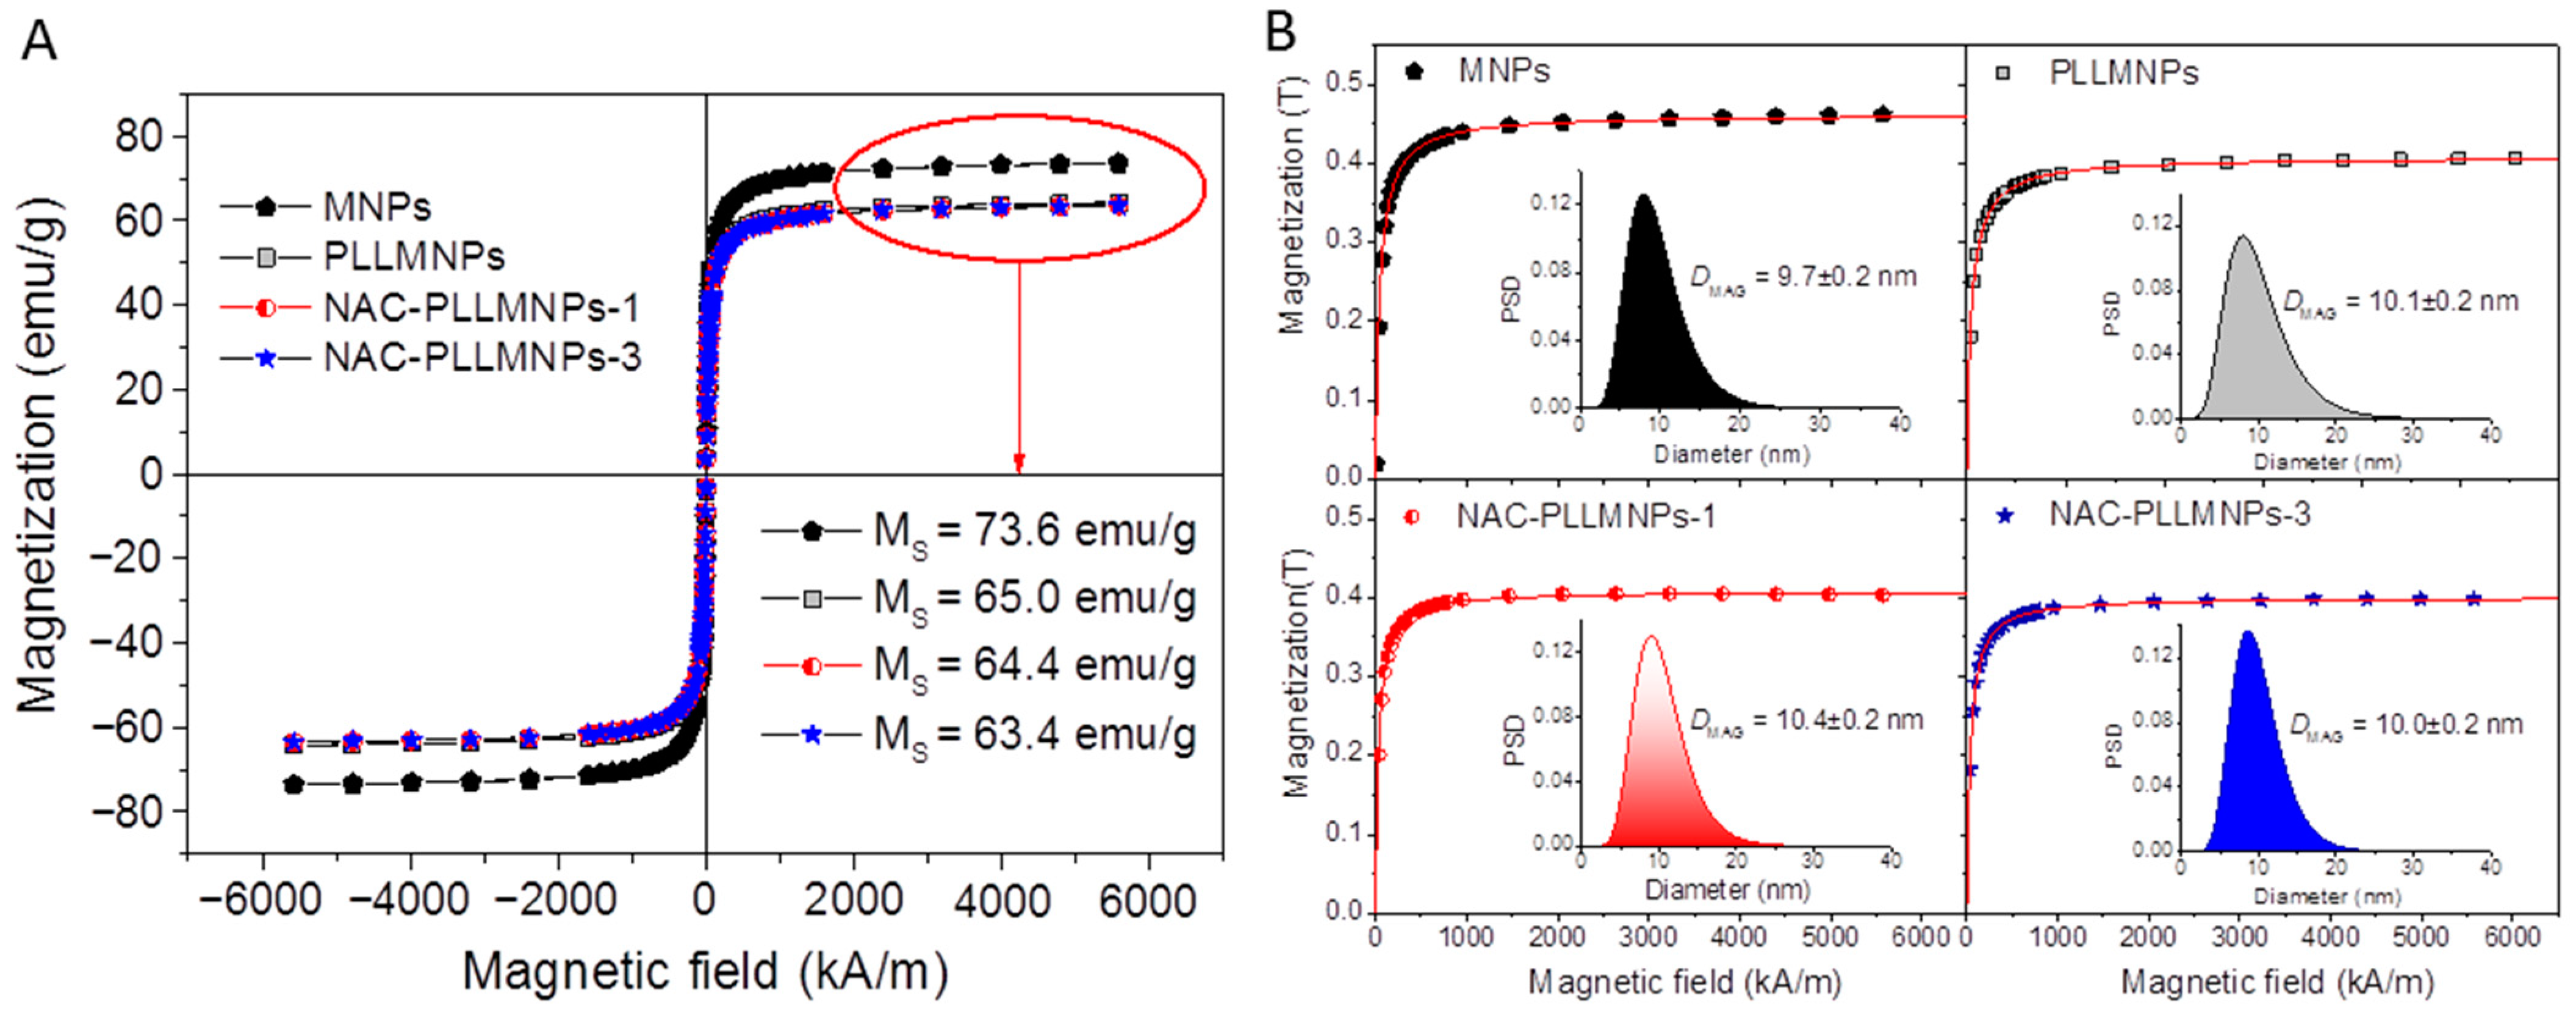
2.3. Magnetic Measurements
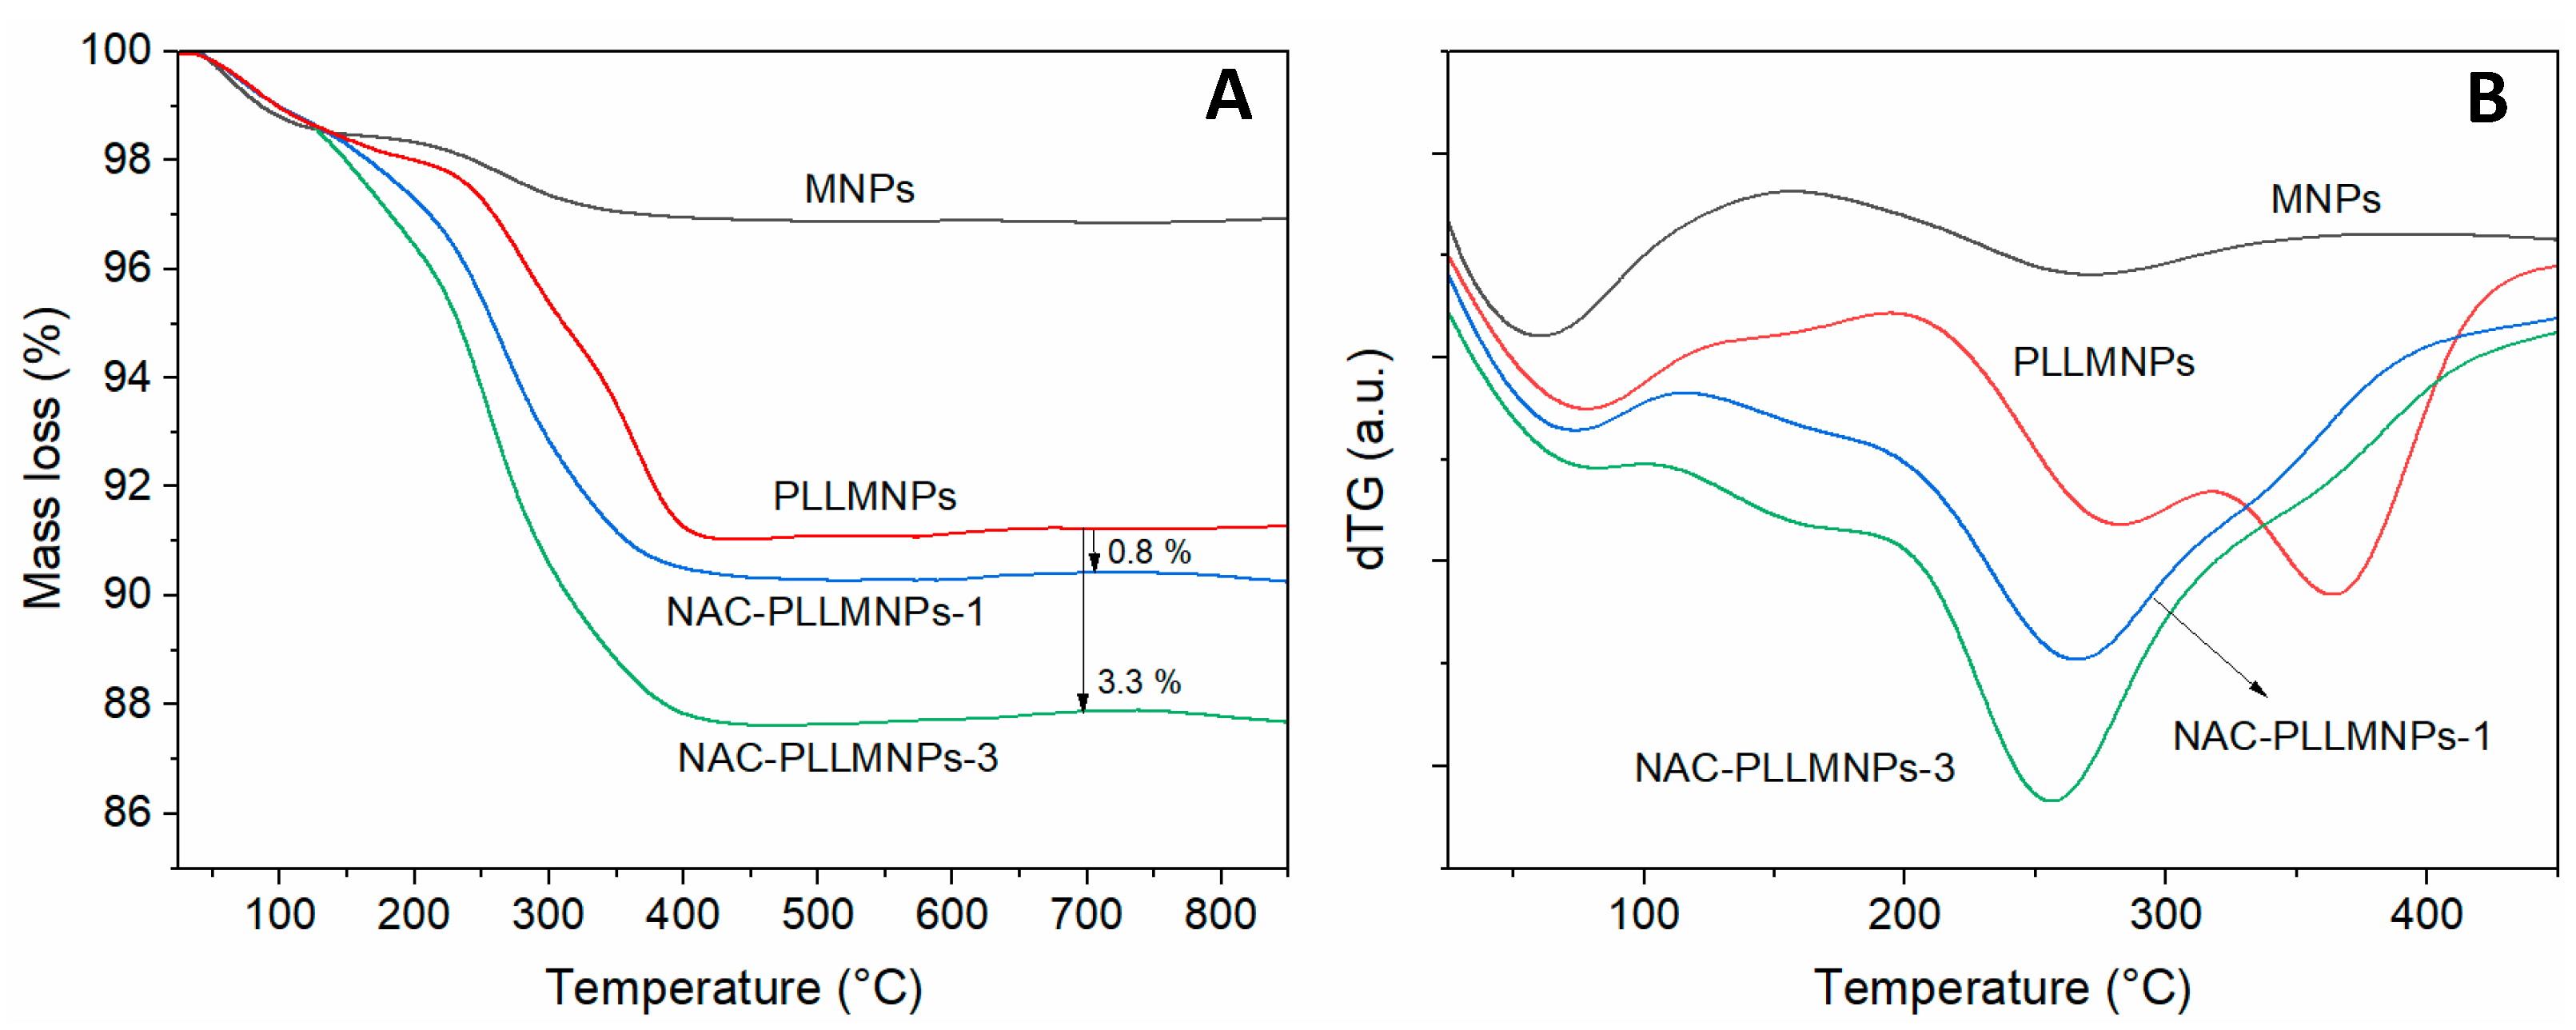
2.4. Thermogravimetric Analysis (TGA)
2.5. Stability Monitoring
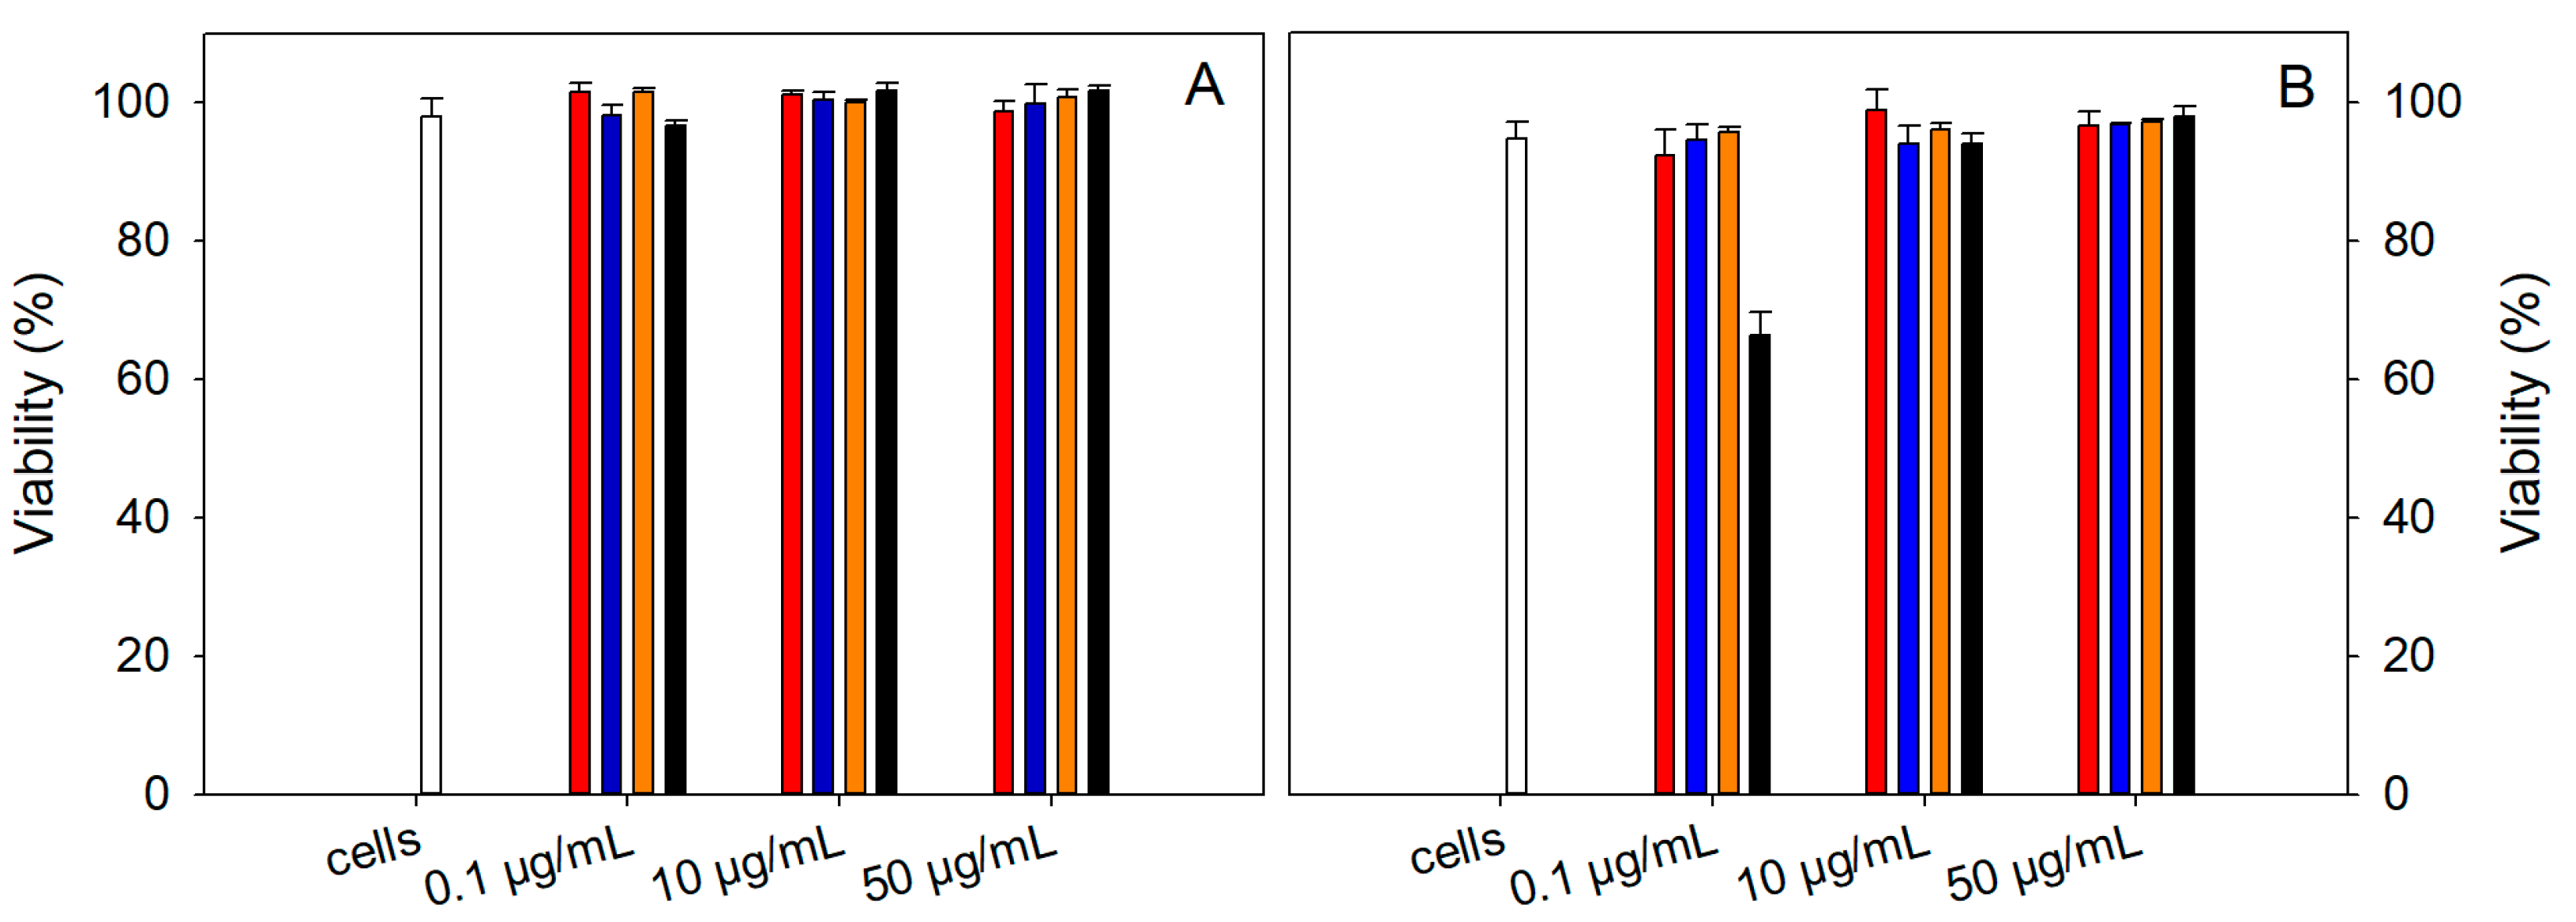
2.6. Cytotoxicity Experiments
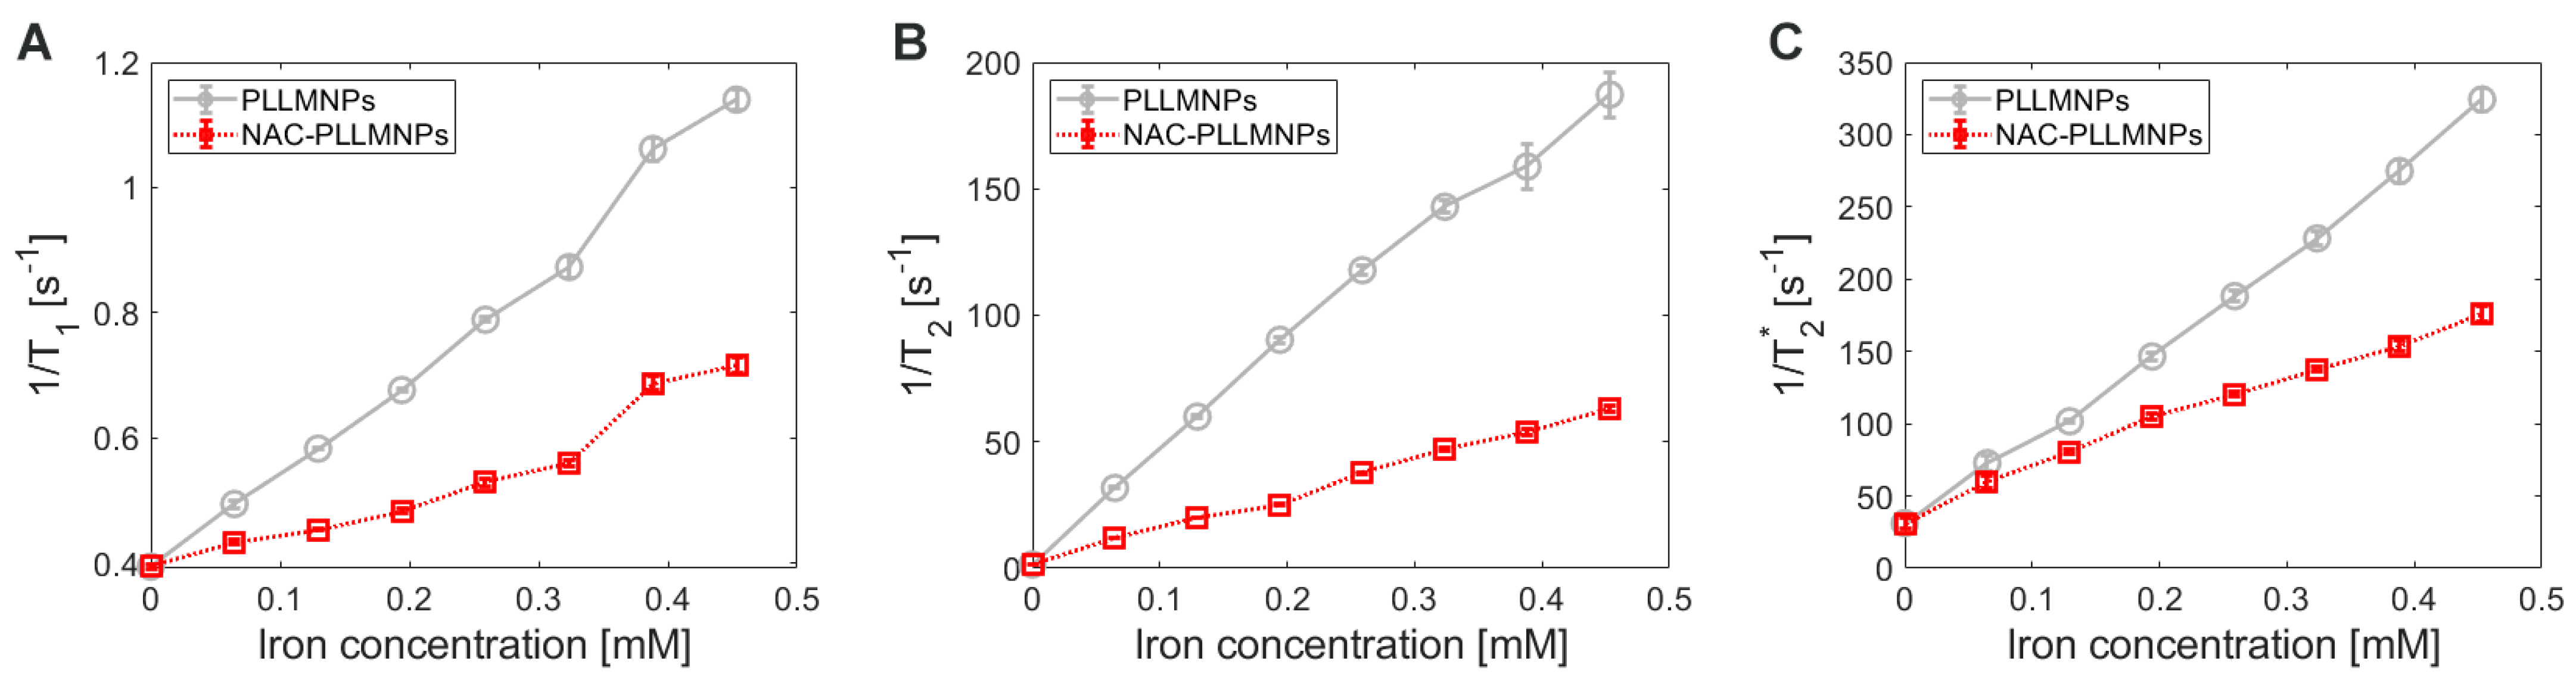
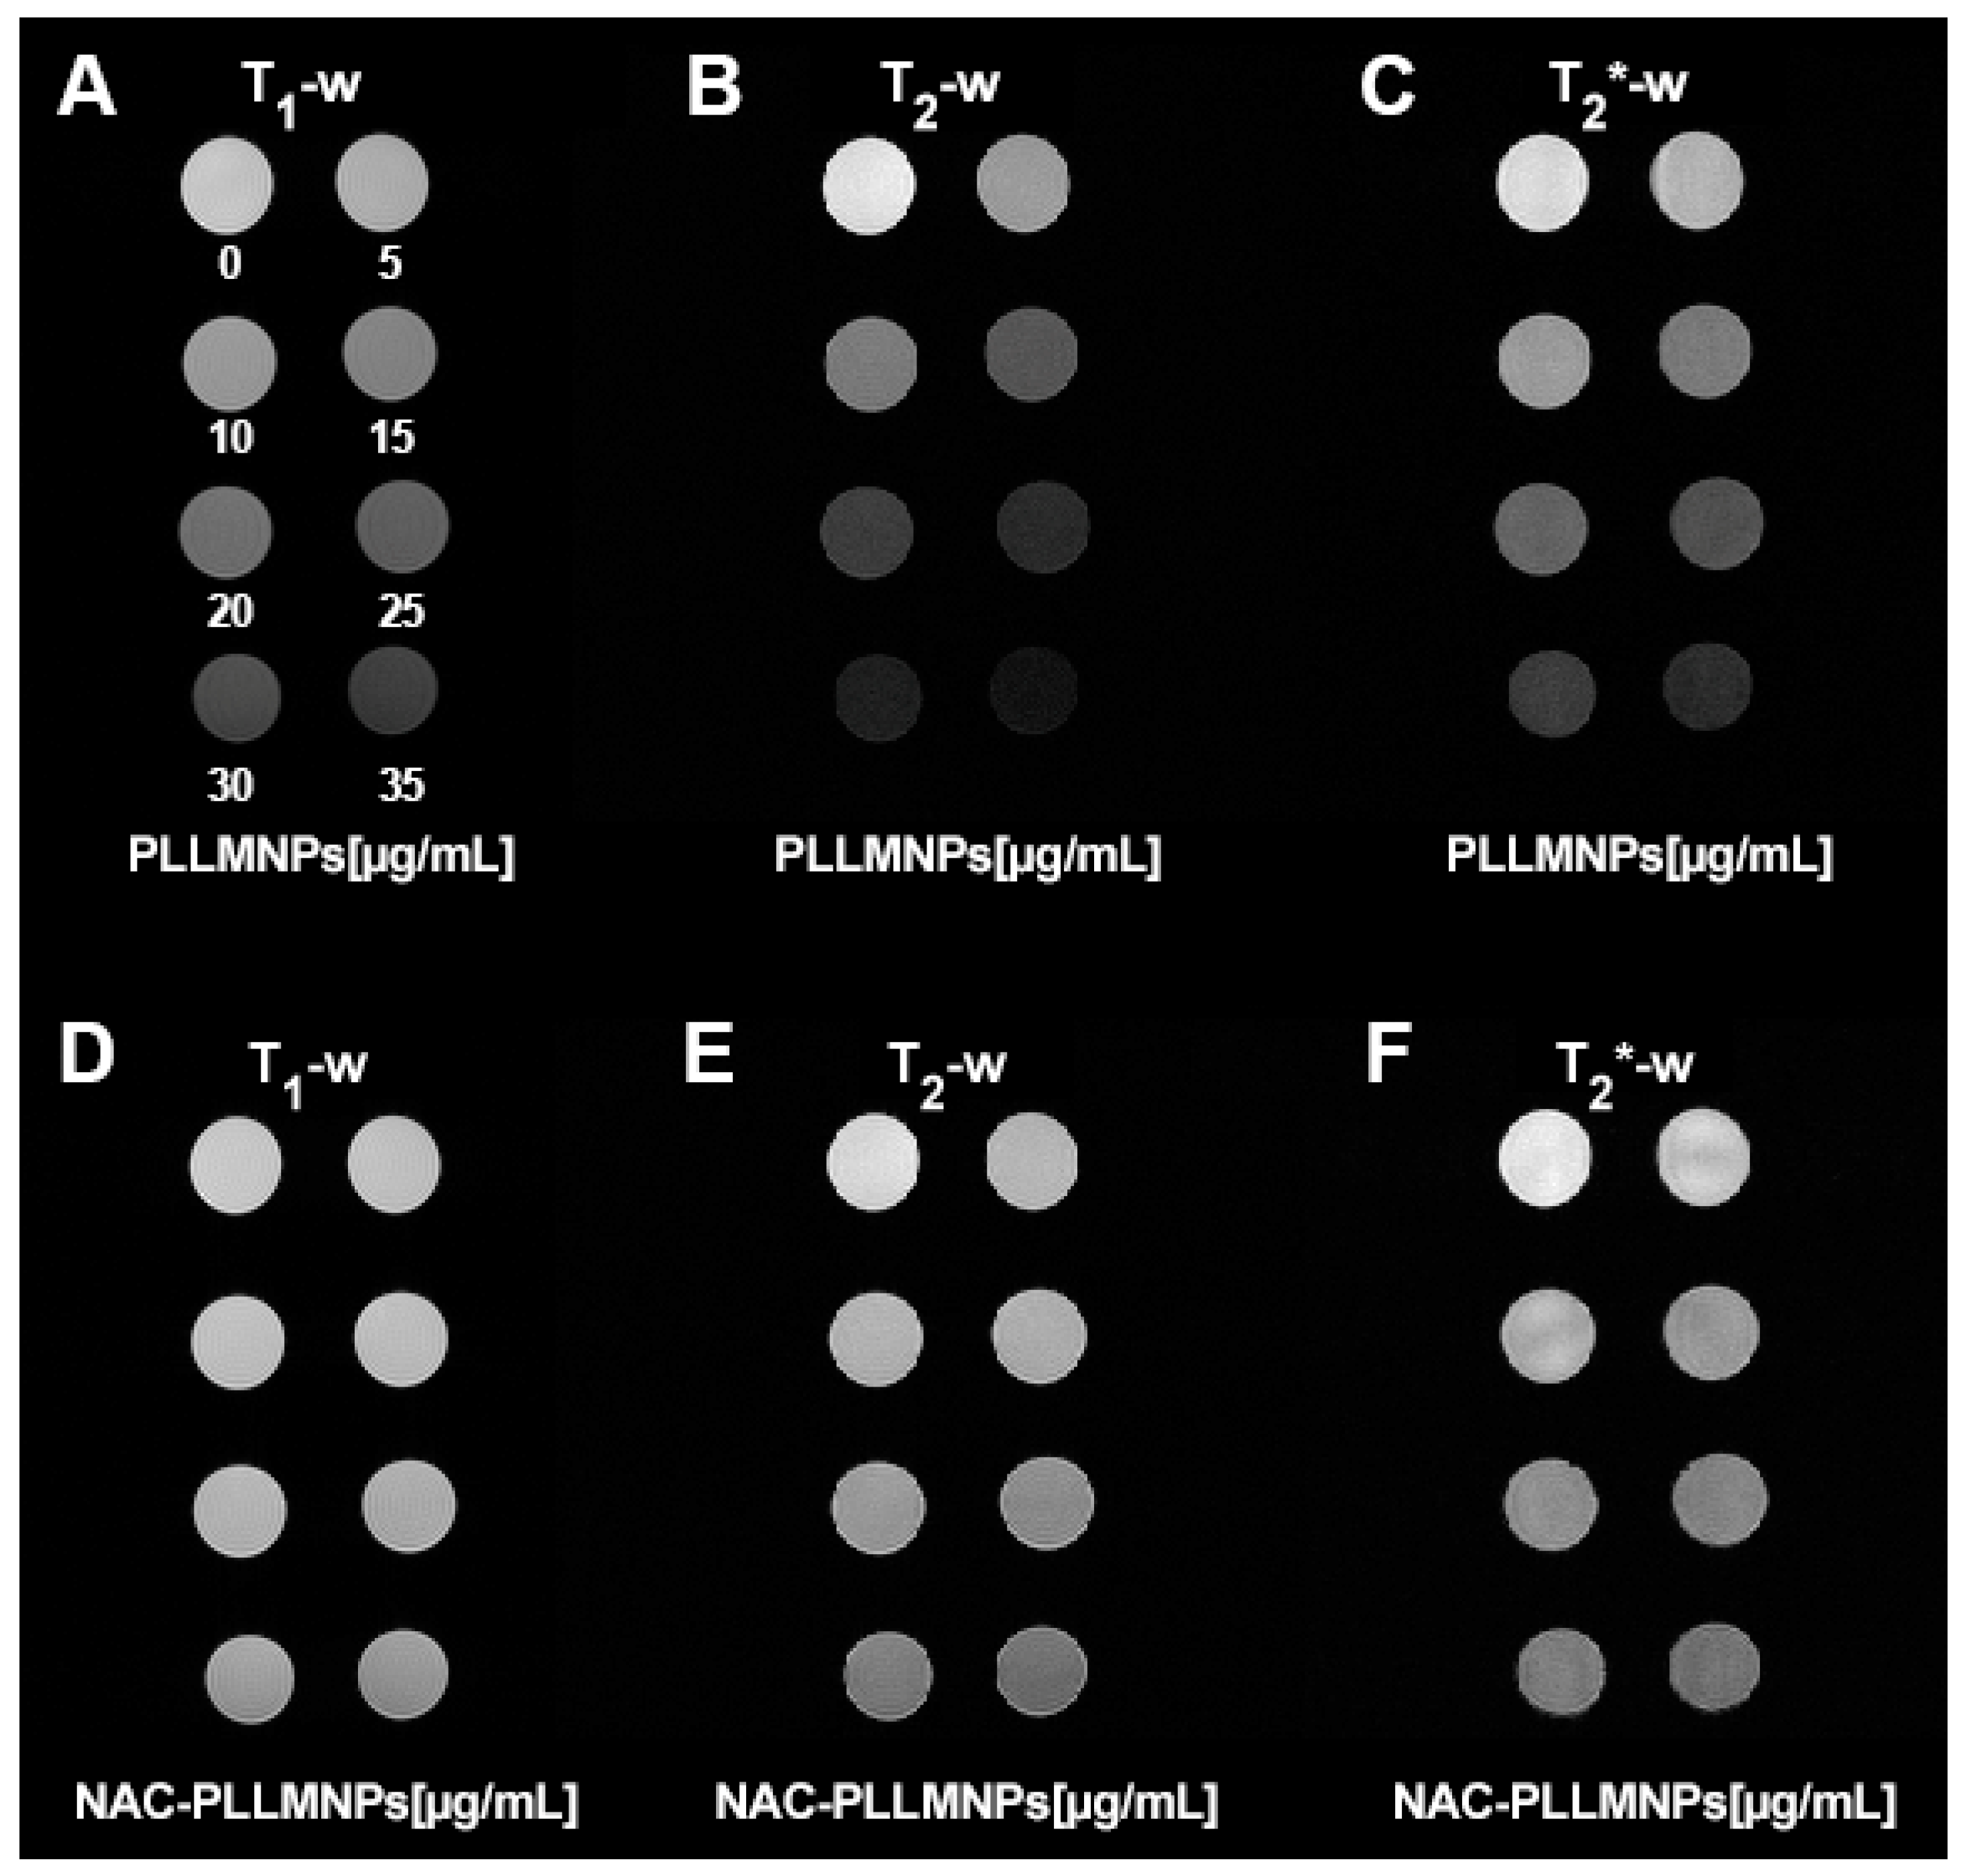
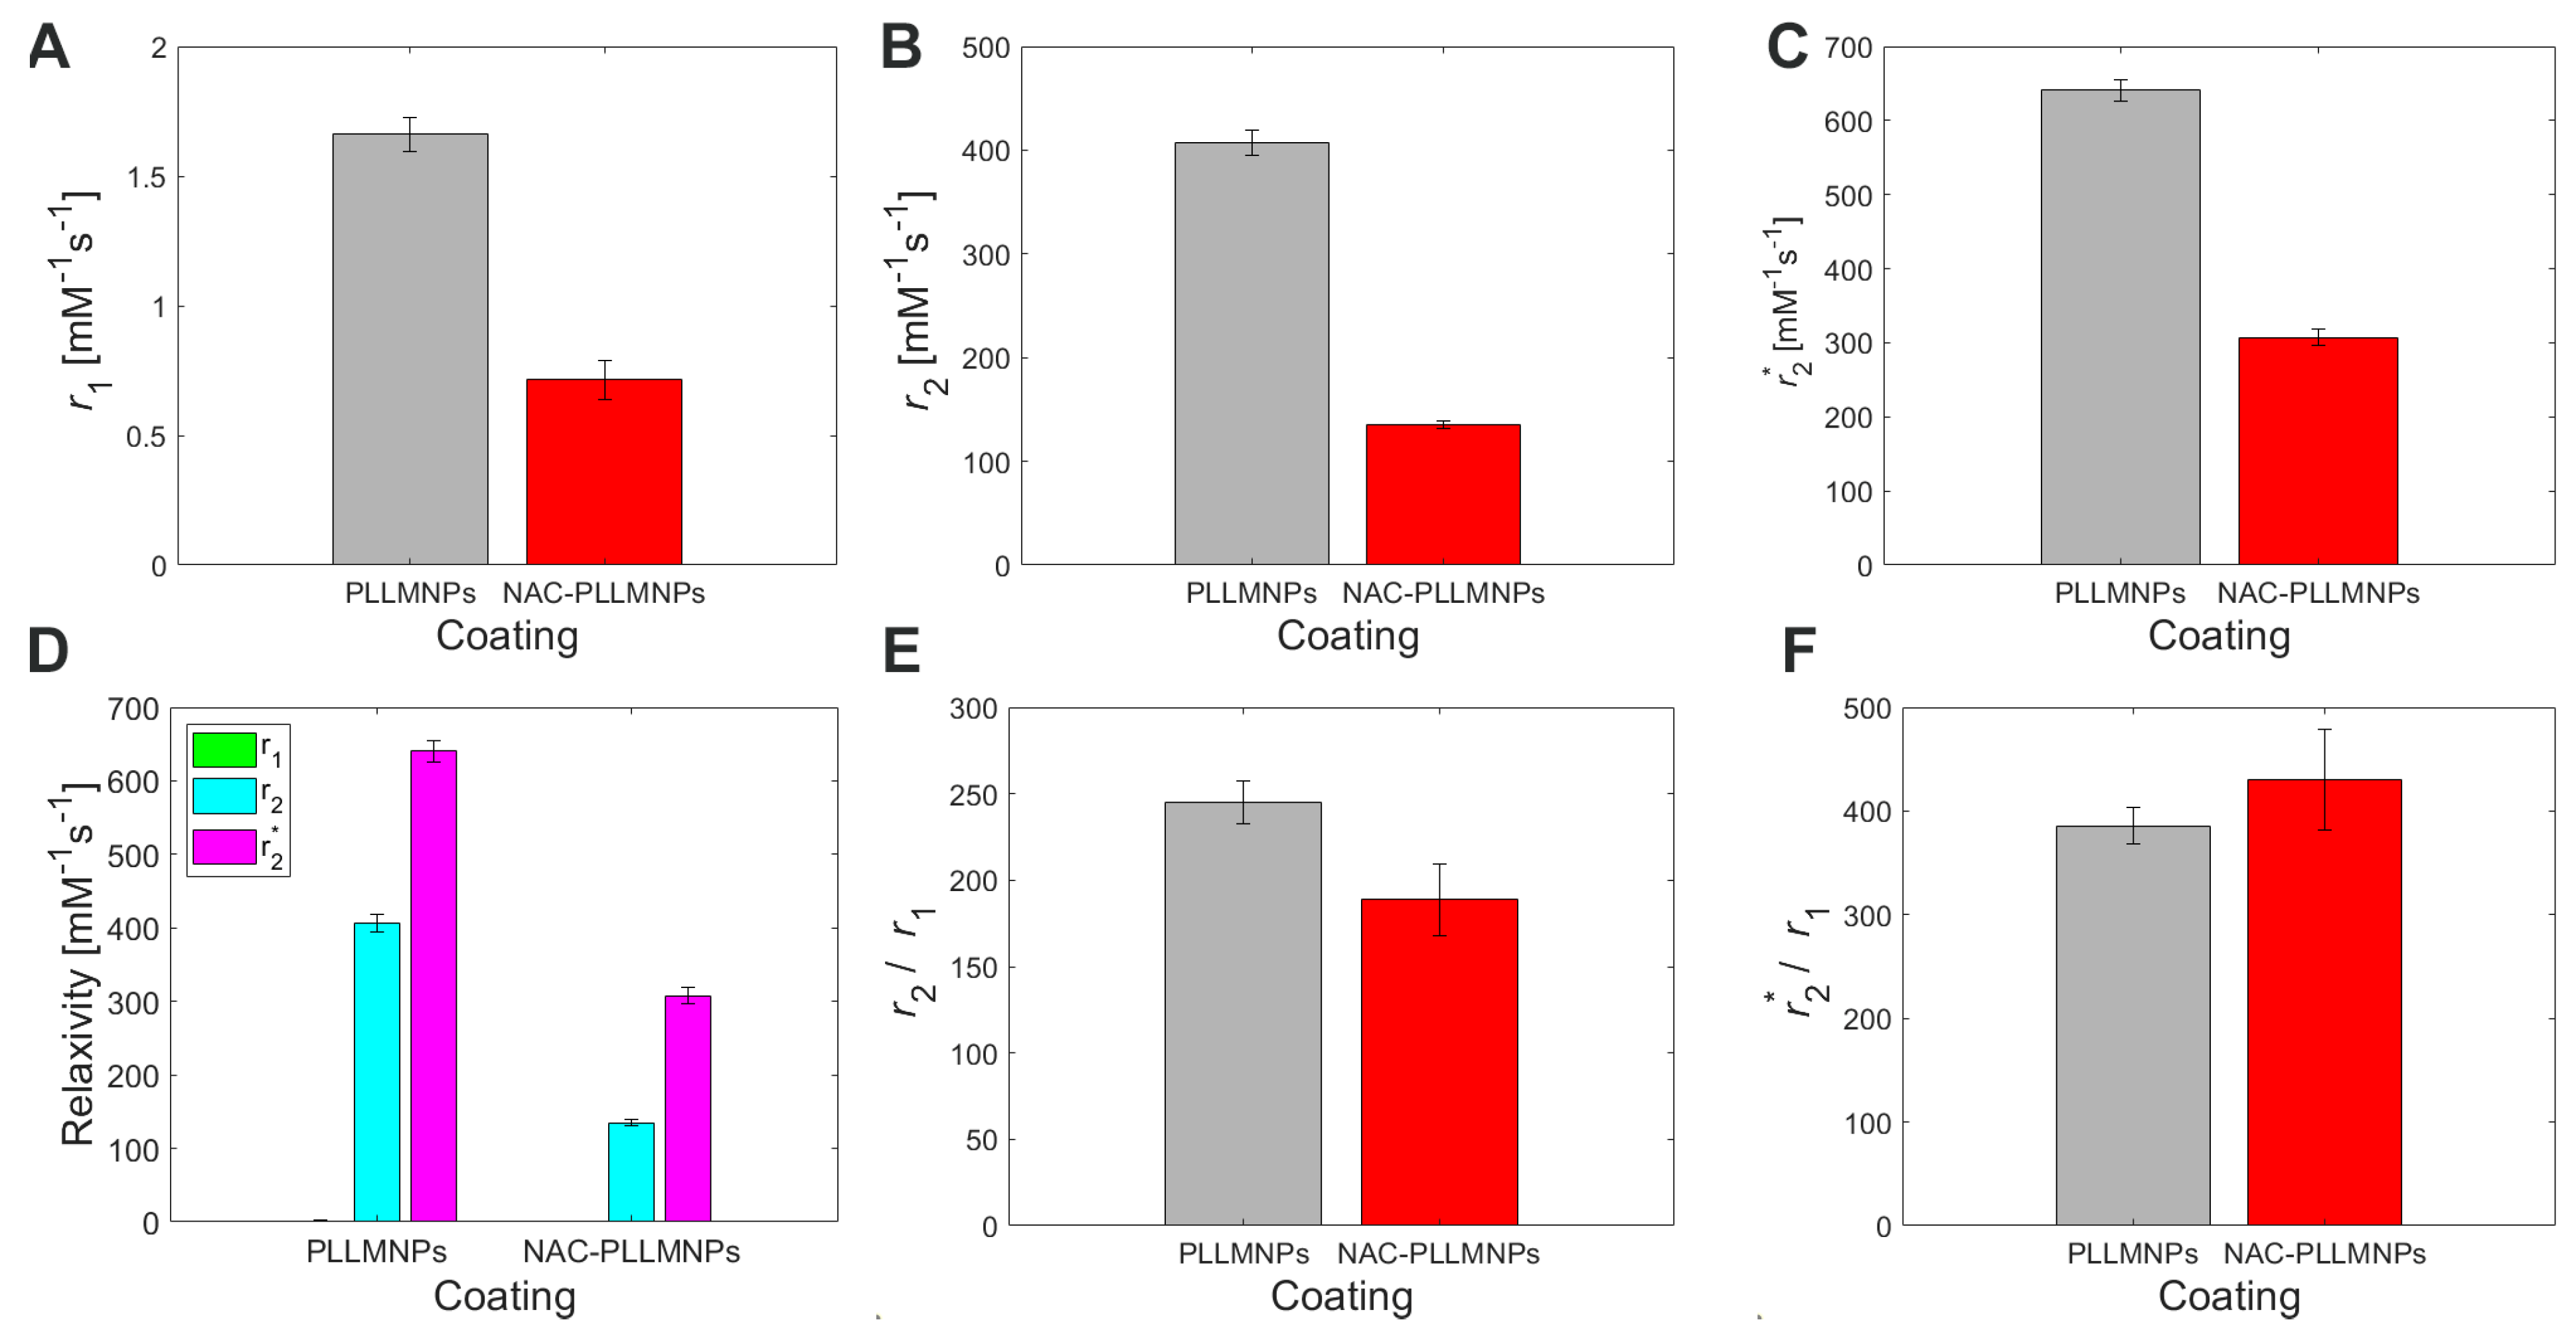
2.7. MRI Relaxometry
3. Materials and Methods
3.1. Materials
3.2. Methods
3.2.1. Preparation of Magnetic Nanoparticles
3.2.2. Preparation of Amino-Functionalized Magnetic Nanoparticles
3.2.3. N-Acetylcysteine Adsorption on Amino-Modified Magnetic Nanoparticles
3.2.4. Physicochemical Characterization
3.2.5. Time and Thermal Stability Studies
3.2.6. Cytotoxicity Experiments
3.2.7. Magnetic Resonance Imaging
- T1 mapping—Rapid acquisition with refocused echo (RARE) pulse sequence, with repetition time TR = 5500, 3000, 1500, 800, 400, and 200 ms, and echo time TE = 7 ms.
- T2 mapping—Multi-slice multi-echo (MSME) pulse sequence, with repetition time TR = 2000 ms, starting echo time TE = 8 ms, spacing = 8 ms, and 25 images.
- T2* mapping—Multi-gradient echo (MGE) pulse sequence, with a repetition time TR = 1200 ms, starting echo time TE = 5.1 ms, spacing = 5 ms, and 10 images.
4. Conclusions
Author Contributions
Funding
Institutional Review Board Statement
Informed Consent Statement
Data Availability Statement
Conflicts of Interest
References
- Raghavendran, K.; Nemzek, J.; Napolitano, L.M.; Knight, P.R. Aspiration-Induced Lung Injury. Crit. Care Med. 2011, 39, 818–826. [Google Scholar] [CrossRef] [PubMed]
- Slutsky, A.S.; Ranieri, V.M. Ventilator-Induced Lung Injury. N. Engl. J. Med. 2013, 369, 2126–2136. [Google Scholar] [CrossRef] [PubMed]
- Newman, S.P. Drug Delivery to the Lungs: Challenges and Opportunities. Ther. Deliv. 2017, 8, 647–661. [Google Scholar] [CrossRef]
- Man, F.; Lammers, T.; De Rosales, R.T.M. Imaging Nanomedicine-Based Drug Delivery: A Review of Clinical Studies. Mol. Imaging Biol. 2018, 20, 683–695. [Google Scholar] [CrossRef] [PubMed]
- Mikhail, A.S.; Partanen, A.; Yarmolenko, P.; Venkatesan, A.M.; Wood, B.J. Magnetic Resonance-Guided Drug Delivery. Magn. Reson. Imaging Clin. N. Am. 2015, 23, 643–655. [Google Scholar] [CrossRef]
- Gauberti, M.; Fournier, A.P.; Vivien, D.; Martinez de Lizarrondo, S. Molecular Magnetic Resonance Imaging (MMRI). In Preclinical MRI: Methods and Protocols; García Martín, M.L., López Larrubia, P., Eds.; Methods in Molecular Biology; Springer: New York, NY, USA, 2018; pp. 315–327. ISBN 9781493975310. [Google Scholar]
- Bauman, G.; Puderbach, M.; Deimling, M.; Jellus, V.; Chefd’hotel, C.; Dinkel, J.; Hintze, C.; Kauczor, H.-U.; Schad, L.R. Non-Contrast-Enhanced Perfusion and Ventilation Assessment of the Human Lung by Means of Fourier Decomposition in Proton MRI. Magn. Reason. Med. 2009, 62, 656–664. [Google Scholar] [CrossRef] [PubMed]
- Oakes, J.M.; Breen, E.C.; Scadeng, M.; Tchantchou, G.S.; Darquenne, C. MRI-Based Measurements of Aerosol Deposition in the Lung of Healthy and Elastase-Treated Rats. J. Appl. Physiol. 2014, 116, 1561–1568. [Google Scholar] [CrossRef]
- Gao, J.; Li, L.; Liu, X.; Guo, R.; Zhao, B. Contrast enhanced Magnetic Resonance Imaging with a Novel Nano size Contrast Agent for the Clinical Diagnosis of Patients with Lung Cancer. Exp. Ther. Med. 2018, 15, 5415–5421. [Google Scholar] [CrossRef]
- Avasthi, A.; Caro, C.; Pozo-Torres, E.; Leal, M.P.; García-Martín, M.L. Magnetic Nanoparticles as MRI Contrast Agents. Top. Curr. Chem. 2020, 378, 40. [Google Scholar] [CrossRef] [PubMed]
- Smith, L.; Byrne, H.L.; Waddington, D.; Kuncic, Z. Nanoparticles for MRI-Guided Radiation Therapy: A Review. Cancer Nano 2022, 13, 38. [Google Scholar] [CrossRef]
- Saadat, M.; Manshadi, M.K.D.; Mohammadi, M.; Zare, M.J.; Zarei, M.; Kamali, R.; Sanati-Nezhad, A. Magnetic Particle Targeting for Diagnosis and Therapy of Lung Cancers. J. Control. Release 2020, 328, 776–791. [Google Scholar] [CrossRef] [PubMed]
- Rastogi, A.; Yadav, K.; Mishra, A.; Singh, M.S.; Chaudhary, S.; Manohar, R.; Parmar, A.S. Early Diagnosis of Lung Cancer Using Magnetic Nanoparticles-Integrated Systems. Nanotechnol. Rev. 2022, 11, 544–574. [Google Scholar] [CrossRef]
- Thangudu, S.; Yu, C.-C.; Lee, C.-L.; Liao, M.-C.; Su, C.-H. Magnetic, Biocompatible FeCO3 Nanoparticles for T2-Weighted Magnetic Resonance Imaging of in Vivo Lung Tumors. J. Nanobiotechnol. 2022, 20, 157. [Google Scholar] [CrossRef] [PubMed]
- Eivazzadeh-Keihan, R.; Ghafori Gorab, M.; Aghamirza Moghim Aliabadi, H.; Mahdavi, M.; Akbarzadeh, A.R.; Maleki, A.; Ghafuri, H. Novel Magnetic Organic–Inorganic Hybrids Based on Aromatic Polyamides and ZnFe2O4 Nanoparticles with Biological Activity. Sci. Rep. 2021, 11, 20310. [Google Scholar] [CrossRef]
- Dubey, K.; Anand, B.G.; Badhwar, R.; Bagler, G.; Navya, P.N.; Daima, H.K.; Kar, K. Tyrosine- and Tryptophan-Coated Gold Nanoparticles Inhibit Amyloid Aggregation of Insulin. Amino Acids 2015, 47, 2551–2560. [Google Scholar] [CrossRef] [PubMed]
- Pandya, S.R.; Patel, S.; Bakshi, S.; Singh, M. In Vitro DNA Binding, Antioxidant, Antimicrobial and Anticancer Assessment of Amino Acid Functionalized Magnetic Nanoparticles. Appl. Surf. Sci. 2018, 451, 1–19. [Google Scholar] [CrossRef]
- Khmara, I.; Koneracka, M.; Kubovcikova, M.; Zavisova, V.; Antal, I.; Csach, K.; Kopcansky, P.; Vidlickova, I.; Csaderova, L.; Pastorekova, S.; et al. Preparation of Poly-L-Lysine Functionalized Magnetic Nanoparticles and Their Influence on Viability of Cancer Cells. J. Magn. Magn. Mater. 2017, 427, 114–121. [Google Scholar] [CrossRef]
- Mirković, M.; Milanović, Z.; Perić, M.; Vranješ-Đurić, S.; Ognjanović, M.; Antić, B.; Kuraica, M.; Krstić, I.; Kubovcikova, M.; Antal, I.; et al. Design and Preparation of Proline, Tryptophan and Poly-l-Lysine Functionalized Magnetic Nanoparticles and Their Radiolabeling with 131I and 177Lu for Potential Theranostic Use. Int. J. Pharm. 2022, 628, 122288. [Google Scholar] [CrossRef]
- Tenório, M.C.d.S.; Graciliano, N.G.; Moura, F.A.; Oliveira, A.C.M.d.; Goulart, M.O.F. N-Acetylcysteine (NAC): Impacts on Human Health. Antioxidants 2021, 10, 967. [Google Scholar] [CrossRef]
- Ziment, I. Acetylcysteine: A Drug with an Interesting Past and a Fascinating Future. Respiration 1986, 50, 26–30. [Google Scholar] [CrossRef]
- Chen, W.; Ercal, N.; Huynh, T.; Volkov, A.; Chusuei, C.C. Characterizing N-Acetylcysteine (NAC) and N-Acetylcysteine Amide (NACA) Binding for Lead Poisoning Treatment. J. Colloid Interface Sci. 2012, 371, 144–149. [Google Scholar] [CrossRef]
- Eaton, P.; Quaresma, P.; Soares, C.; Neves, C.; De Almeida, M.P.; Pereira, E.; West, P. A Direct Comparison of Experimental Methods to Measure Dimensions of Synthetic Nanoparticles. Ultramicroscopy 2017, 182, 179–190. [Google Scholar] [CrossRef]
- Brydson, R.; Brown, A.; Hodges, C.; Abellan, P.; Hondow, N. Microscopy of Nanoparticulate Dispersions: Microscopy of nanoparticulate dispersions. J. Microsc. 2015, 260, 238–247. [Google Scholar] [CrossRef] [PubMed]
- Lim, J.; Yeap, S.P.; Che, H.X.; Low, S.C. Characterization of Magnetic Nanoparticle by Dynamic Light Scattering. Nanoscale Res. Lett. 2013, 8, 381. [Google Scholar] [CrossRef] [PubMed]
- Józefczak, A.; Hornowski, T.; Závišová, V.; Skumiel, A.; Kubovčíková, M.; Timko, M. Acoustic Wave in a Suspension of Magnetic Nanoparticle with Sodium Oleate Coating. J. Nanopart. Res. 2014, 16, 2271. [Google Scholar] [CrossRef]
- Maguire, C.M.; Rösslein, M.; Wick, P.; Prina-Mello, A. Characterisation of Particles in Solution—A Perspective on Light Scattering and Comparative Technologies. Sci. Technol. Adv. Mater. 2018, 19, 732–745. [Google Scholar] [CrossRef]
- Estelrich, J.; Sánchez-Martín, M.J.; Busquets, M.A. Nanoparticles in Magnetic Resonance Imaging: From Simple to Dual Contrast Agents. Int. J. Nanomed. 2015, 10, 1727–1741. [Google Scholar] [CrossRef]
- Wei, H.; Bruns, O.T.; Kaul, M.G.; Hansen, E.C.; Barch, M.; Wiśniowska, A.; Chen, O.; Chen, Y.; Li, N.; Okada, S.; et al. Exceedingly Small Iron Oxide Nanoparticles as Positive MRI Contrast Agents. Proc. Natl. Acad. Sci. USA 2017, 114, 2325–2330. [Google Scholar] [CrossRef]
- Sampath Kumar, T.S. Chapter 2—Physical and Chemical Characterization of Biomaterials. In Characterization of Biomaterials; Bandyopadhyay, A., Bose, S., Eds.; Academic Press: Oxford, UK, 2013; pp. 11–47. ISBN 9780124158009. [Google Scholar]
- Shen, W.-C.; Yang, D.; Ryser, H.J.-P. Colorimetric Determination of Microgram Quantities of Polylysine by Trypan Blue Precipitation. Anal. Biochem. 1984, 142, 521–524. [Google Scholar] [CrossRef]


| Sample | Initial Input NAC/MNPs | Experimental Output NAC/MNPs | DMAG | DTEM | DDLS | PDI | Zeta Potential | |
|---|---|---|---|---|---|---|---|---|
| SQUID | TGA | |||||||
| (mg/mg) | (mg/mg) | (mg/mg) | (nm) | (nm) | (nm) | (mV) | ||
| PLLMNPs | 0 | 0 | 0 | 10.1 ± 0.2 | 10.4 ± 0.1 | 112.2 ± 0.9 | 0.18 | 34 ± 1.6 |
| NAC-PLLMNPs-1 | 1 | 0.010 | 0.009 | 10.4 ± 0.2 | 10.8 ± 0.2 | 154.1 ± 1.1 | 0.22 | 32 ± 1.8 |
| NAC-PLLMNPs-3 | 3 | 0.028 | 0.035 | 10.0 ± 0.2 | 10.7 ± 0.2 | 238.0 ± 22.1 | 0.31 | 31 ± 1.3 |
| r1 (mM−1 s−1) | r2 (mM−1 s−1) | r2* (mM−1 s−1) | r2/r1 | r2*/r1 | B0 (T) | |
|---|---|---|---|---|---|---|
| PLLMNPs | 1.66 ± 0.07 | 406.80 ± 12.02 | 640.60 ± 14.64 | 245.06 | 385.90 | 7 |
| NAC-PLLMNPs-1 | 0.71 ± 0.08 | 134.80 ± 3.69 | 307.07 ± 11.16 | 189.86 | 432.49 | 7 |
Disclaimer/Publisher’s Note: The statements, opinions and data contained in all publications are solely those of the individual author(s) and contributor(s) and not of MDPI and/or the editor(s). MDPI and/or the editor(s) disclaim responsibility for any injury to people or property resulting from any ideas, methods, instructions or products referred to in the content. |
© 2023 by the authors. Licensee MDPI, Basel, Switzerland. This article is an open access article distributed under the terms and conditions of the Creative Commons Attribution (CC BY) license (https://creativecommons.org/licenses/by/4.0/).
Share and Cite
Kubovcikova, M.; Sobotova, R.; Zavisova, V.; Antal, I.; Khmara, I.; Lisnichuk, M.; Bednarikova, Z.; Jurikova, A.; Strbak, O.; Vojtova, J.; et al. N-Acetylcysteine-Loaded Magnetic Nanoparticles for Magnetic Resonance Imaging. Int. J. Mol. Sci. 2023, 24, 11414. https://doi.org/10.3390/ijms241411414
Kubovcikova M, Sobotova R, Zavisova V, Antal I, Khmara I, Lisnichuk M, Bednarikova Z, Jurikova A, Strbak O, Vojtova J, et al. N-Acetylcysteine-Loaded Magnetic Nanoparticles for Magnetic Resonance Imaging. International Journal of Molecular Sciences. 2023; 24(14):11414. https://doi.org/10.3390/ijms241411414
Chicago/Turabian StyleKubovcikova, Martina, Radka Sobotova, Vlasta Zavisova, Iryna Antal, Iryna Khmara, Maksym Lisnichuk, Zuzana Bednarikova, Alena Jurikova, Oliver Strbak, Jana Vojtova, and et al. 2023. "N-Acetylcysteine-Loaded Magnetic Nanoparticles for Magnetic Resonance Imaging" International Journal of Molecular Sciences 24, no. 14: 11414. https://doi.org/10.3390/ijms241411414
APA StyleKubovcikova, M., Sobotova, R., Zavisova, V., Antal, I., Khmara, I., Lisnichuk, M., Bednarikova, Z., Jurikova, A., Strbak, O., Vojtova, J., Mikolka, P., Gombos, J., Lokajova, A., Gazova, Z., & Koneracka, M. (2023). N-Acetylcysteine-Loaded Magnetic Nanoparticles for Magnetic Resonance Imaging. International Journal of Molecular Sciences, 24(14), 11414. https://doi.org/10.3390/ijms241411414