
Tumor-TME Bipartite Landscape of PD-1/PD-L1 in Endometrial Cancers

 , ,
, ,
Abstract
1. Introduction
2. Results
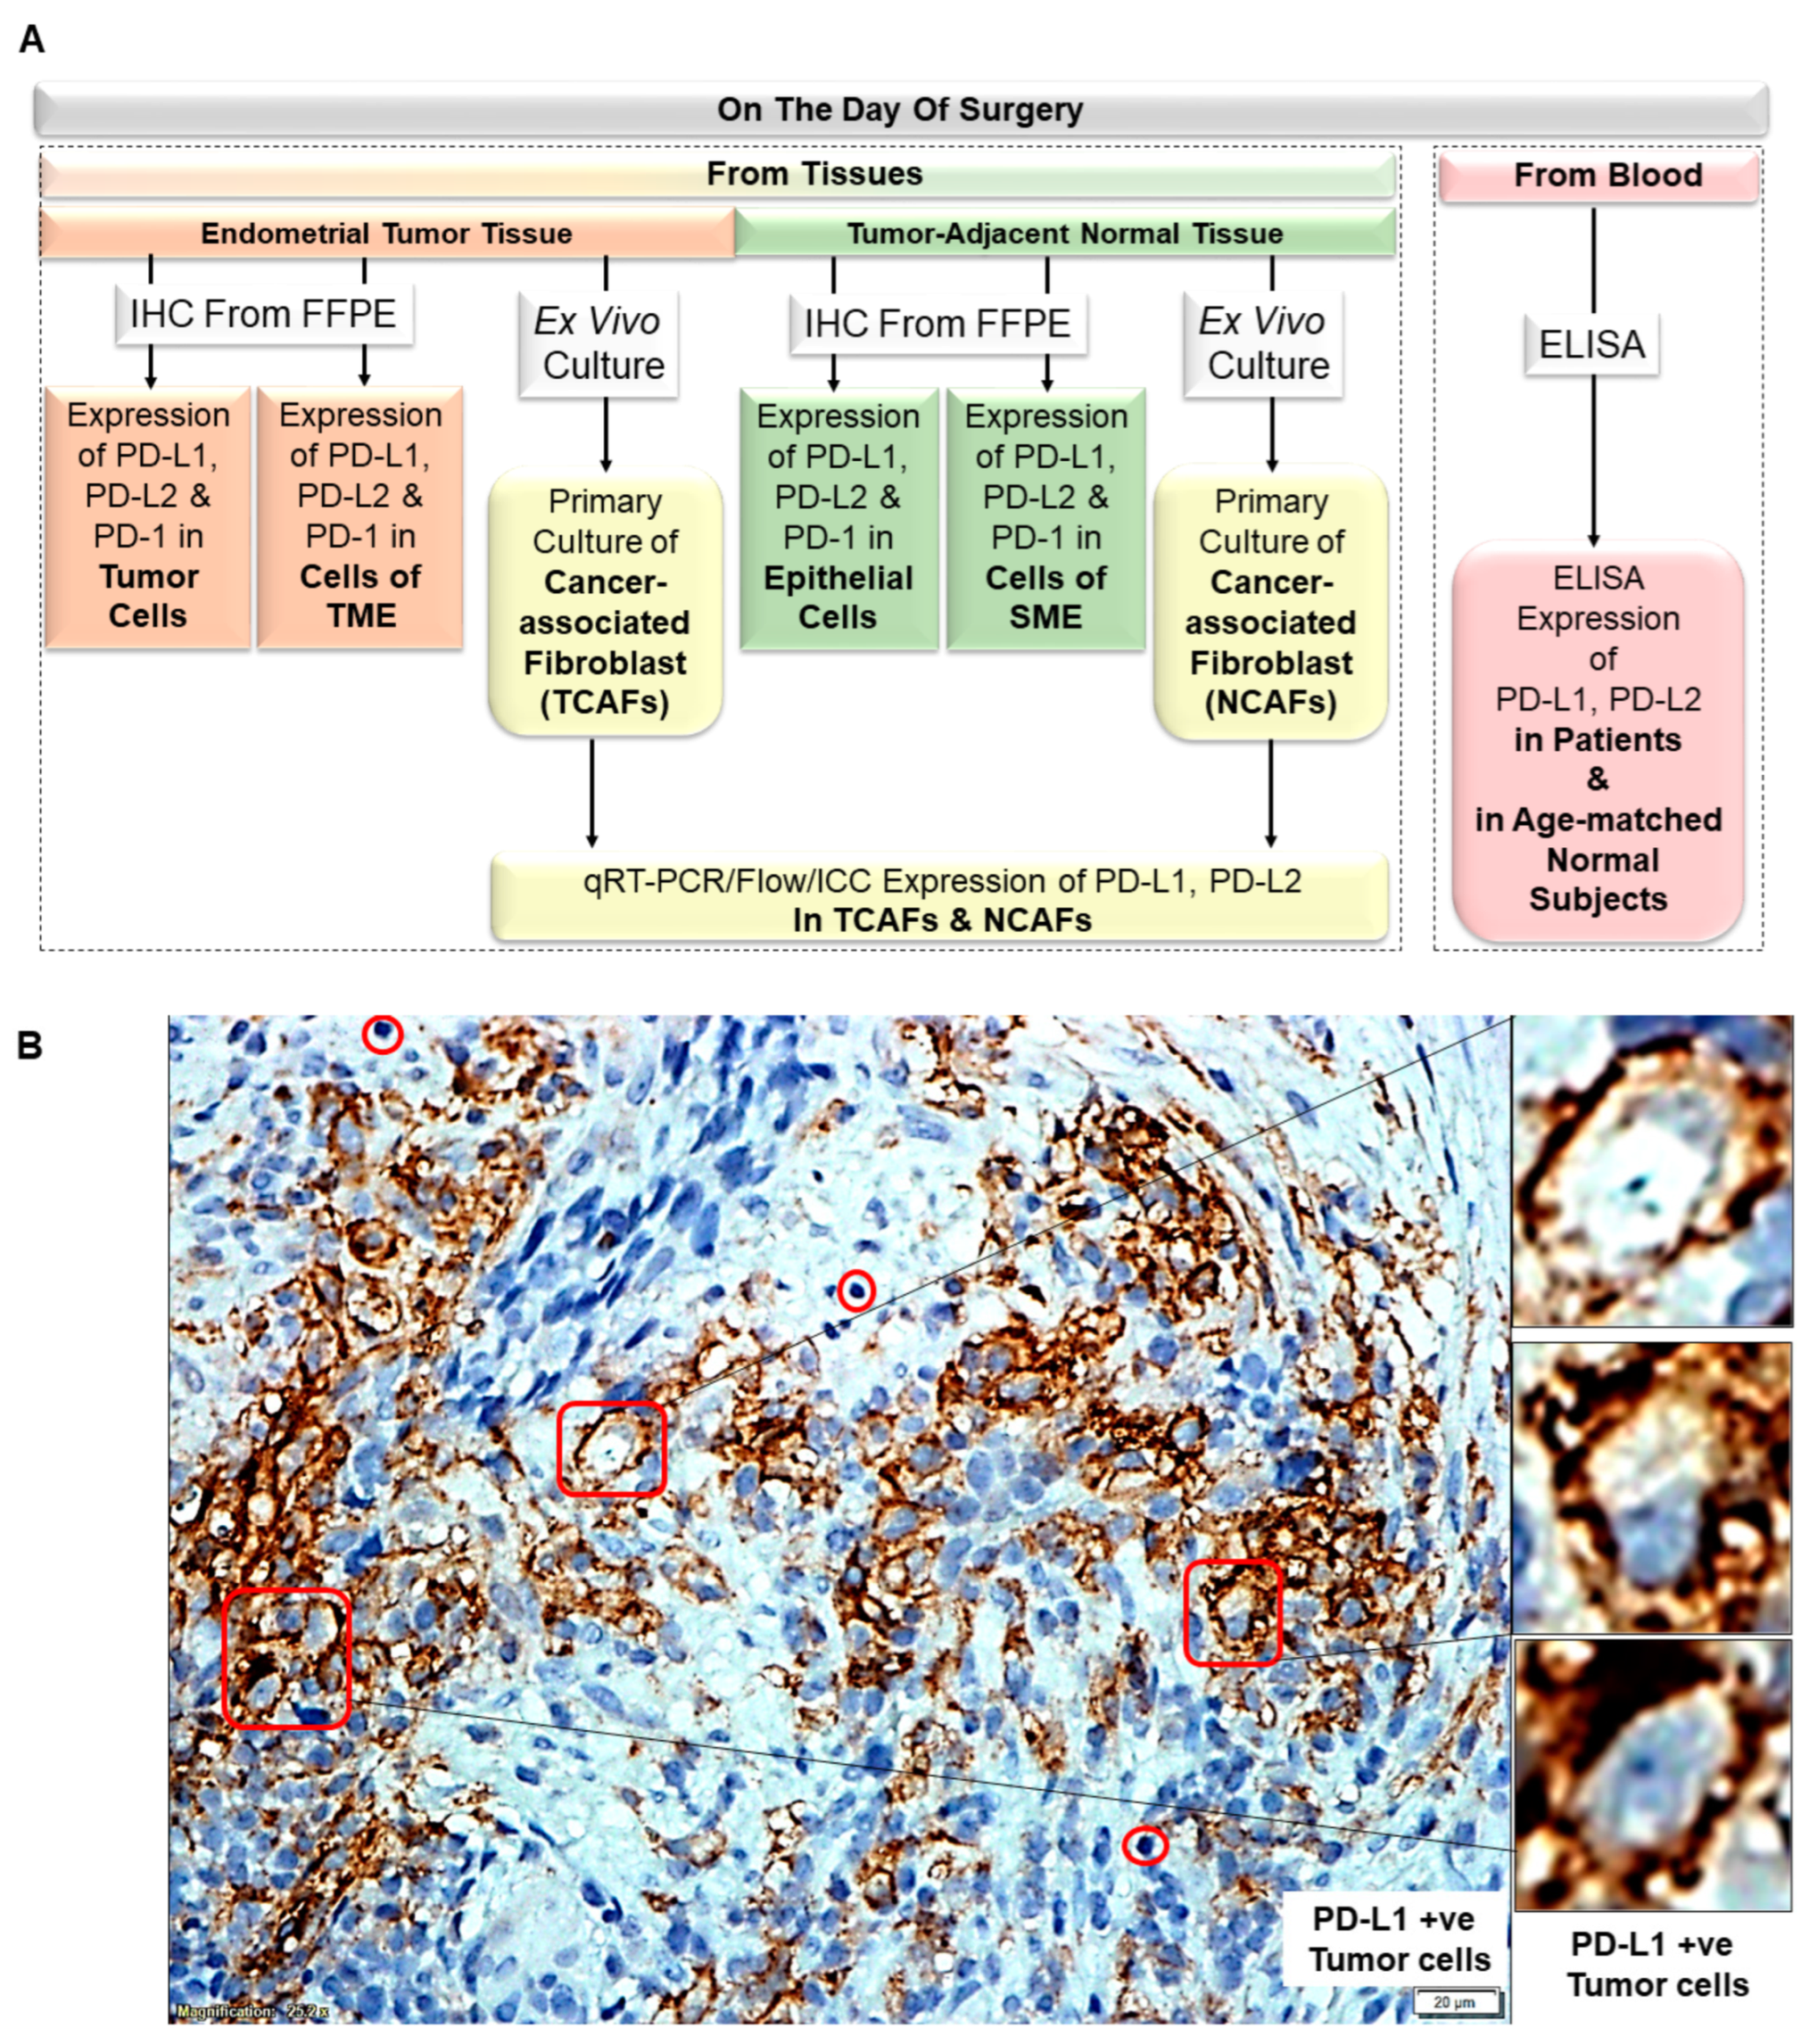
2.1. Plan of the Study
2.2. PD-L1/PD-L2 and PD-1 Protein Expression Dominated in Tumor Tissues as Compared to the Paired Samples of Tumor-Adjacent Normal Endometrial Tissues
2.3. PD-L1 Dominated TME Landscape in Endometrial Tumor Tissues
2.4. Establishment of Patient Tissue-Derived Primary Culture of CAF Ex Vivo
2.5. Marker-Based Validation of CAFs in Ex Vivo Culture of the Patient’s Tumor Tissue and Tumor-Adjacent Normal Tissue by Flowcytometry
2.6. Stromal PD-L1 and PD-L2 Expressions in Tumor (TCAF from TME) and Tumor-Adjacent Normal (NCAF from SME)
2.6.1. PD-L1/PD-L2 mRNA Expression Status in Cultured CAF from Paired Samples of Tumor and Tumor-Adjacent Normal Tissues by qRT-PCR
2.6.2. PD-L1 Protein Expression Status in Cultured CAF from Paired Samples of Tumor and Tumor-Adjacent Normal Tissues by Flow Cytometry
2.6.3. Cellular Distribution of PD-L1 Protein in Primary Cultured CAF from Paired Samples of Tumor and Tumor-Adjacent Normal Tissues by ICC Staining
2.7. Plasma sPD-L1 and sPD-L2 Protein Expression Status from Peripheral Blood Samples of Patients with EC by ELISA
2.8. Relationship between the Pathological Parameters and Tumor-TME Landscape of PD-L1/PD-L2 and PD-1 from Paired Samples of Tumor and Tumor-Adjacent Normal Tissues in EC
2.9. MMR Status of PD-L1+ Tumor Cells (by IHC) Versus PD-L1+ TCAFs in Patients with EC
3. Discussion
4. Methods and Materials
4.1. Patient Consent and Enrollment
4.2. Tissue and Blood Collection
4.3. IHC Expression of PD-L1, PD-L2, and PD-1 in FFPE Sections from Tumor and Tumor-Adjacent Normal Tissues
4.4. Primary Culture of Cancer-Associated Fibroblasts from Tumor and Tumor-Adjacent Normal Tissues
4.5. Flow Cytometric Expression of PD-L1 in Primary Culture of CAF from Tumor and Tumor-Adjacent Normal Tissues
4.6. Relative Gene Expression of PD-L1 and PD-L2 in Primary Culture of CAF from Tumor and Tumor-Adjacent Normal Tissues by qRT-PCR
- ○
- PD-L1 Forward: ACC TAC TGG CAT TTG CTG AAC G;
- ○
- PD-L1 Reverse: ATA GAC AAT TAG TGC AGC CAG GT;
- ○
- PD-L2 Forward: TGG AAT TGC AGC TTC ACC AGA;
- ○
- PD-L2 Reverse: TGG CTG TTA TTG CTC CAA GGT;
- ○
- GAPDH Forward: TGC ACC ACC AAC TGC TTA GC;
- ○
- GAPDH Reverse: GGC ATG GAC TGT GGT CAT GAG.
4.7. ICC Expression of SMA, S100A4, TE-7, EpCAM, CK 8, 18, and PD-L1 in Primary Culture of CAFs from Tumor and Tumor-Adjacent Normal Tissues
5. Patent Status
Supplementary Materials
Author Contributions
Funding
Institutional Review Board Statement
Informed Consent Statement
Data Availability Statement
Acknowledgments
Conflicts of Interest
References
- Obradovic, A. Precision immunotherapy. Science 2023, 379, 654–655. [Google Scholar] [CrossRef] [PubMed]
- Lau, J.; Cheung, J.; Navarro, A.; Lianoglou, S.; Haley, B.; Totpal, K.; Sanders, L.; Koeppen, H.; Caplazi, P.; McBride, J.; et al. Tumour and host cell PD-L1 is required to mediate suppression of anti-tumour immunity in mice. Nat. Commun. 2017, 8, 14572. [Google Scholar] [CrossRef] [PubMed]
- Juneja, V.R.; McGuire, K.A.; Manguso, R.T.; LaFleur, M.W.; Collins, N.; Haining, W.N.; Freeman, G.J.; Sharpe, A.H. PD-L1 on tumor cells is sufficient for immune evasion in immunogenic tumors and inhibits CD8 T cell cytotoxicity. J. Exp. Med. 2017, 214, 895–904. [Google Scholar] [CrossRef] [PubMed]
- Lin, H.; Wei, S.; Hurt, E.M.; Green, M.D.; Zhao, L.; Vatan, L.; Szeliga, W.; Herbst, R.; Harms, P.W.; Fecher, L.A.; et al. Host expression of PD-L1 determines efficacy of PD-L1 pathway blockade-mediated tumor regression. J. Clin. Investig. 2018, 128, 1708. [Google Scholar] [CrossRef]
- Tang, H.; Liang, Y.; Anders, R.A.; Taube, J.M.; Qiu, X.; Mulgaonkar, A.; Liu, X.; Harrington, S.M.; Guo, J.; Xin, Y.; et al. PD-L1 on host cells is essential for PD-L1 blockade-mediated tumor regression. J. Clin. Investig. 2018, 128, 580–588. [Google Scholar] [CrossRef]
- De, P.; Aske, J.; Dey, N. Cancer-Associated Fibroblast Functions as a Road-Block in Cancer Therapy. Cancers 2021, 13, 5246. [Google Scholar] [CrossRef]
- Biffi, G.; Tuveson, D.A. Diversity and Biology of Cancer-Associated Fibroblasts. Physiol. Rev. 2021, 101, 147–176. [Google Scholar] [CrossRef]
- Pradip, D.; Jennifer, A.; Nandini, D. Cancer-Associated Fibroblasts in Conversation with Tumor Cells in Endometrial Cancers: A Partner in Crime. Int. J. Mol. Sci. 2021, 22, 9121. [Google Scholar] [CrossRef]
- De, P.; Aske, J.; Sulaiman, R.; Dey, N. Bete Noire of Chemotherapy and Targeted Therapy: CAF-Mediated Resistance. Cancers 2022, 14, 1519. [Google Scholar] [CrossRef]
- Paver, E.C.; Cooper, W.A.; Colebatch, A.J.; Ferguson, P.M.; Hill, S.K.; Lum, T.; Shin, J.S.; O’Toole, S.; Anderson, L.; Scolyer, R.A.; et al. Programmed death ligand-1 (PD-L1) as a predictive marker for immunotherapy in solid tumours: A guide to immunohistochemistry implementation and interpretation. Pathology 2021, 53, 141–156. [Google Scholar] [CrossRef]
- Marin-Jimenez, J.A.; Garcia-Mulero, S.; Matias-Guiu, X.; Piulats, J.M. Facts and Hopes in Immunotherapy of Endometrial Cancer. Clin. Cancer Res. 2022, 28, 4849–4860. [Google Scholar] [CrossRef]
- Marabelle, A.; Le, D.T.; Ascierto, P.A.; Di Giacomo, A.M.; De Jesus-Acosta, A.; Delord, J.P.; Geva, R.; Gottfried, M.; Penel, N.; Hansen, A.R.; et al. Efficacy of Pembrolizumab in Patients with Noncolorectal High Microsatellite Instability/Mismatch Repair-Deficient Cancer: Results from the Phase II KEYNOTE-158 Study. J. Clin. Oncol. 2020, 38, 1–10. [Google Scholar] [CrossRef]
- Oaknin, A.; Tinker, A.V.; Gilbert, L.; Samouelian, V.; Mathews, C.; Brown, J.; Barretina-Ginesta, M.P.; Moreno, V.; Gravina, A.; Abdeddaim, C.; et al. Clinical Activity and Safety of the Anti-Programmed Death 1 Monoclonal Antibody Dostarlimab for Patients with Recurrent or Advanced Mismatch Repair-Deficient Endometrial Cancer: A Nonrandomized Phase 1 Clinical Trial. JAMA Oncol. 2020, 6, 1766–1772. [Google Scholar] [CrossRef]
- Pasanen, A.; Ahvenainen, T.; Pellinen, T.; Vahteristo, P.; Loukovaara, M.; Butzow, R. PD-L1 Expression in Endometrial Carcinoma Cells and Intratumoral Immune Cells: Differences Across Histologic and TCGA-based Molecular Subgroups. Am. J. Surg. Pathol. 2020, 44, 174–181. [Google Scholar] [CrossRef]
- Sulaiman, R.; De, P.; Aske, J.C.; Lin, X.; Dale, A.; Koirala, N.; Gaster, K.; Espaillat, L.R.; Starks, D.; Dey, N. Patient-Derived Primary Cancer-Associated Fibroblasts Mediate Resistance to Anti-Angiogenic Drug in Ovarian Cancers. Biomedicines 2023, 11, 112. [Google Scholar] [CrossRef]
- Chow, R.D.; Michaels, T.; Bellone, S.; Hartwich, T.M.P.; Bonazzoli, E.; Iwasaki, A.; Song, E.; Santin, A.D. Distinct Mechanisms of Mismatch-Repair Deficiency Delineate Two Modes of Response to Anti-PD-1 Immunotherapy in Endometrial Carcinoma. Cancer Discov. 2023, 13, 312–331. [Google Scholar] [CrossRef]
- Oaknin, A.; Gilbert, L.; Tinker, A.V.; Brown, J.; Mathews, C.; Press, J.; Sabatier, R.; O’Malley, D.M.; Samouelian, V.; Boni, V.; et al. Safety and antitumor activity of dostarlimab in patients with advanced or recurrent DNA mismatch repair deficient/microsatellite instability-high (dMMR/MSI-H) or proficient/stable (MMRp/MSS) endometrial cancer: Interim results from GARNET-a phase I, single-arm study. J. Immunother. Cancer 2022, 10, e003777. [Google Scholar] [CrossRef]
- Makker, V.; Taylor, M.H.; Aghajanian, C.; Oaknin, A.; Mier, J.; Cohn, A.L.; Romeo, M.; Bratos, R.; Brose, M.S.; DiSimone, C.; et al. Lenvatinib Plus Pembrolizumab in Patients with Advanced Endometrial Cancer. J. Clin. Oncol. 2020, 38, 2981–2992. [Google Scholar] [CrossRef]
- Wolfl, B.; Te Rietmole, H.; Salvioli, M.; Kaznatcheev, A.; Thuijsman, F.; Brown, J.S.; Burgering, B.; Stankova, K. The Contribution of Evolutionary Game Theory to Understanding and Treating Cancer. Dyn. Games Appl. 2022, 12, 313–342. [Google Scholar] [CrossRef]
- Kaznatcheev, A.; Peacock, J.; Basanta, D.; Marusyk, A.; Scott, J.G. Fibroblasts and alectinib switch the evolutionary games played by non-small cell lung cancer. Nat. Ecol. Evol. 2019, 3, 450–456. [Google Scholar] [CrossRef]
- Subramaniam, K.S.; Omar, I.S.; Kwong, S.C.; Mohamed, Z.; Woo, Y.L.; Mat Adenan, N.A.; Chung, I. Cancer-associated fibroblasts promote endometrial cancer growth via activation of interleukin-6/STAT-3/c-Myc pathway. Am. J. Cancer Res. 2016, 6, 200–213. [Google Scholar] [PubMed]
- Zhang, N.; Wang, Y.; Liu, H.; Shen, W. Extracellular vesicle encapsulated microRNA-320a inhibits endometrial cancer by suppression of the HIF1alpha/VEGFA axis. Exp. Cell Res. 2020, 394, 112113. [Google Scholar] [CrossRef] [PubMed]
- Fan, J.T.; Zhou, Z.Y.; Luo, Y.L.; Luo, Q.; Chen, S.B.; Zhao, J.C.; Chen, Q.R. Exosomal lncRNA NEAT1 from cancer-associated fibroblasts facilitates endometrial cancer progression via miR-26a/b-5p-mediated STAT3/YKL-40 signaling pathway. Neoplasia 2021, 23, 692–703. [Google Scholar] [CrossRef] [PubMed]
- Subramaniam, K.S.; Tham, S.T.; Mohamed, Z.; Woo, Y.L.; Mat Adenan, N.A.; Chung, I. Cancer-associated fibroblasts promote proliferation of endometrial cancer cells. PLoS ONE 2013, 8, e68923. [Google Scholar] [CrossRef] [PubMed]
- Zhang, S.; Minaguchi, T.; Xu, C.; Qi, N.; Itagaki, H.; Shikama, A.; Tasaka, N.; Akiyama, A.; Sakurai, M.; Ochi, H.; et al. PD-L1 and CD4 are independent prognostic factors for overall survival in endometrial carcinomas. BMC Cancer 2020, 20, 127. [Google Scholar] [CrossRef]
- Post, C.C.B.; Westermann, A.M.; Bosse, T.; Creutzberg, C.L.; Kroep, J.R. PARP and PD-1/PD-L1 checkpoint inhibition in recurrent or metastatic endometrial cancer. Crit. Rev. Oncol. Hematol. 2020, 152, 102973. [Google Scholar] [CrossRef]
- Jenkins, T.M.; Cantrell, L.A.; Stoler, M.H.; Mills, A.M. PD-L1 and Mismatch Repair Status in Uterine Carcinosarcomas. Int. J. Gynecol. Pathol. 2021, 40, 563–574. [Google Scholar] [CrossRef]
- Makker, V.; Rasco, D.; Vogelzang, N.J.; Brose, M.S.; Cohn, A.L.; Mier, J.; Di Simone, C.; Hyman, D.M.; Stepan, D.E.; Dutcus, C.E.; et al. Lenvatinib plus pembrolizumab in patients with advanced endometrial cancer: An interim analysis of a multicentre, open-label, single-arm, phase 2 trial. Lancet Oncol. 2019, 20, 711–718. [Google Scholar] [CrossRef]
- Zhang, T.; Liu, Q.; Zhu, Y.; Zhang, S.; Peng, Q.; Strickland, A.L.; Zheng, W.; Zhou, F. PD-L1 Expression in Endometrial Serous Carcinoma and Its Prognostic Significance. Cancer Manag. Res. 2021, 13, 9157–9165. [Google Scholar] [CrossRef]
- Mao, X.; Xu, J.; Wang, W.; Liang, C.; Hua, J.; Liu, J.; Zhang, B.; Meng, Q.; Yu, X.; Shi, S. Crosstalk between cancer-associated fibroblasts and immune cells in the tumor microenvironment: New findings and future perspectives. Mol. Cancer 2021, 20, 131. [Google Scholar] [CrossRef]
- Dou, D.; Ren, X.; Han, M.; Xu, X.; Ge, X.; Gu, Y.; Wang, X. Cancer-Associated Fibroblasts-Derived Exosomes Suppress Immune Cell Function in Breast Cancer via the miR-92/PD-L1 Pathway. Front. Immunol. 2020, 11, 2026. [Google Scholar] [CrossRef]
- Kim, D.K.; Jeong, J.; Lee, D.S.; Hyeon, D.Y.; Park, G.W.; Jeon, S.; Lee, K.B.; Jang, J.Y.; Hwang, D.; Kim, H.M.; et al. PD-L1-directed PlGF/VEGF blockade synergizes with chemotherapy by targeting CD141(+) cancer-associated fibroblasts in pancreatic cancer. Nat. Commun. 2022, 13, 6292. [Google Scholar] [CrossRef]
- Tan, Y.N.; Huang, J.D.; Li, Y.P.; Li, S.S.; Luo, M.; Luo, J.; Lee, A.W.; Fu, L.; Hu, F.Q.; Guan, X.Y. Near-Infrared Responsive Membrane Nanovesicles Amplify Homologous Targeting Delivery of Anti-PD Immunotherapy against Metastatic Tumors. Adv. Healthc. Mater. 2022, 11, e2101496. [Google Scholar] [CrossRef]
- Dezutter-Dambuyant, C.; Durand, I.; Alberti, L.; Bendriss-Vermare, N.; Valladeau-Guilemond, J.; Duc, A.; Magron, A.; Morel, A.P.; Sisirak, V.; Rodriguez, C.; et al. A novel regulation of PD-1 ligands on mesenchymal stromal cells through MMP-mediated proteolytic cleavage. Oncoimmunology 2016, 5, e1091146. [Google Scholar] [CrossRef]
- Rowe, M.; Krishnan, R.; Mills, A.; Ring, K. beta-catenin and PD-L1 expression in mismatch repair deficient endometrial carcinomas. Int. J. Gynecol. Cancer 2020, 30, 993–999. [Google Scholar] [CrossRef]
- Sloan, E.A.; Ring, K.L.; Willis, B.C.; Modesitt, S.C.; Mills, A.M. PD-L1 Expression in Mismatch Repair-deficient Endometrial Carcinomas, Including Lynch Syndrome-associated and MLH1 Promoter Hypermethylated Tumors. Am. J. Surg. Pathol. 2017, 41, 326–333. [Google Scholar] [CrossRef]
- Kir, G.; Soylemez, T.; Olgun, Z.C.; Aydin, A.; McCluggage, W.G. Correlation of PD-L1 expression with immunohistochemically determined molecular profile in endometrial carcinomas. Virchows Arch. 2020, 477, 845–856. [Google Scholar] [CrossRef]


| PD-L1 | ||||
| T-test: Type 2, and Two Tail; n = 26 patients in each group | Difference in PD-L1 expression: Epithelium vs. SME | Difference in PD-L1 expression: Tumor vs. TME | Difference in PD-L1 expression: Epithelium vs. Tumor | Difference in PD-L1 expression: TME vs. SME |
| p Value | p = 0.0496 | p = 0.936 | p = 0.00015 | p = 0.00000027 |
| PD-L2 | ||||
| T-test: Type 2, and Two Tail; n = 26 patients in each group | Difference in PD-L2 expression: Epithelium vs. SME | Difference in PD-L2 expression: Tumor vs. TME | Difference in PD-L2 expression: Epithelium vs. Tumor | Difference in PD-L2 expression: TME vs. SME |
| p Value | p = 0.82 | p = 0.5971 | p = 0.0110 | p = 0.0000069 |
| PD-1 | ||||
| T-test: Type 2, and Two Tail; n = 26 patients in each group | Difference in PD-1 expression: Epithelium vs. SME | Difference in PD-1 expression: Tumor vs. TME | Difference in PD-1 expression: Epithelium vs. Tumor | Difference in PD-1 expression: TME vs. SME |
| p Value | p = 0.261 | p = 0.003045 | p = 0.03486 | p = 0.0023 |
| Proteins | Correlation between Expression(s) of PD-L1, PD-L2 and PD-1: Grade 3 vs. Grade 1 | |||||
| PD-L1 | PD-L2 | PD-1 | ||||
| Expression Site of the Proteins | Expression in Tumor Cells | Expression in TME/ Tumor Stroma (Lymphocyte/Macrophage/Blood Vessel) | Expression in Tumor Cells | Expression in TME/ Tumor Stroma (Lymphocyte/Macrophage/Blood Vessel) | Expression in Tumor Cells | Expression in TME/ Tumor Stroma (Lymphocyte/Macrophage/Blood Vessel) |
| r | 0.3964 | 0.4745 | 0.4294 | 0.3961 | −0.19 | 0.444 |
| R2 | 0.1571 | 0.2252 | 0.1844 | 0.1569 | 0.03609 | 0.1971 |
| p (Two-tailed test) | 0.1034 | 0.0466 | 0.0753 | 0.1037 | 0.4502 | 0.0649 |
| Significant (alpha = 0.05) | Not Significant | Significant | Not Significant | Not Significant | Not Significant | Not Significant |
| # of Pairs | 18 | 18 | 18 | 18 | 18 | 18 |
| Proteins | Correlation between expression(s) of PD-L1, PD-L2 and PD-1: Grade 2 vs. Grade 1 | |||||
| PD-L1 | PD-L2 | PD-1 | ||||
| Expression site of the proteins | Expression in Tumor Cells | Expression in TME/ Tumor Stroma (Lymphocyte/Macrophage/Blood Vessel) | Expression in Tumor Cells | Expression in TME/ Tumor Stroma (Lymphocyte/Macrophage/Blood Vessel) | Expression in Tumor Cells | Expression in TME/ Tumor Stroma (Lymphocyte/Macrophage/Blood Vessel) |
| r | 0.3141 | 0.2148 | −0.1605 | 0.077 | −0.0548 | 0.503 |
| R2 | 0.0987 | 0.0461 | 0.0258 | 0.0059 | 0.003 | 0.253 |
| p (Two-tailed) | 0.2195 | 0.4077 | 0.5383 | 0.7689 | 0.8344 | 0.0396 |
| Significant (alpha = 0.05) | Not Significant | Not Significant | Not Significant | Not Significant | Not Significant | Significant |
| # Pairs | 17 | 17 | 17 | 17 | 17 | 17 |
| Proteins | Correlation between “Tumor + TME Combined Scores” for PD-L1, PD-L2 and PD-1: Tumor Grades 1, 2 and 3 | |||||
| PD-L1 | PD-L2 | PD-1 | ||||
| Expression site of the proteins | Expression in Tumor Cells and Cells of TME | Expression in Tumor Cells and Cells of TME | Expression in Tumor Cells and Cells of TME | |||
| r | 0.4609 | 0.4573 | 0.2918 | |||
| R2 | 0.2124 | 0.2091 | 0.08513 | |||
| p (Two-tailed test) | 0.0178 | 0.0188 | 0.1481 | |||
| Significant (alpha = 0.05) | Significant | Significant | Not Significant | |||
| # Pairs | 26 | 26 | 26 | |||
| Site | Correlations | R-Value | R2 Value | p Value | Significance | # of Patients (N) |
|---|---|---|---|---|---|---|
| TUMOR | Tumor PD-L1 by IHC vs. Percentage of Myometrial Invasion | 0.2085 | 0.04345 | 0.3068 | Not Significant | 26 |
| TME | TME PD-L1 by IHC vs. Percentage of Myometrial Invasion | 0.4524 | 0.2047 | 0.0203 | Significant | 26 |
| TUMOR + TME | Tumor + TME combined PD-L1 by IHC vs. Percentage of Myometrial Invasion | 0.3688 | 0.1360 | 0.0637 | Not Significant | 26 |
| Tumor + TME combined PD-L1 by IHC Cutoff = 15 vs. Percentage of Myometrial Invasion | 0.3665 | 0.1343 | 0.0656 | Not Significant | 26 | |
| TUMOR | Tumor PD-L1 by IHC vs. Presence of TILs | 0.1560 | 0.02433 | 0.4467 | Not Significant | 26 |
| TME | TME PD-L1 by IHC vs. Presence of TILs | 0.4901 | 0.2402 | 0.0110 | Significant | 26 |
| TUMOR + TME | Tumor + TME combined PD-L1 by IHC vs. Presence of TILs | 0.3480 | 0.1211 | 0.0815 | Not Significant | 26 |
| Tumor + TME combined PD-L1 by IHC Cutoff = 15 vs. Presence of TILs | 0.4501 | 0.2025 | 0.0211 | Significant | 26 |
| Figure # | Sub-Figure | Data Presented | Summary of Data |
|---|---|---|---|
| 1 | A | Overall Plan of the Study | Data generated from patients’ tumor tissue, tumor-adjacent normal tissue, and blood |
| B | PD-L1 status of tumor cells | PD-L1 +ve Tumor cells | |
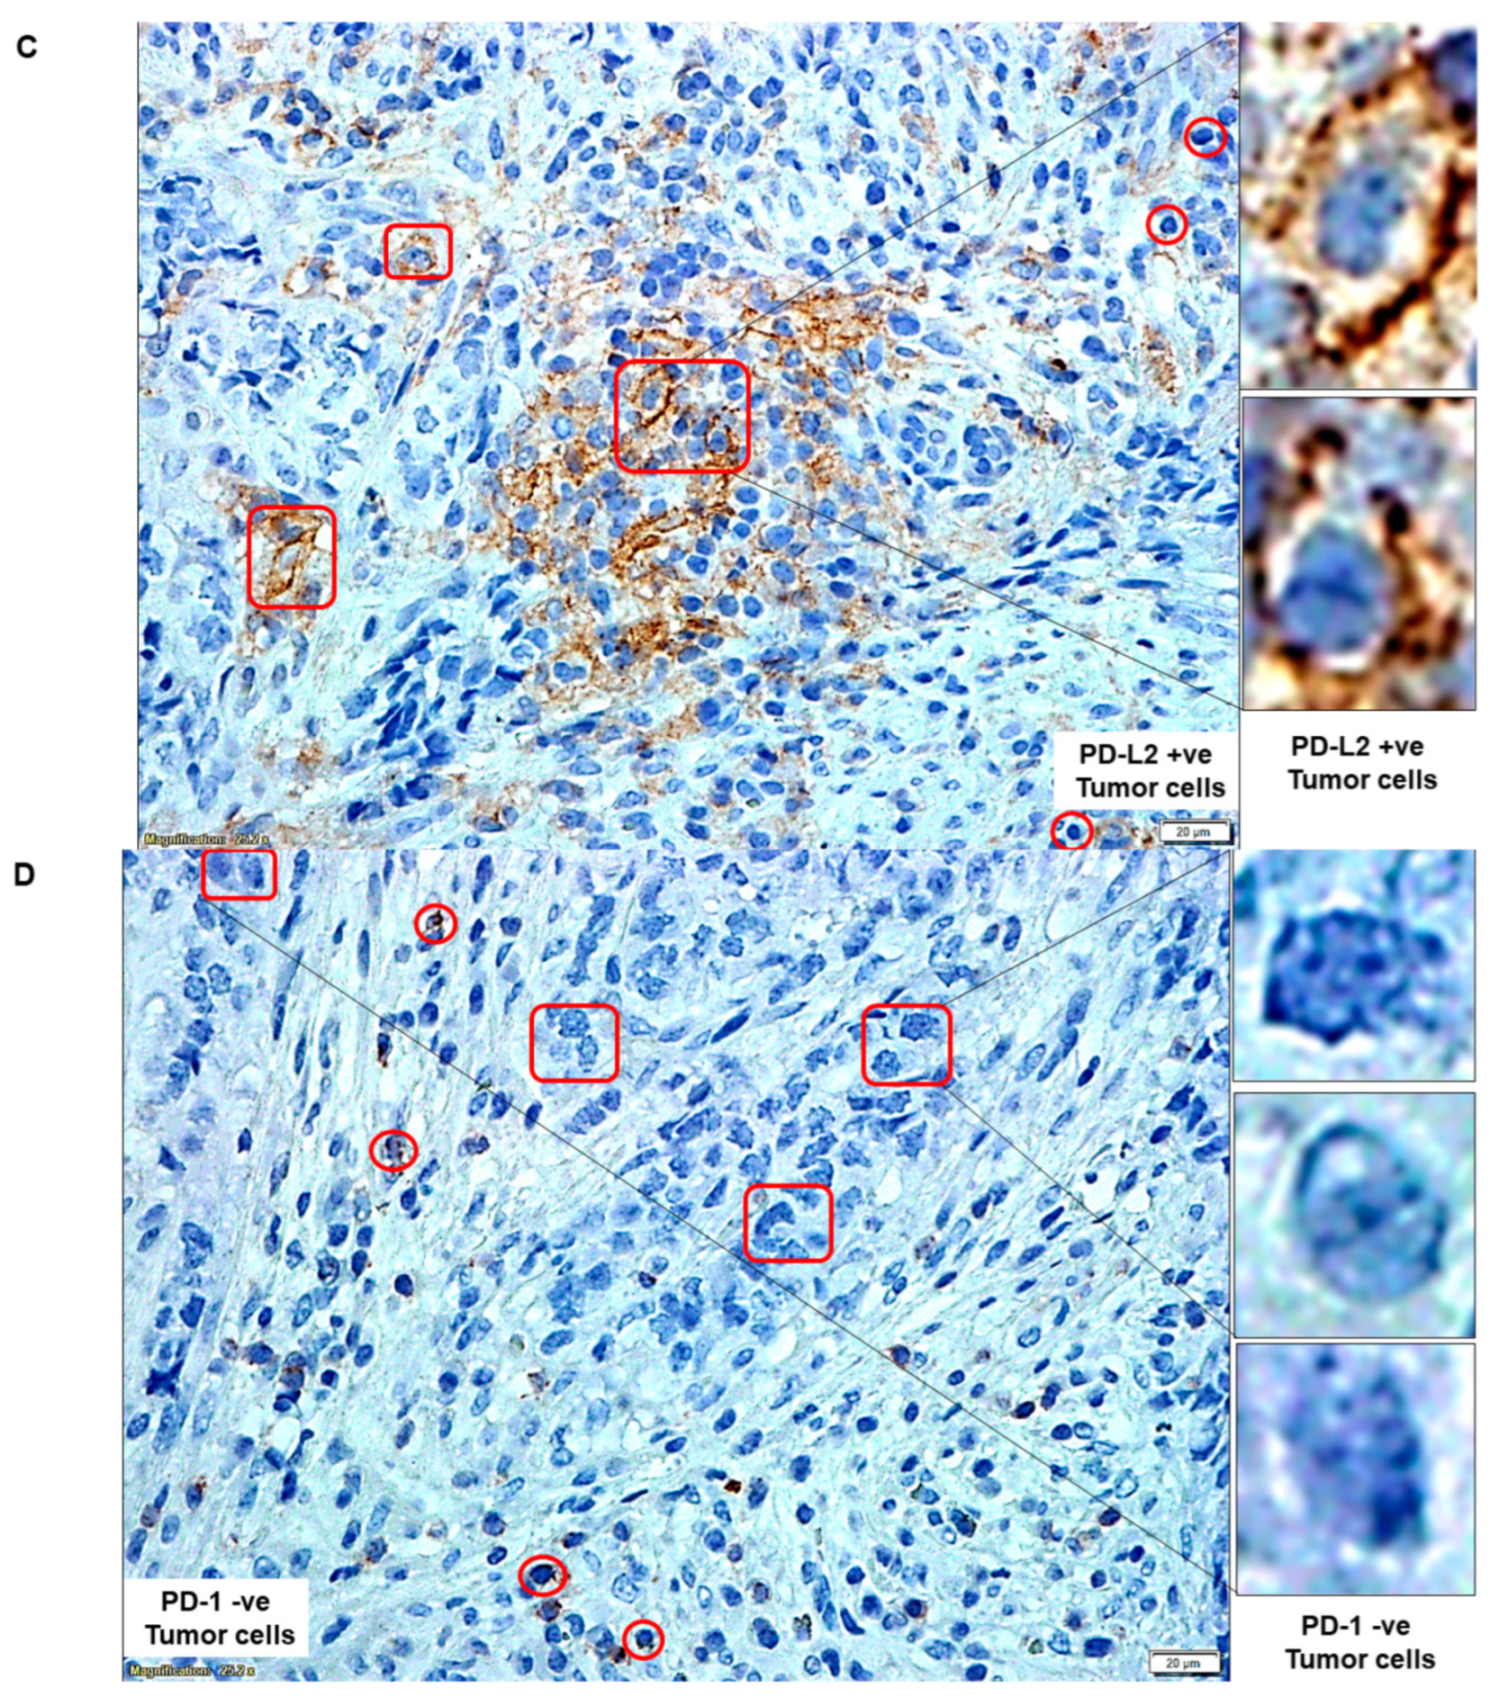
| C | PD-L2 status of tumor cells | PD-L2 +ve Tumor cells | |
| D | PD-1 status of tumor cells | PD-1 −ve Tumor cells | |
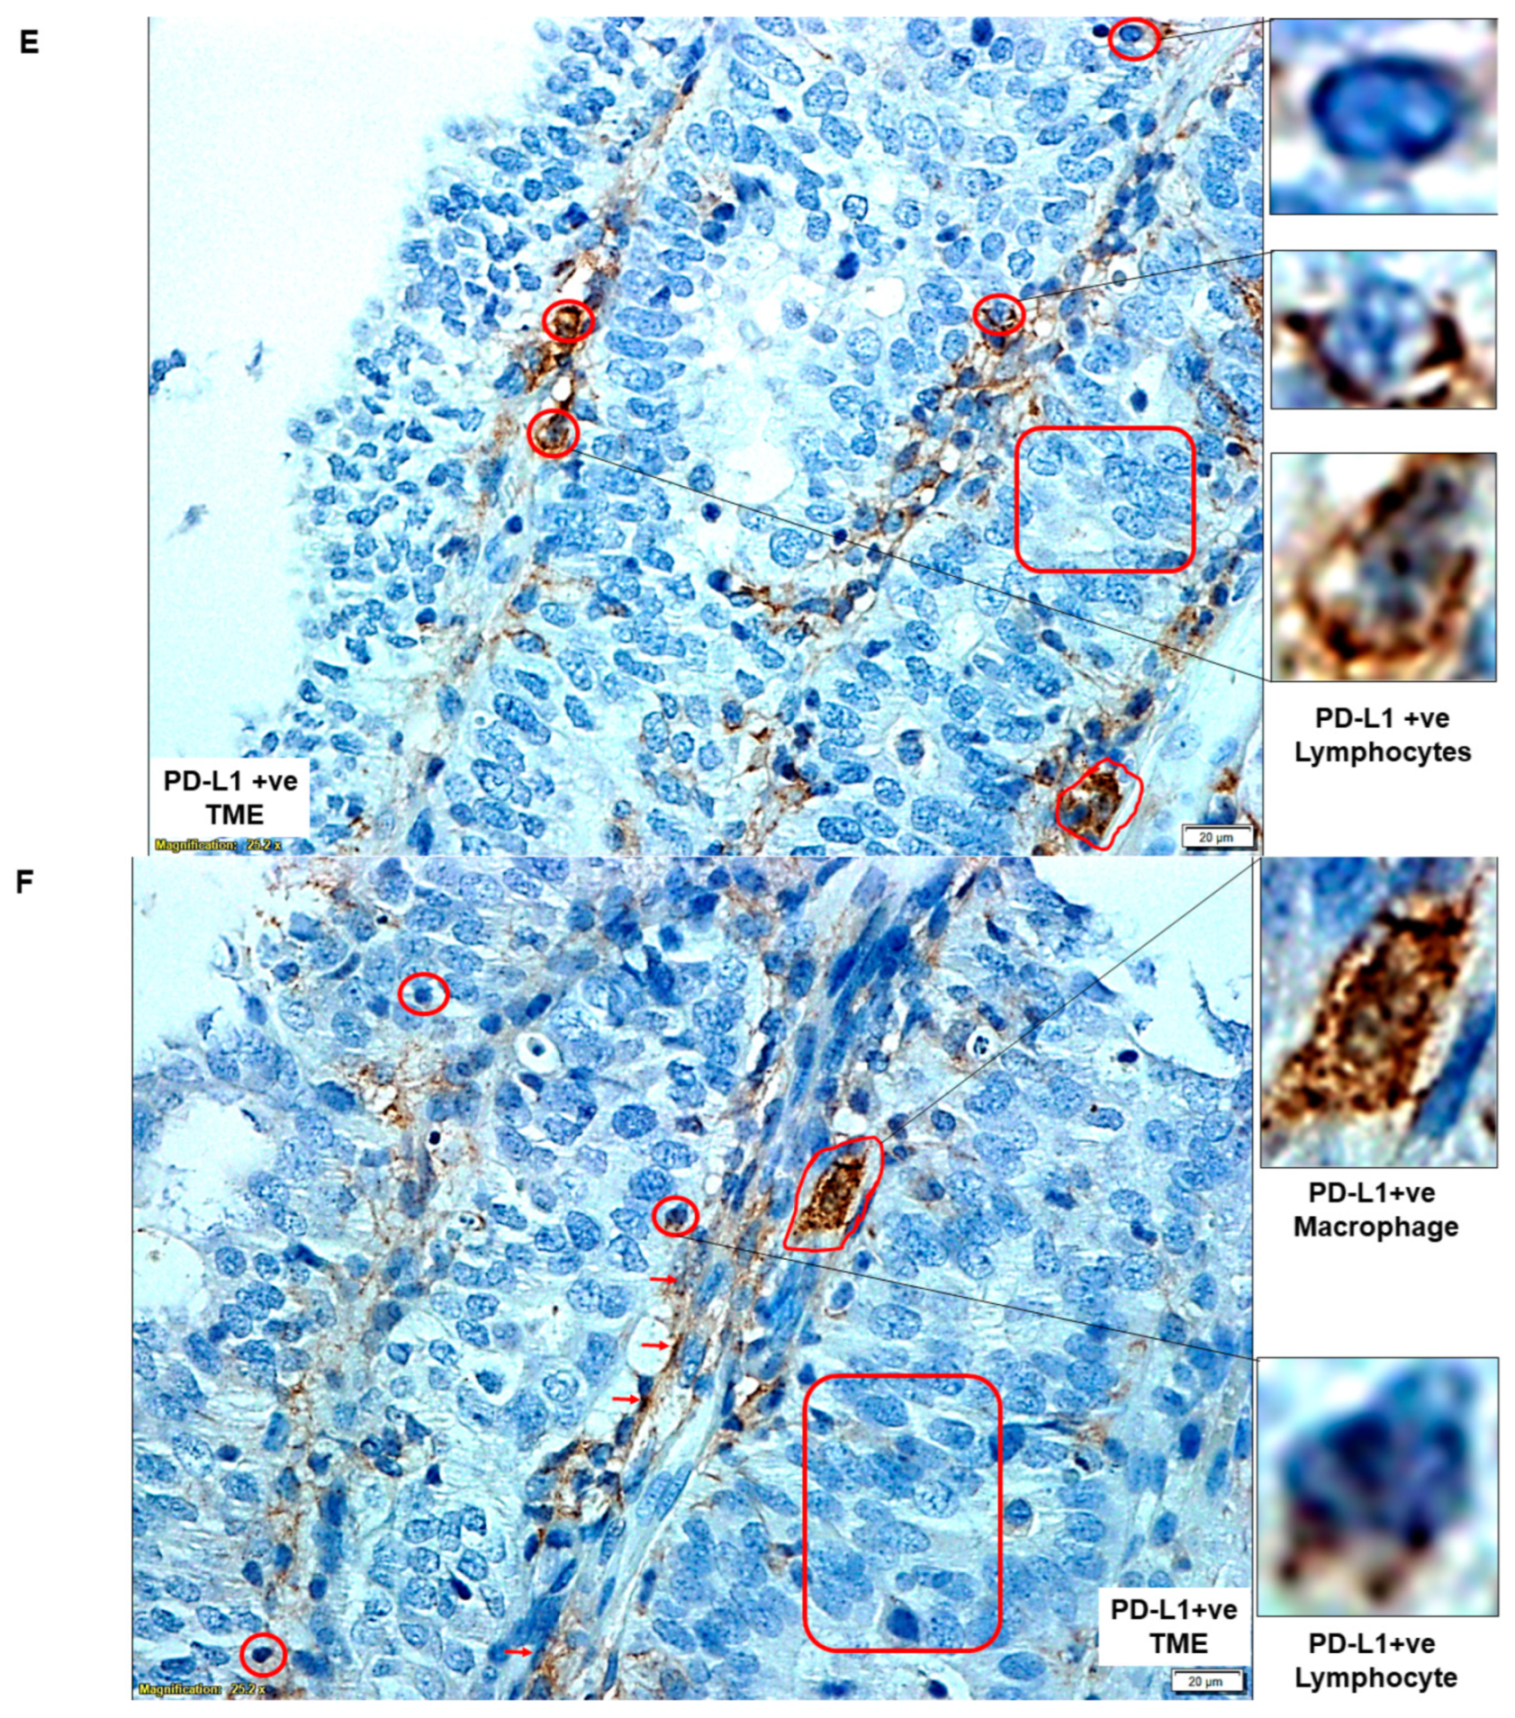
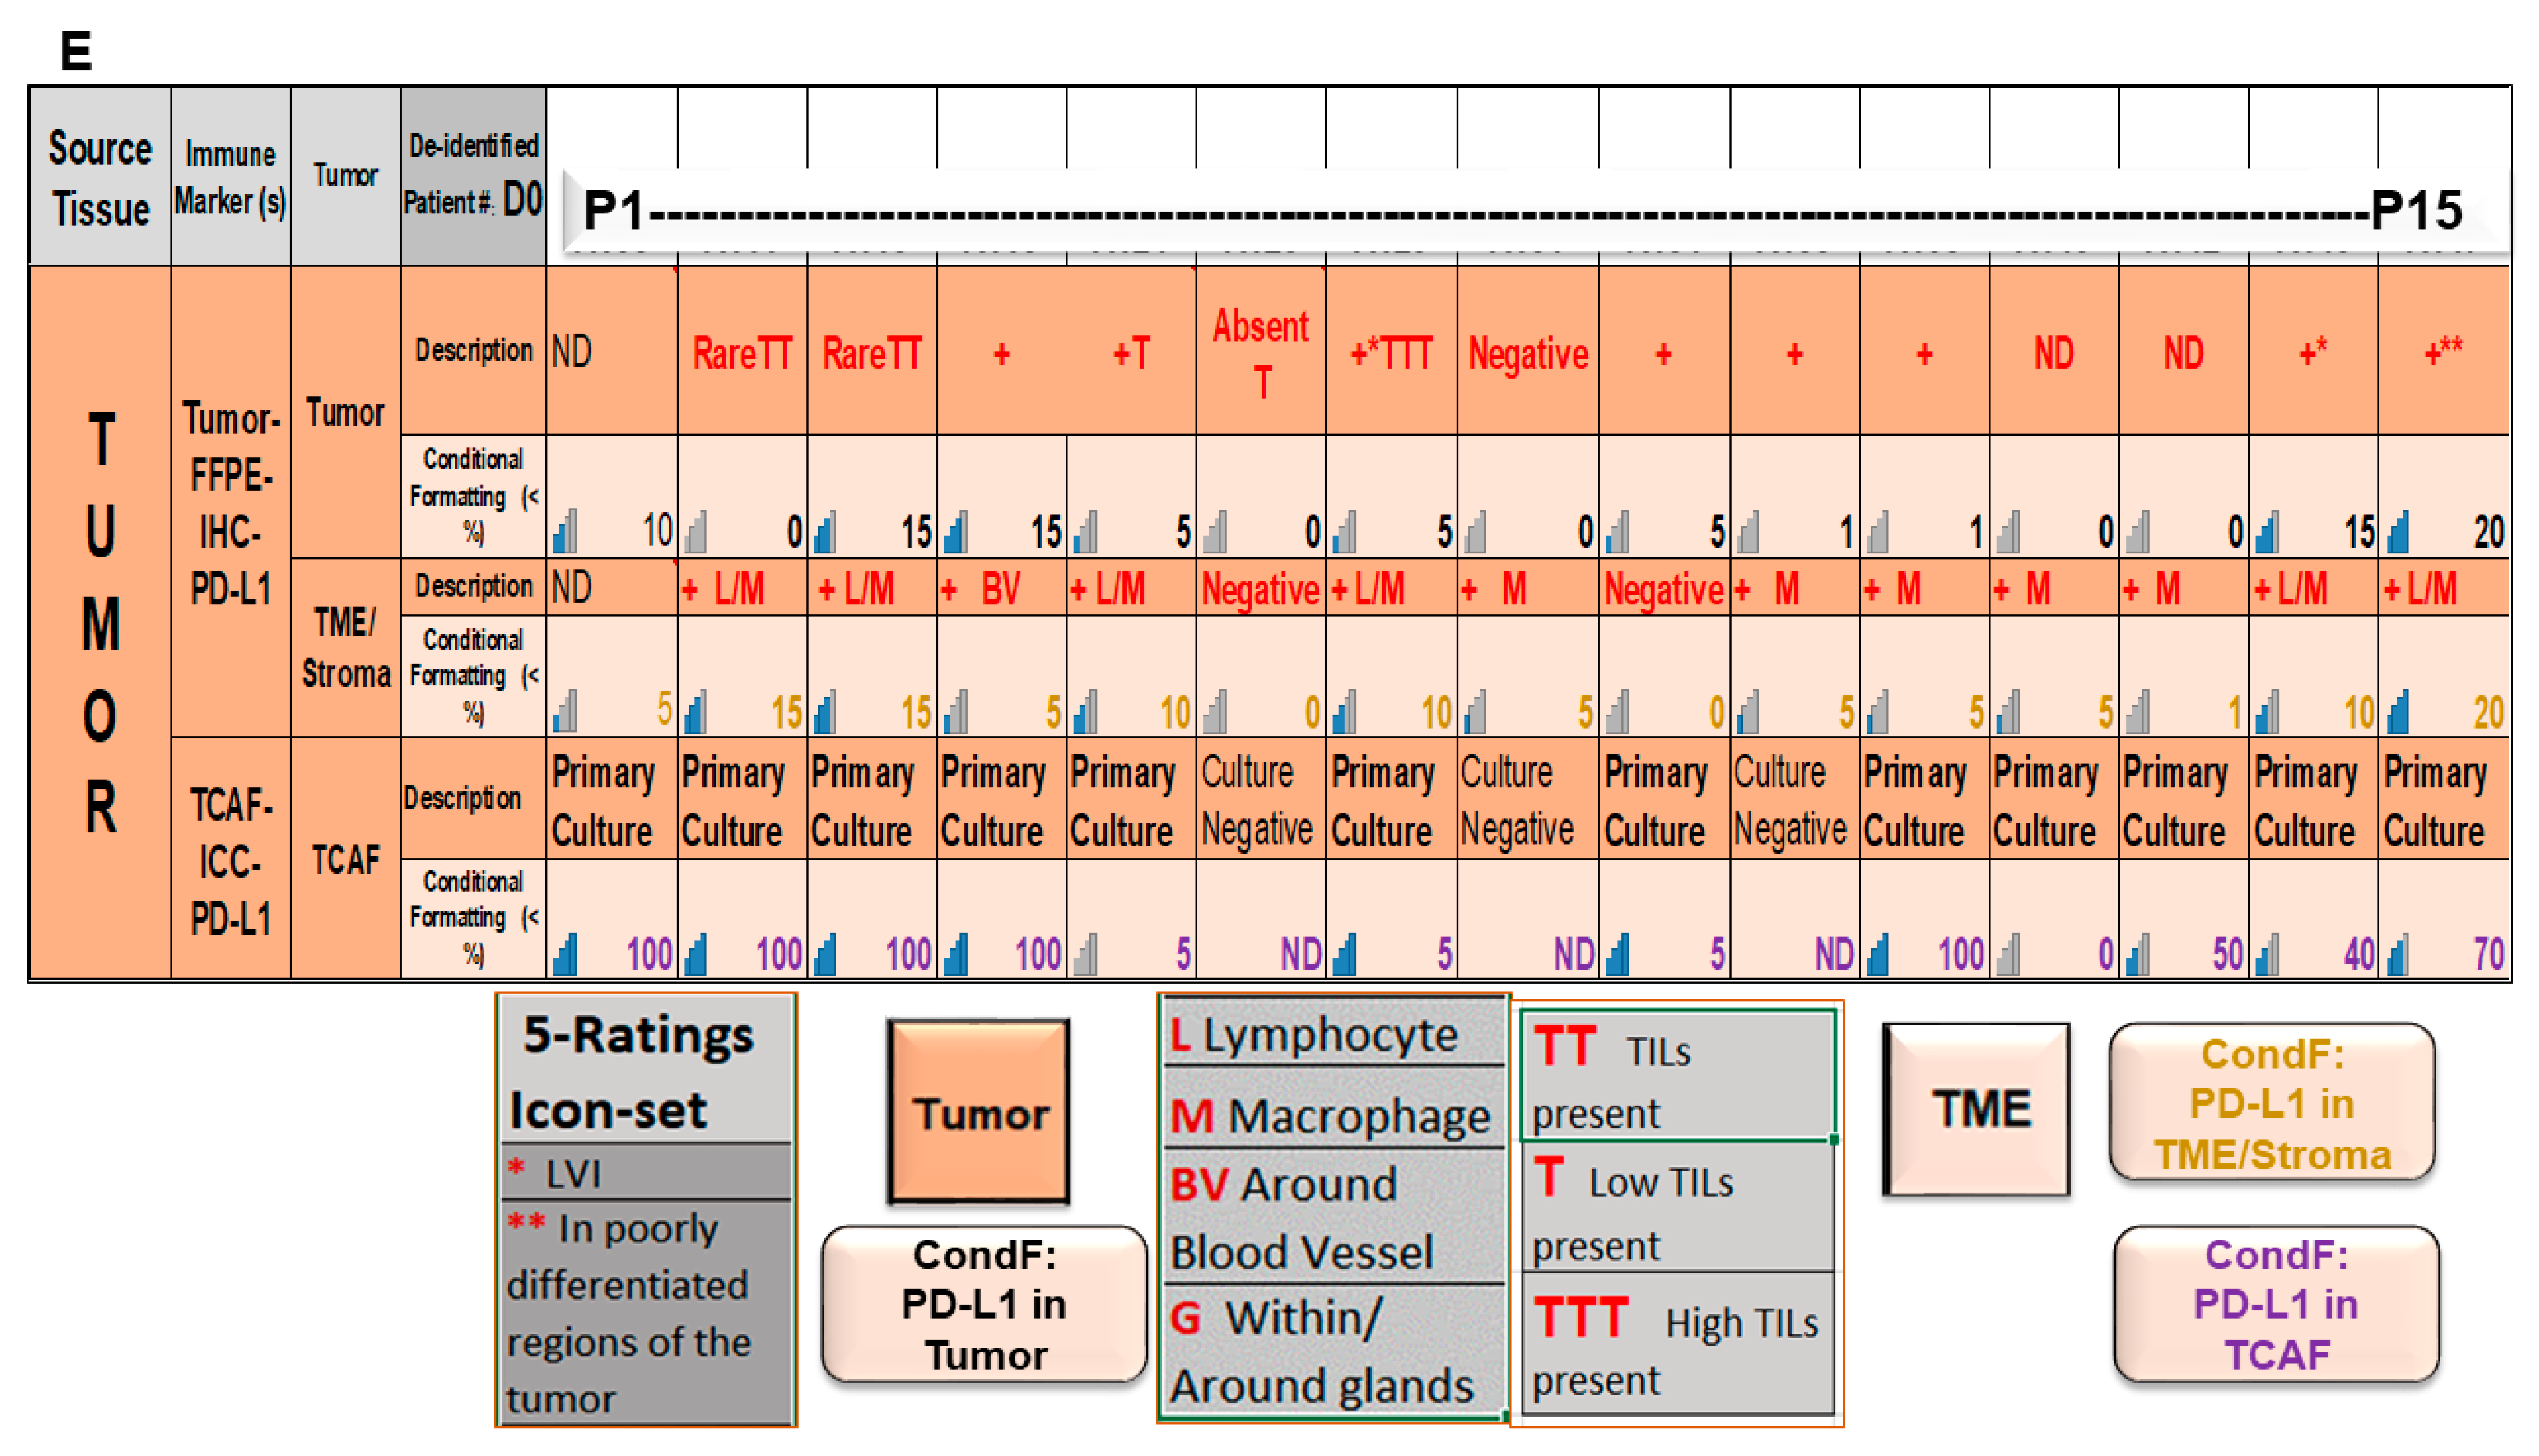
| E | PD-L1 status of cells of TME | PD-L1 +ve Lymphocytes | |
| F | PD-L1 status of cells of TME | PD-L1 +ve Macrophage | |
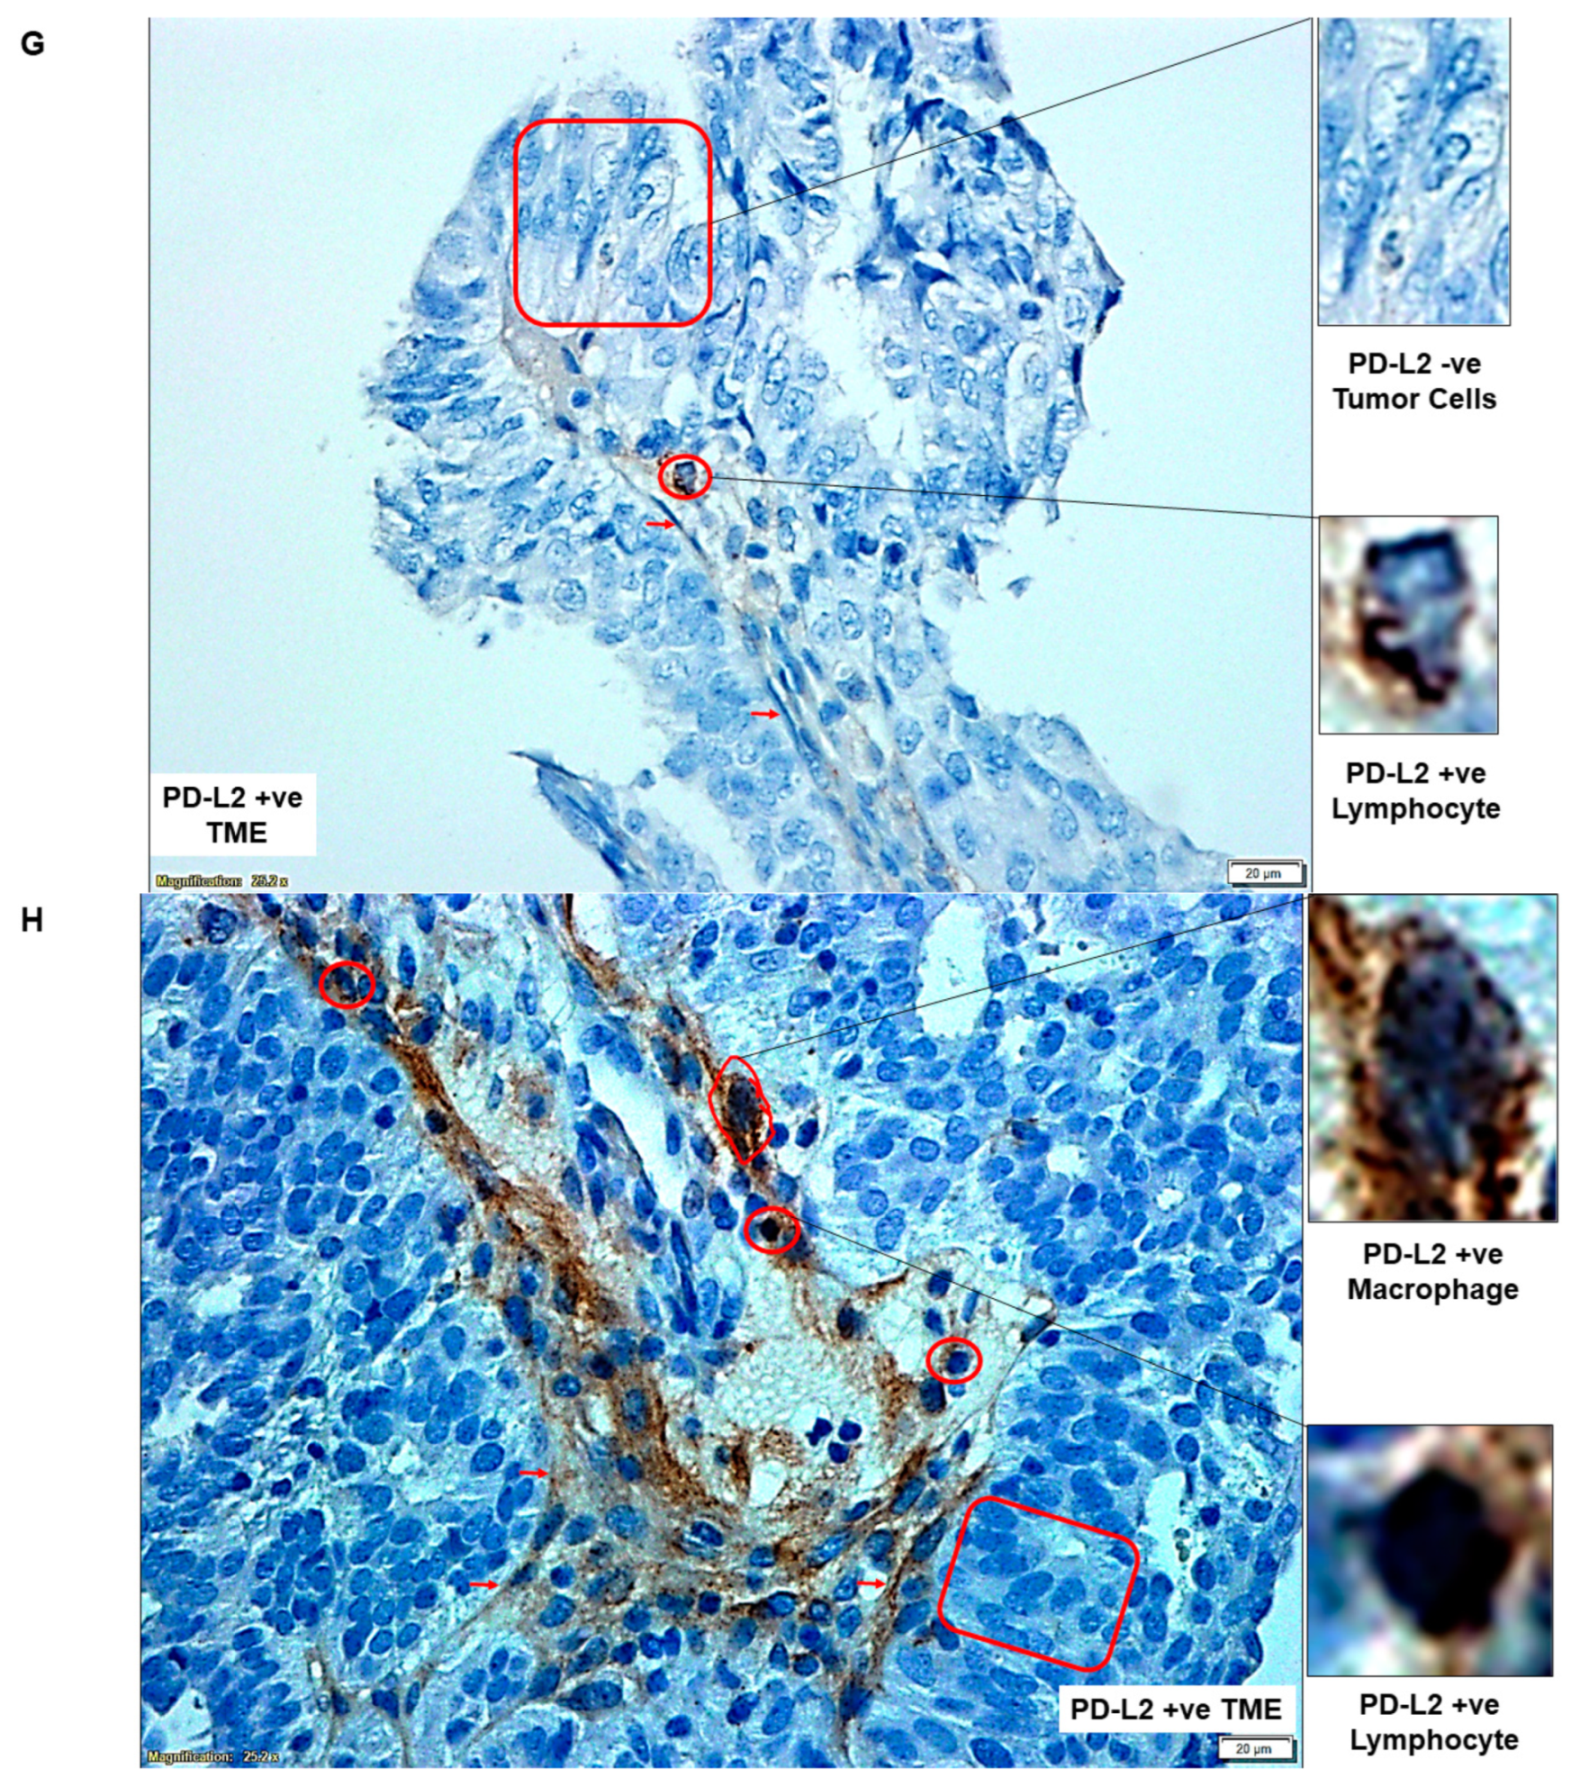
| G | PD-L2 status of cells of TME | PD-L2 −ve Tumor Cells and Lymphocyte | |
| H | PD-L2 status of cells of TME | PD-L2 +ve Macrophage and Lymphocyte | |
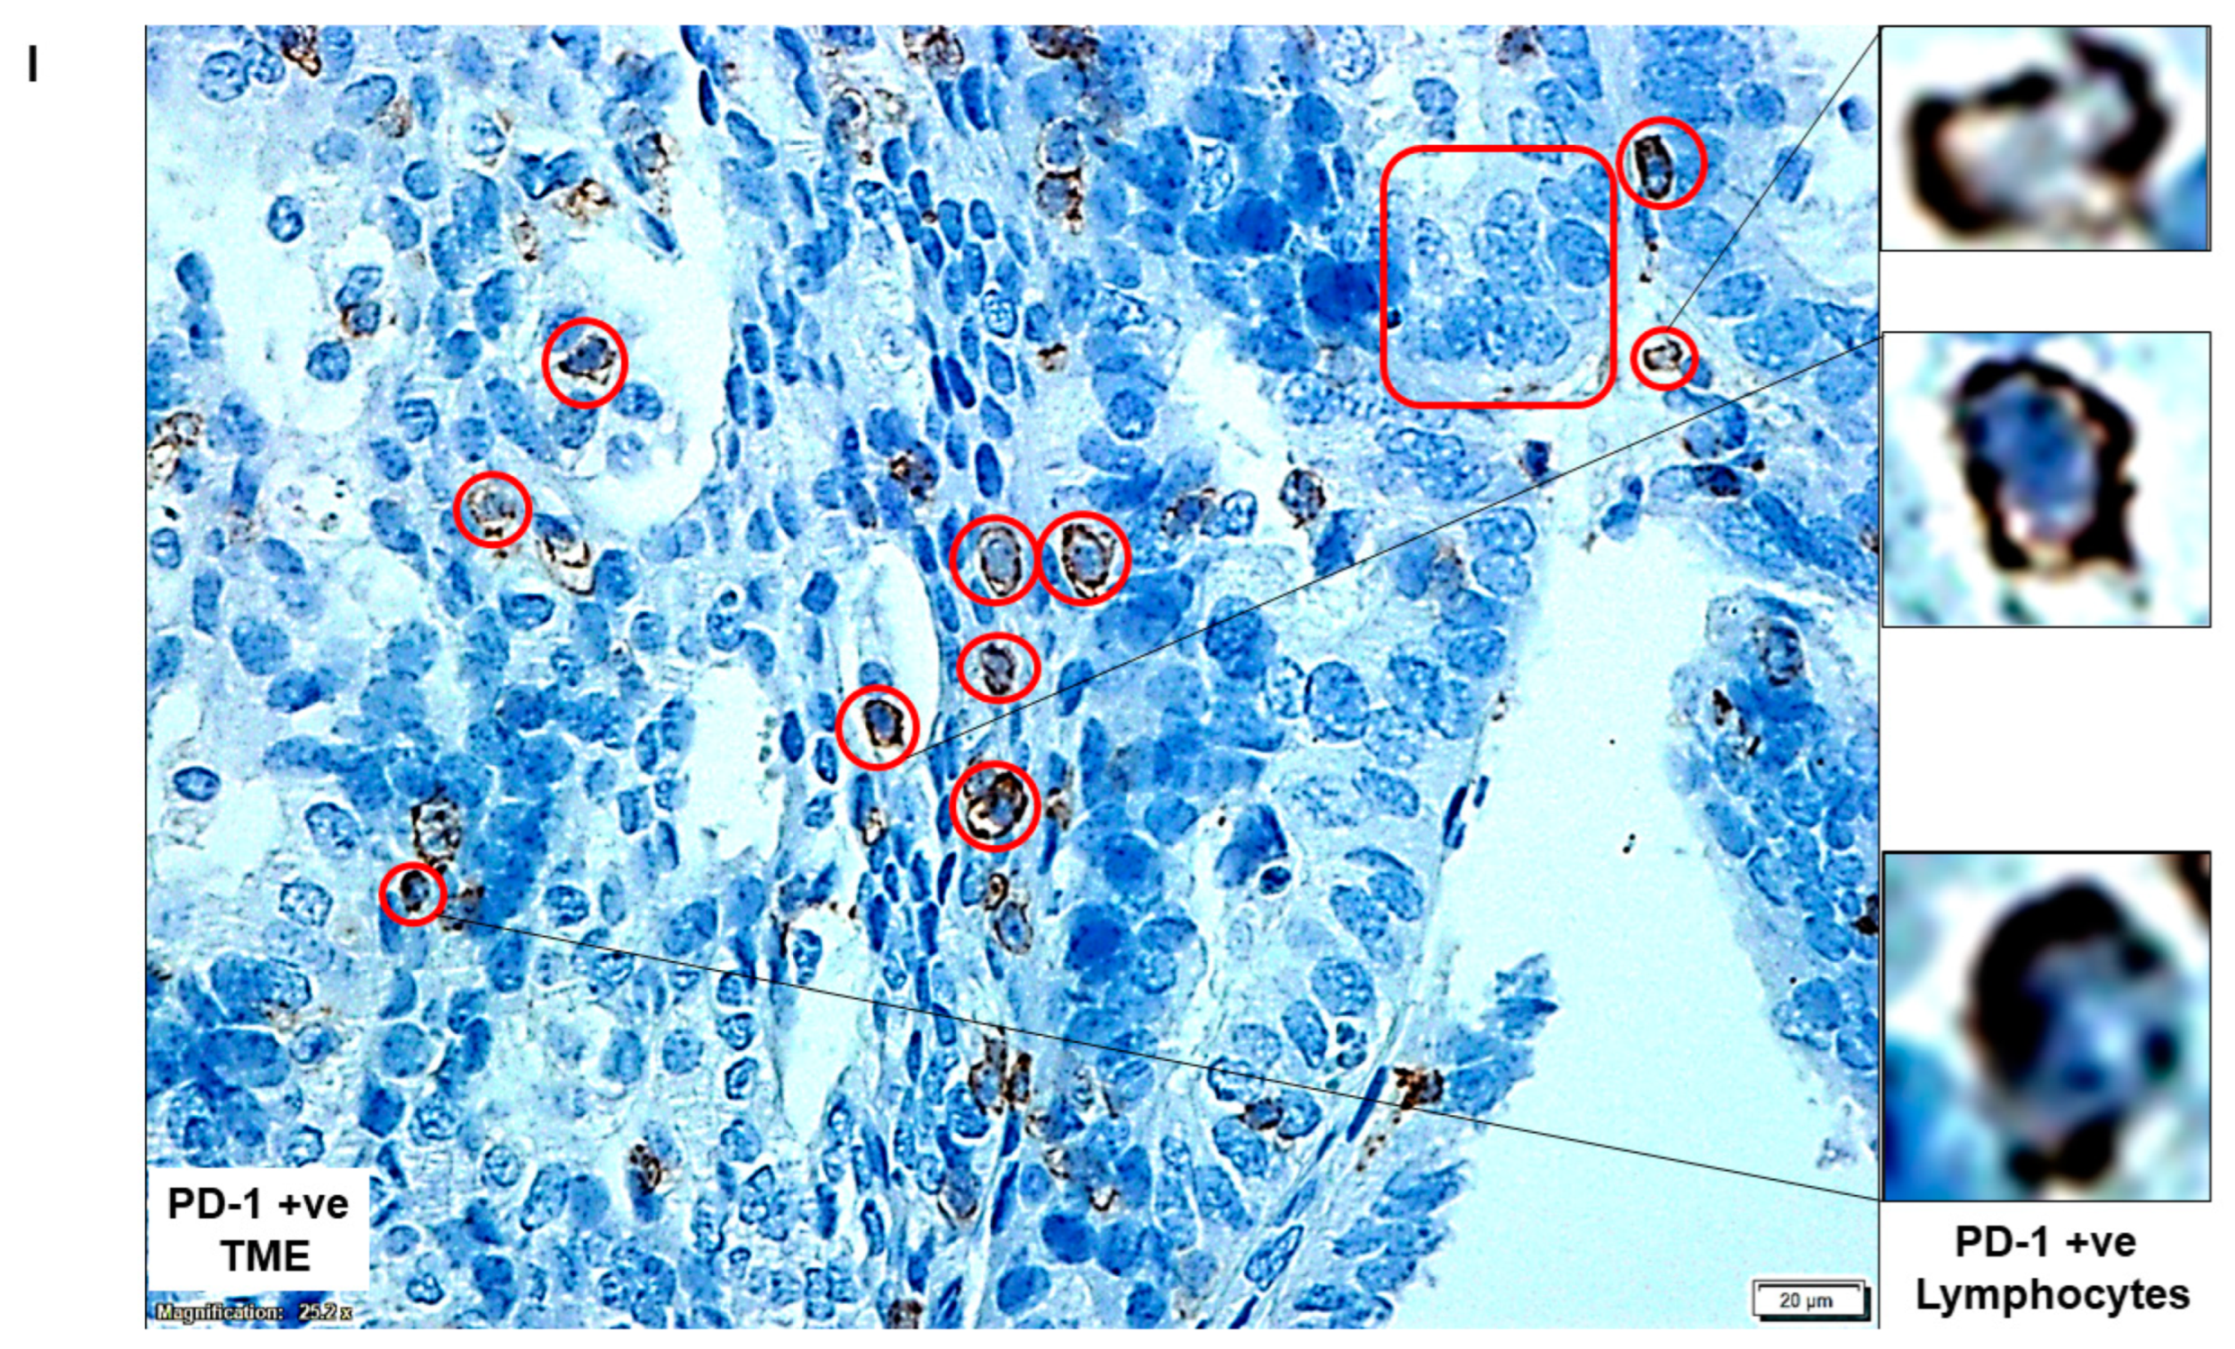
| I | PD-1 status of cells of TME | PD-1 +ve Lymphocytes | |
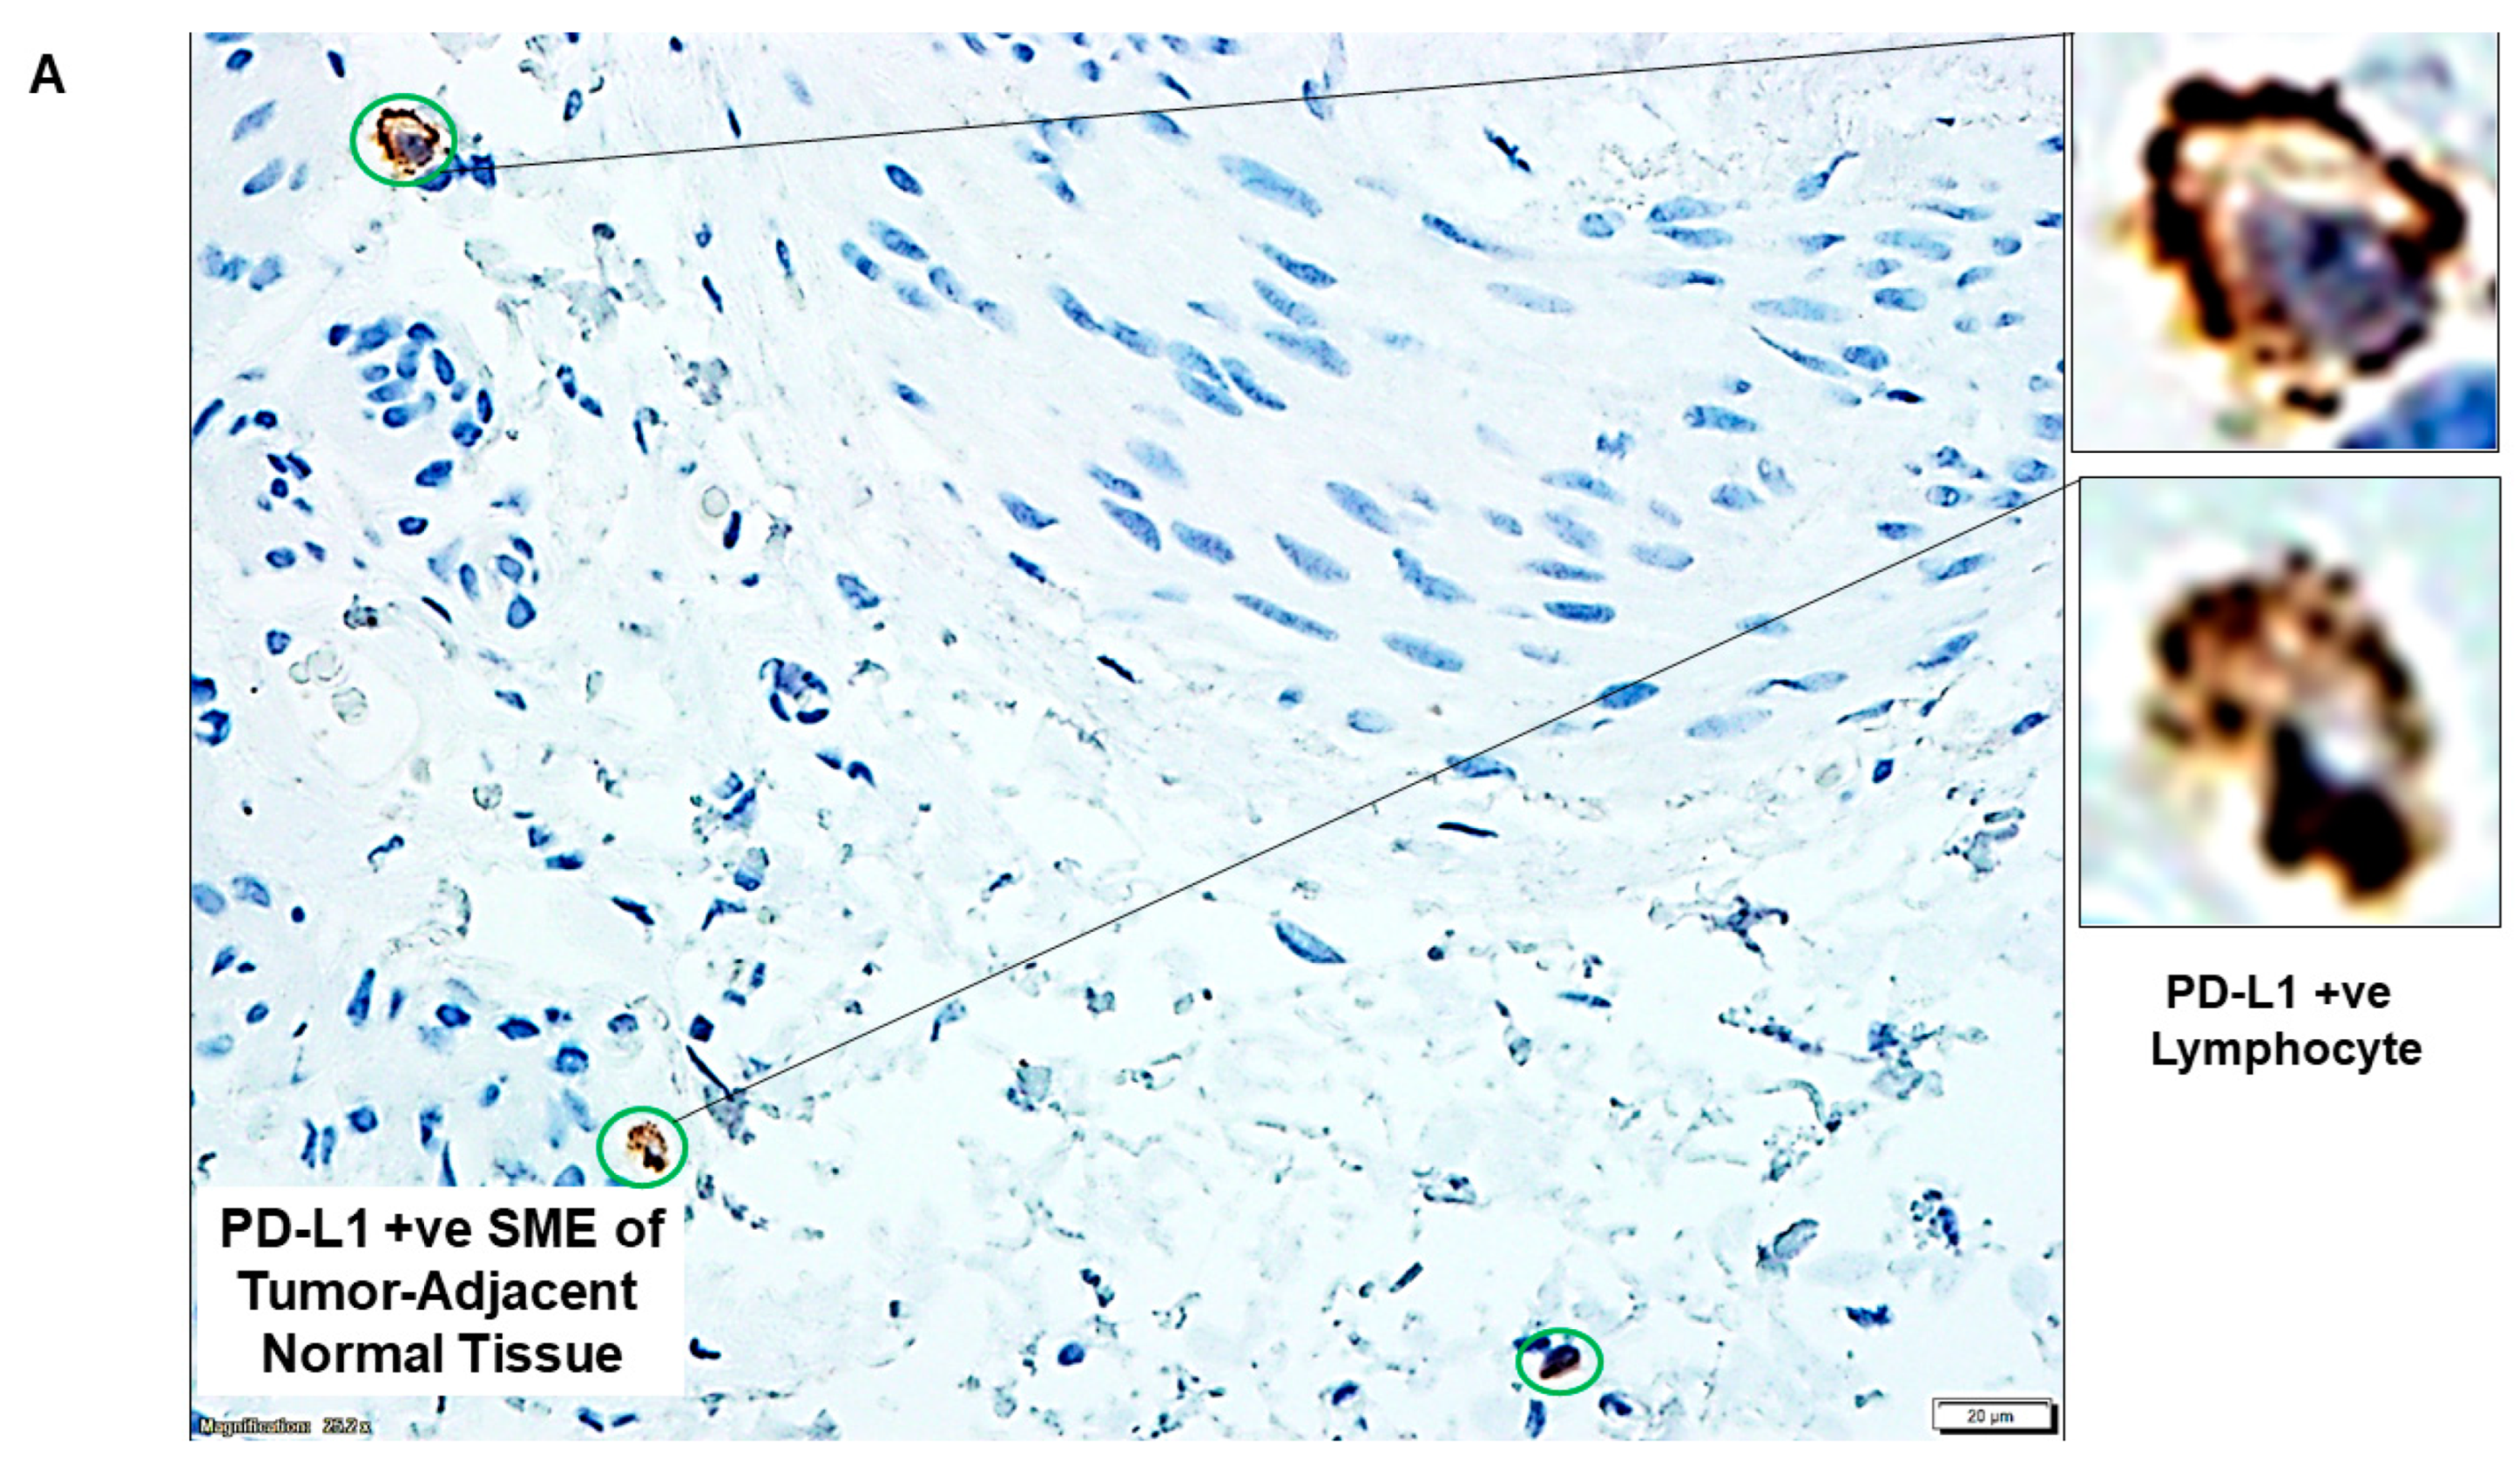
| 2 | A | PD-L1 status of cells of SME in tumor-adjacent normal tissue | PD-L1 +ve Lymphocyte |
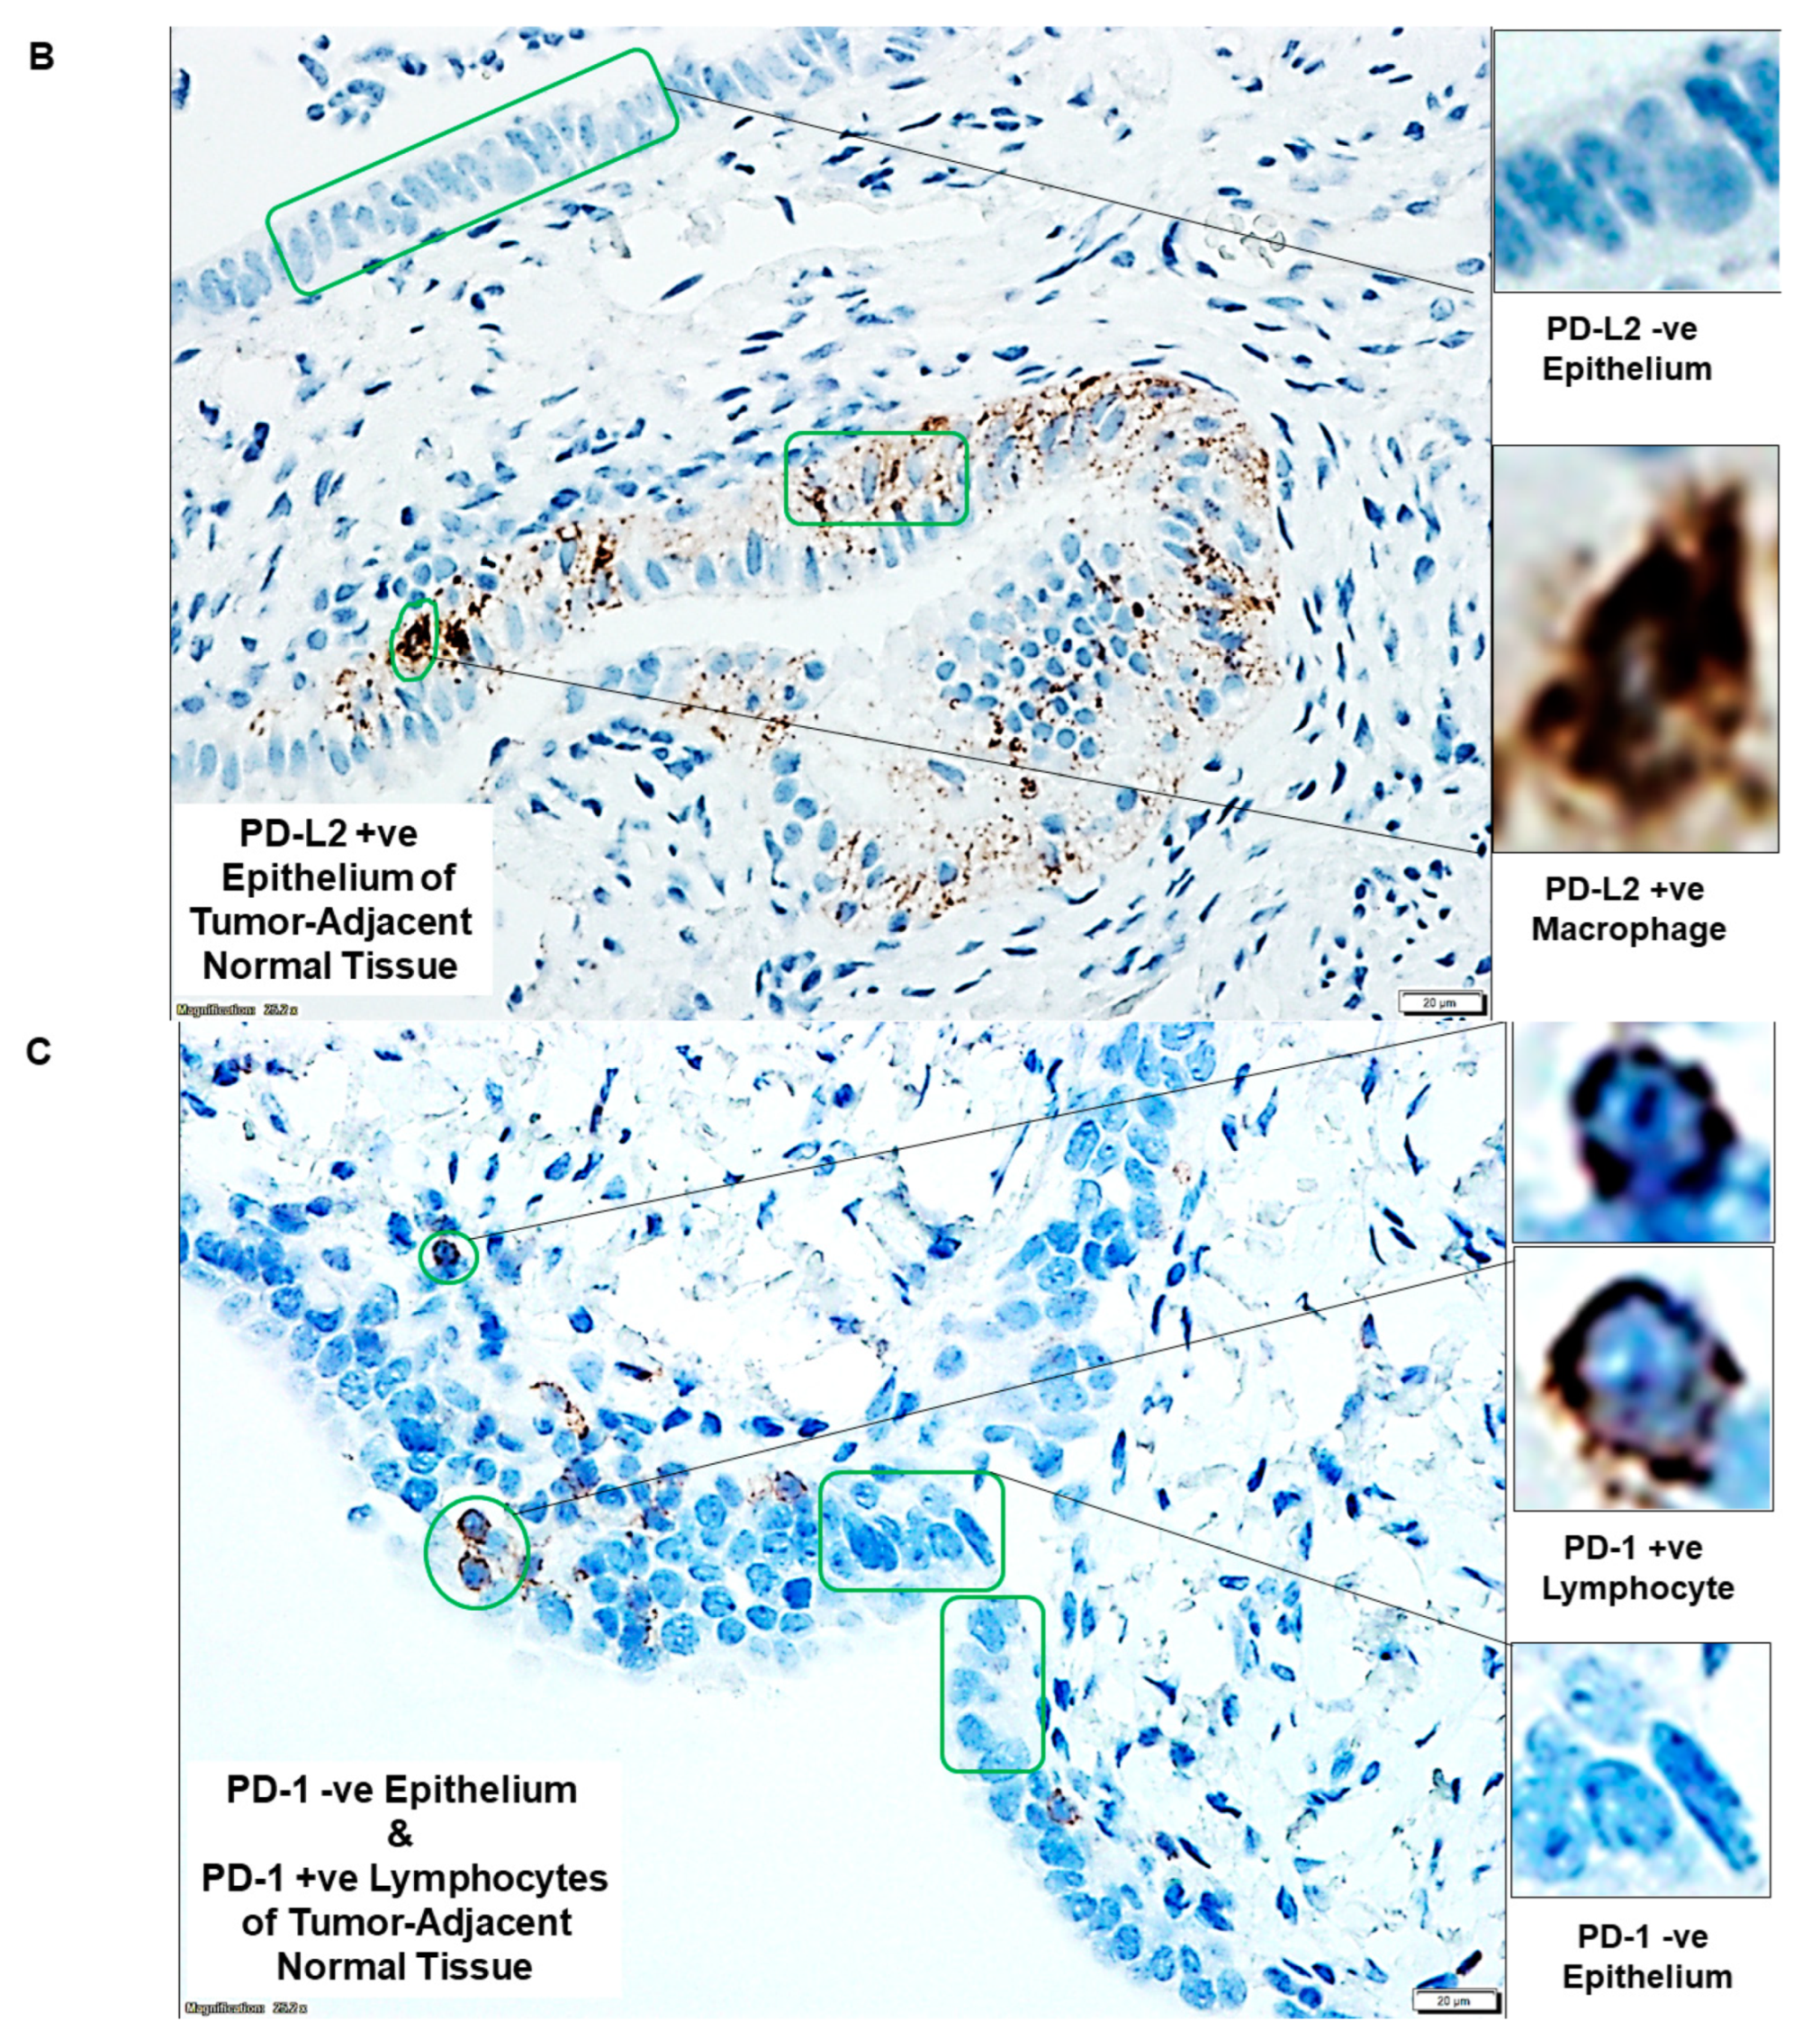
| B | PD-L2 +ve epithelium of tumor-adjacent normal tissue | PD-L2 −ve normal Epithelium and Macrophage | |
| C | PD-1 status of tumor-adjacent normal tissue | PD-1 −ve Epithelium and PD-1 +ve Lymphocytes | |
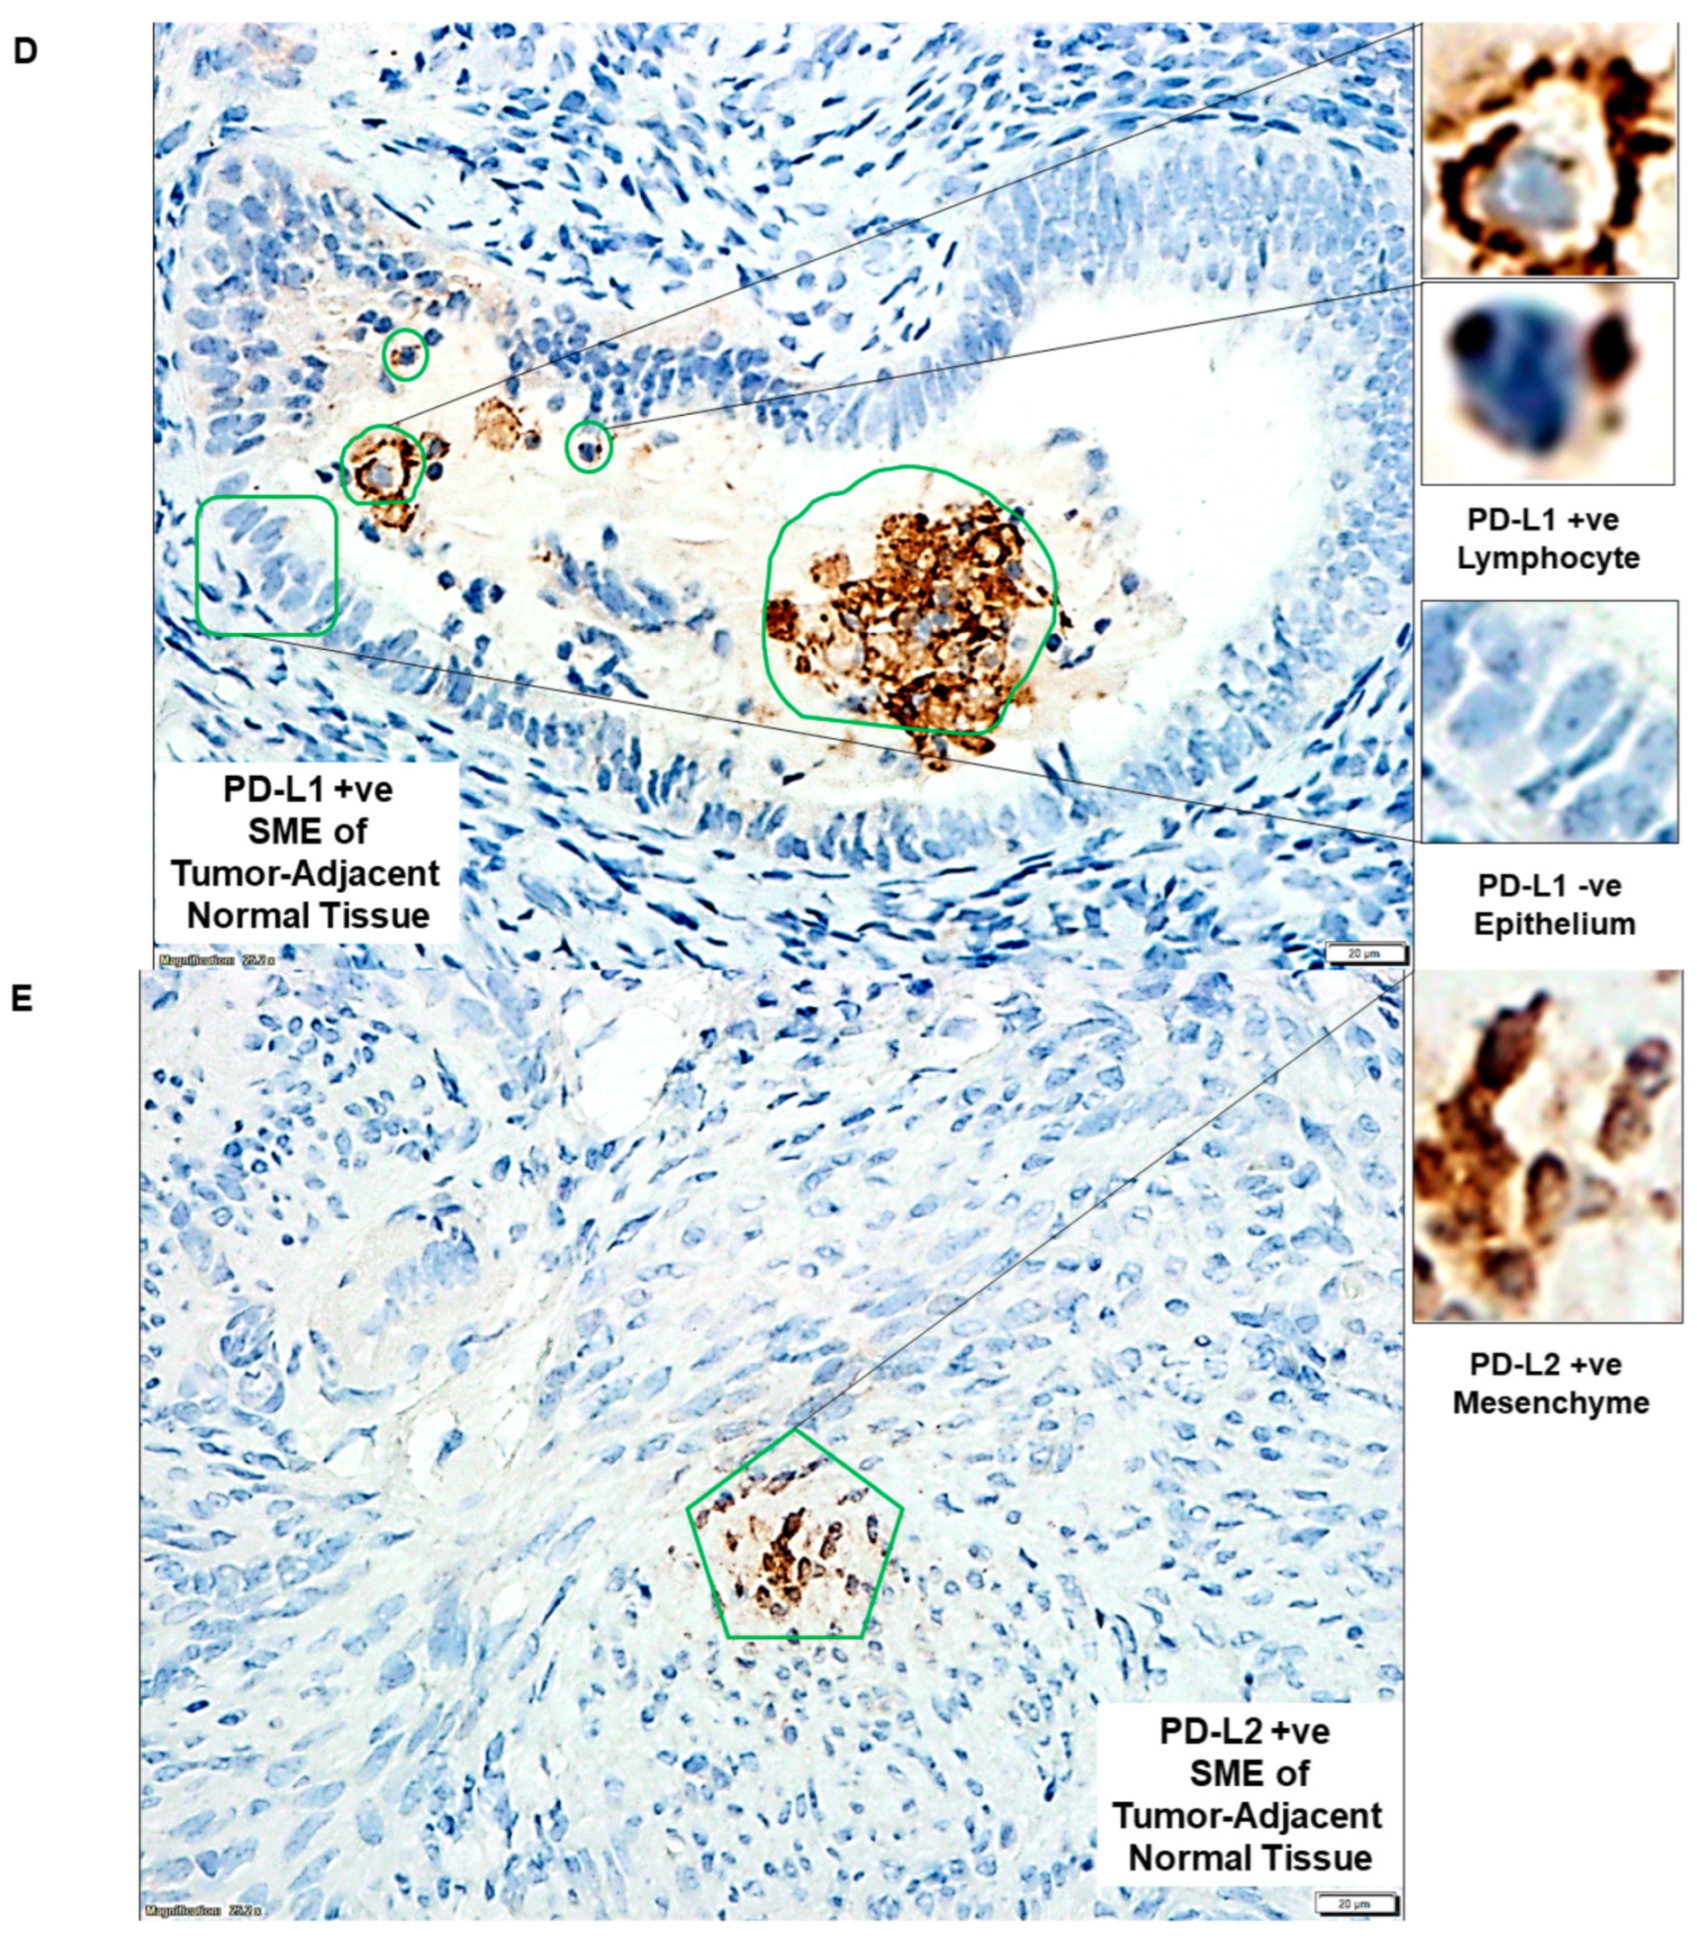
| D | PD-L1 +ve SME of tumor-adjacent normal tissue | PD-L1 +ve Lymphocyte and PD-L1 −ve Epithelium | |
| E | PD-L2 +ve SME of tumor-adjacent normal tissue | PD-L2 +ve Mesenchyme | |
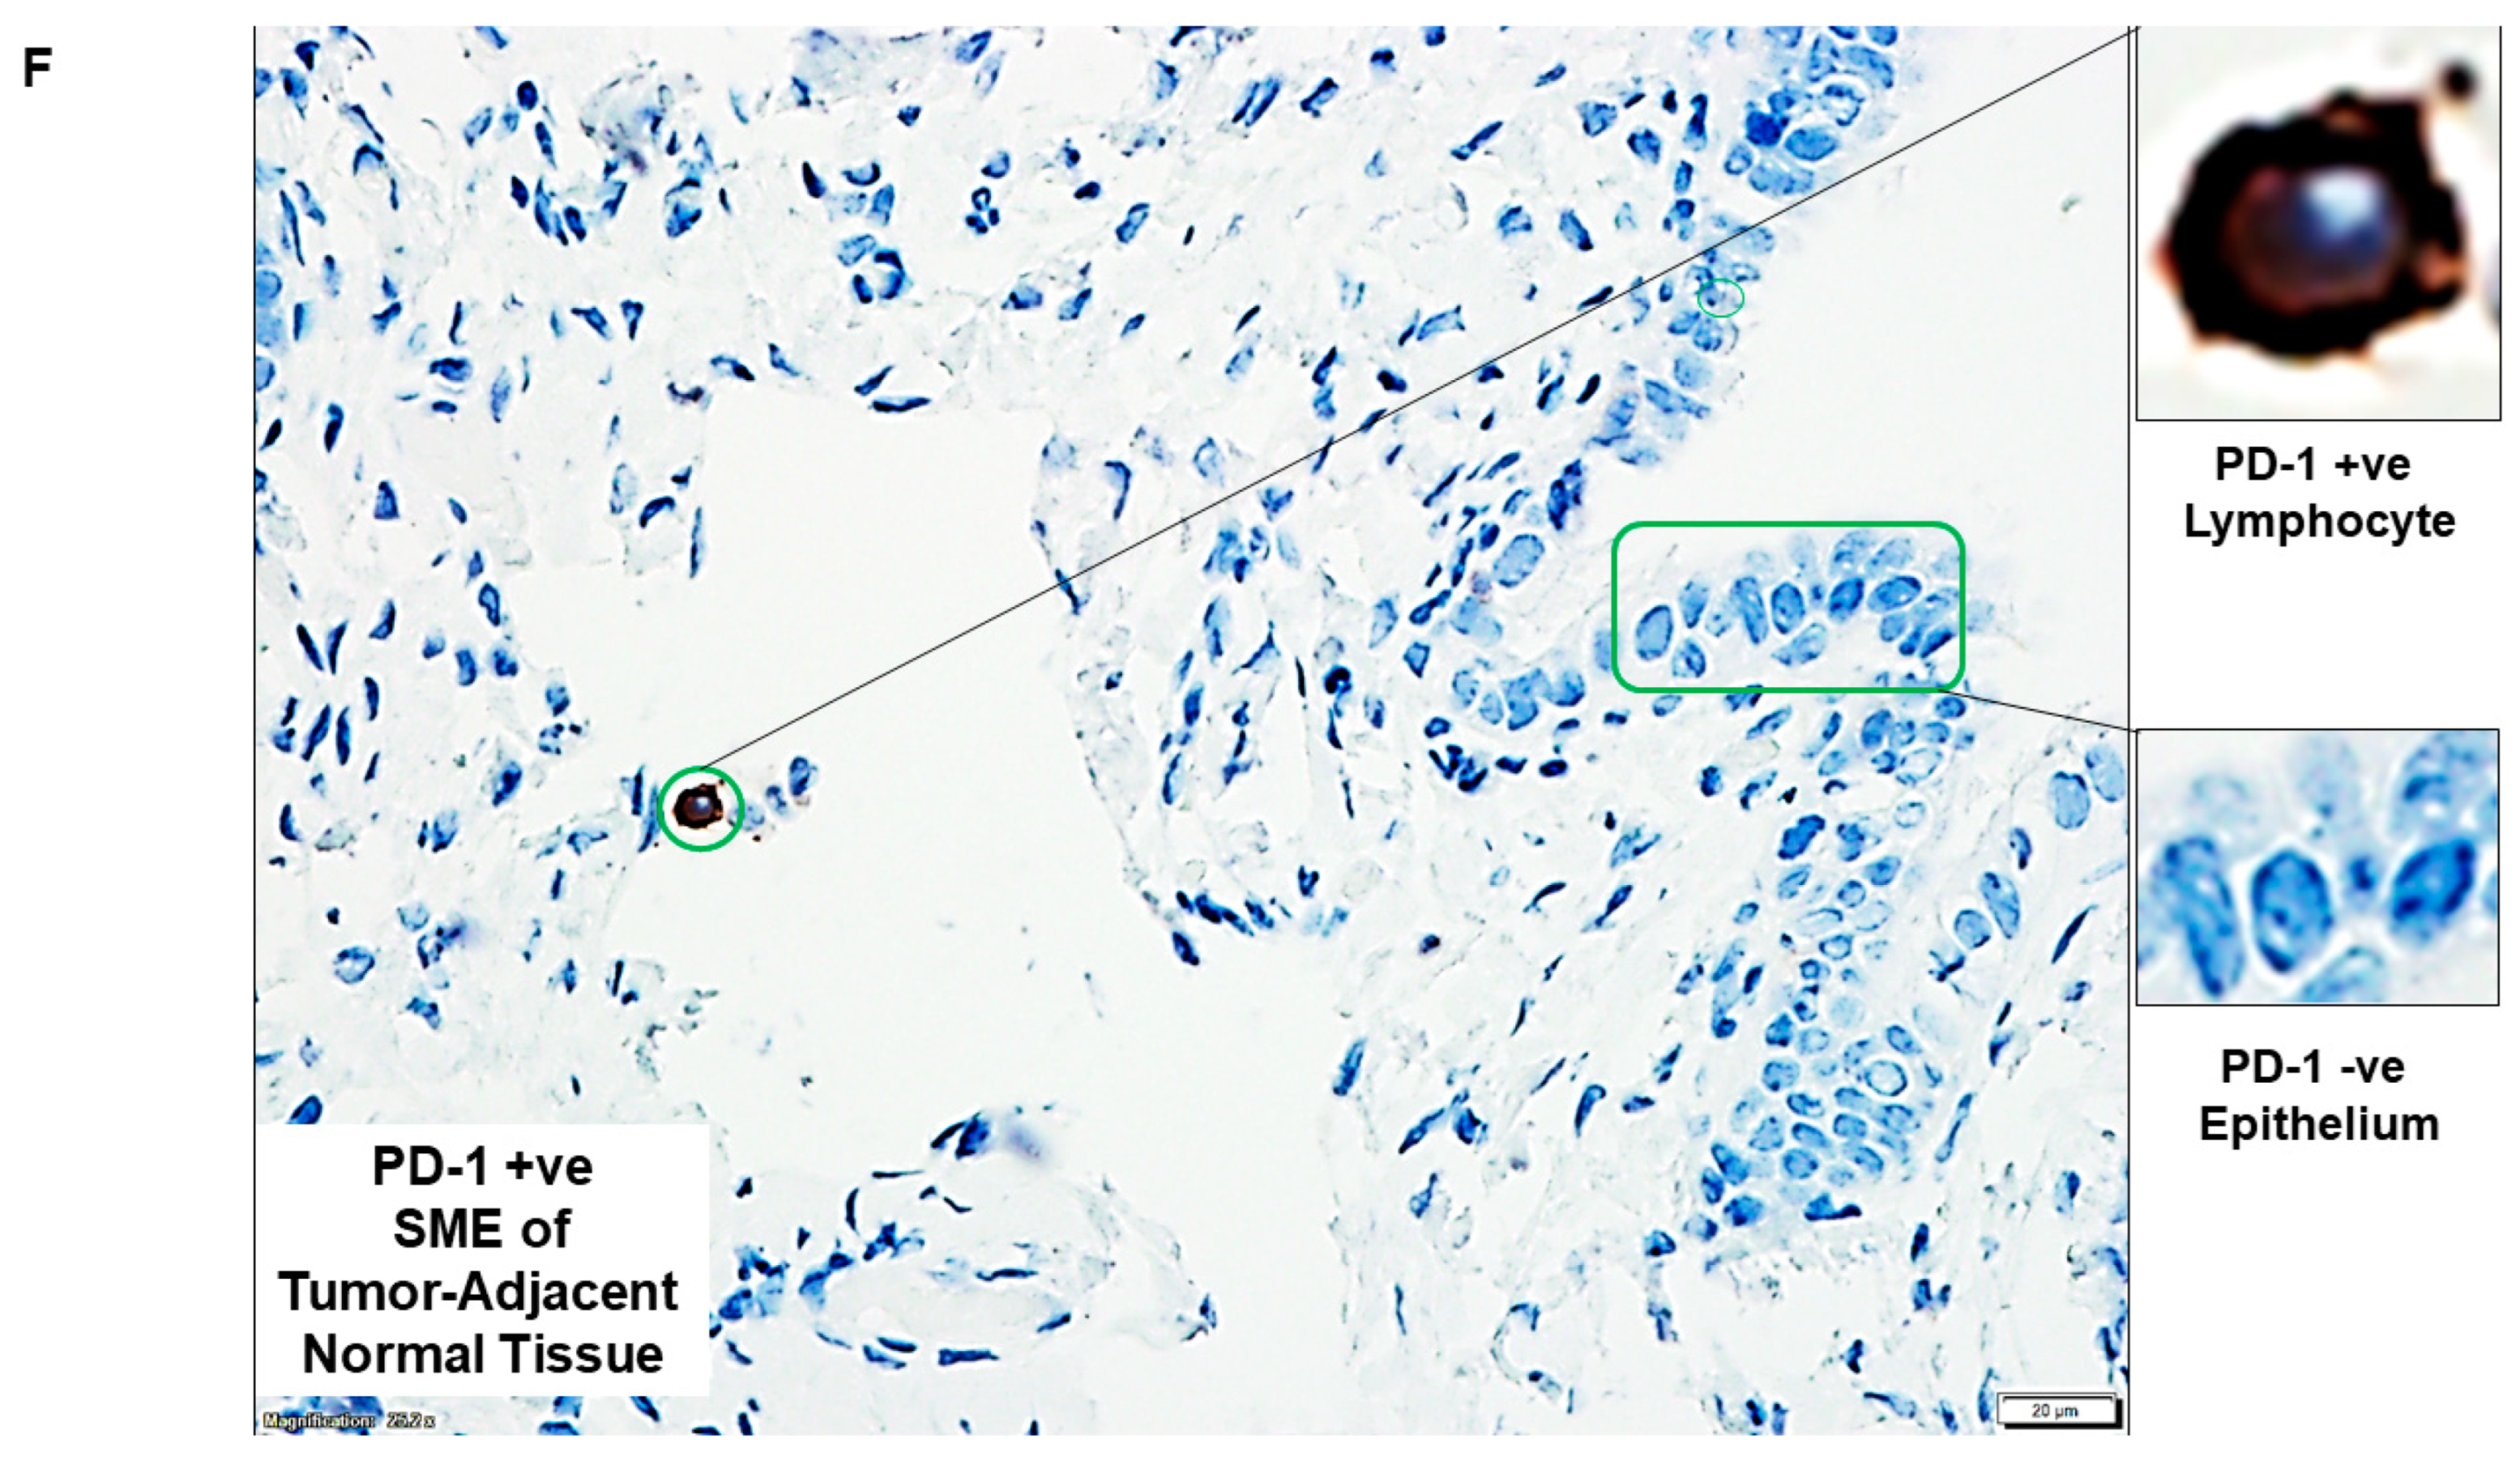
| F | PD-1 +ve SME of tumor-adjacent normal tissue | PD-1 +ve Lymphocyte and PD-1 −ve Epithelium | |
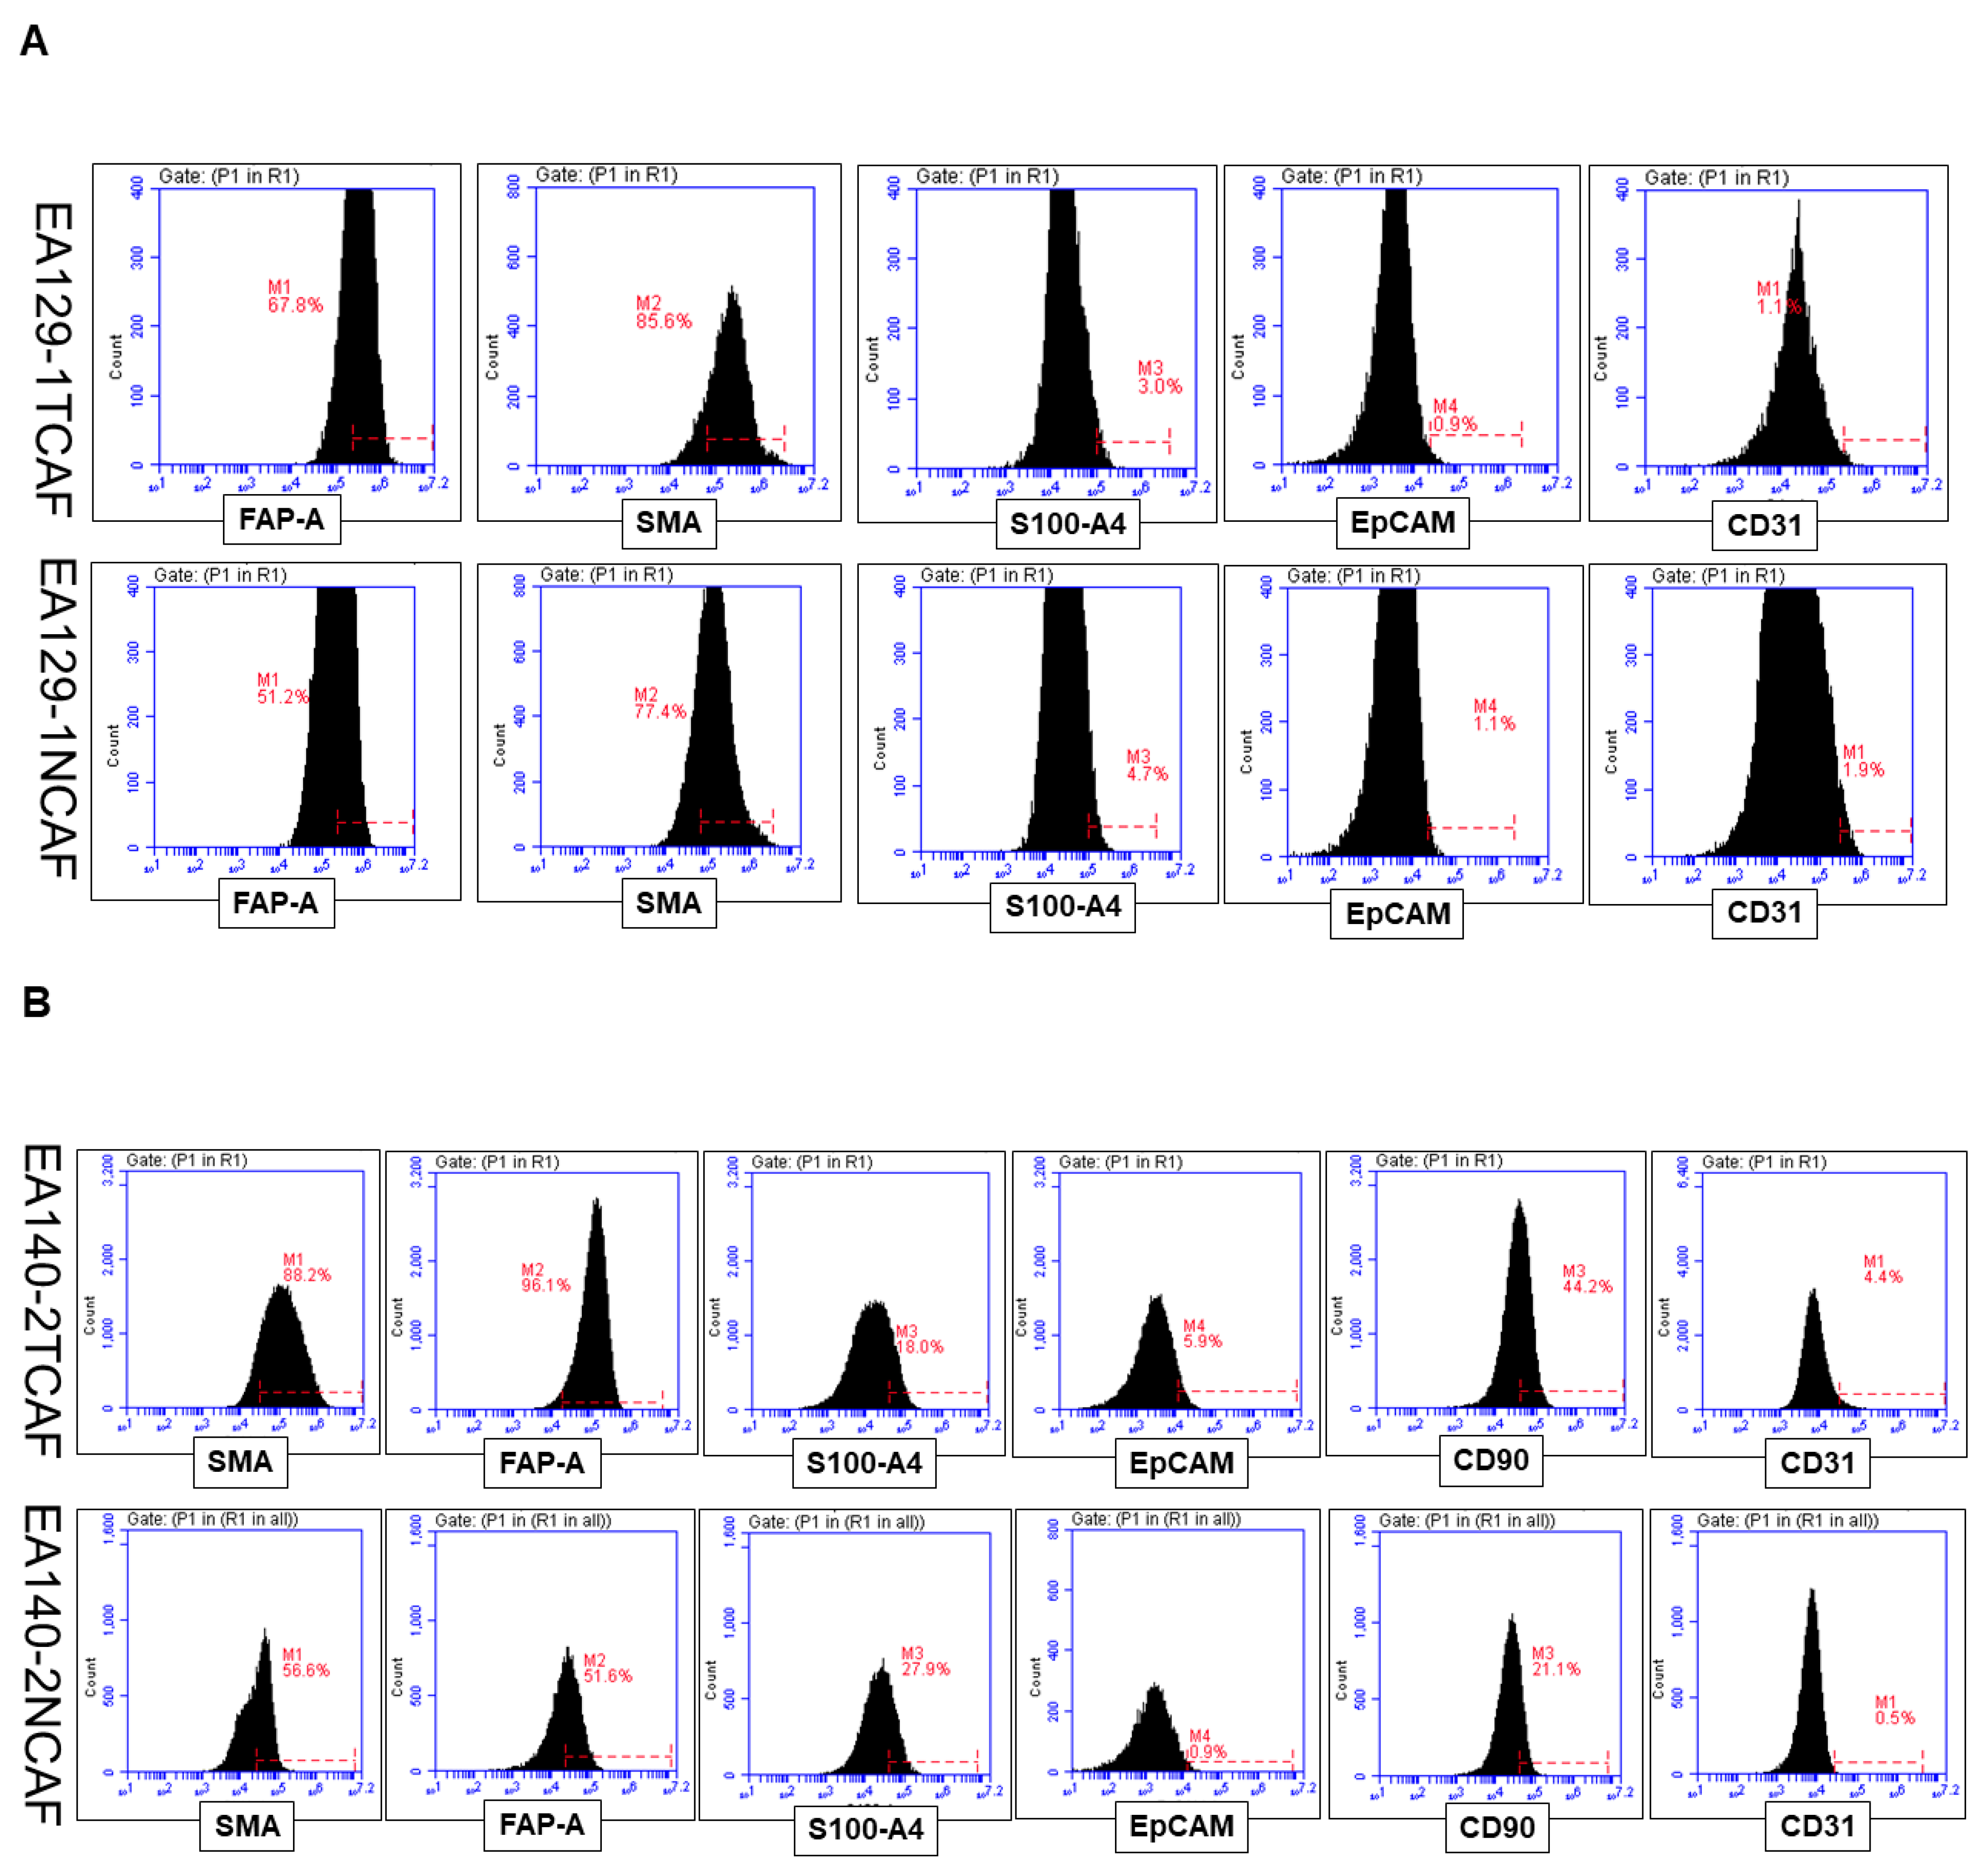
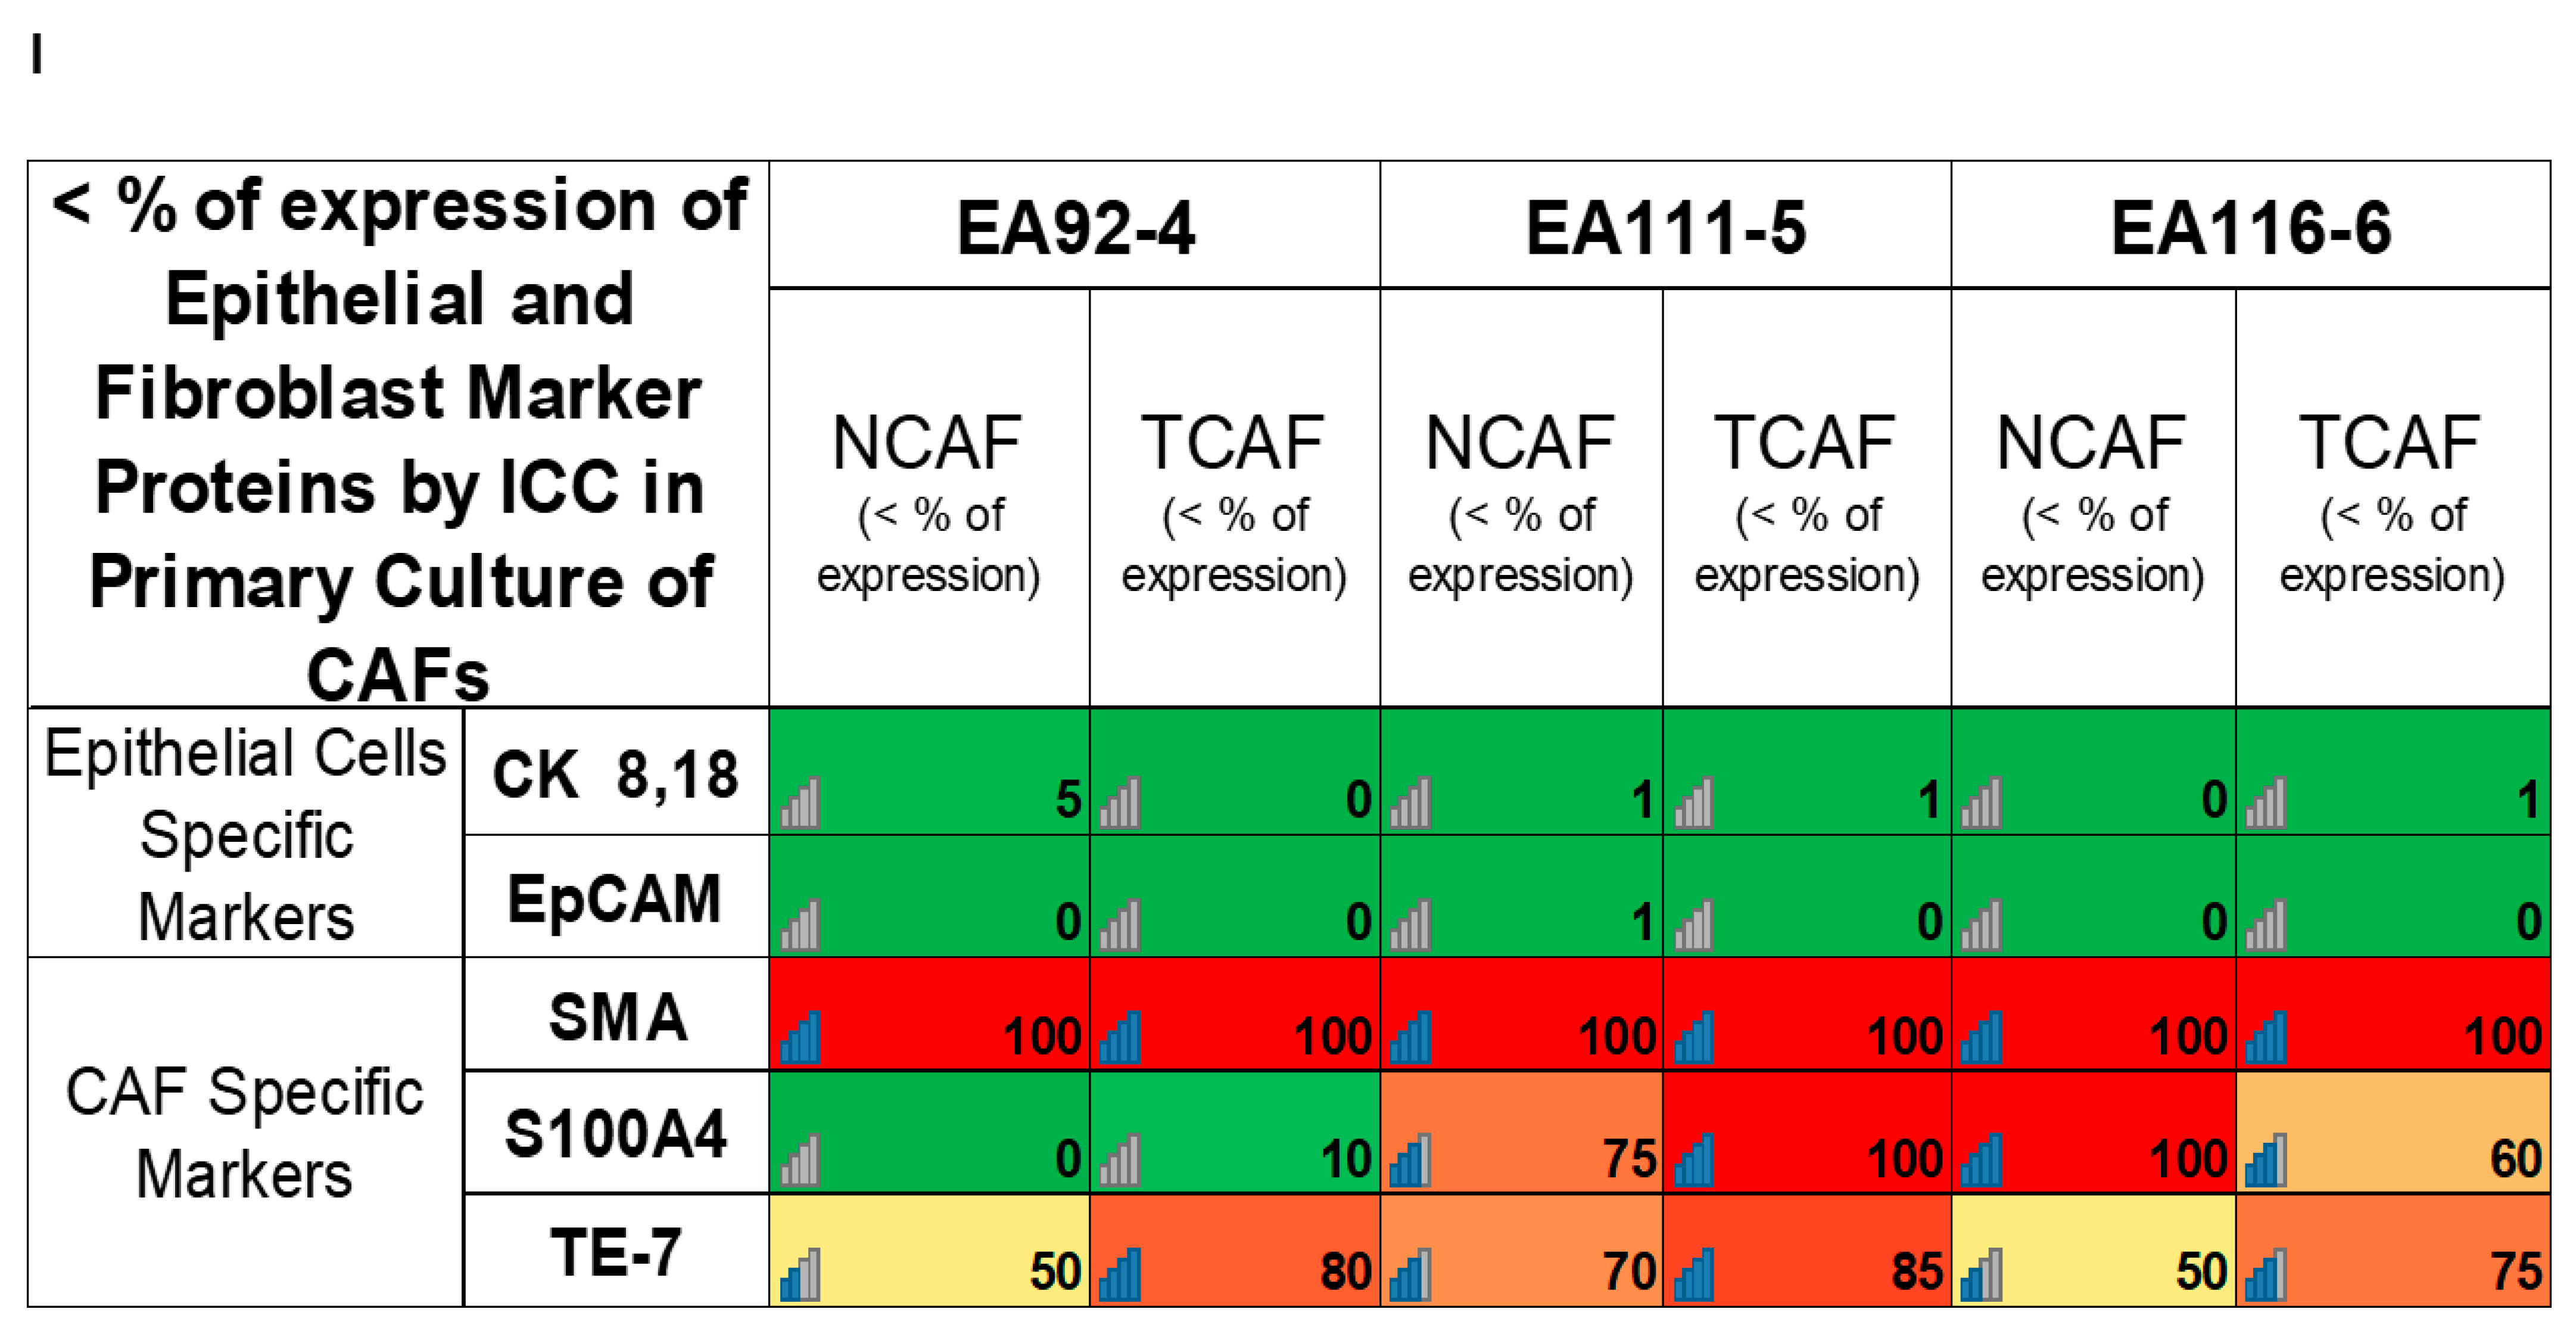
| 3 | A | Flowcytometric expression of positive and negative CAF markers in NCAF and TCAF | Positive expression of FAP-A, SMA, and negative expression of S100A4, CD31, EpCAM |
| B | Flowcytometric expression of positive and negative CAF markers in NCAF and TCAF | Positive expression of FAP-A, SMA, S100A4, CD90 and negative expression of CD31, EpCAM | |
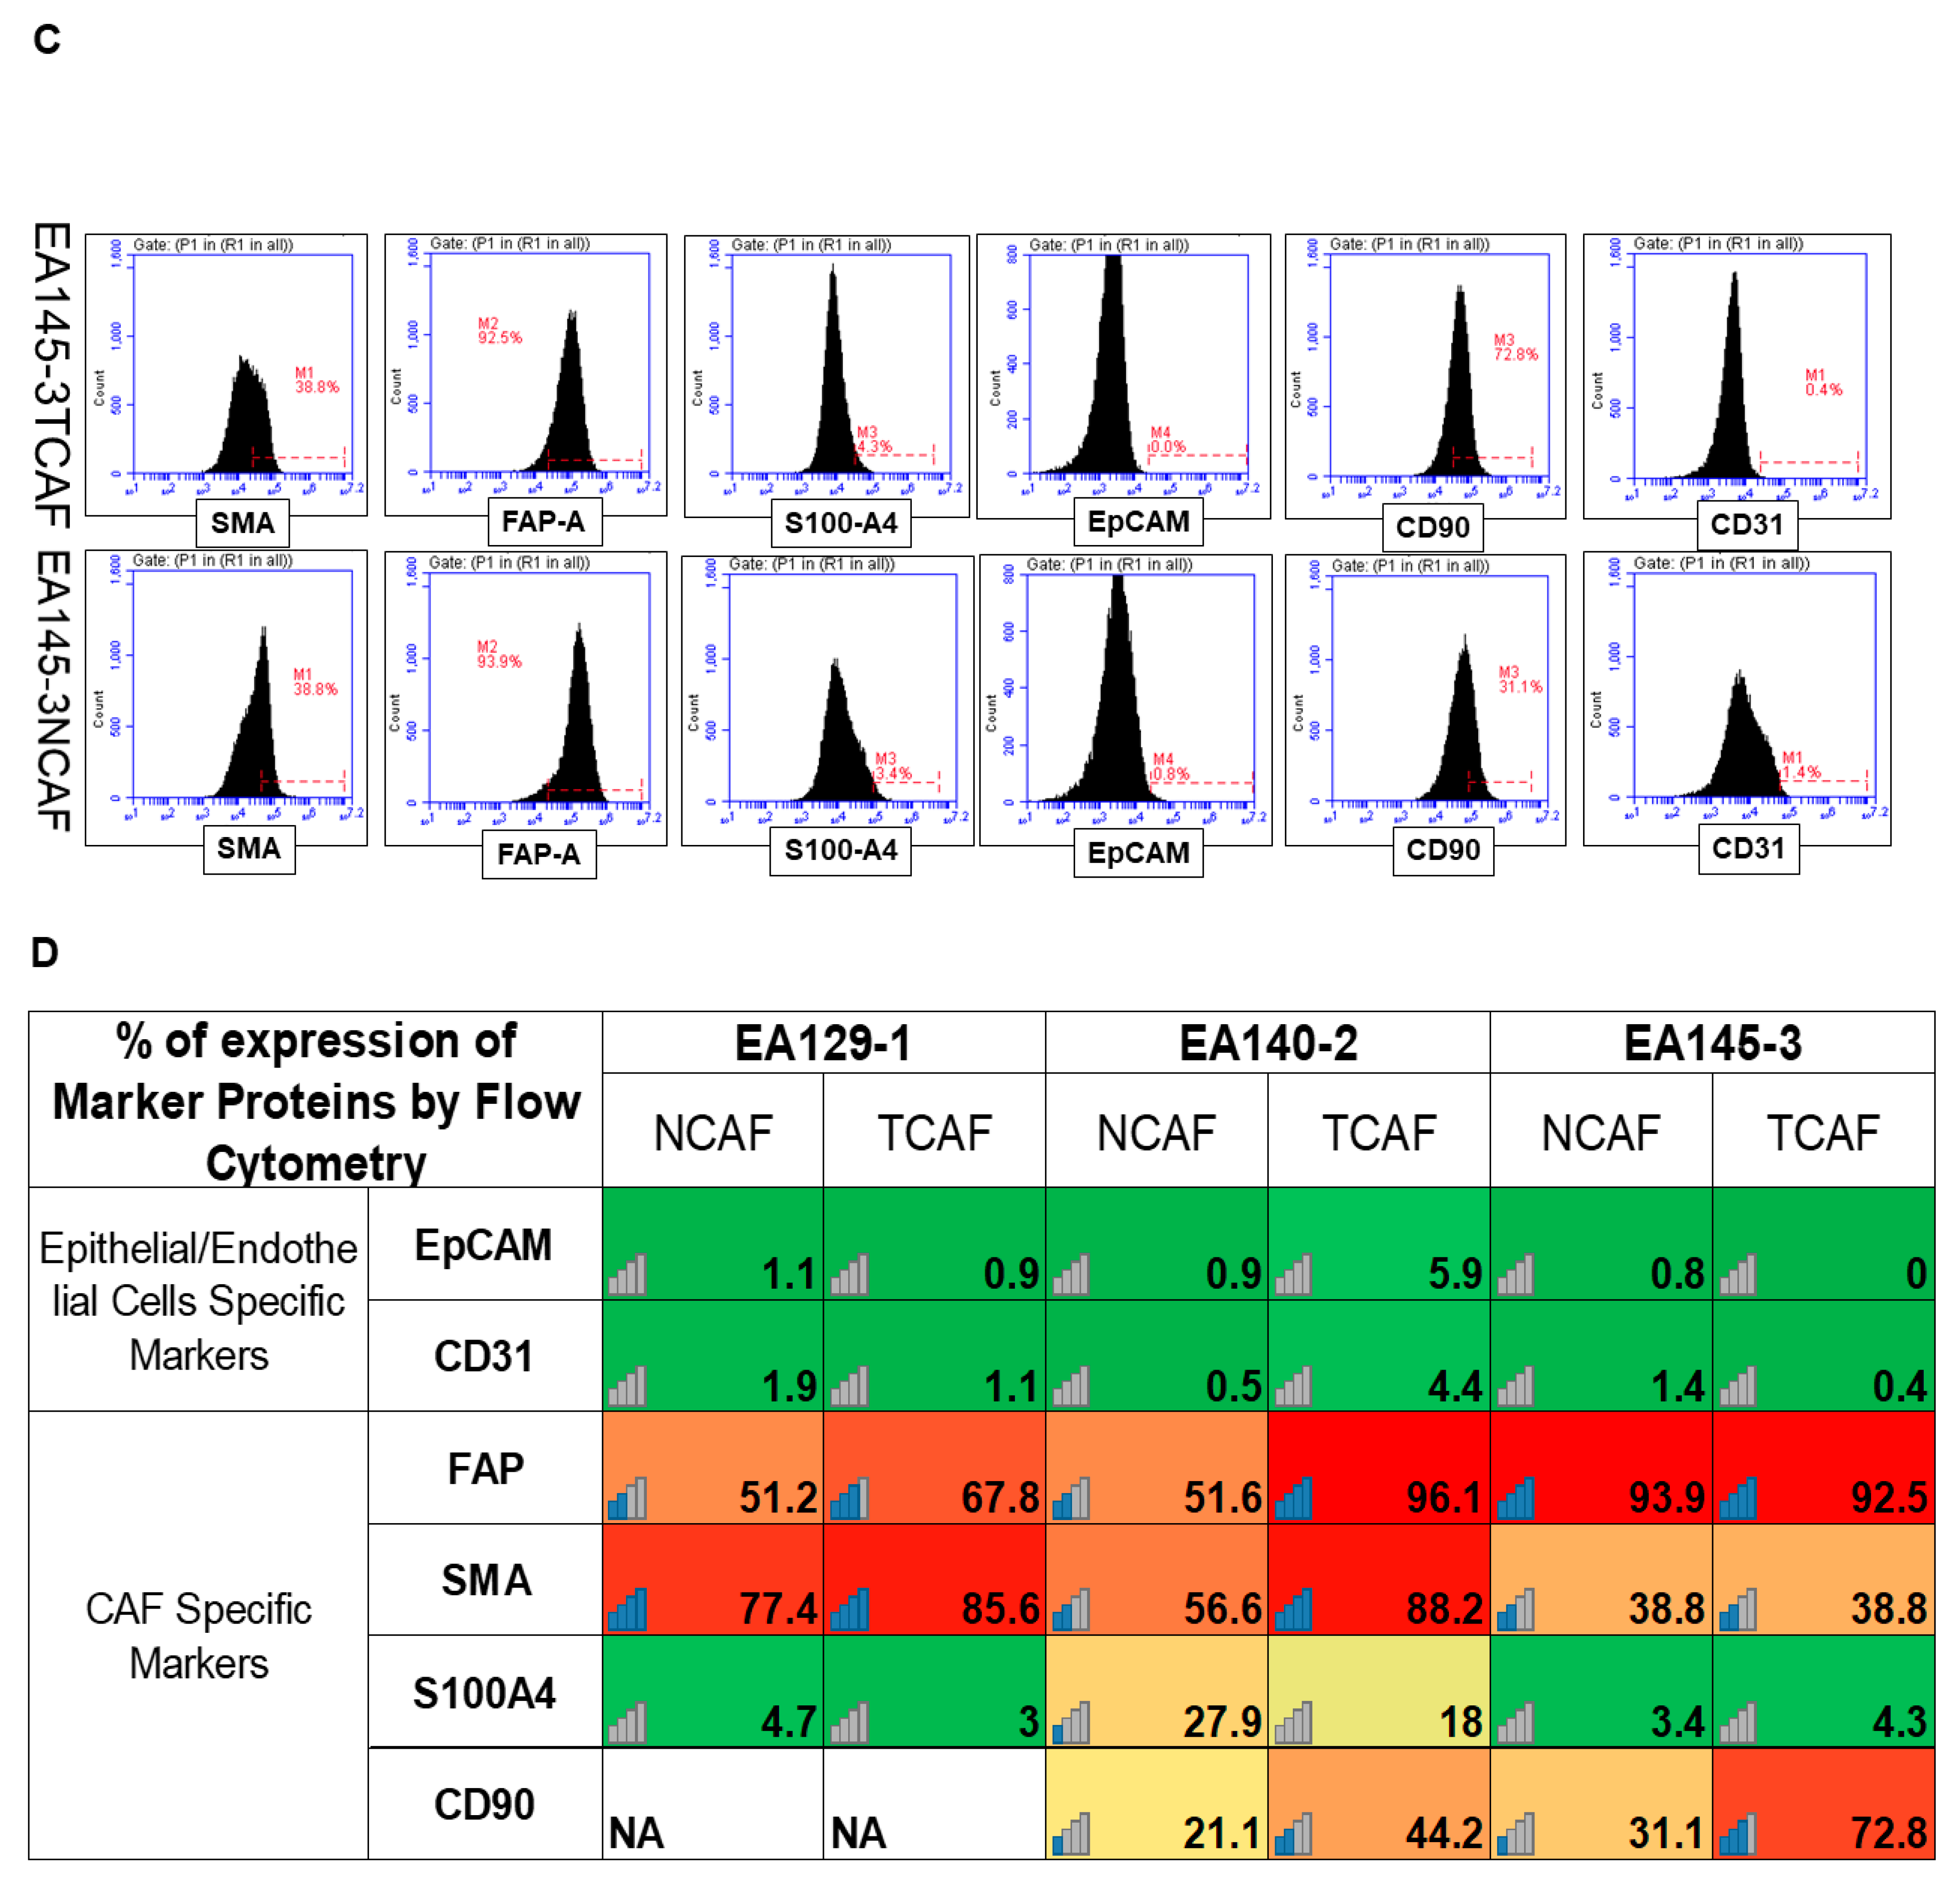
| C | Flowcytometric expression of positive and negative CAF markers in NCAF and TCAF | Positive expression of FAP-A, SMA, CD90 and negative expression of CD31, EpCAM, S100A4 | |
| D | Percentage of expression of epithelial (EpCAM), fibroblast (SMA, S100A4, FAP, and CD90), and endothelial (CD31) marker proteins by flow cytometry | Both TCAFs and NCAFs are positive for SMA, CD90, and FAP-A and negative for CD31 and EpCAM. S100A4 is differentially expressed. | |
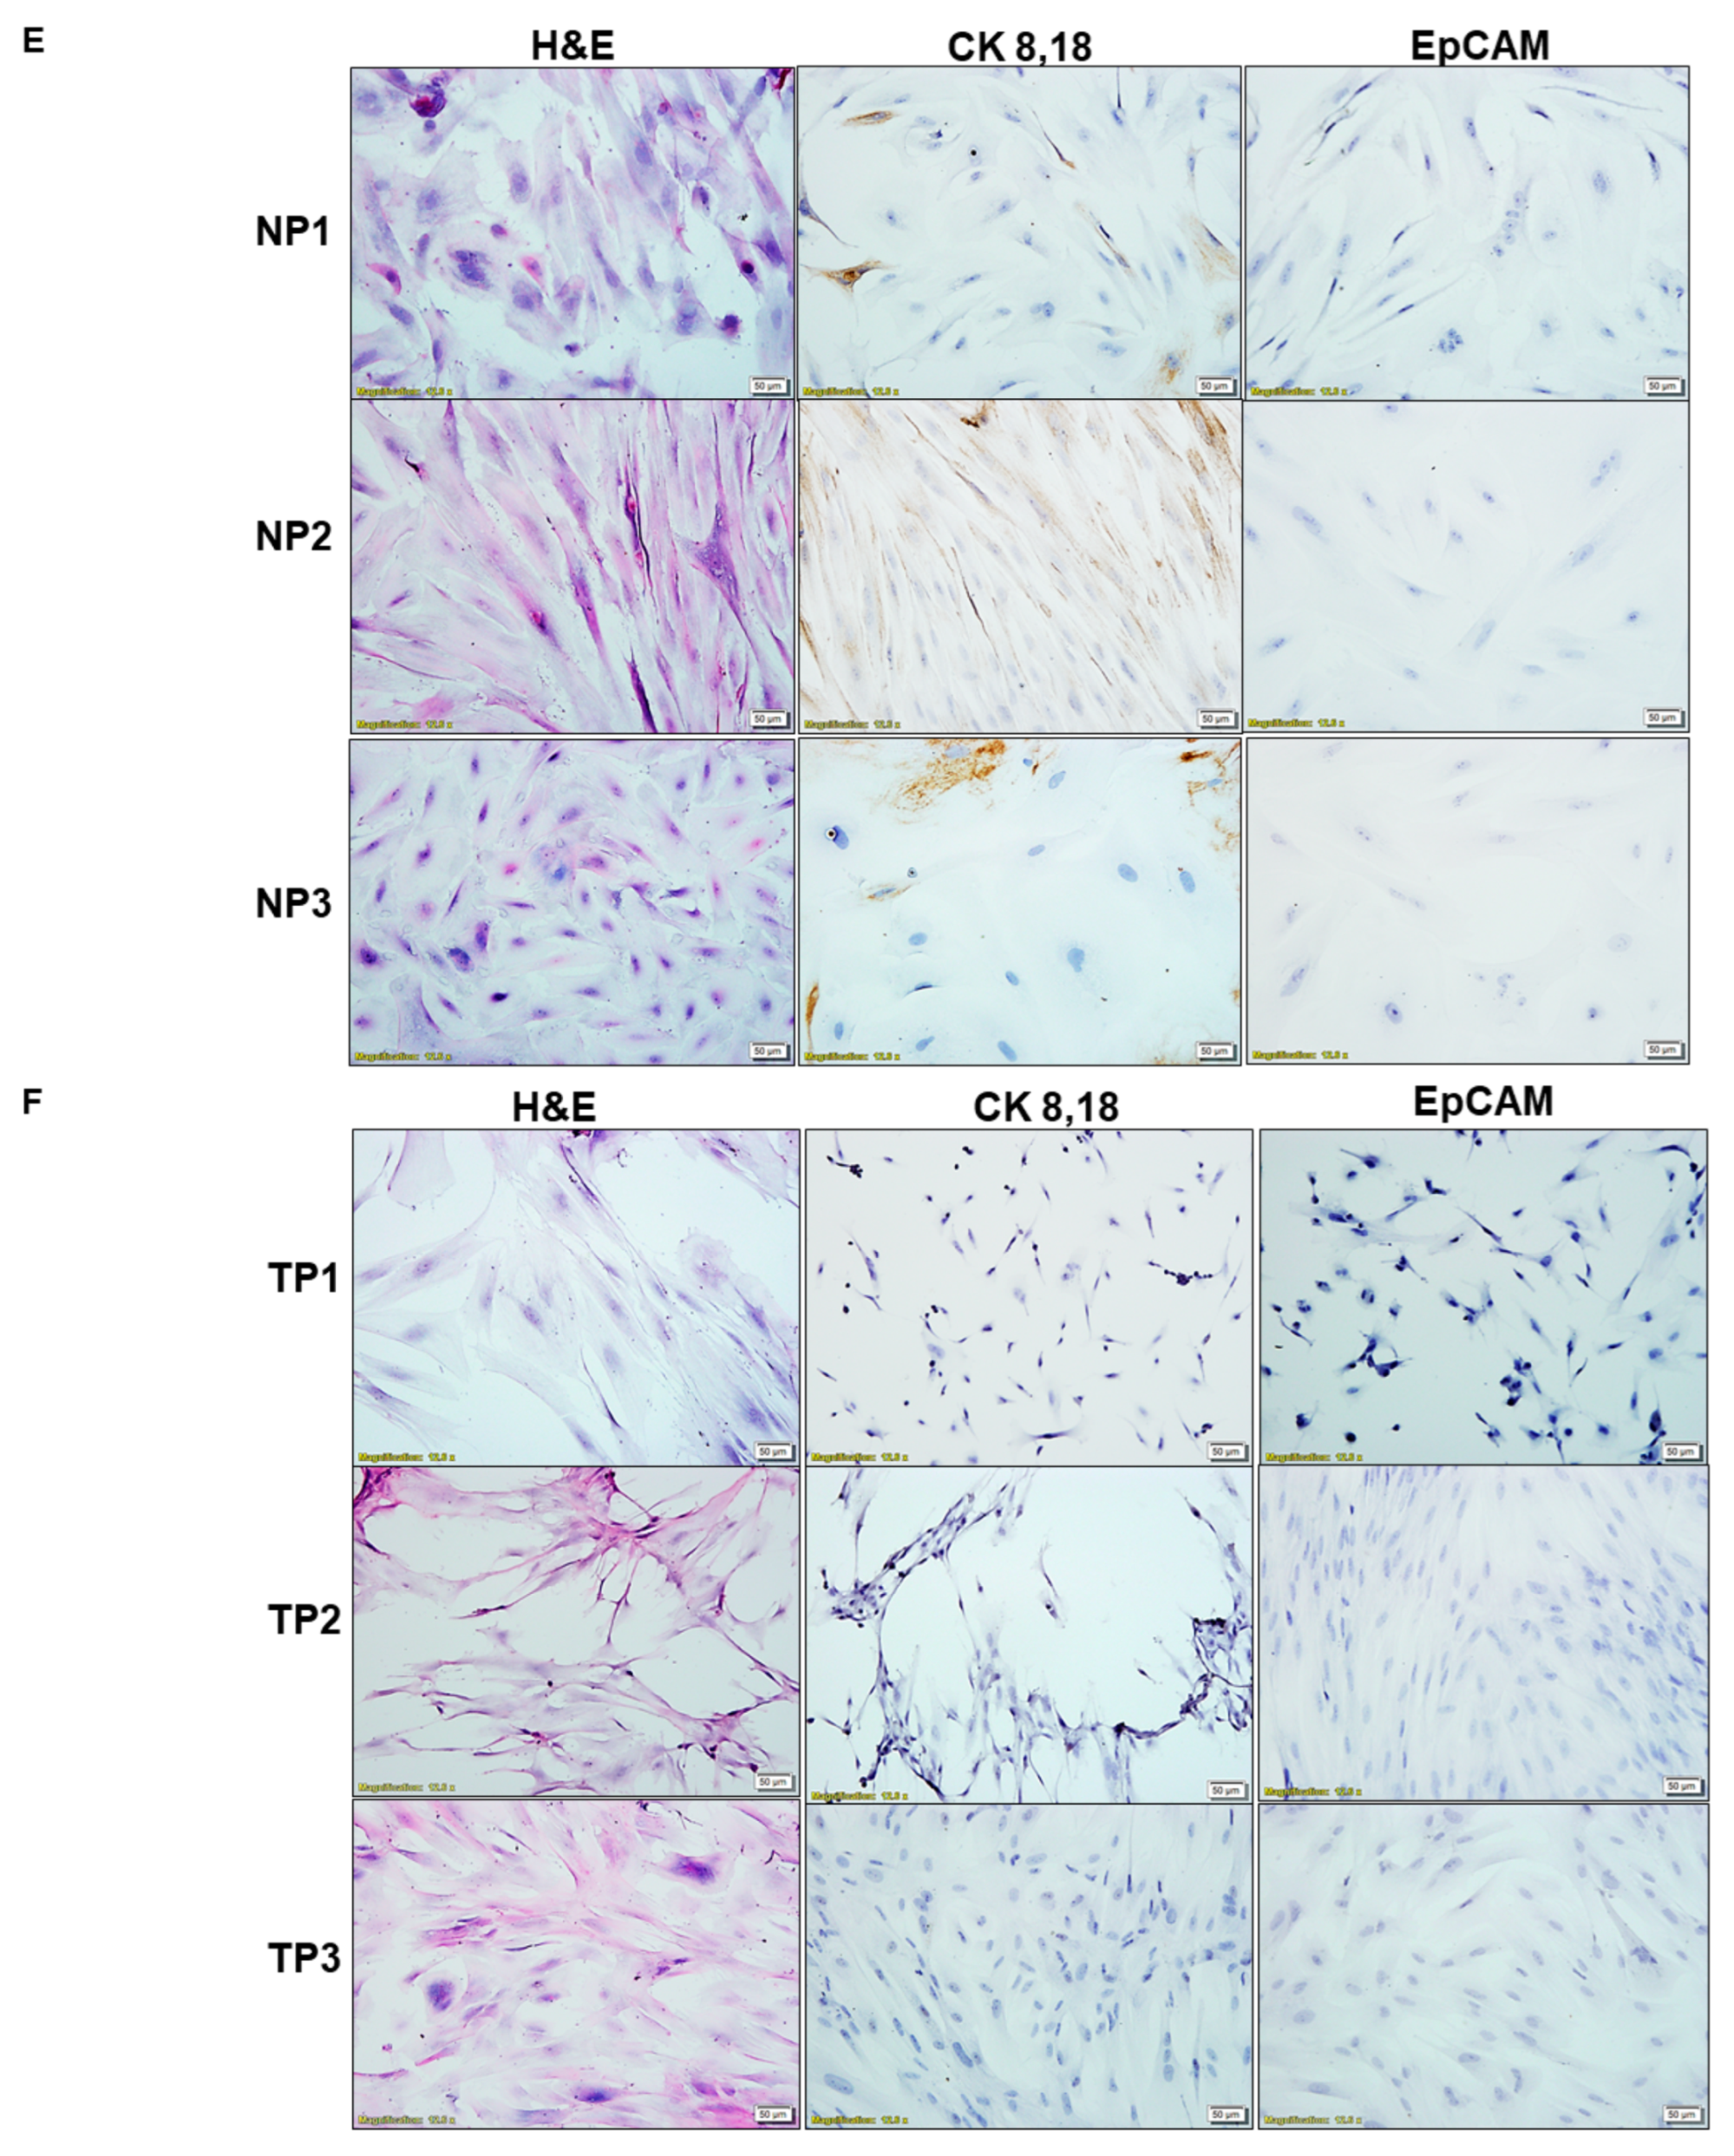
| E | Expression of CK 8, 18, and EpCAM in NCAF from passages 1, 2, and 3 | Negative expression of CK 8, 18, and EpCAM in NCAF | |
| F | Expression of CK 8, 18, and EpCAM in TCAF from passages 1, 2, and 3 | Negative expression of CK 8, 18, and EpCAM in TCAF | |
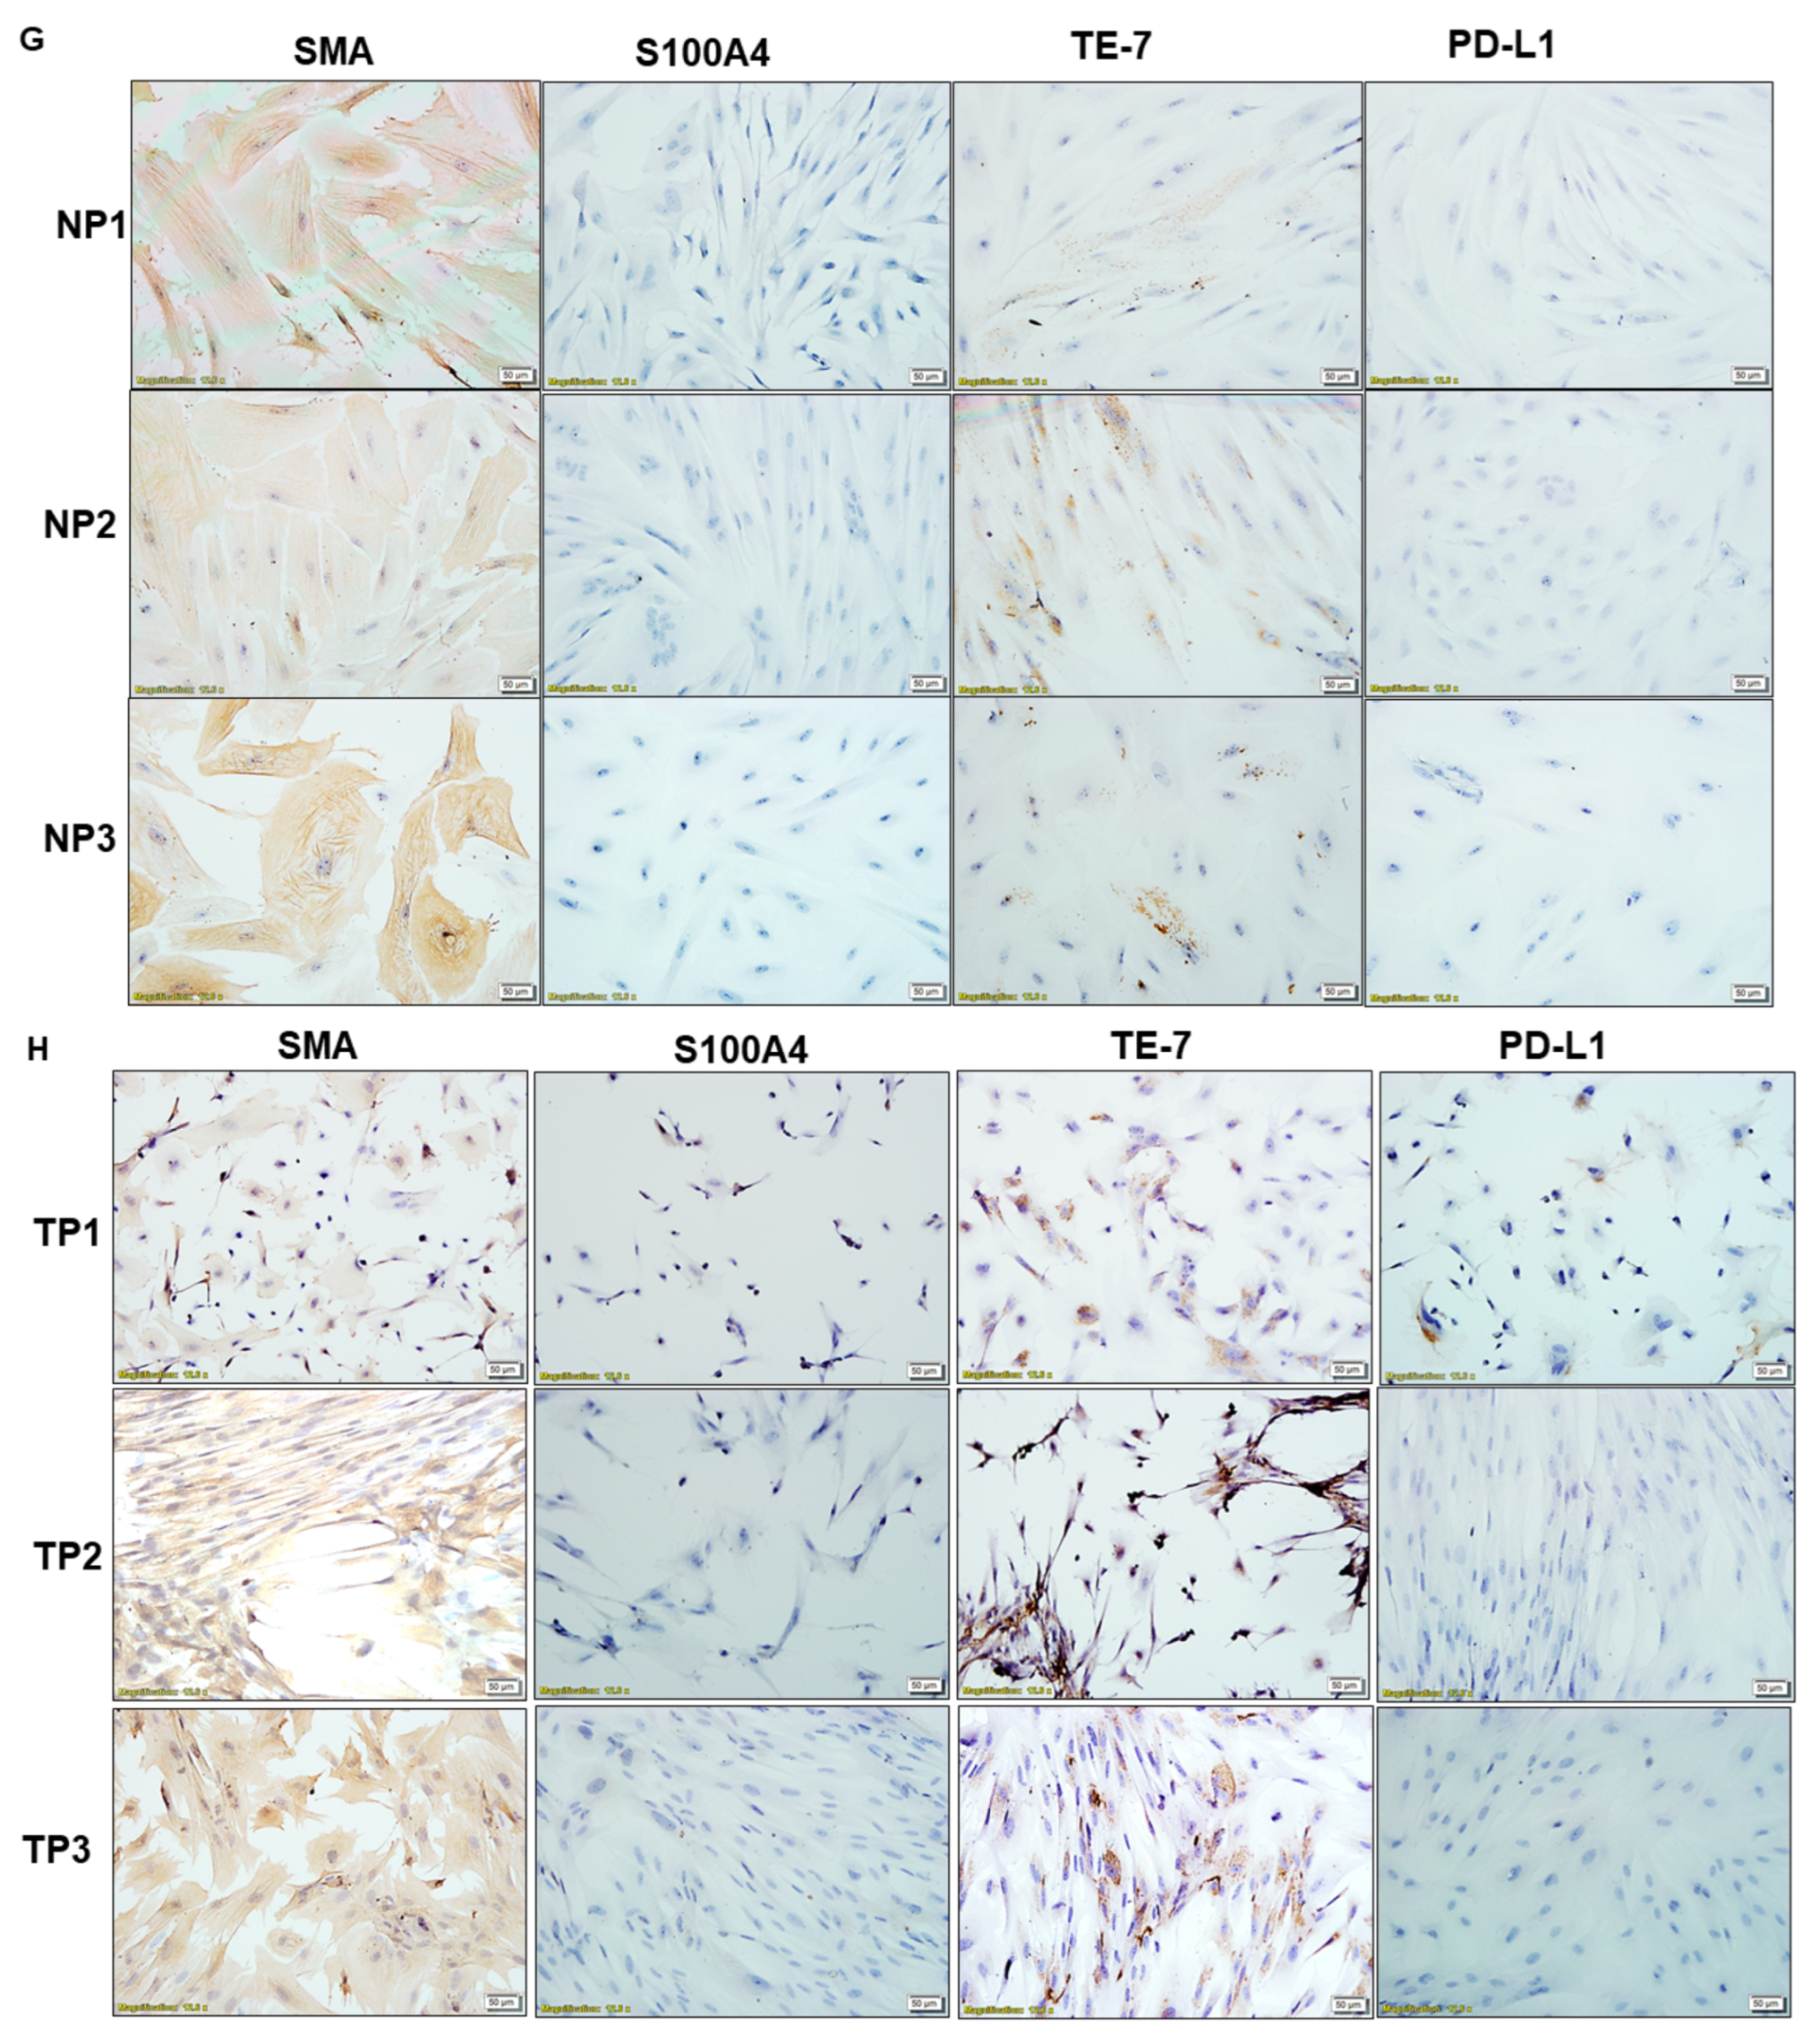
| G | Expression of SMA, S100A4, TE-7, and PD-L1 in NCAF from passages 1, 2, and 3 | Positive expression of SMA, TE-7 and negative expression of S100A4, PD-L1 in NCAF | |
| H | Expression of SMA, S100A4, TE-7, and PD-L1 in TCAF from passages 1, 2, and 3 | Positive expression of SMA, TE-7 and negative expression of S100A4, PD-L1 in TCAF | |
| I | Percentage of expression of epithelial (EpCAM and CK 8,18) and fibroblast (SMA, S100A4, and TE-7) marker proteins by ICC | Both TCAFs and NCAFs are positive for SMA and TE-7 and negative for CK 8, 18, and EpCAM. S100A4 is differentially expressed. | |
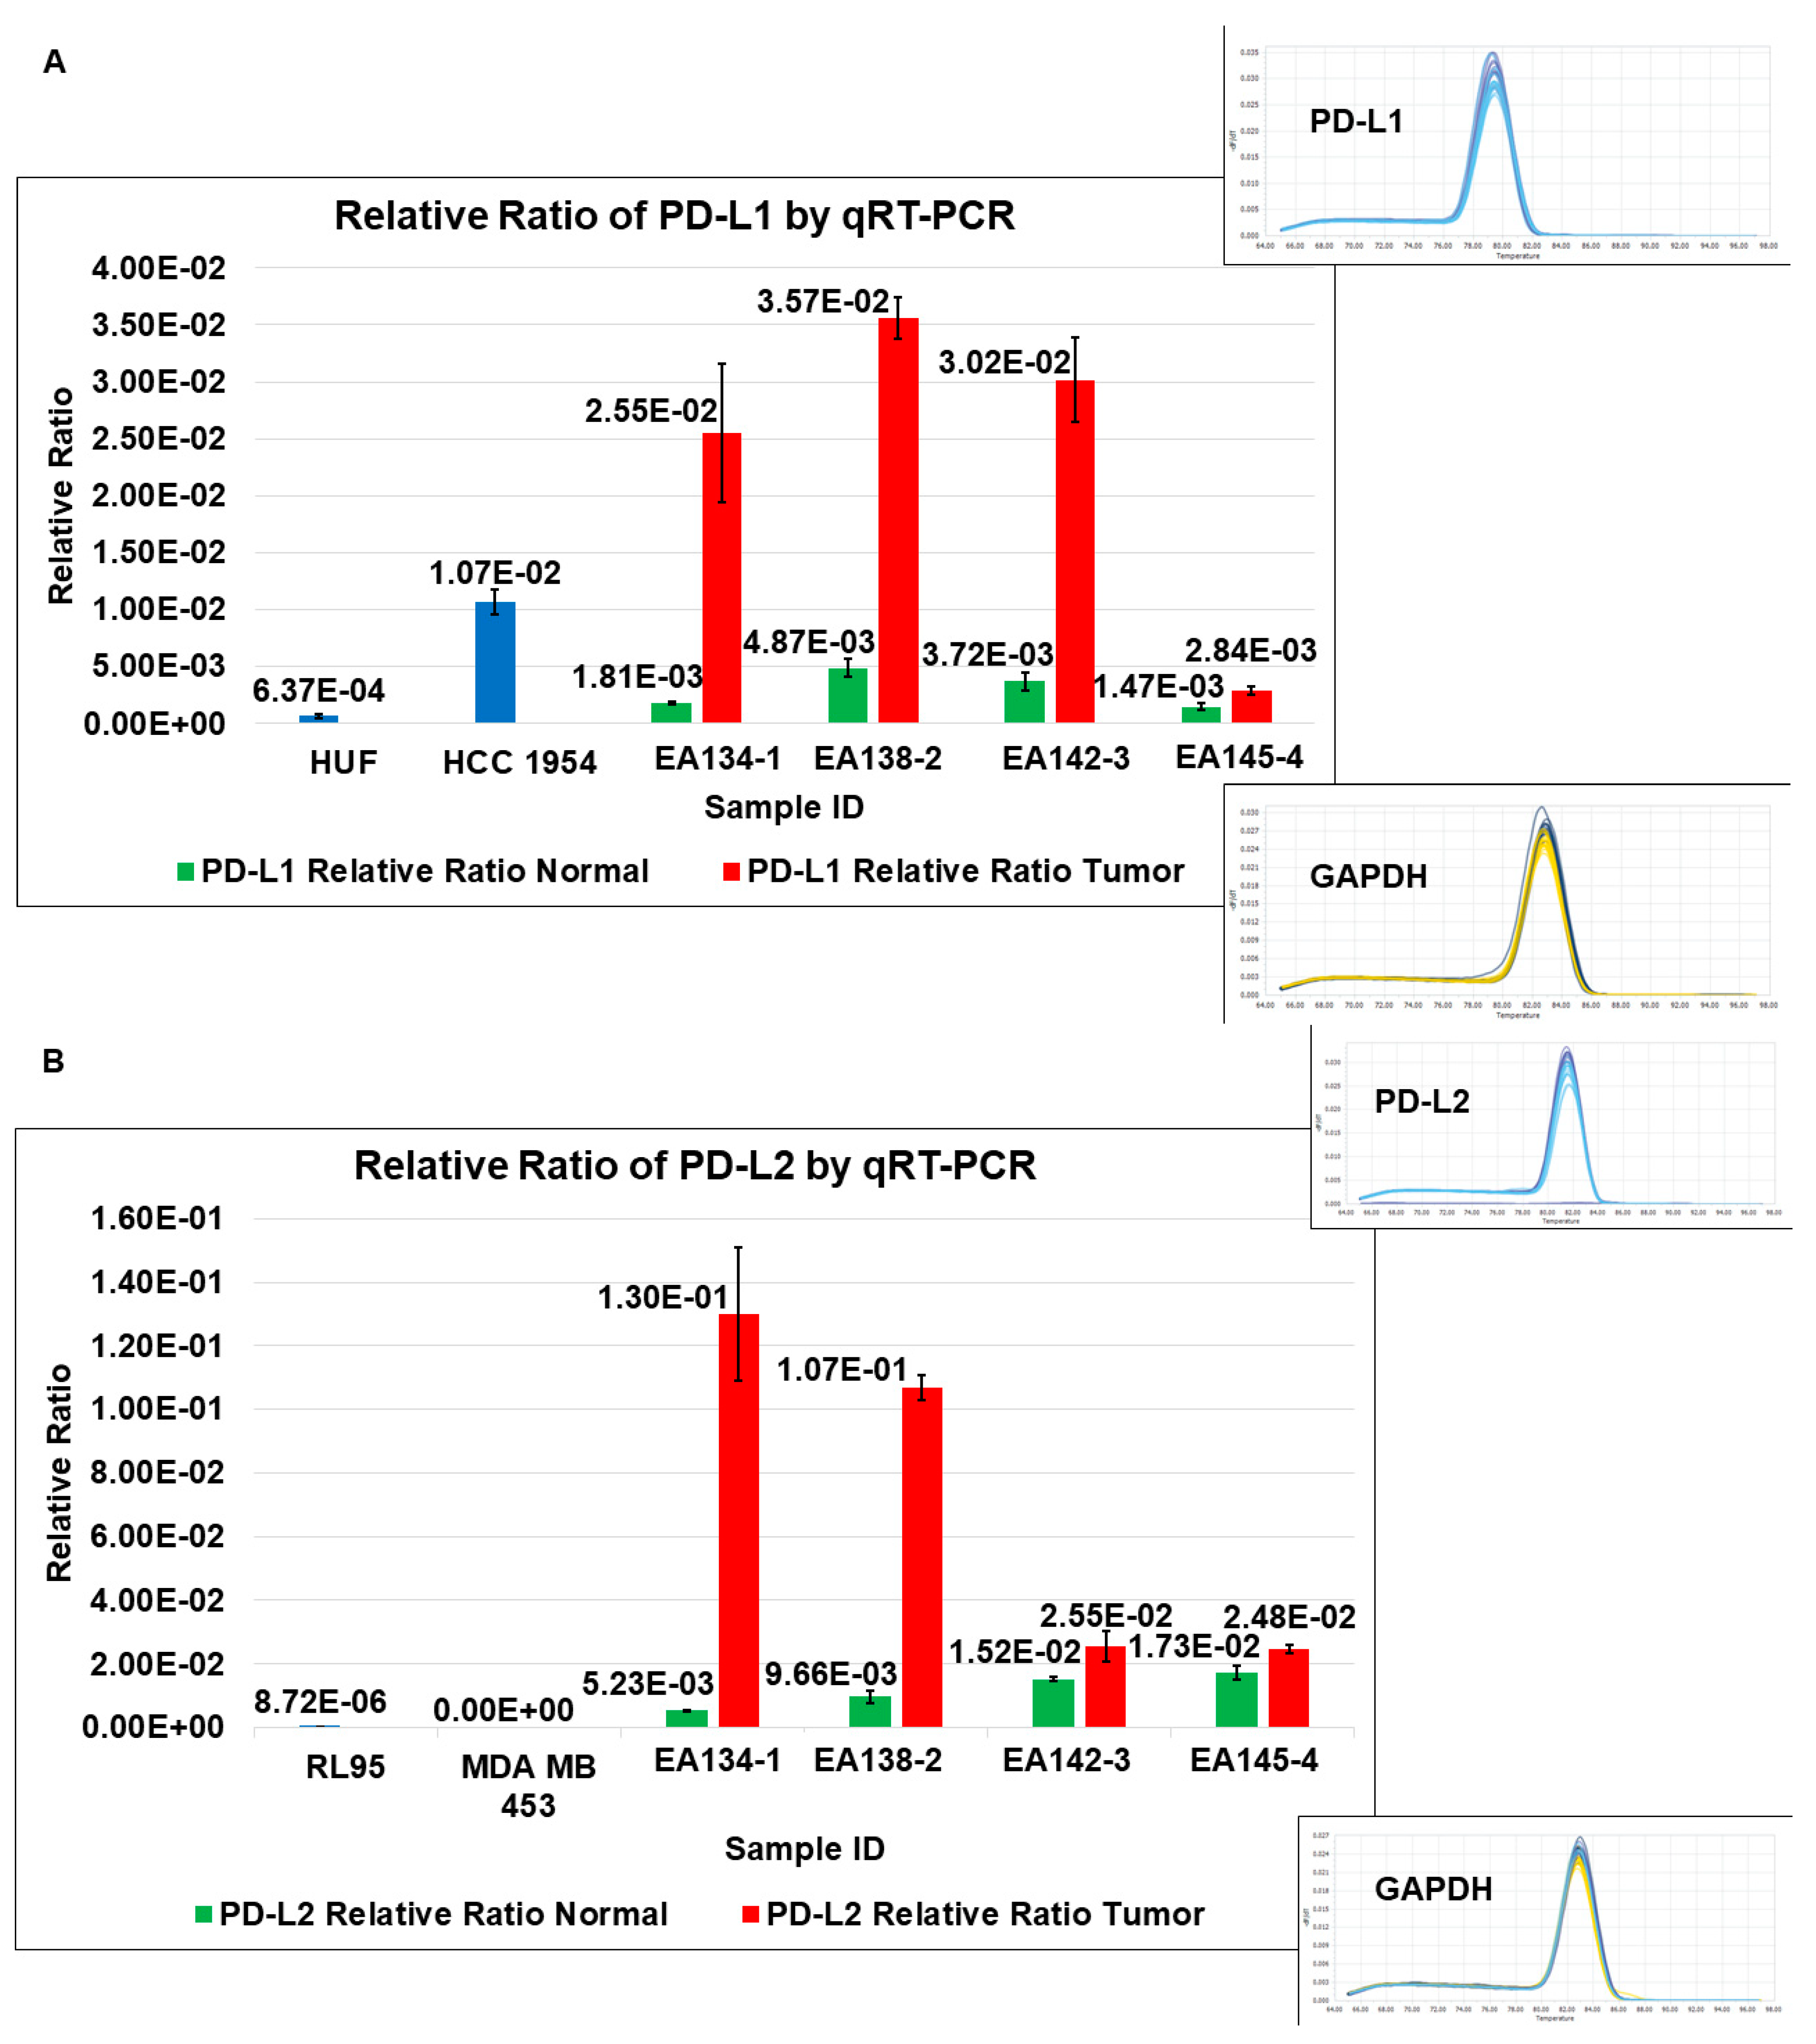
| 4 | A | Relative Ratio of PD-L1 by qRT-PCR | TCAFs tend to express higher levels of PD-L1 mRNA than NCAFs |
| B | Relative Ratio of PD-L2 by qRT-PCR | TCAFs tend to express higher levels of PD-L2 mRNA than NCAFs | |
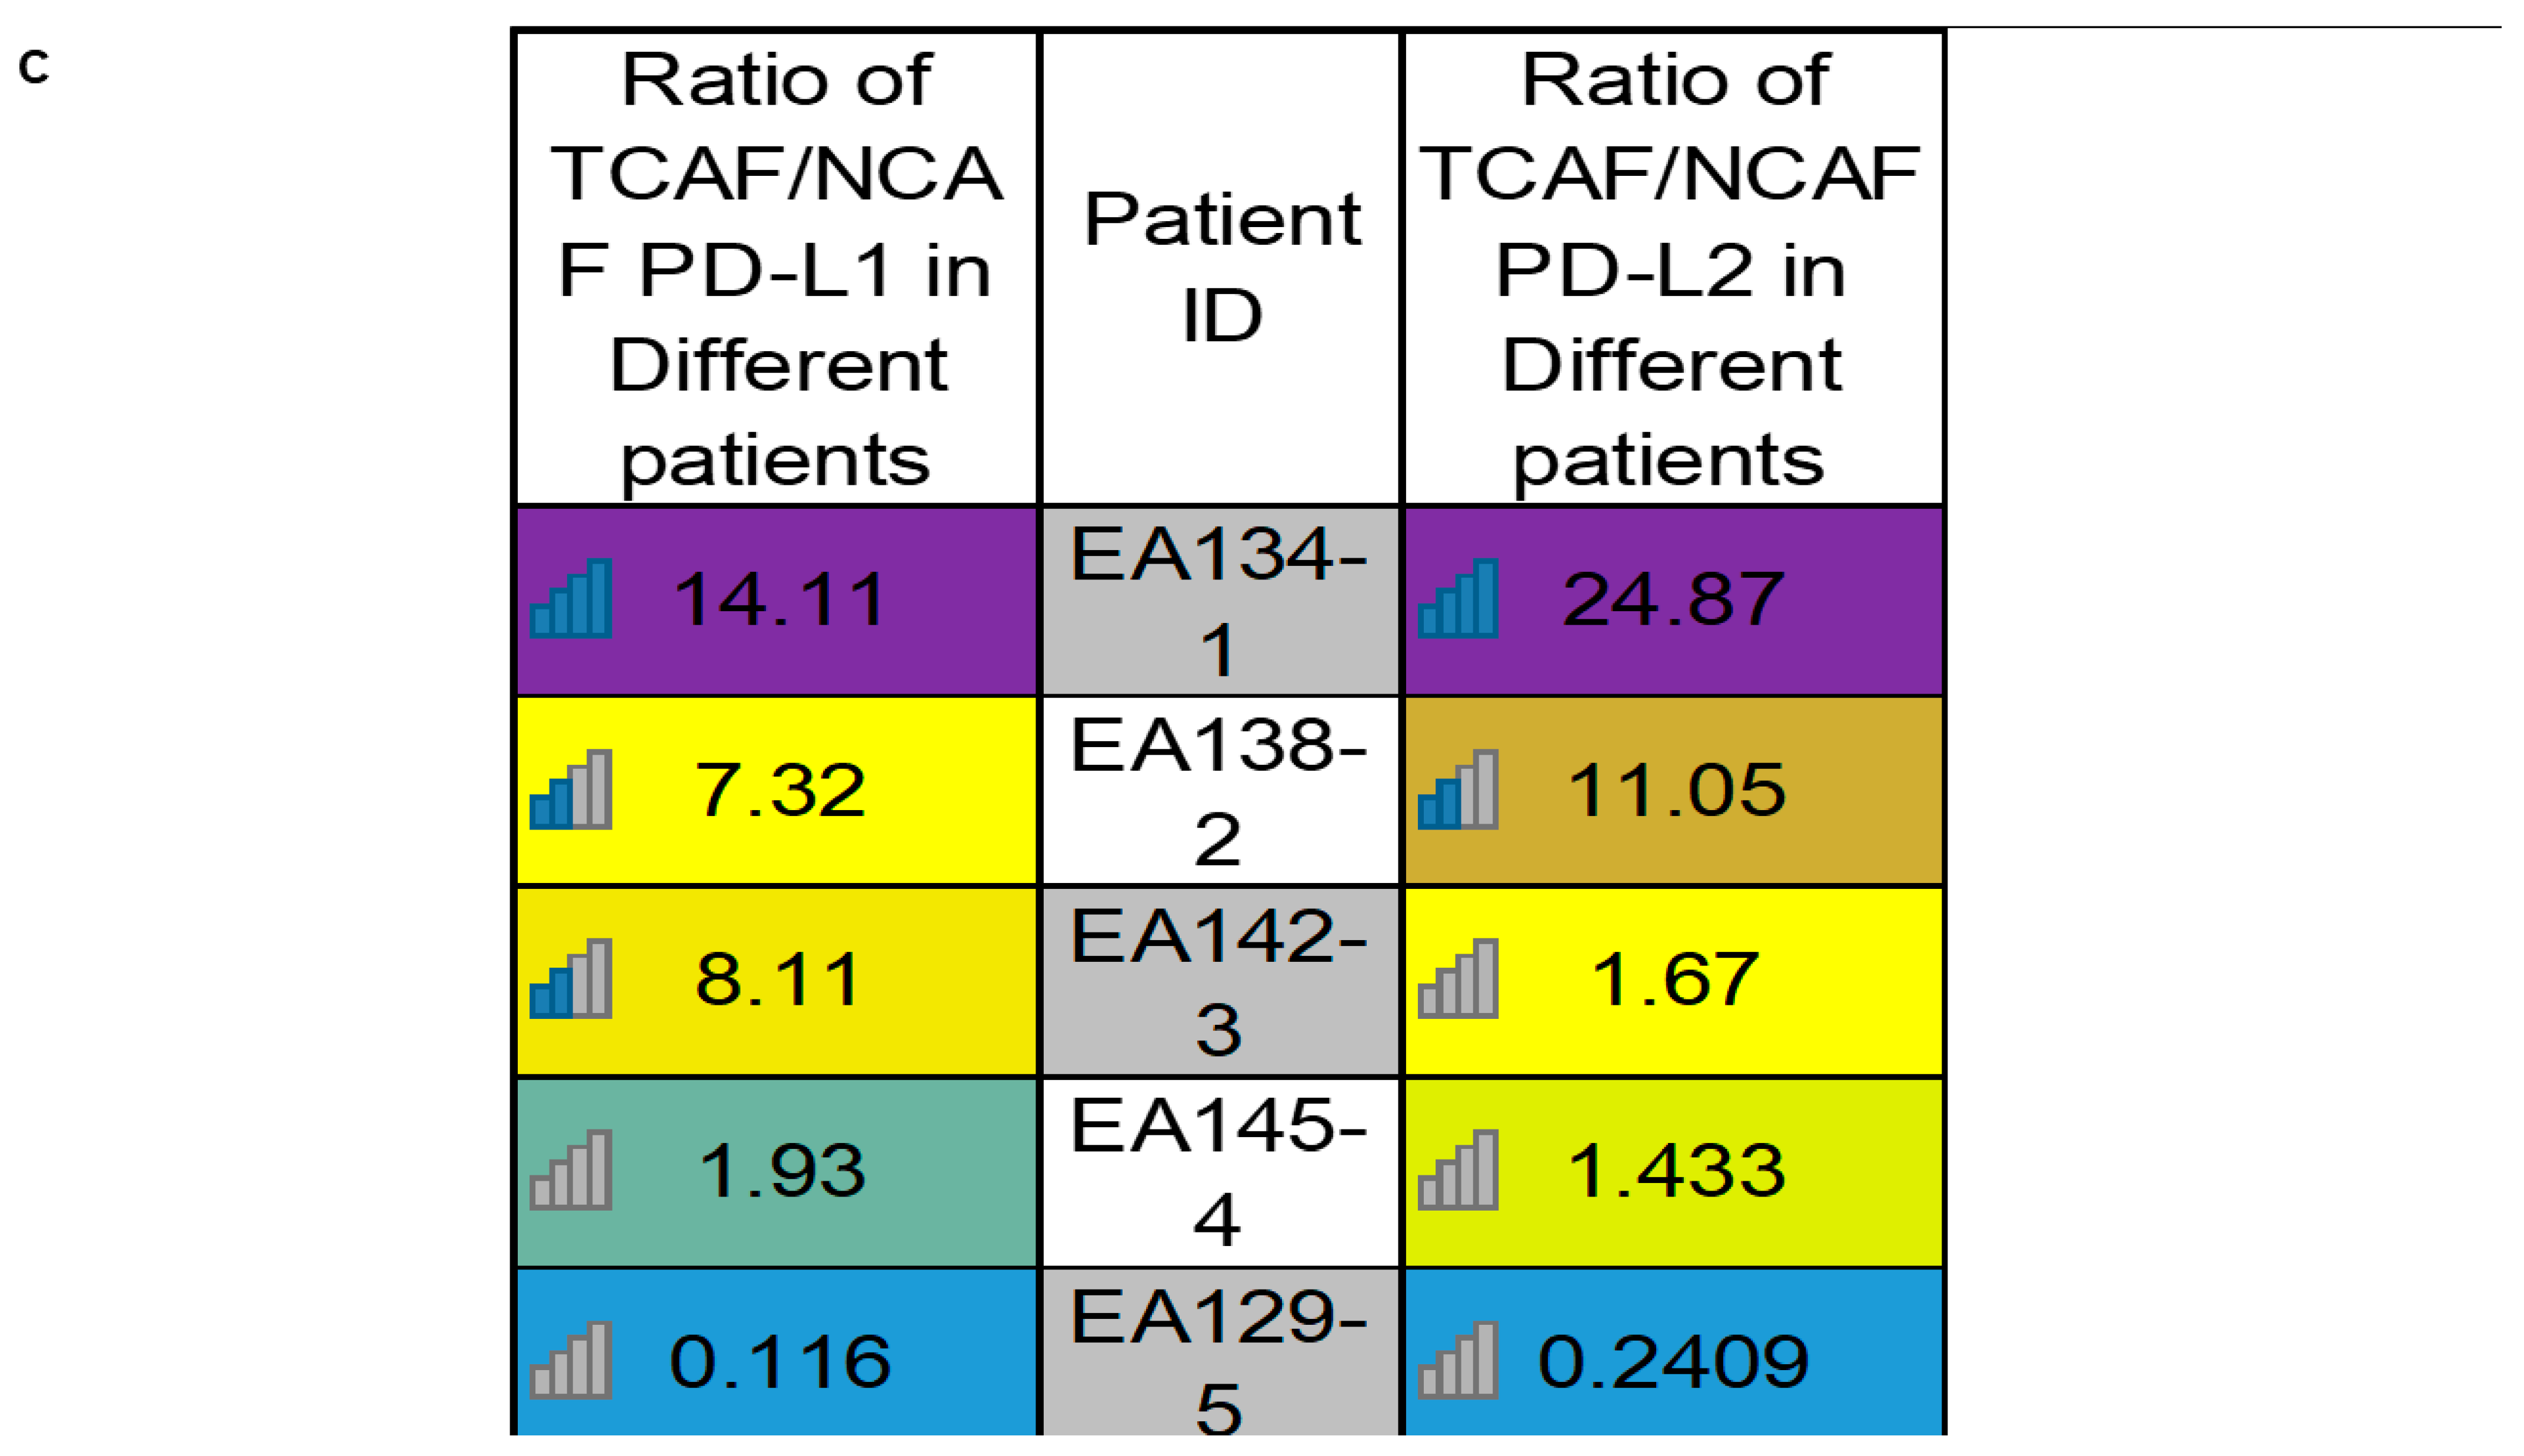
| C | Heatmap of PD-L1 and PD-L2 mRNA expressions in different patients | Ratios of PD-L1 and PD-L2 mRNA expressions in TCAFs/NCAFs pairs are patient-specific. | |
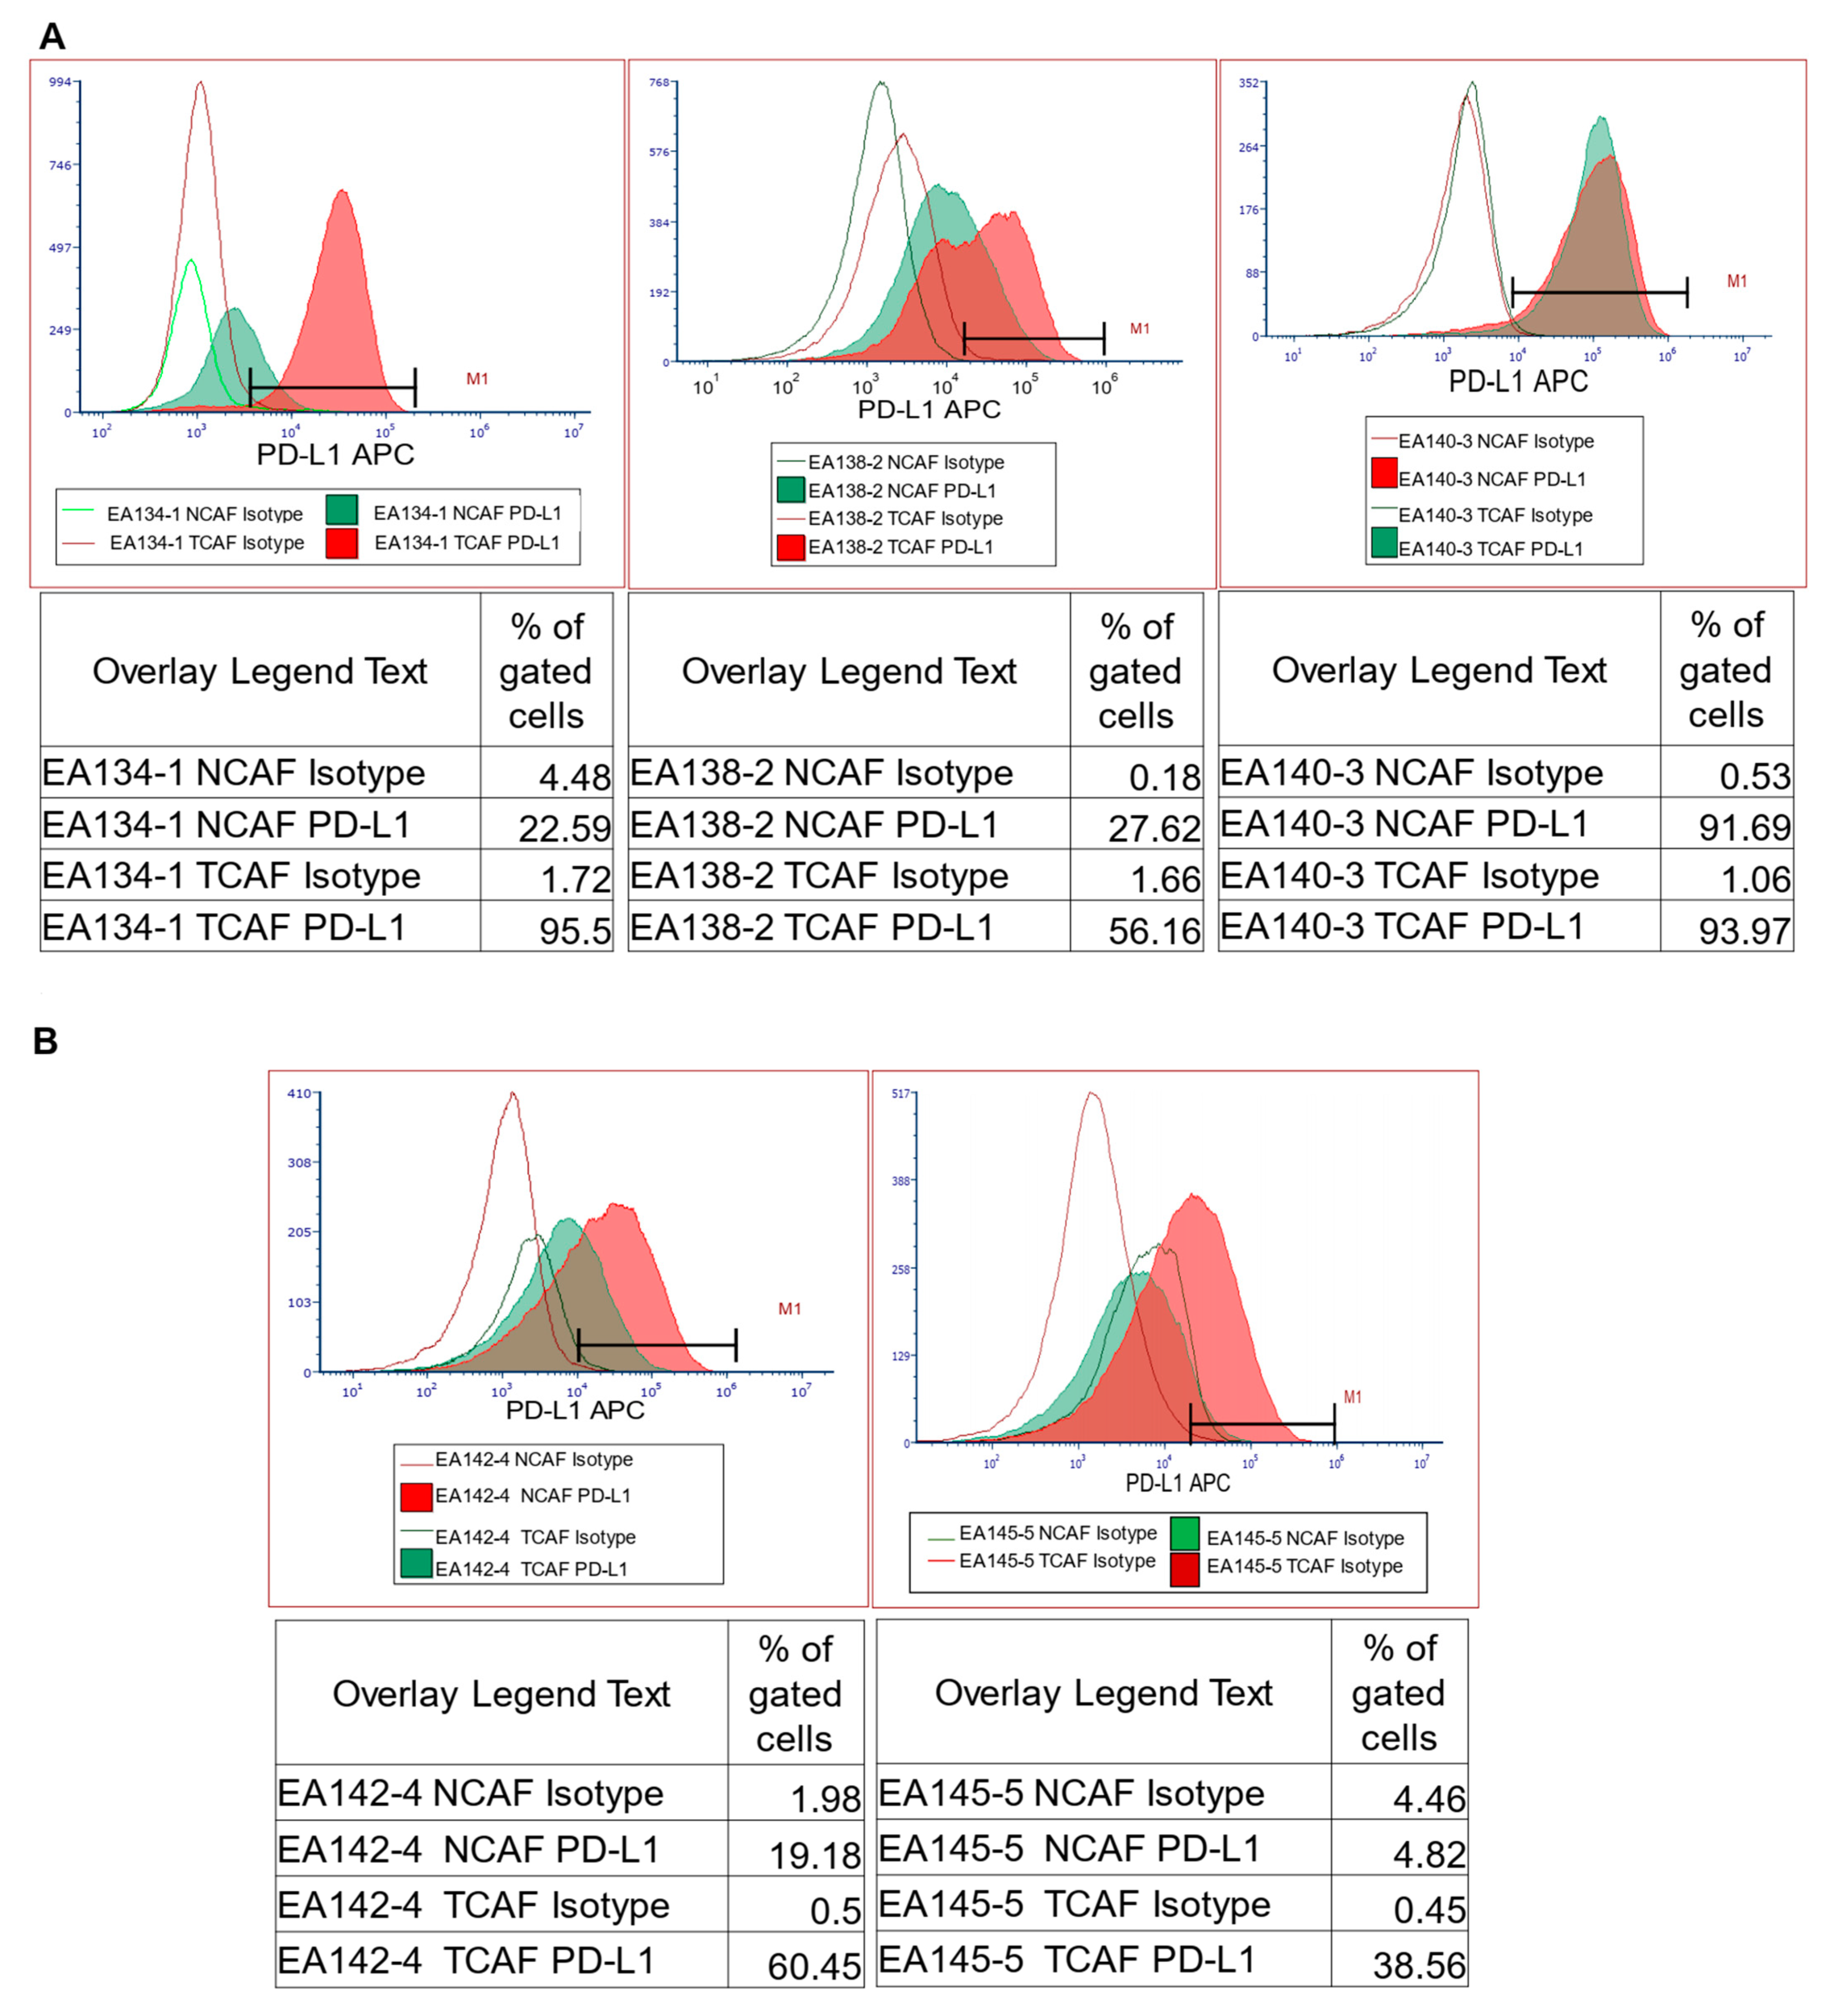
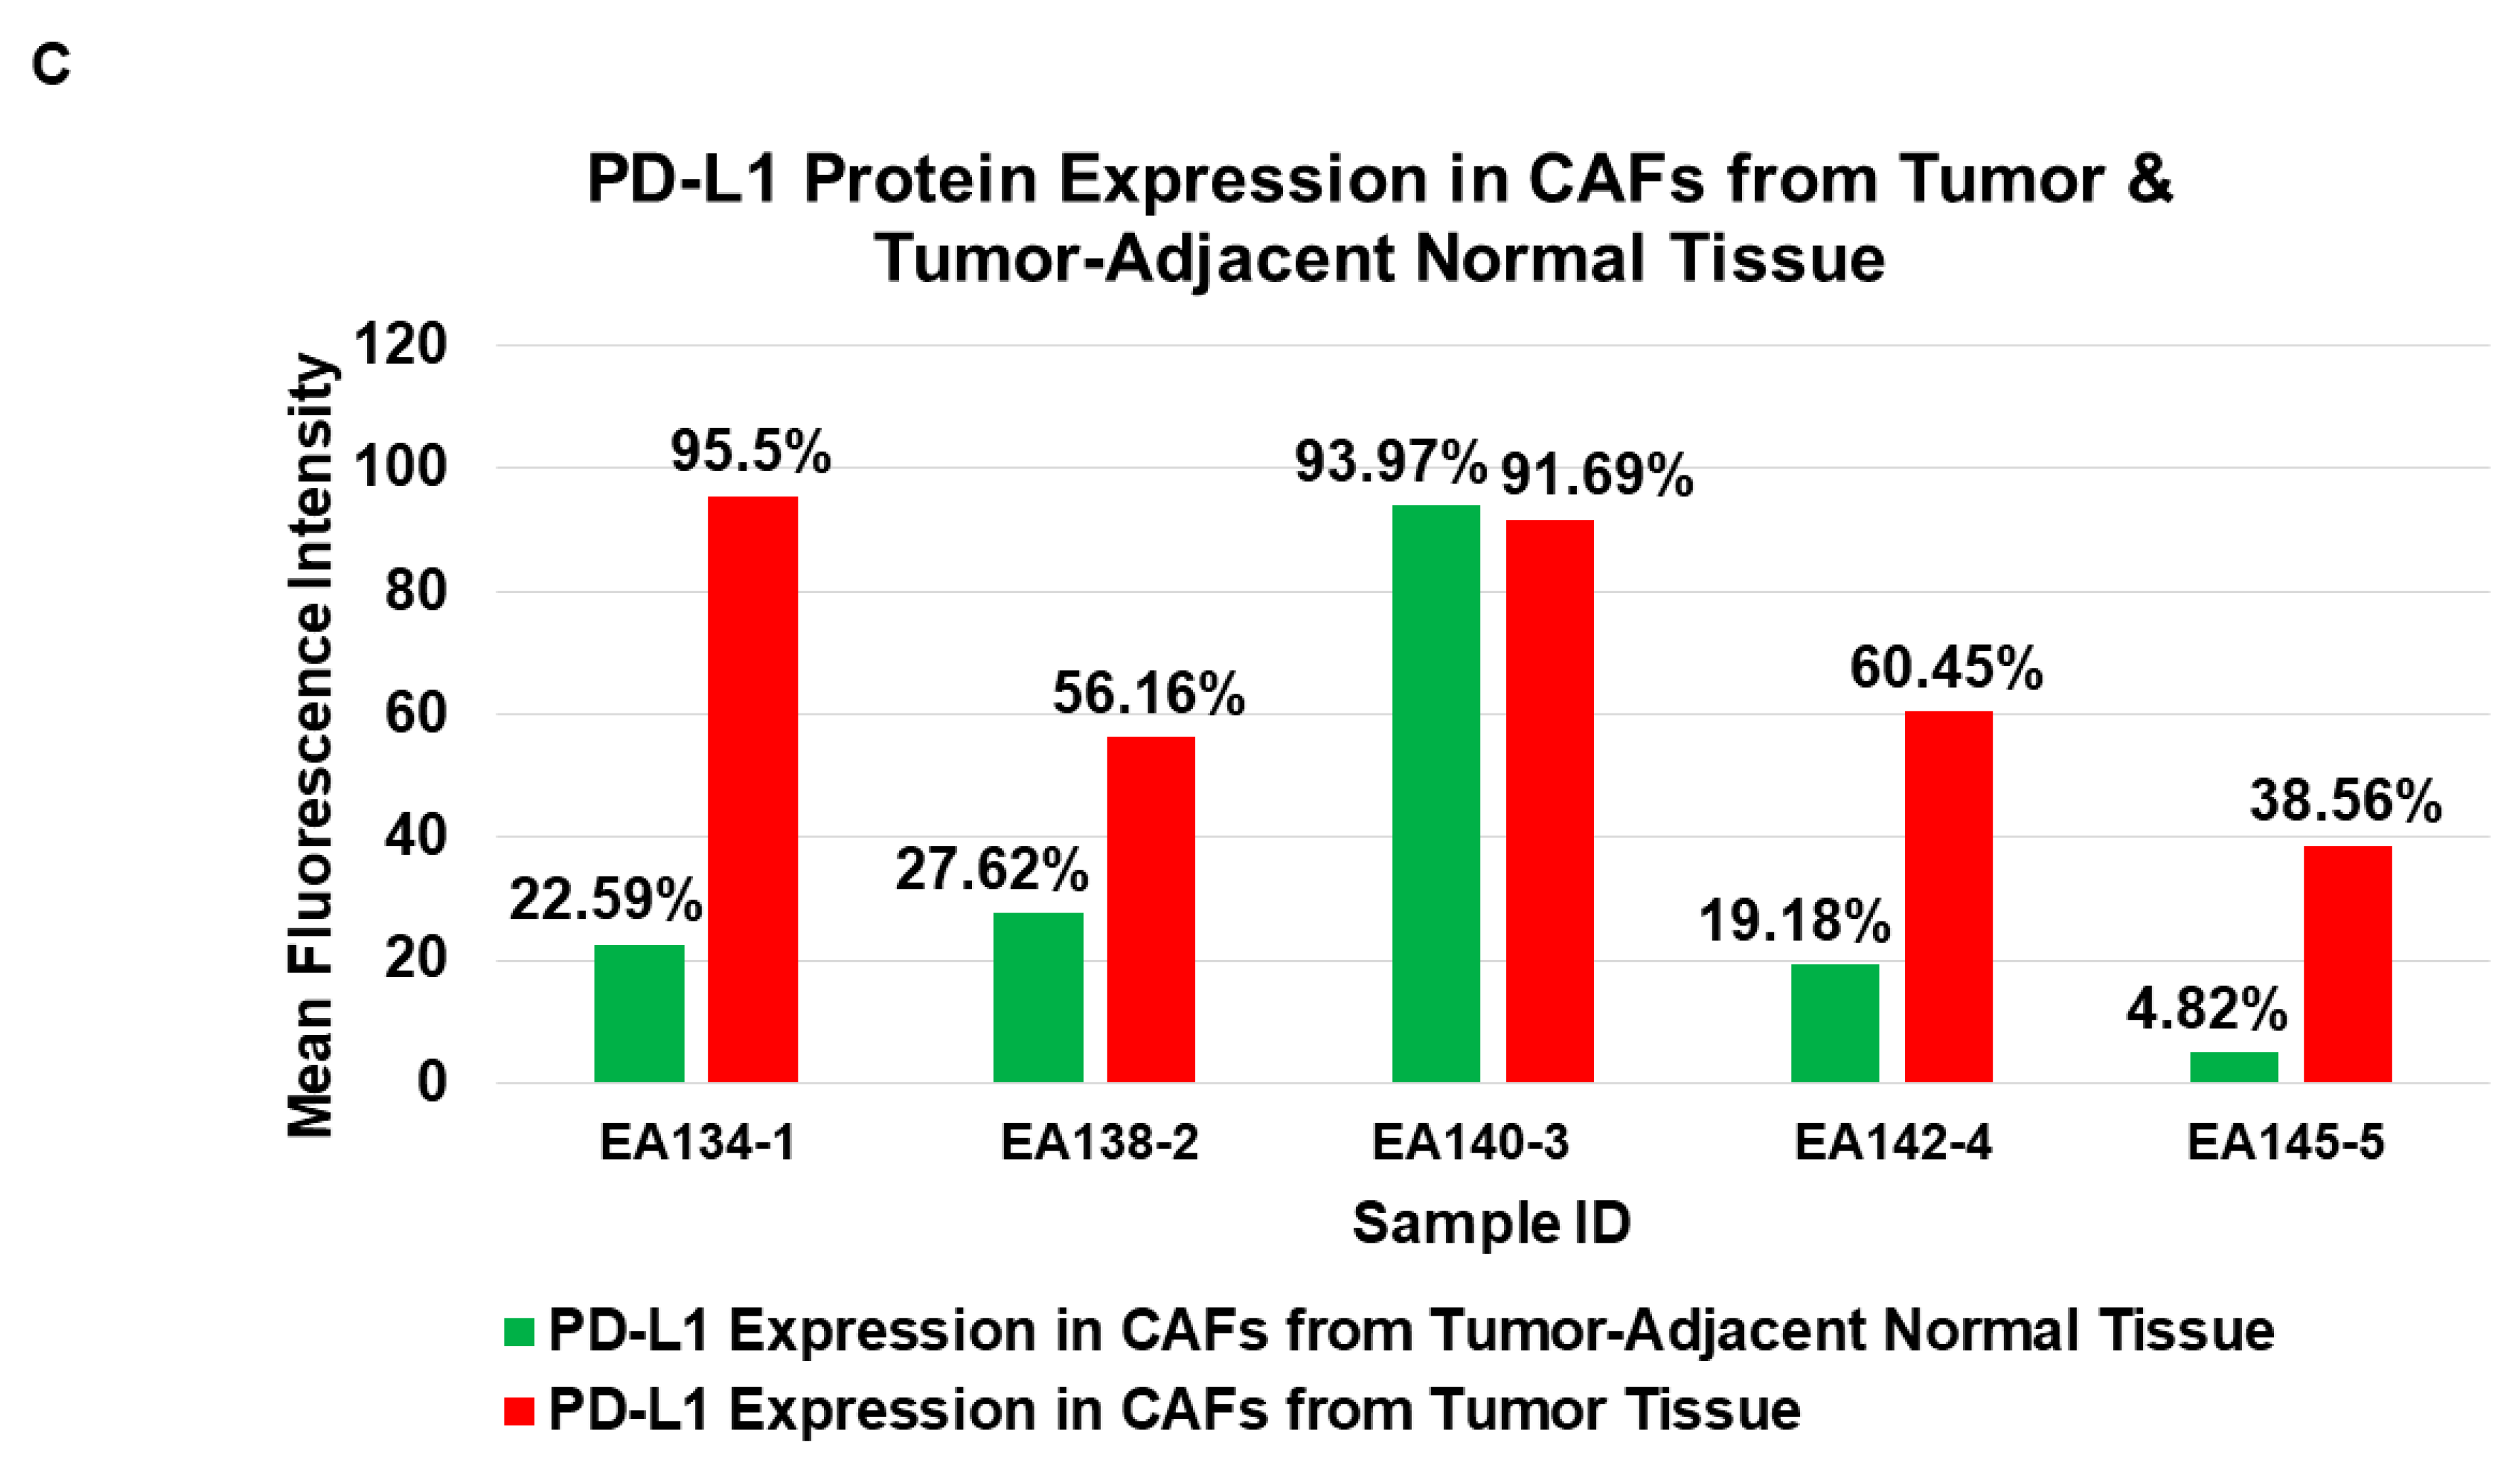
| 5 | A | Flow cytometric expression of PD-L1 in NCAFs and TCAFs pairs | PD-L1 expression tends to be higher in TCAFs compared to TCAFs. |
| B | |||
| C | |||
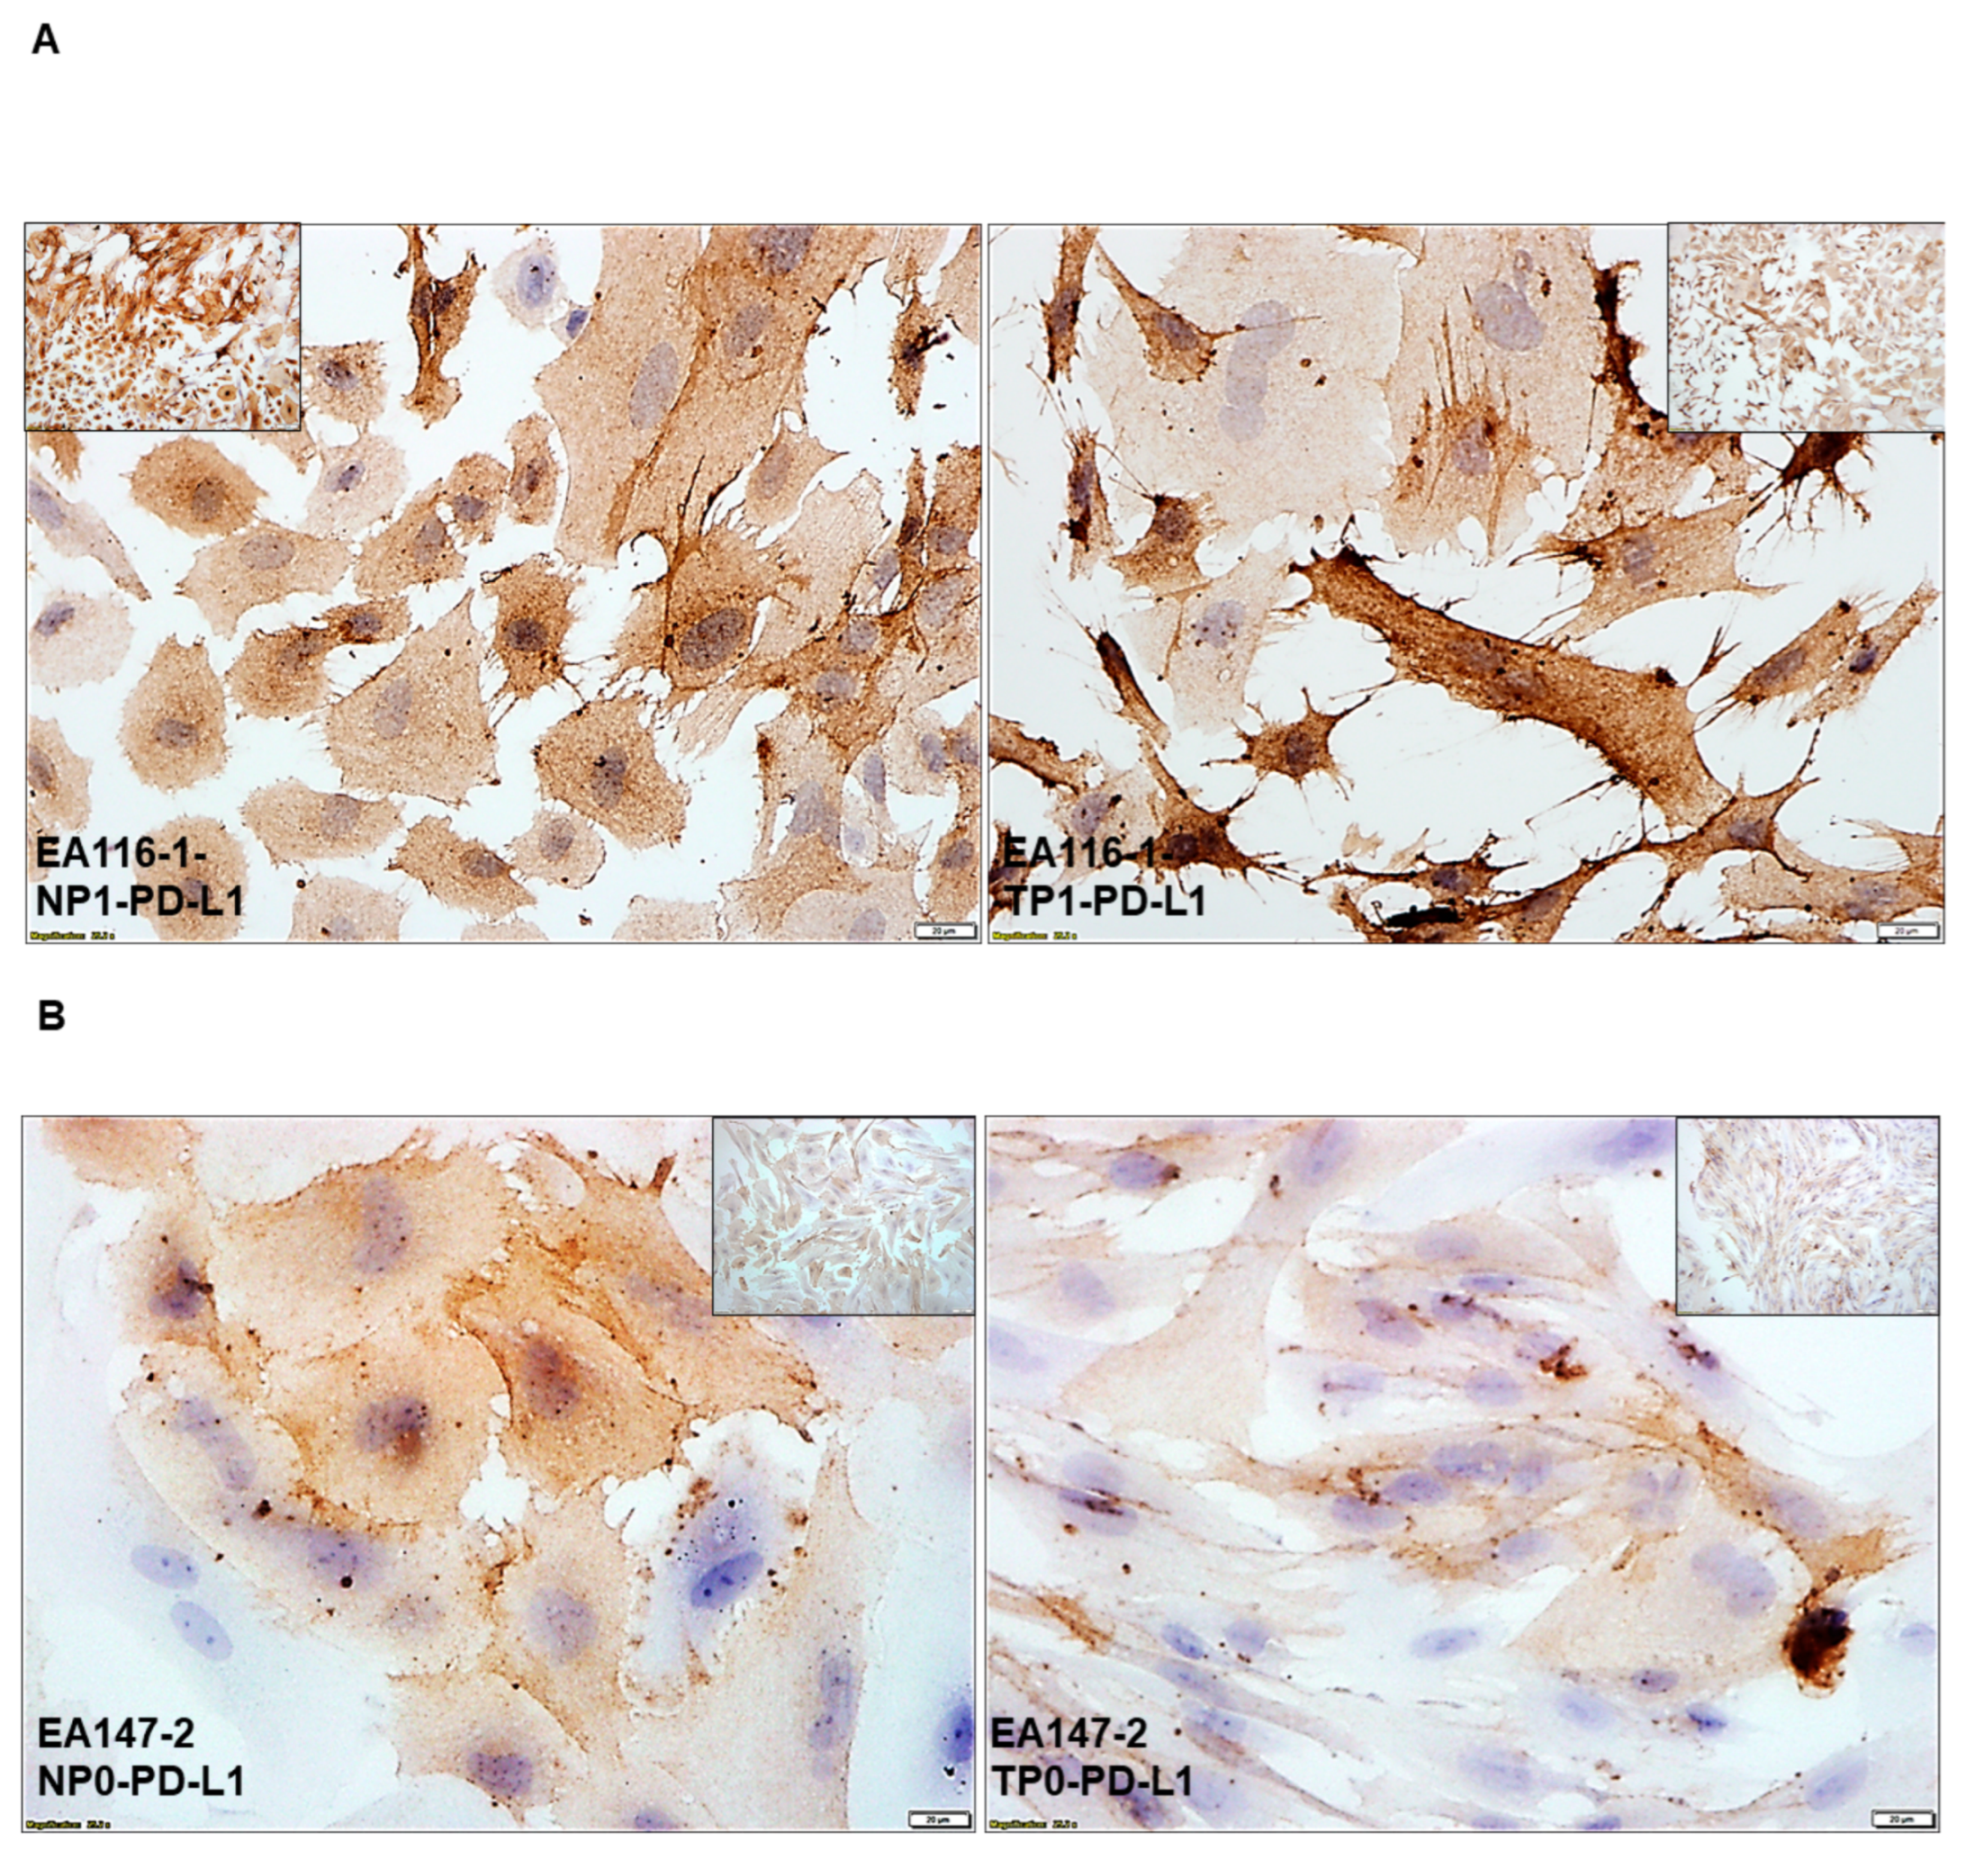
| 6 | A | ICC expression of PD-L1 in TCAF-NCAF pair | PD-L1 is expressed at a comparable level in both NCAFs and TCAFs |
| B | PD-L1 expressed in NCAFs is higher than TCAFs | ||
| C | PD-L1 expressed in TCAFs is higher than NCAFs | ||
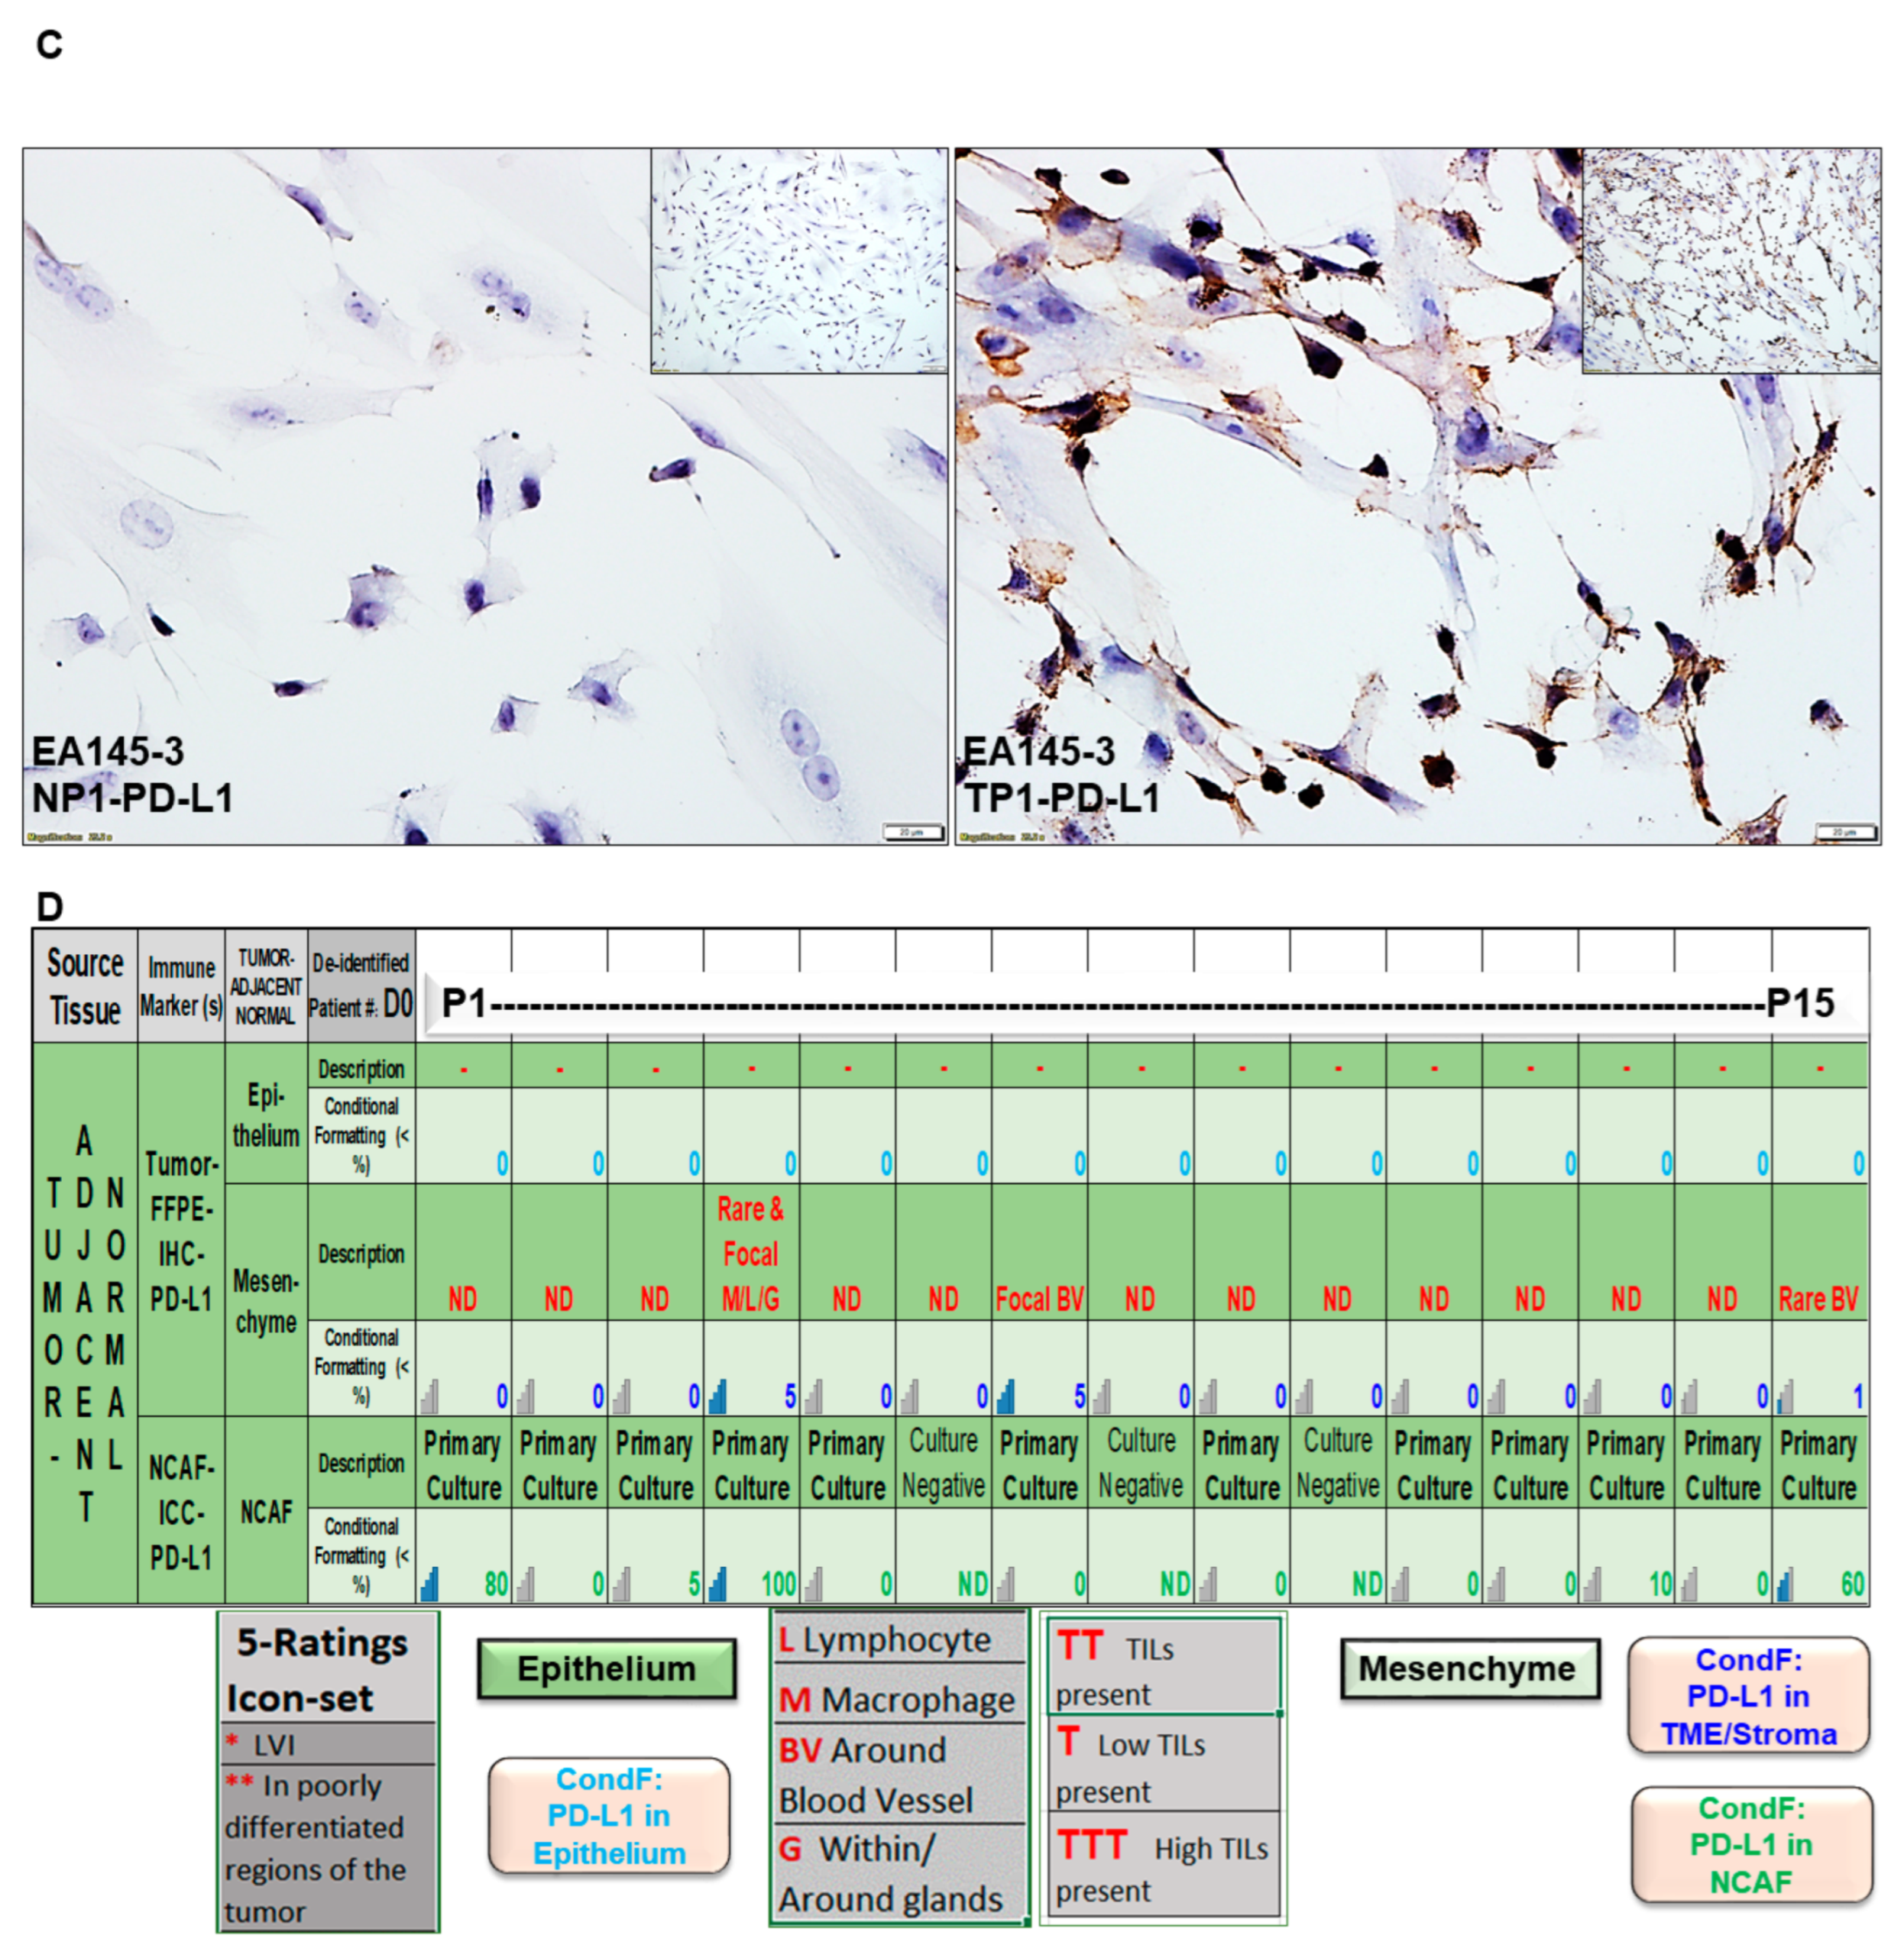
| D | Conditional formatting of the IHC (FFPE of tumor-adjacent normal epithelium/mesenchyme) vs. ICC (NCAFs) expression of PD-L1 in normal epithelium and mesenchyme in the same patient | The epithelium is rarely positive for PD-L1 compared to NCAFs in the same patient. | |
| E | Conditional formatting of the IHC (FFPE of tumor/TME) vs. ICC (TCAFs) expression of PD-L1 in tumor cells and TME in the same patient | Expression of PD-L1 in TCAFs is higher than tumor/TME in the same patient. | |
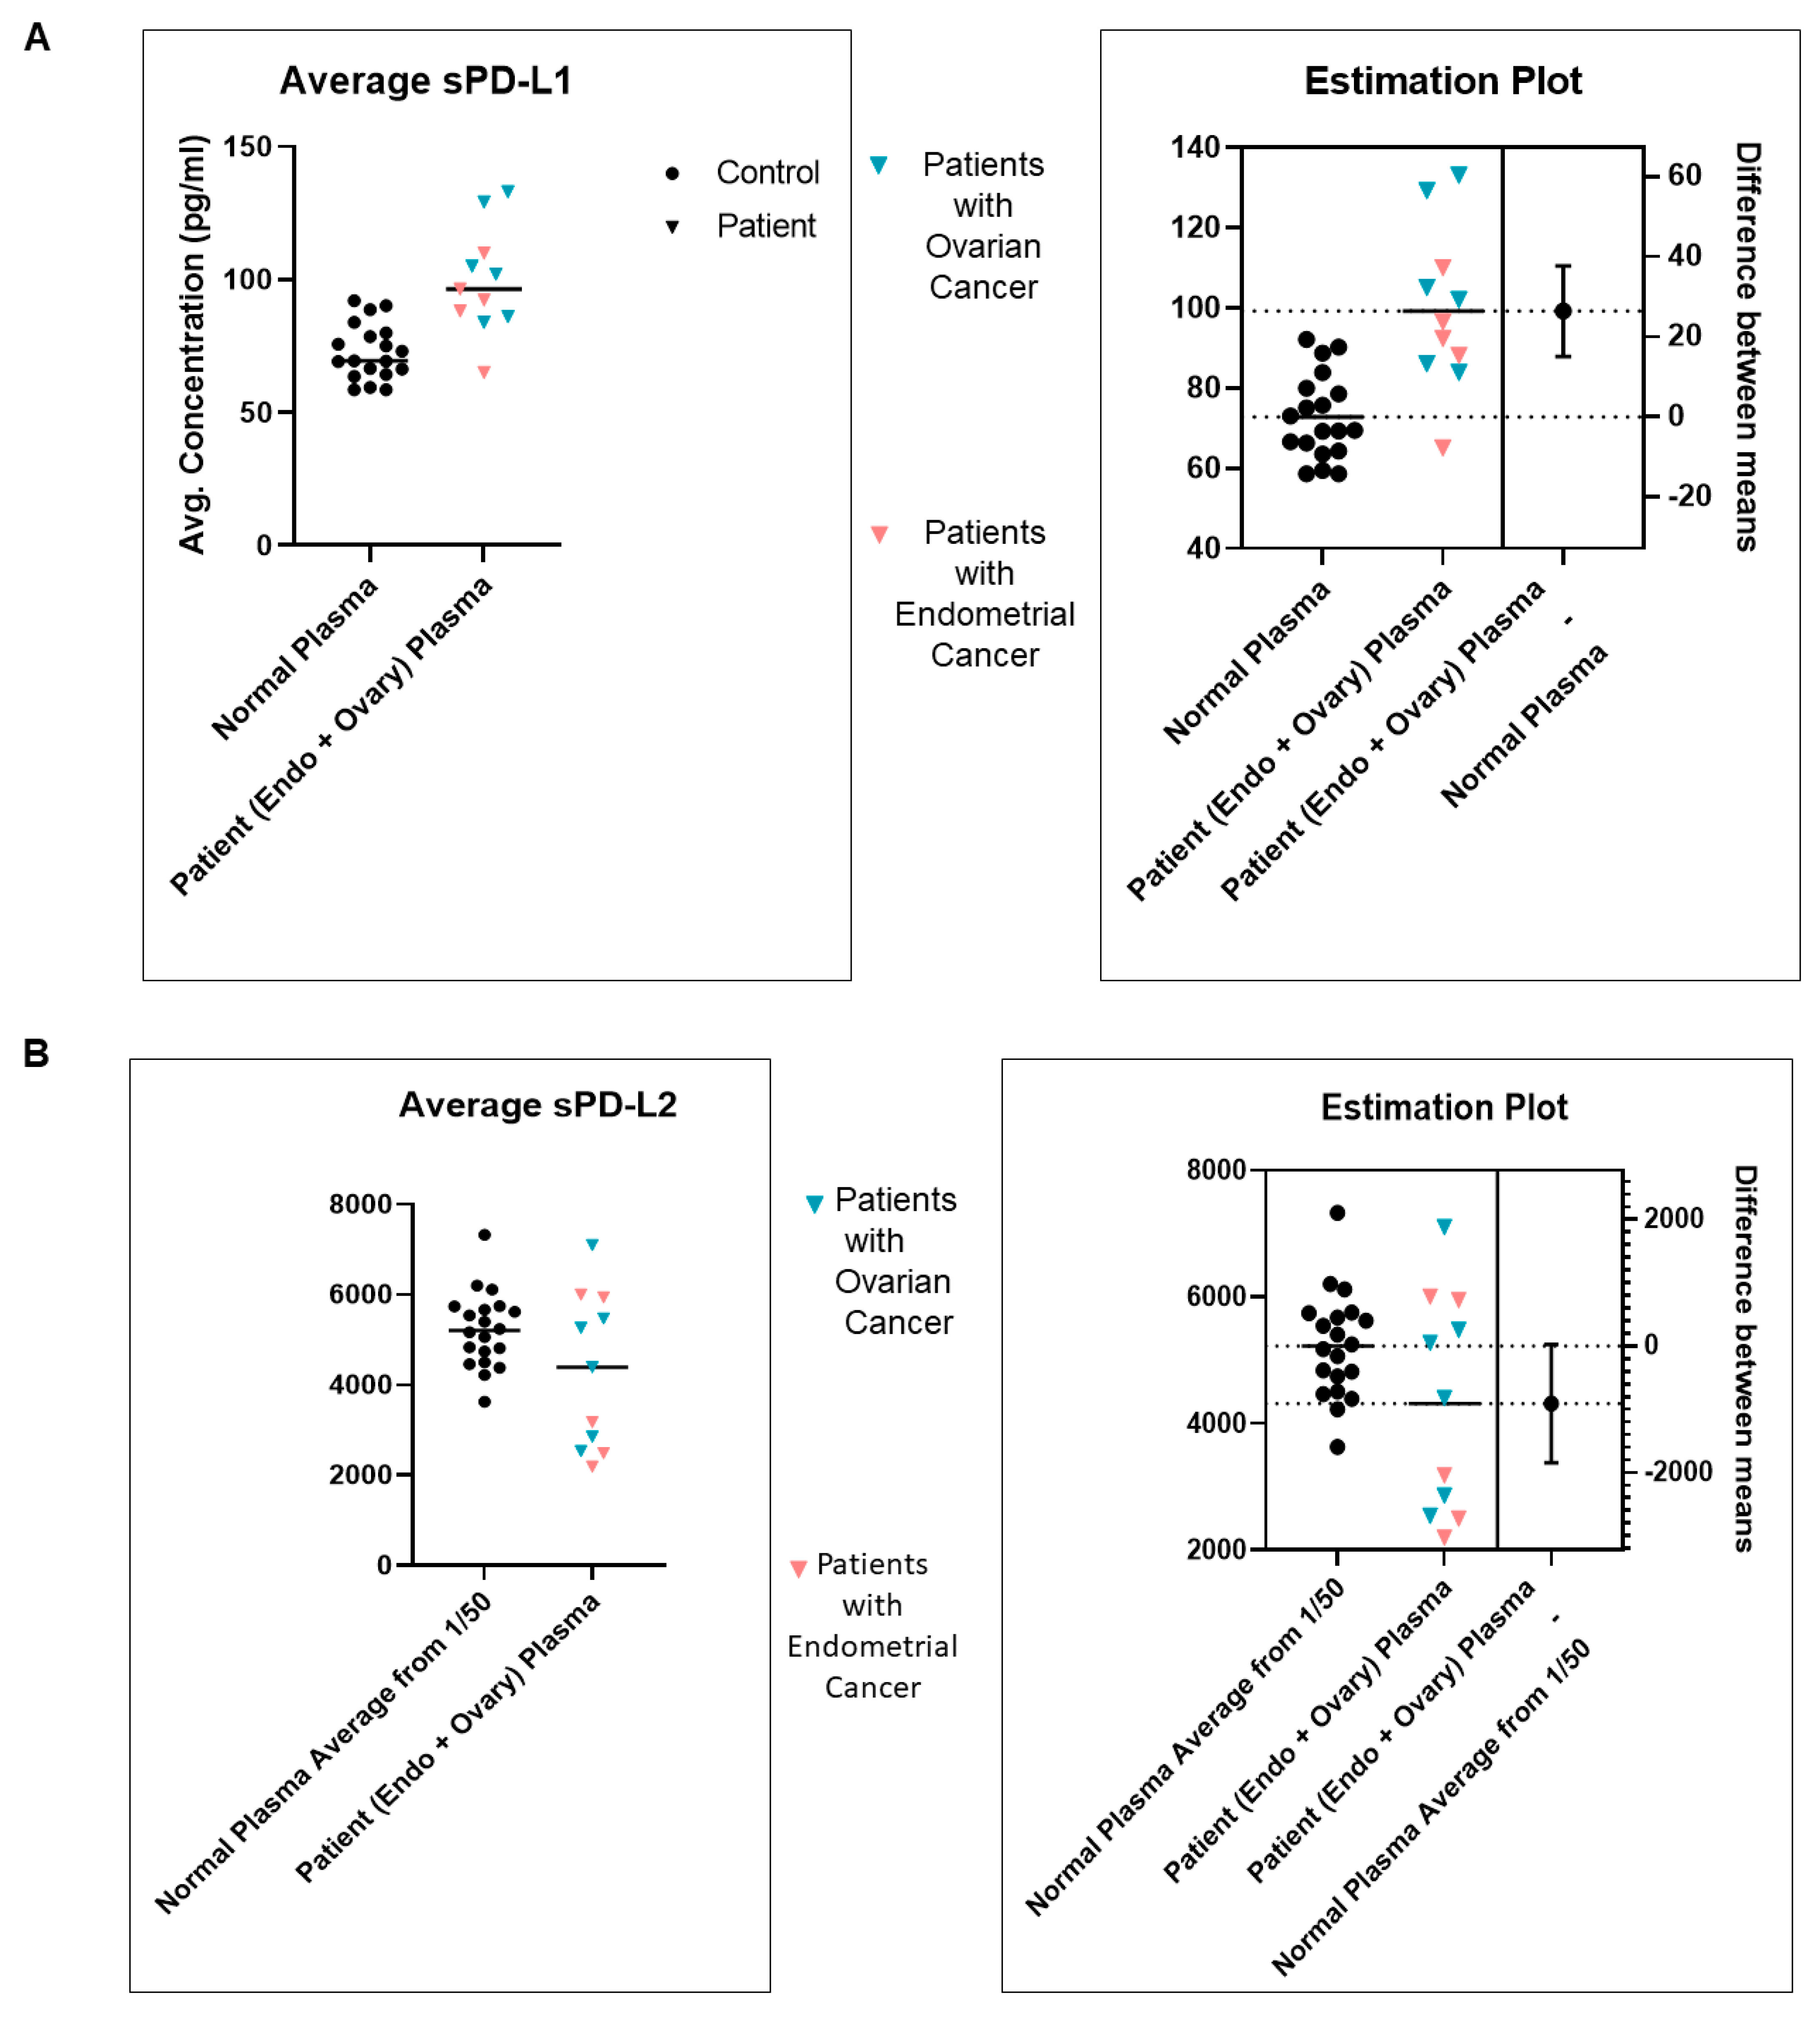
| 7 | A | Standardization of sPD-L1 from plasma of blood from patients with EC as compared to the normal subjects | sPD-L1 from the plasma of blood from patients with EC is higher than sPD-L1 from the blood of healthy normal subjects |
| B | Standardization of sPD-L2 from plasma of blood from patients with EC as compared to the normal subjects | sPD-L2 from the plasma of blood from patients with EC is comparable to sPD-L2 from the blood of healthy normal subjects | |
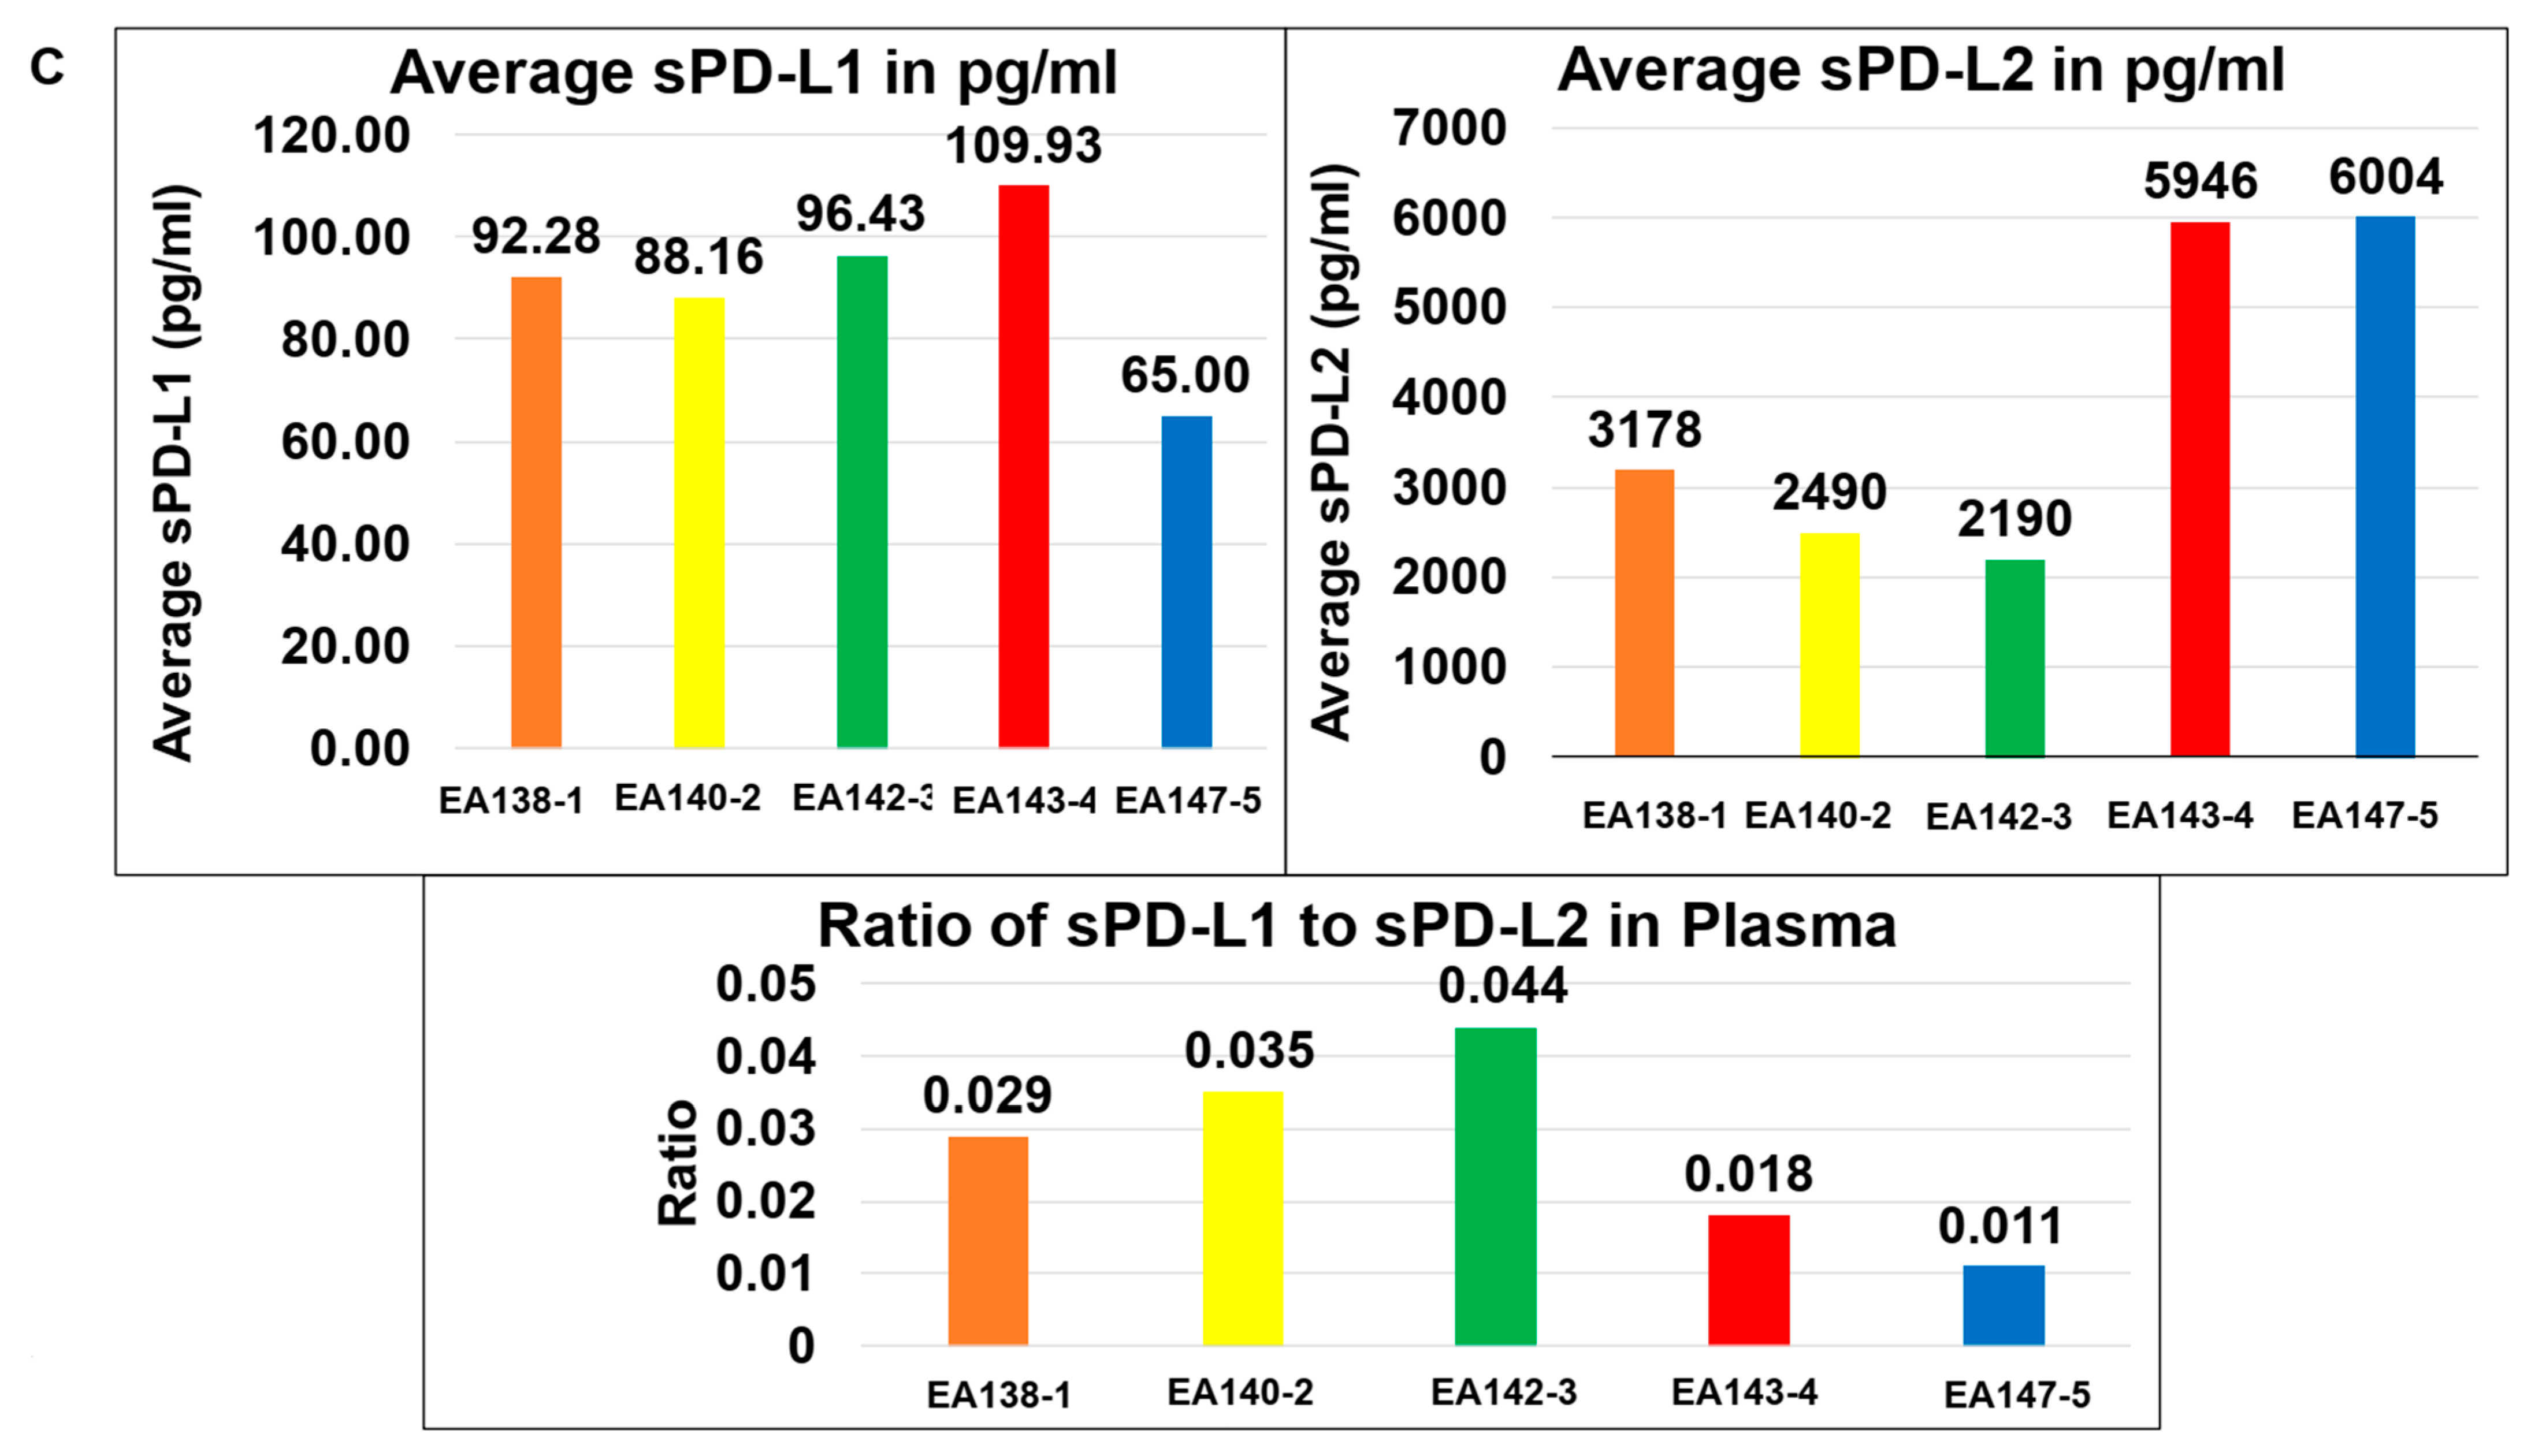
| C | The ratio of sPD-L1 to sPD-L2 in the Plasma of patients with EC | The average sPD-L1 is lower than the average sPD-L2 in the Plasma of patients with EC. | |
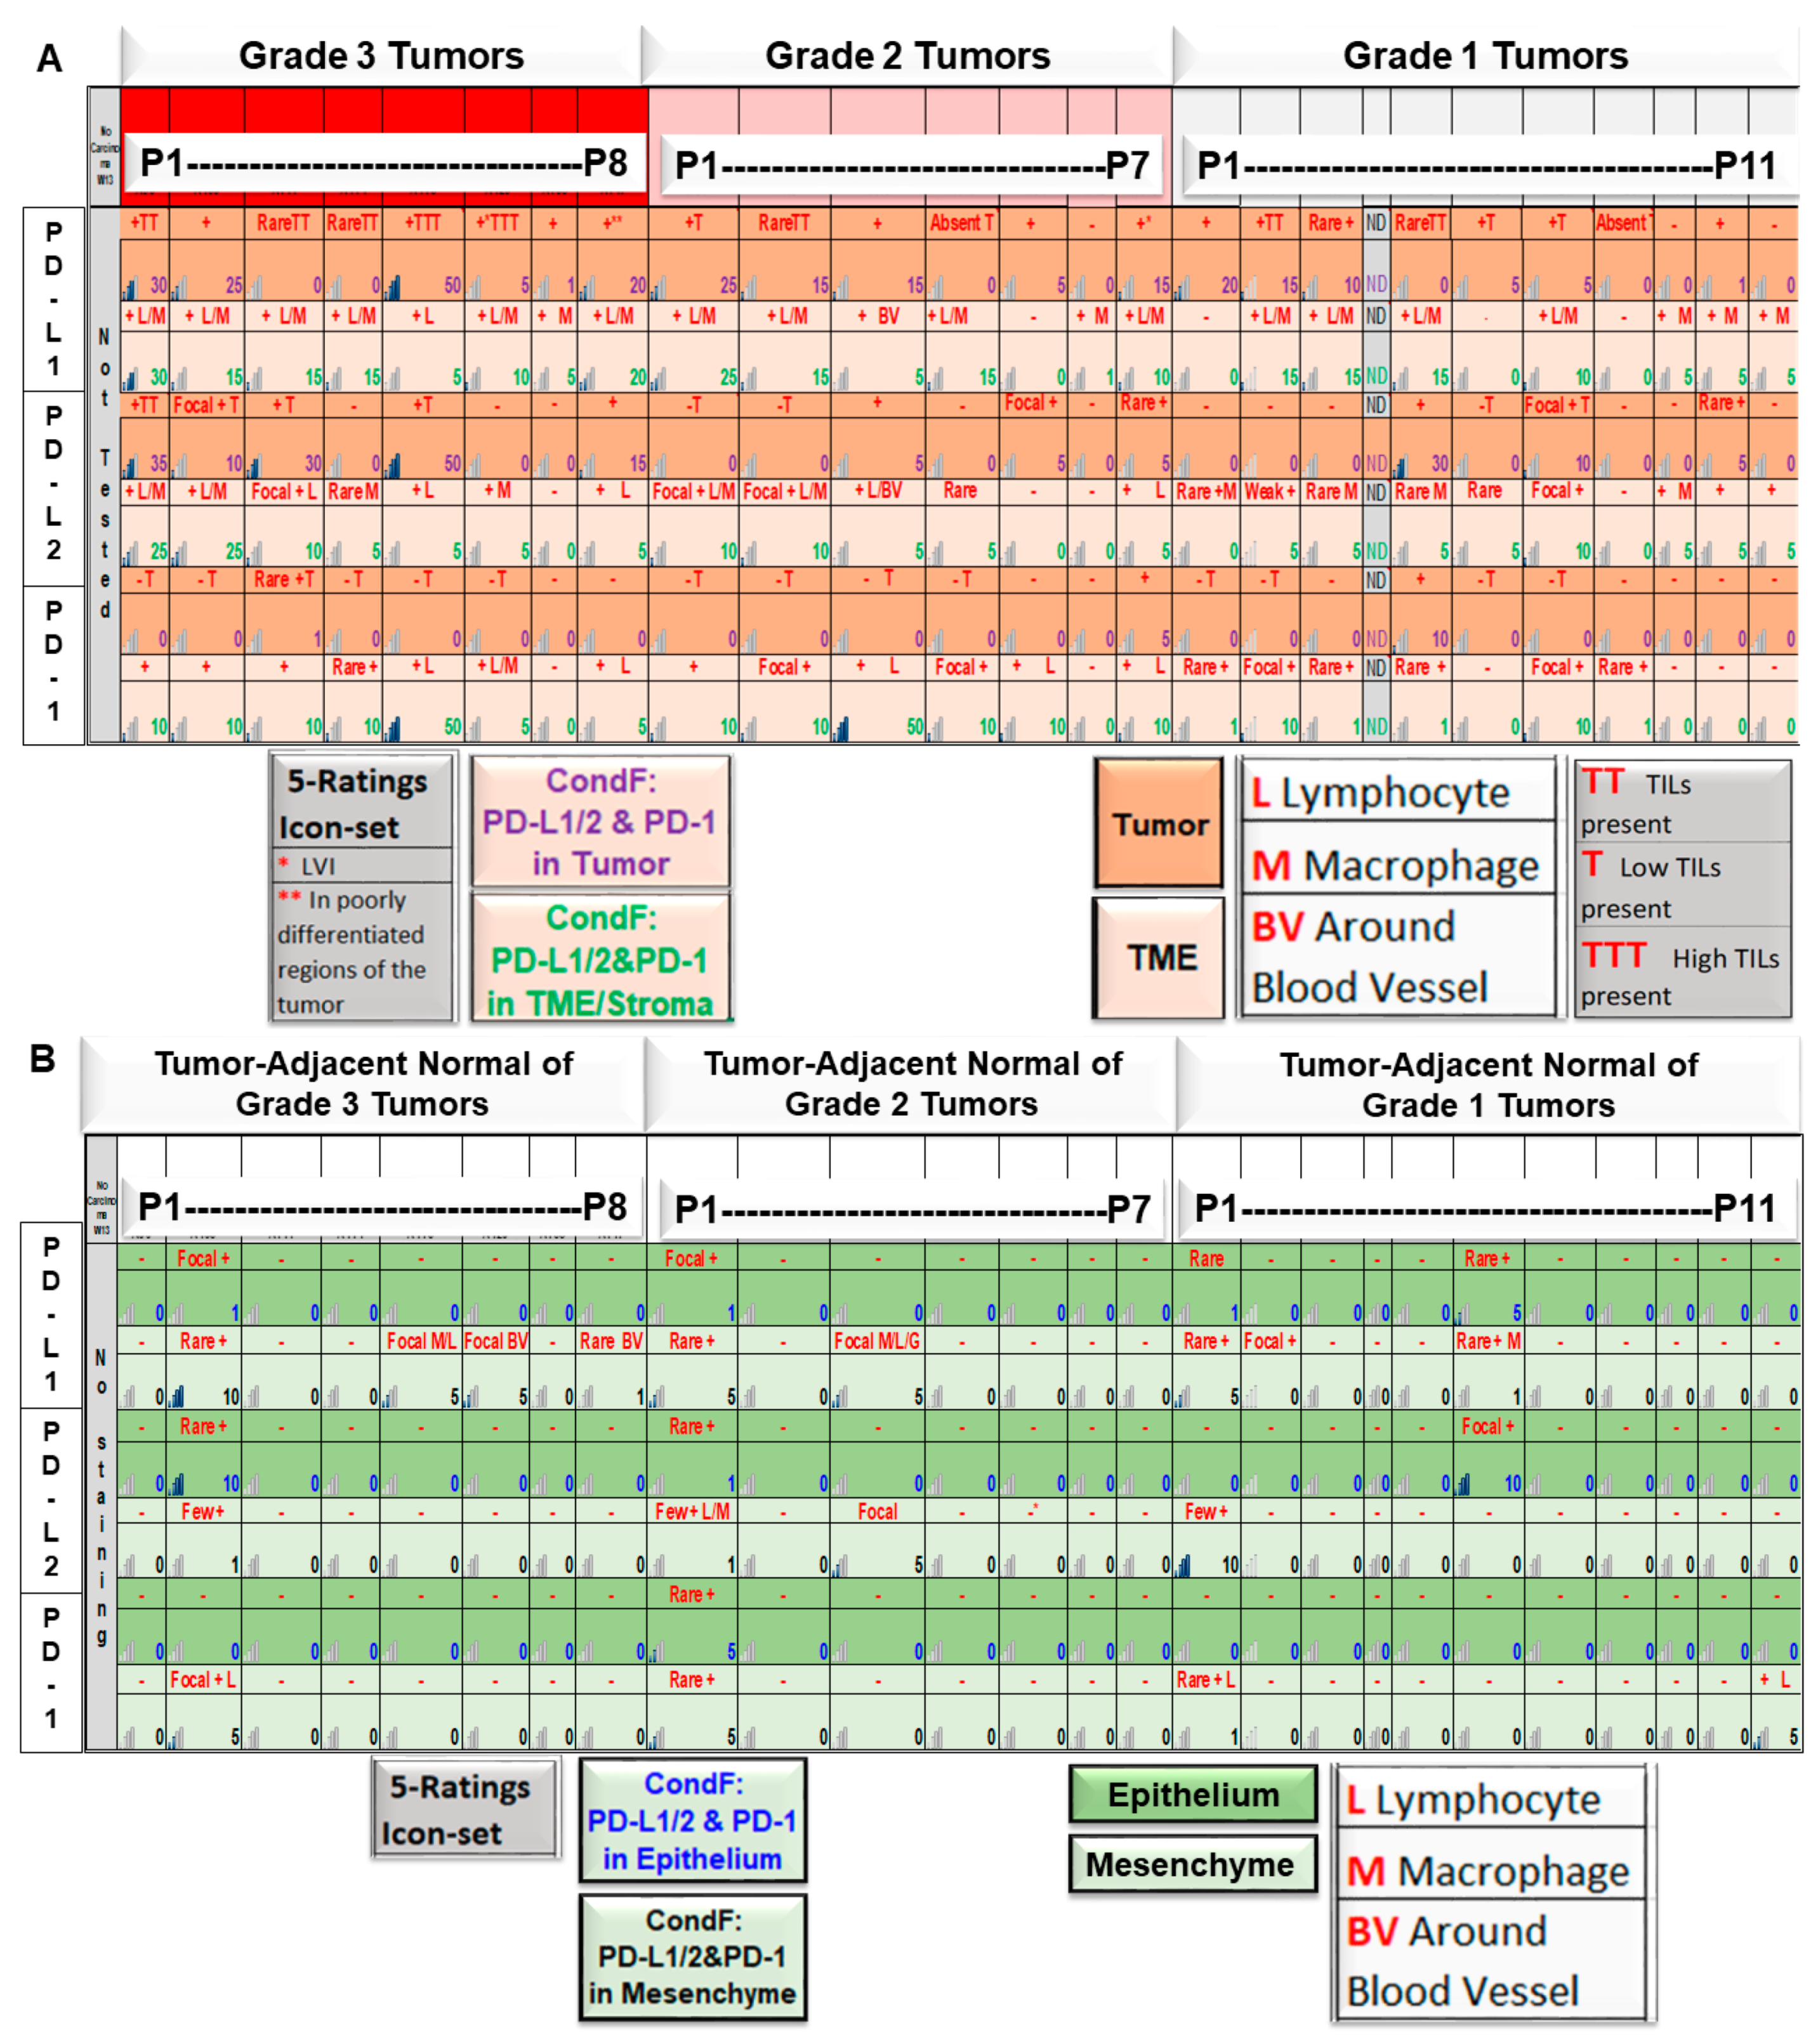
| 8 | A | Expression pattern of PD-L1, PD-L2, and PD-1 in tumor cells/TME of patients with grade 1, 2, and 3 diseases as obtained from tumor samples | Expression of PD-L1 is correlated to the highest grade of the disease. |
| B | Expression patterns of PD-L1, PD-L2, and PD-1 in epithelium/SME of patients with grade 1, 2, and 3 diseases were obtained from tumor-adjacent normal tissue samples. | No correlation was observed between the expression of PD-L1 with the grade of the disease. | |
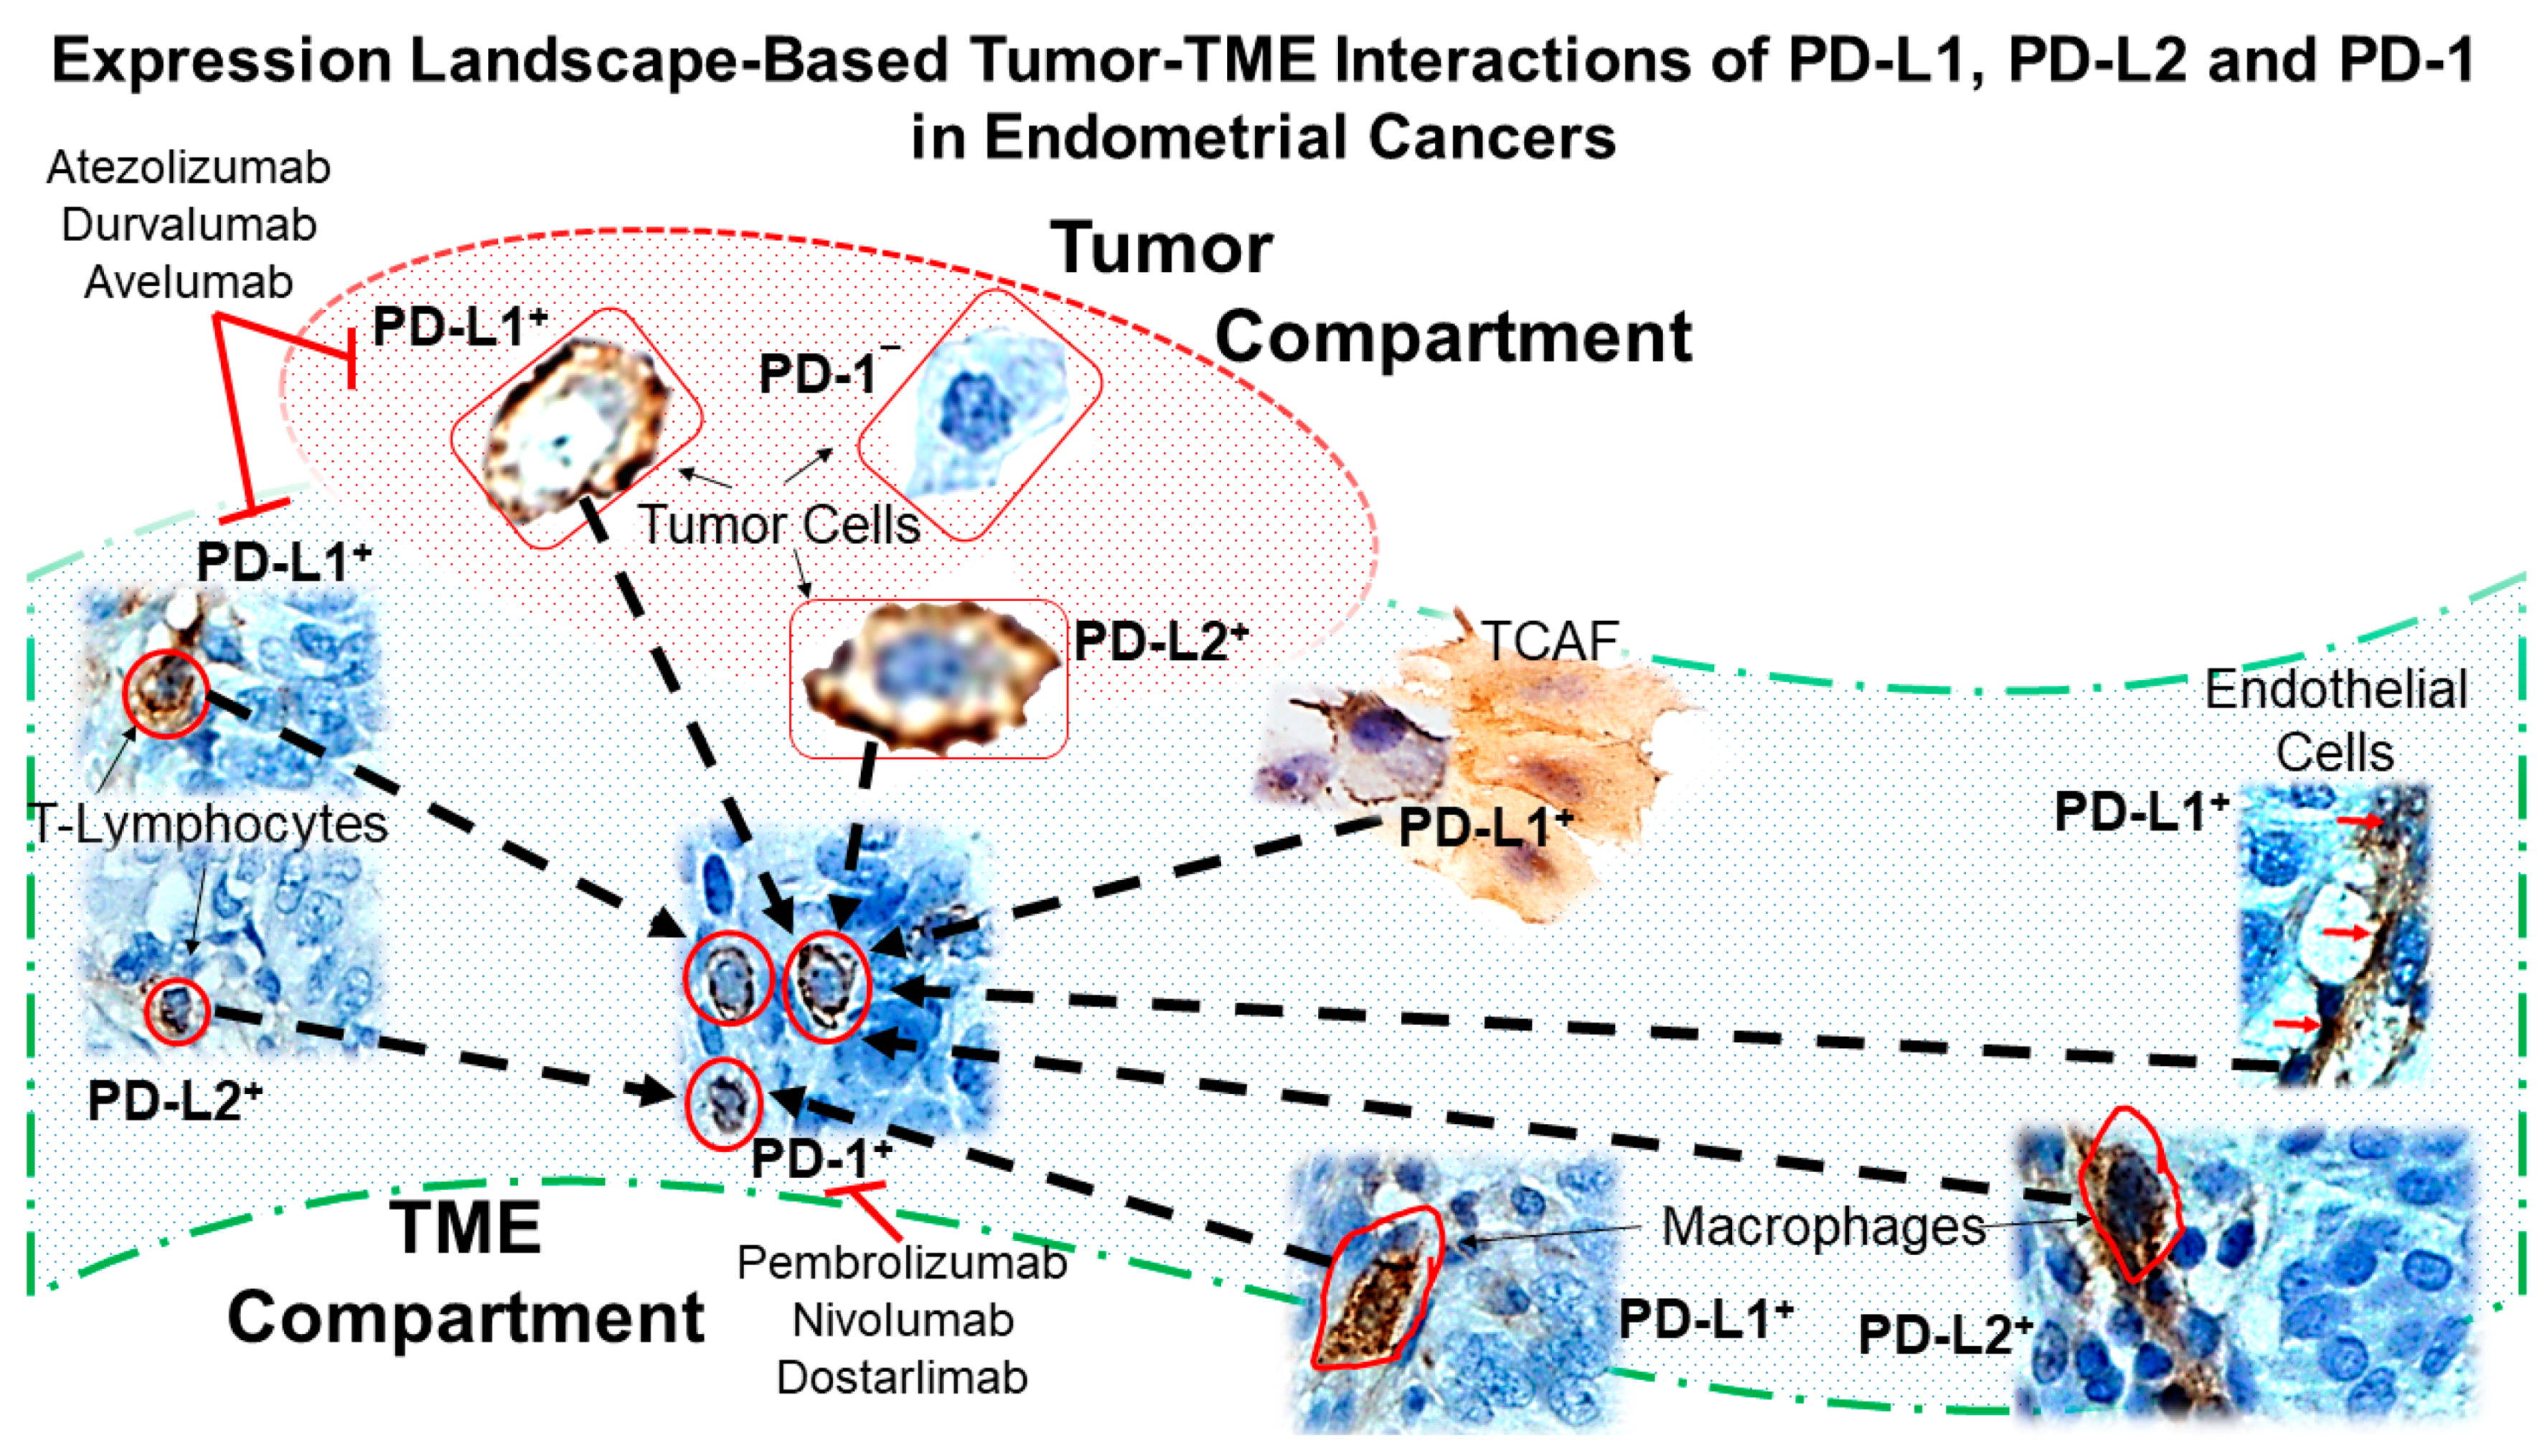
| 9 | Diagram presenting the expression pattern-based tumor–TME interaction of PD-L1, PD-L2, and PD-1 in endometrial cancers. | Expression landscape-based tumor–TME interactions of PD-L1, PD-L2 and PD-1 in endometrial cancers | |
Disclaimer/Publisher’s Note: The statements, opinions and data contained in all publications are solely those of the individual author(s) and contributor(s) and not of MDPI and/or the editor(s). MDPI and/or the editor(s) disclaim responsibility for any injury to people or property resulting from any ideas, methods, instructions or products referred to in the content. |
© 2023 by the authors. Licensee MDPI, Basel, Switzerland. This article is an open access article distributed under the terms and conditions of the Creative Commons Attribution (CC BY) license (https://creativecommons.org/licenses/by/4.0/).
Share and Cite
Sulaiman, R.; De, P.; Aske, J.C.; Lin, X.; Dale, A.; Koirala, N.; Gaster, K.; Espaillat, L.R.; Starks, D.; Dey, N. Tumor-TME Bipartite Landscape of PD-1/PD-L1 in Endometrial Cancers. Int. J. Mol. Sci. 2023, 24, 11079. https://doi.org/10.3390/ijms241311079
Sulaiman R, De P, Aske JC, Lin X, Dale A, Koirala N, Gaster K, Espaillat LR, Starks D, Dey N. Tumor-TME Bipartite Landscape of PD-1/PD-L1 in Endometrial Cancers. International Journal of Molecular Sciences. 2023; 24(13):11079. https://doi.org/10.3390/ijms241311079
Chicago/Turabian StyleSulaiman, Raed, Pradip De, Jennifer C. Aske, Xiaoqian Lin, Adam Dale, Nischal Koirala, Kris Gaster, Luis Rojas Espaillat, David Starks, and Nandini Dey. 2023. "Tumor-TME Bipartite Landscape of PD-1/PD-L1 in Endometrial Cancers" International Journal of Molecular Sciences 24, no. 13: 11079. https://doi.org/10.3390/ijms241311079
APA StyleSulaiman, R., De, P., Aske, J. C., Lin, X., Dale, A., Koirala, N., Gaster, K., Espaillat, L. R., Starks, D., & Dey, N. (2023). Tumor-TME Bipartite Landscape of PD-1/PD-L1 in Endometrial Cancers. International Journal of Molecular Sciences, 24(13), 11079. https://doi.org/10.3390/ijms241311079