

Experimental Treatment with Edaravone in a Mouse Model of Spinocerebellar Ataxia 1

 and
and 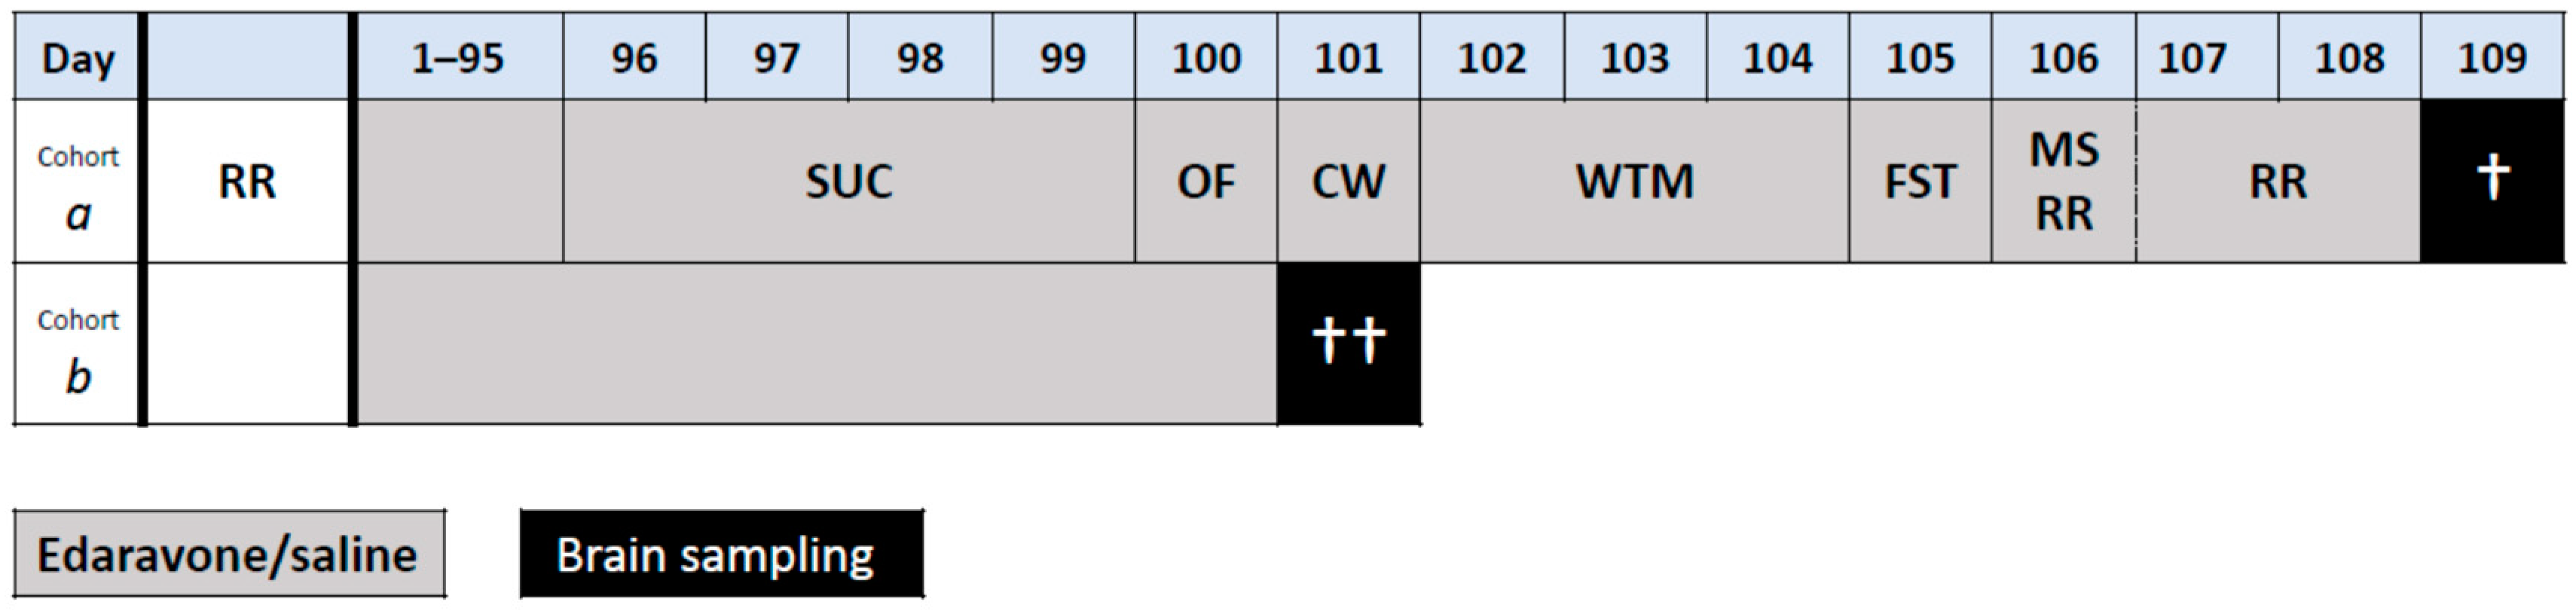
Abstract
1. Introduction
- (1)
- (2)
- (3)
- (4)
2. Results
2.1. Sucrose Preference Test
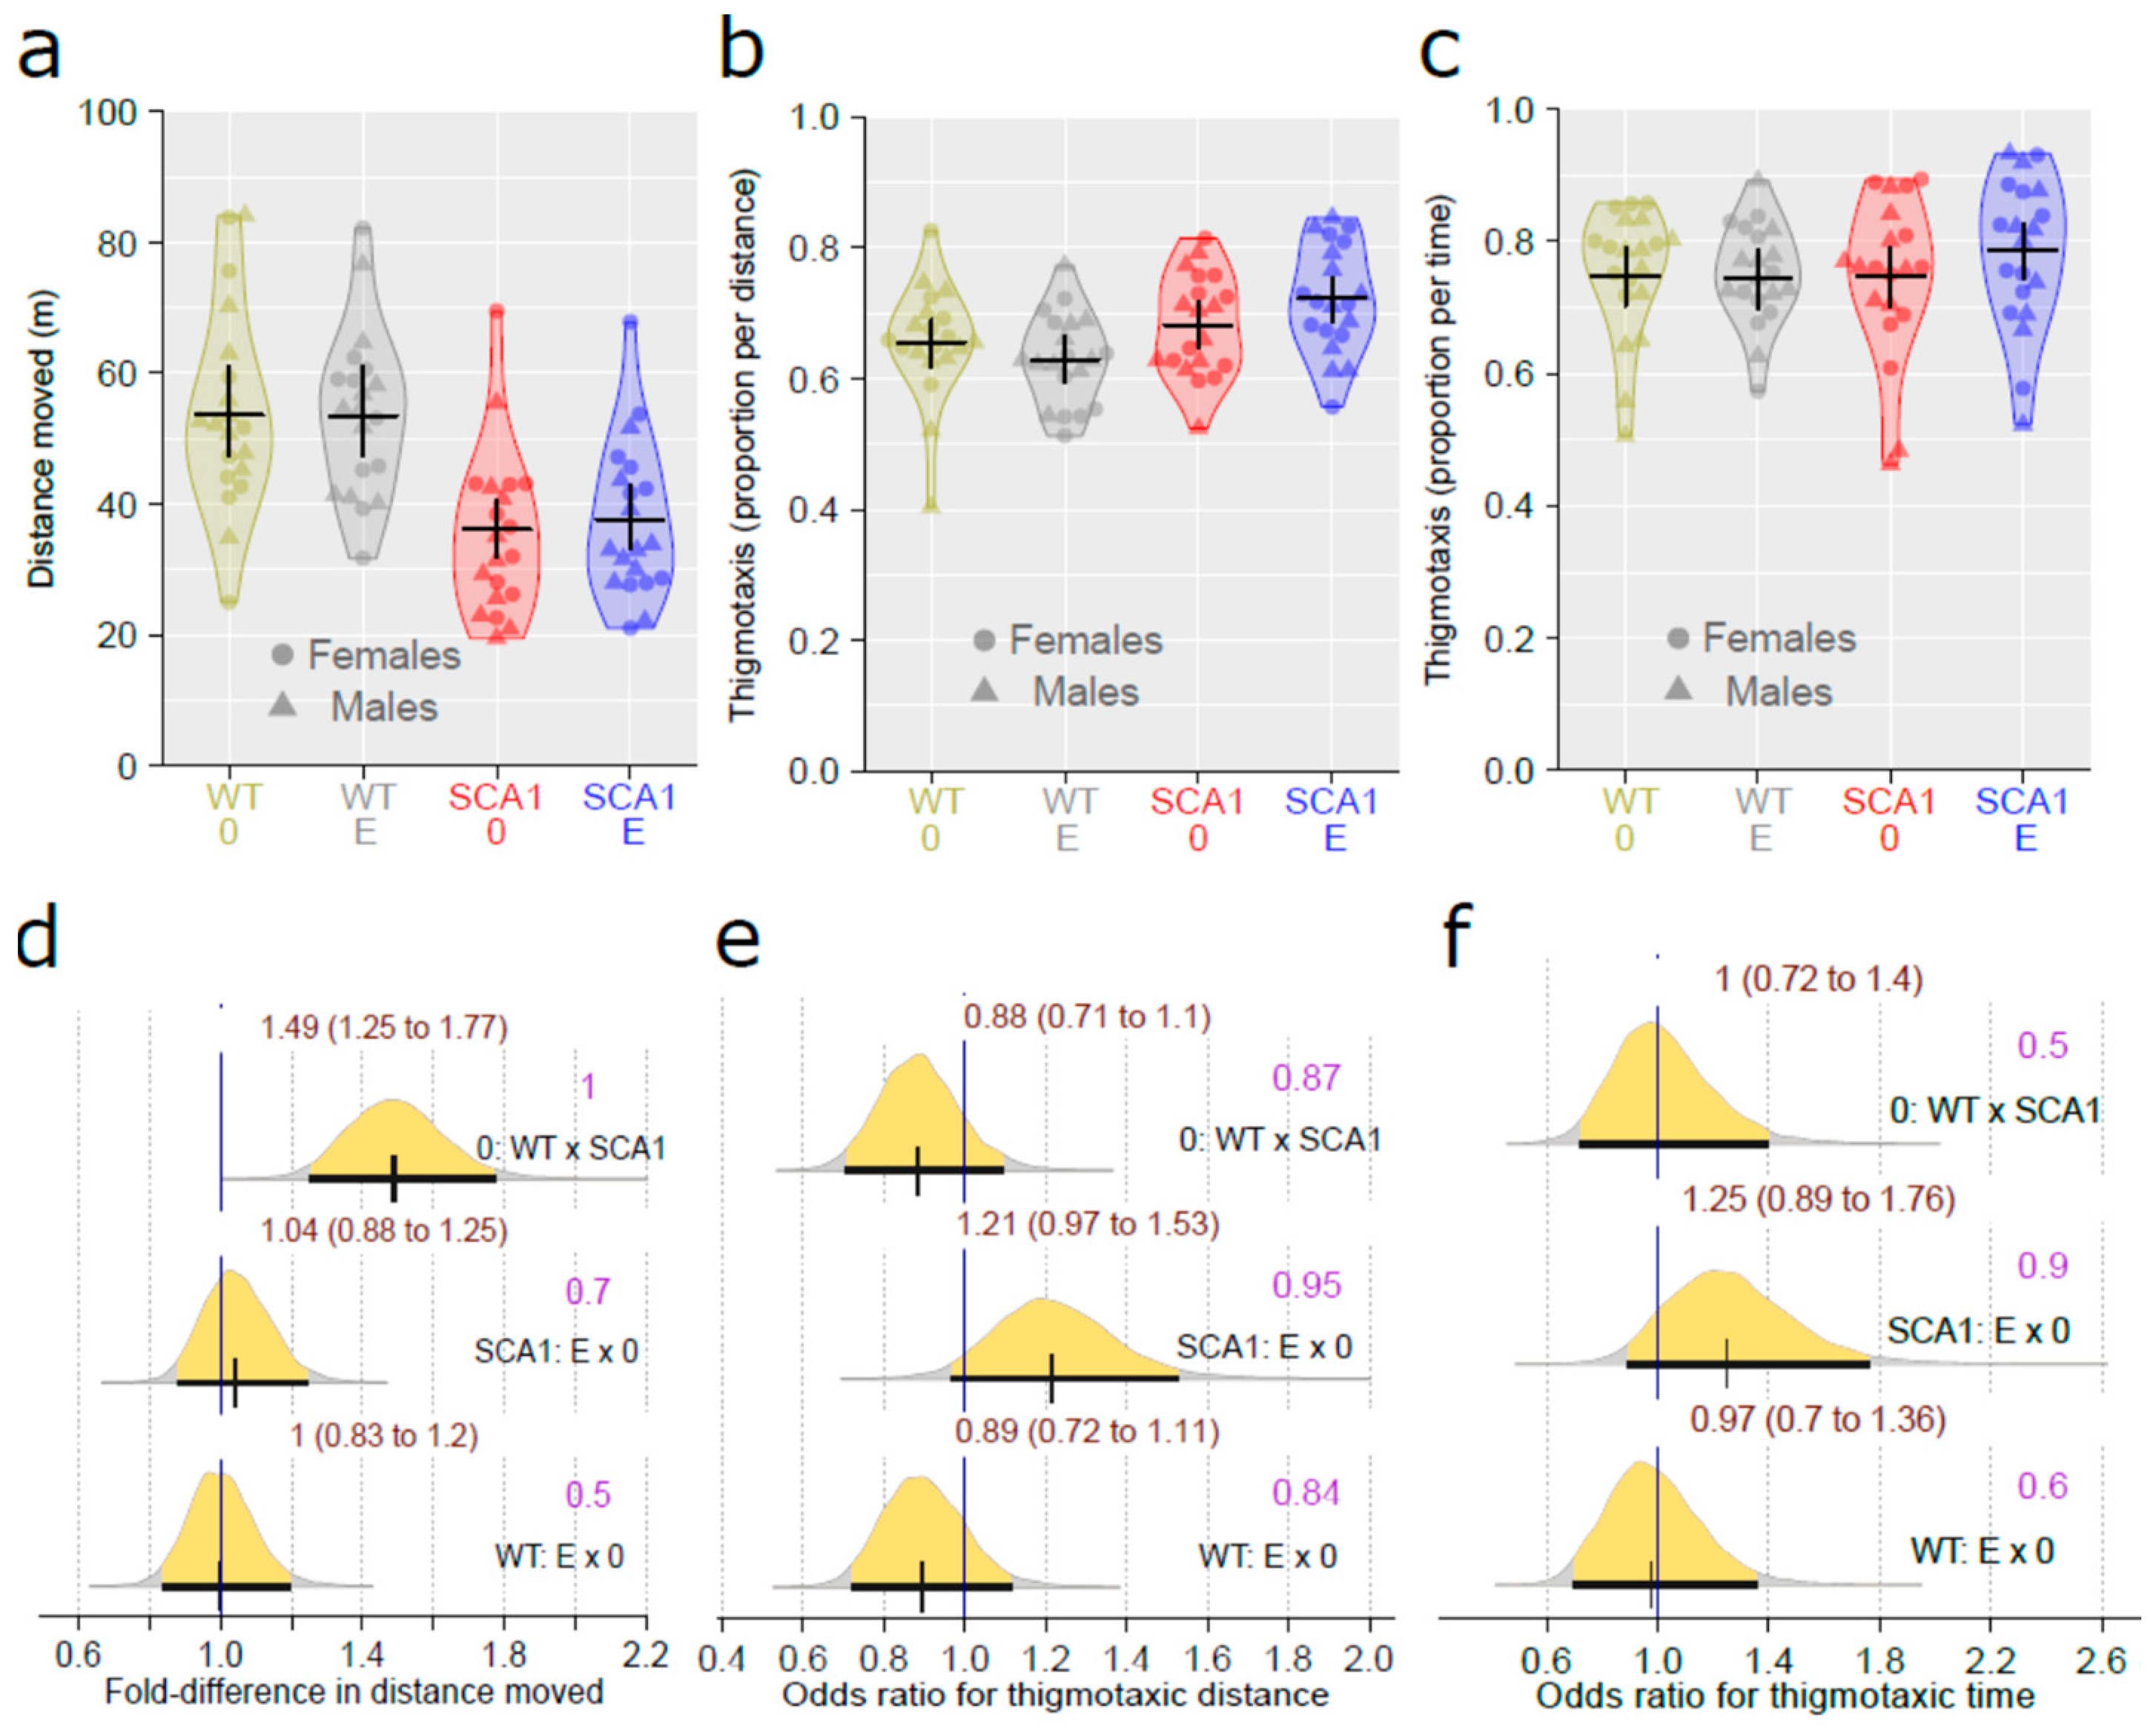
2.2. Open Field Test
2.3. Gait Analysis
2.4. Water T-Maze
2.5. Forced Swimming Test
2.6. Muscle Strength Measurement
2.7. Rotarod
2.8. Cerebellar Molecular Layer
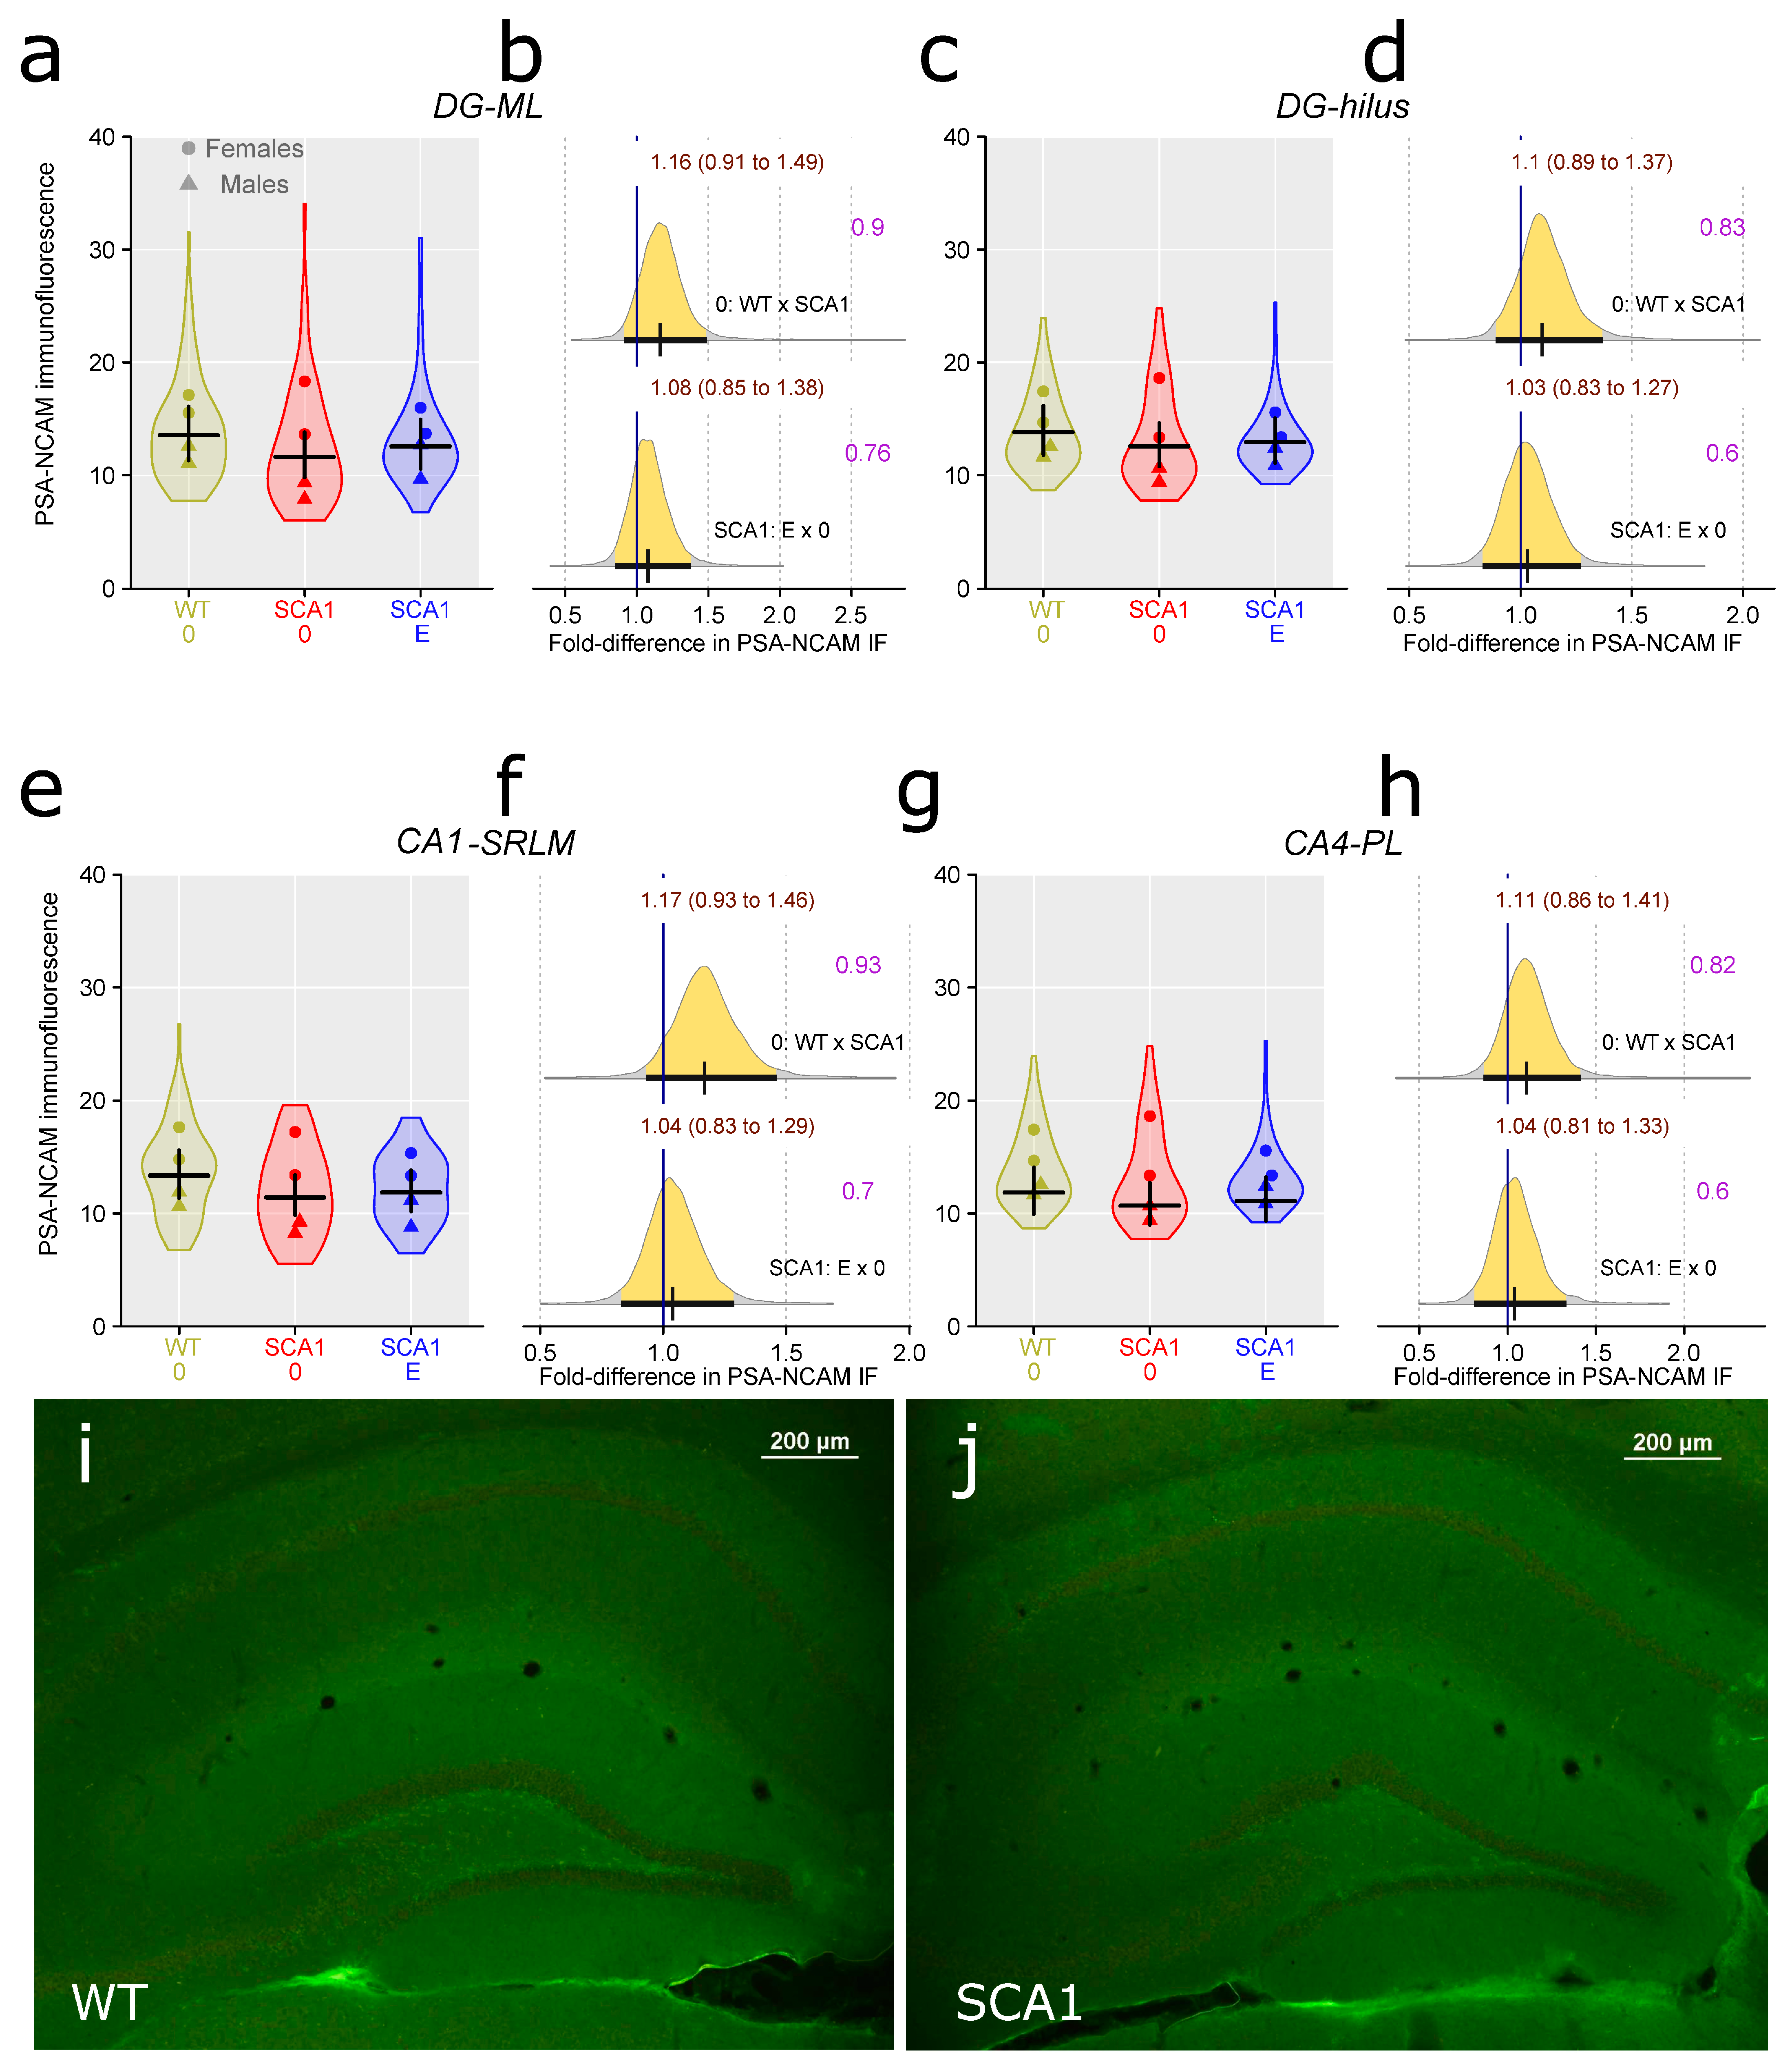
2.9. Hippocampus
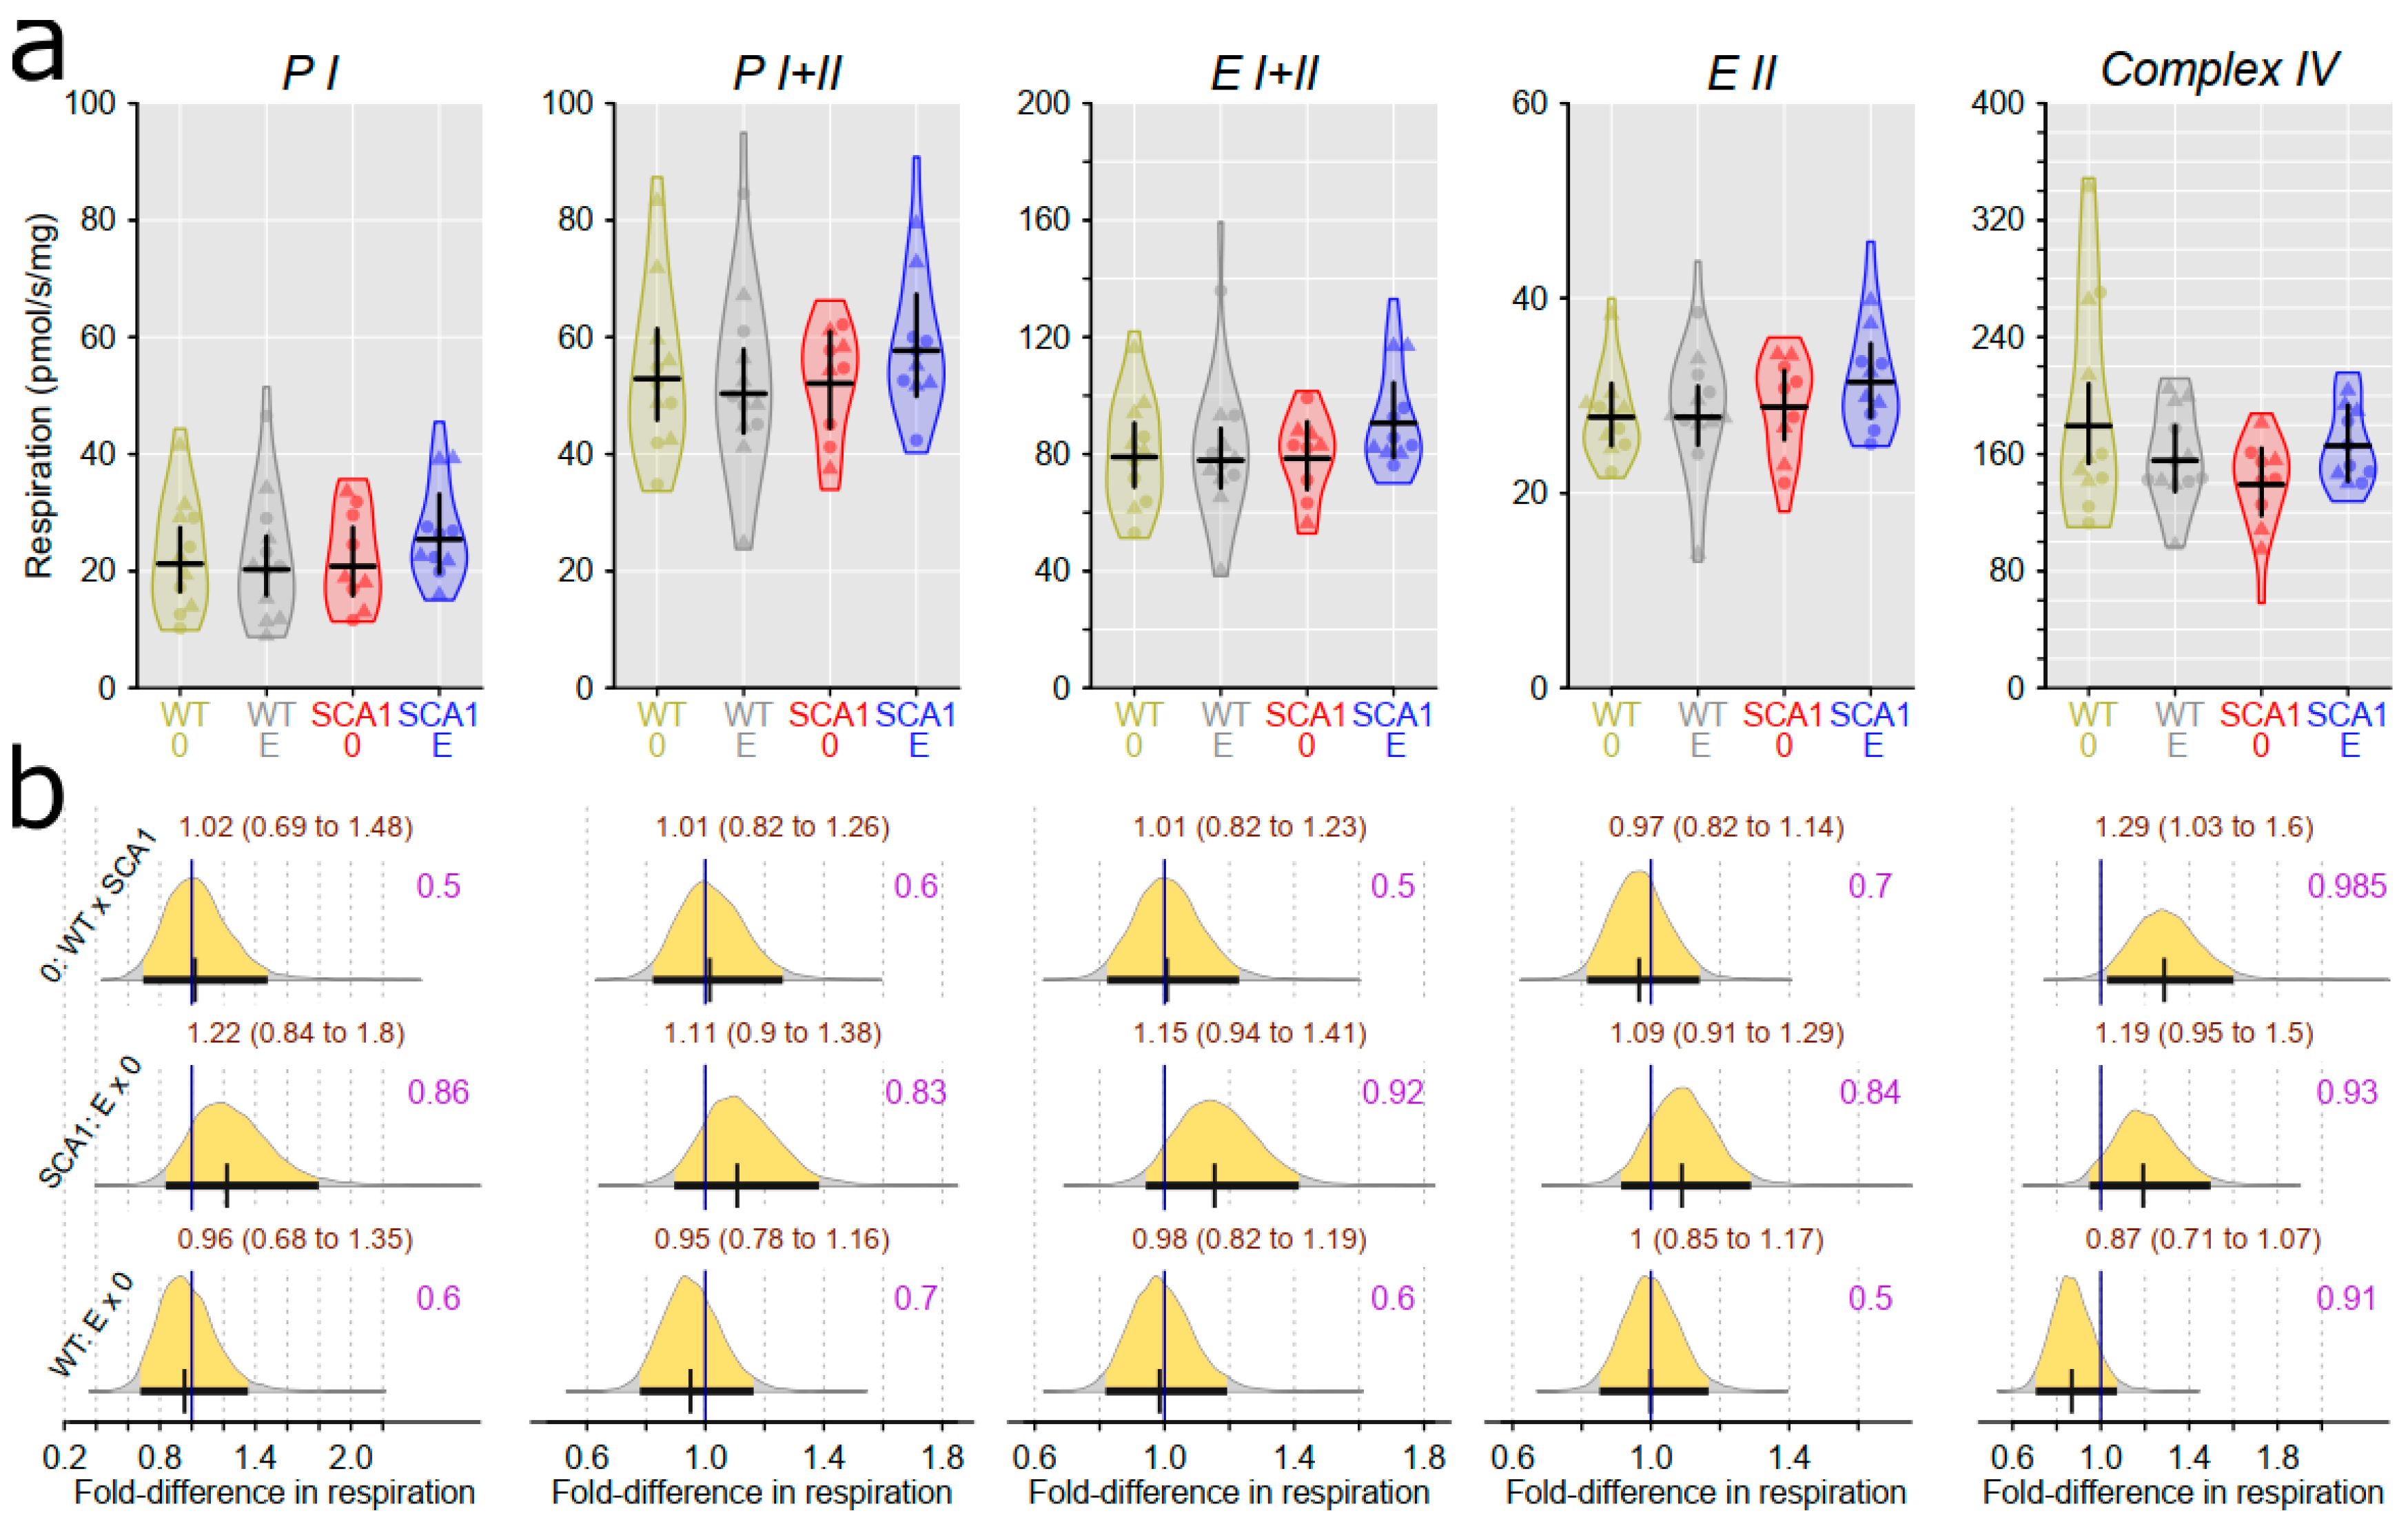
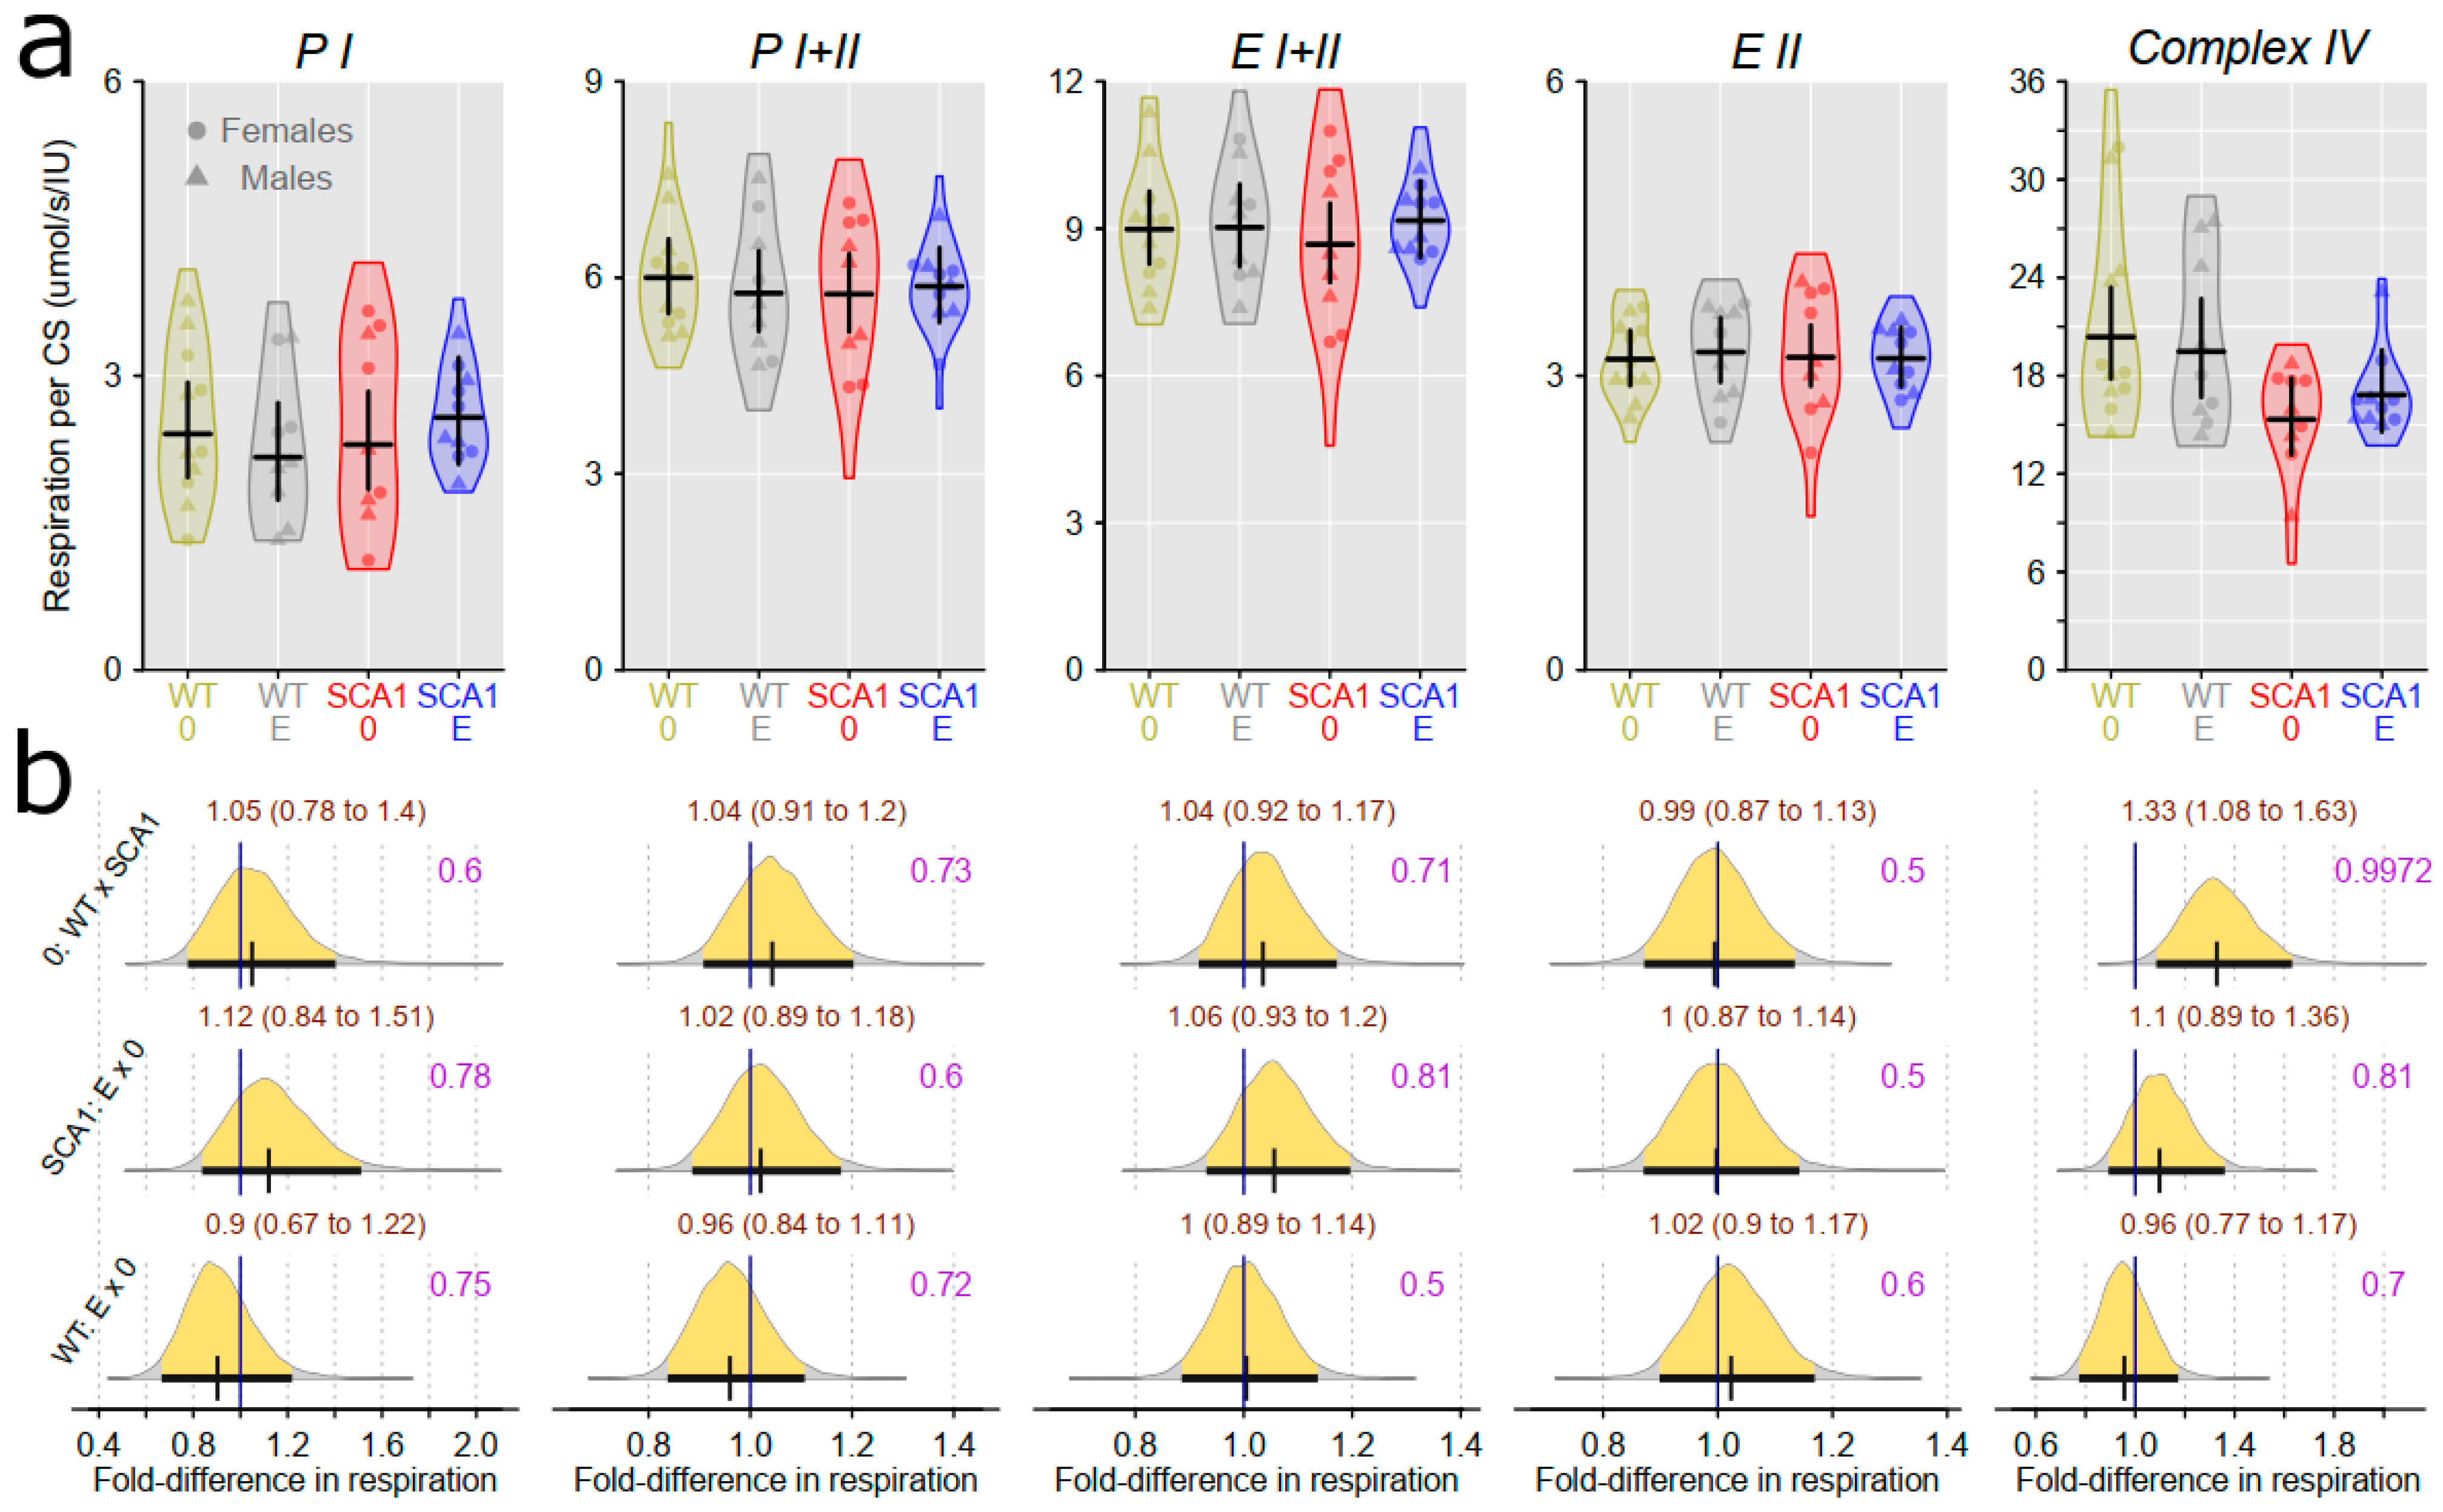
2.10. Examination of Mitochondrial Functions
2.11. Determination of the Level of Brain-Derived Neurotrophic Factor and the Inflammatory Marker Interleukin 6
3. Discussion
4. Materials and Methods
4.1. Animals
4.2. Design of the Experiment
4.3. Treatment
4.4. Motor, Cognitive, and Behavioral Tests
4.4.1. Sucrose Preference Test
4.4.2. Open Field Test
4.4.3. Gait Analysis
4.4.4. Water T-Maze
4.4.5. Forced Swimming Test
4.4.6. Muscle Strength Measurement
4.4.7. Rotarod
4.5. Sample Collection
4.6. Histological Examination
4.7. Examination of Mitochondrial Functions
4.8. Determination of the Level of BDNF and the Inflammatory Marker IL6
4.9. Statistics
- (1)
- Analysis of overall success from all testing sessions (sessions 4–6 and 11–12).
- (2)
- Analysis of initial learning: sessions 4–6
- (3)
- Analysis of flexibility: sessions 11–12. As the performance may be paradoxically increased in non-learners, the performance in session 7 was included as a covariate in the model. Such a model showed better predictive accuracy, as indicated by leave-one-out cross-validation.
5. Conclusions
Supplementary Materials
Author Contributions
Funding
Institutional Review Board Statement
Informed Consent Statement
Data Availability Statement
Conflicts of Interest
Abbreviations
| ALS | amyotrophic lateral sclerosis |
| BCA | bicinchoninic acid |
| BDNF | brain-derived neurotrophic factor |
| ELISA | enzyme-linked immunosorbent assay |
| FD | fold difference |
| IL6 | interleukin 6 |
| OR | odds ratio |
| PC | principal component |
| ROS | reactive oxygen species |
| ROX | residual oxygen consumption |
| RPM | rotation per minute |
| SCA1 | spinocerebellar ataxia type 1 |
| SCAs | spinocerebellar ataxias |
| WT | wild type |
References
- Matilla-Duenas, A.; Goold, R.; Giunti, P. Clinical, genetic, molecular, and pathophysiological insights into spinocerebellar ataxia type 1. Cerebellum 2008, 7, 106–114. [Google Scholar] [CrossRef]
- Sánchez, I.; Balagué, E.; Matilla-Dueñas, A. Ataxin-1 regulates the cerebellar bioenergetics proteome through the GSK3β-mTOR pathway which is altered in Spinocerebellar ataxia type 1 (SCA1). Hum. Mol. Genet. 2016, 25, 4021–4040. [Google Scholar] [CrossRef]
- Cummings, C.J.; Orr, H.T.; Zoghbi, H.Y. Progress in pathogenesis studies of spinocerebellar ataxia type 1. Philos. Trans. R. Soc. Lond. B Biol. Sci. 1999, 354, 1079–1081. [Google Scholar] [CrossRef]
- Tichanek, F.; Salomova, M.; Jedlicka, J.; Kuncova, J.; Pitule, P.; Macanova, T.; Petrankova, Z.; Tuma, Z.; Cendelin, J. Hippocampal mitochondrial dysfunction and psychiatric-relevant behavioral deficits in spinocerebellar ataxia 1 mouse model. Sci. Rep. 2020, 10, 5418. [Google Scholar] [CrossRef]
- Rub, U.; Burk, K.; Timmann, D.; den Dunnen, W.; Seidel, K.; Farrag, K.; Brunt, E.; Heinsen, H.; Egensperger, R.; Bornemann, A.; et al. Spinocerebellar ataxia type 1 (SCA1): New pathoanatomical and clinico-pathological insights. Neuropathol. Appl. Neurobiol. 2012, 38, 665–680. [Google Scholar] [CrossRef]
- Watase, K.; Weeber, E.J.; Xu, B.; Antalffy, B.; Yuva-Paylor, L.; Hashimoto, K.; Kano, M.; Atkinson, R.; Sun, Y.; Armstrong, D.L.; et al. A long CAG repeat in the mouse Sca1 locus replicates SCA1 features and reveals the impact of protein solubility on selective neurodegeneration. Neuron 2002, 34, 905–919. [Google Scholar] [CrossRef]
- Tichanek, F. Psychiatric-Like Impairments in Mouse Models of Spinocerebellar Ataxias. Cerebellum 2023, 22, 14–25. [Google Scholar] [CrossRef]
- Watase, K.; Gatchel, J.R.; Sun, Y.; Emamian, E.; Atkinson, R.; Richman, R.; Mizusawa, H.; Orr, H.T.; Shaw, C.; Zoghbi, H.Y. Lithium therapy improves neurological function and hippocampal dendritic arborization in a spinocerebellar ataxia type 1 mouse model. PLoS Med. 2007, 4, e182. [Google Scholar] [CrossRef] [PubMed]
- Cvetanovic, M.; Hu, Y.S.; Opal, P. Mutant Ataxin-1 Inhibits Neural Progenitor Cell Proliferation in SCA1. Cerebellum 2017, 16, 340–347. [Google Scholar] [CrossRef] [PubMed]
- Cvetanovic, M.; Patel, J.M.; Marti, H.H.; Kini, A.R.; Opal, P. Vascular endothelial growth factor ameliorates the ataxic phenotype in a mouse model of spinocerebellar ataxia type 1. Nat. Med. 2011, 17, 1445–1447. [Google Scholar] [CrossRef] [PubMed]
- Cvetanovic, M.; Ingram, M.; Orr, H.; Opal, P. Early activation of microglia and astrocytes in mouse models of spinocerebellar ataxia type 1. Neuroscience 2015, 289, 289–299. [Google Scholar] [CrossRef]
- Giovannoni, R.; Maggio, N.; Rosaria Bianco, M.; Cavaliere, C.; Cirillo, G.; Lavitrano, M.; Papa, M. Reactive astrocytosis and glial glutamate transporter clustering are early changes in a spinocerebellar ataxia type 1 transgenic mouse model. Neuron Glia Biol. 2007, 3, 335–351. [Google Scholar] [CrossRef] [PubMed][Green Version]
- Ferro, A.; Carbone, E.; Zhang, J.; Marzouk, E.; Villegas, M.; Siegel, A.; Nguyen, D.; Possidente, T.; Hartman, J.; Polley, K.; et al. Short-term succinic acid treatment mitigates cerebellar mitochondrial OXPHOS dysfunction, neurodegeneration and ataxia in a Purkinje-specific spinocerebellar ataxia type 1 (SCA1) mouse model. PLoS ONE 2017, 12, e0188425. [Google Scholar] [CrossRef] [PubMed]
- Ripolone, M.; Lucchini, V.; Ronchi, D.; Fagiolari, G.; Bordoni, A.; Fortunato, F.; Mondello, S.; Bonato, S.; Meregalli, M.; Torrente, Y.; et al. Purkinje cell COX deficiency and mtDNA depletion in an animal model of spinocerebellar ataxia type 1. J. Neurosci. Res. 2018, 96, 1576–1585. [Google Scholar] [CrossRef]
- Burright, E.N.; Clark, H.B.; Servadio, A.; Matilla, T.; Feddersen, R.M.; Yunis, W.S.; Duvick, L.A.; Zoghbi, H.Y.; Orr, H.T. SCA1 transgenic mice: A model for neurodegeneration caused by an expanded CAG trinucleotide repeat. Cell 1995, 82, 937–948. [Google Scholar] [CrossRef]
- Genis, D.; Matilla, T.; Volpini, V.; Rosell, J.; Dávalos, A.; Ferrer, I.; Molins, A.; Estivill, X. Clinical, neuropathologic, and genetic studies of a large spinocerebellar ataxia type 1 (SCA1) kindred: (CAG)n expansion and early premonitory signs and symptoms. Neurology 1995, 45, 24–30. [Google Scholar] [CrossRef]
- Burk, K.; Globas, C.; Bosch, S.; Klockgether, T.; Zuhlke, C.; Daum, I.; Dichgans, J. Cognitive deficits in spinocerebellar ataxia type 1, 2, and 3. J. Neurol. 2003, 250, 207–211. [Google Scholar] [CrossRef] [PubMed]
- Fancellu, R.; Paridi, D.; Tomasello, C.; Panzeri, M.; Castaldo, A.; Genitrini, S.; Soliveri, P.; Girotti, F. Longitudinal study of cognitive and psychiatric functions in spinocerebellar ataxia types 1 and 2. J. Neurol. 2013, 260, 3134–3143. [Google Scholar] [CrossRef]
- Lo, R.Y.; Figueroa, K.P.; Pulst, S.M.; Perlman, S.; Wilmot, G.; Gomez, C.; Schmahmann, J.; Paulson, H.; Shakkottai, V.G.; Ying, S.; et al. Depression and clinical progression in spinocerebellar ataxias. Park. Relat. Disord. 2016, 22, 87–92. [Google Scholar] [CrossRef] [PubMed]
- Ma, J.; Wu, C.; Lei, J.; Zhang, X. Cognitive impairments in patients with spinocerebellar ataxia types 1, 2 and 3 are positively correlated to the clinical severity of ataxia symptoms. Int. J. Clin. Exp. Med. 2014, 7, 5765–5771. [Google Scholar]
- McMurtray, A.M.; Clark, D.G.; Flood, M.K.; Perlman, S.; Mendez, M.F. Depressive and memory symptoms as presenting features of spinocerebellar ataxia. J. Neuropsychiatry Clin. Neurosci. 2006, 18, 420–422. [Google Scholar] [CrossRef]
- Sokolovsky, N.; Cook, A.; Hunt, H.; Giunti, P.; Cipolotti, L. A preliminary characterisation of cognition and social cognition in spinocerebellar ataxia types 2, 1, and 7. Behav. Neurol. 2010, 23, 17–29. [Google Scholar] [CrossRef] [PubMed]
- Asher, M.; Rosa, J.G.; Cvetanovic, M. Mood alterations in mouse models of Spinocerebellar Ataxia type 1. Sci. Rep. 2021, 11, 713. [Google Scholar] [CrossRef]
- Asher, M.; Rosa, J.G.; Rainwater, O.; Duvick, L.; Bennyworth, M.; Lai, R.Y.; Kuo, S.H.; Cvetanovic, M. Cerebellar contribution to the cognitive alterations in SCA1: Evidence from mouse models. Hum. Mol. Genet. 2020, 29, 117–131. [Google Scholar] [CrossRef]
- Asher, M.; Johnson, A.; Zecevic, B.; Pease, D.; Cvetanovic, M. Ataxin-1 regulates proliferation of hippocampal neural precursors. Neuroscience 2016, 322, 54–65. [Google Scholar] [CrossRef]
- Hatanaka, Y.; Watase, K.; Wada, K.; Nagai, Y. Abnormalities in synaptic dynamics during development in a mouse model of spinocerebellar ataxia type 1. Sci. Rep. 2015, 5, 16102. [Google Scholar] [CrossRef]
- Khacho, M.; Clark, A.; Svoboda, D.S.; MacLaurin, J.G.; Lagace, D.C.; Park, D.S.; Slack, R.S. Mitochondrial dysfunction underlies cognitive defects as a result of neural stem cell depletion and impaired neurogenesis. Hum. Mol. Genet. 2017, 26, 3327–3341. [Google Scholar] [CrossRef] [PubMed]
- Devine, M.J.; Kittler, J.T. Mitochondria at the neuronal presynapse in health and disease. Nat. Rev. Neurosci. 2018, 19, 63–80. [Google Scholar] [CrossRef] [PubMed]
- Khacho, M.; Harris, R.; Slack, R.S. Mitochondria as central regulators of neural stem cell fate and cognitive function. Nat. Rev. Neurosci. 2019, 20, 34–48. [Google Scholar] [CrossRef]
- Pushpakom, S.; Iorio, F.; Eyers, P.A.; Escott, K.J.; Hopper, S.; Wells, A.; Doig, A.; Guilliams, T.; Latimer, J.; McNamee, C.; et al. Drug repurposing: Progress, challenges and recommendations. Nat. Rev. Drug Discov. 2019, 18, 41–58. [Google Scholar] [CrossRef]
- Strupp, M.; Teufel, J.; Zwergal, A.; Schniepp, R.; Khodakhah, K.; Feil, K. Aminopyridines for the treatment of neurologic disorders. Neurol. Clin. Pract. 2017, 7, 65–76. [Google Scholar] [CrossRef]
- Gandini, J.; Manto, M.; Bremova-Ertl, T.; Feil, K.; Strupp, M. The neurological update: Therapies for cerebellar ataxias in 2020. J. Neurol. 2020, 267, 1211–1220. [Google Scholar] [CrossRef]
- Cendelin, J.; Cvetanovic, M.; Gandelman, M.; Hirai, H.; Orr, H.T.; Pulst, S.M.; Strupp, M.; Tichanek, F.; Tuma, J.; Manto, M. Consensus Paper: Strengths and Weaknesses of Animal Models of Spinocerebellar Ataxias and Their Clinical Implications. Cerebellum 2022, 21, 452–481. [Google Scholar] [CrossRef] [PubMed]
- Miyaji, Y.; Yoshimura, S.; Sakai, N.; Yamagami, H.; Egashira, Y.; Shirakawa, M.; Uchida, K.; Kageyama, H.; Tomogane, Y. Effect of edaravone on favorable outcome in patients with acute cerebral large vessel occlusion: Subanalysis of RESCUE-Japan Registry. Neurol. Med. Chir. 2015, 55, 241–247. [Google Scholar] [CrossRef] [PubMed]
- Fidalgo, M.; Ricardo Pires, J.; Viseu, I.; Magalhães, P.; Gregório, H.; Afreixo, V.; Gregório, T. Edaravone for acute ischemic stroke—Systematic review with meta-analysis. Clin. Neurol. Neurosurg. 2022, 219, 107299. [Google Scholar] [CrossRef]
- Kobayashi, S.; Fukuma, S.; Ikenoue, T.; Fukuhara, S.; Kobayashi, S. Effect of Edaravone on Neurological Symptoms in Real-World Patients With Acute Ischemic Stroke. Stroke 2019, 50, 1805–1811. [Google Scholar] [CrossRef]
- Rothstein, J.D. Edaravone: A new drug approved for ALS. Cell 2017, 171, 725. [Google Scholar] [CrossRef] [PubMed]
- Hamzeiy, H.; Savaş, D.; Tunca, C.; Şen, N.E.; Gündoğdu Eken, A.; Şahbaz, I.; Calini, D.; Tiloca, C.; Ticozzi, N.; Ratti, A.; et al. Elevated Global DNA Methylation Is Not Exclusive to Amyotrophic Lateral Sclerosis and Is Also Observed in Spinocerebellar Ataxia Types 1 and 2. Neurodegener Dis. 2018, 18, 38–48. [Google Scholar] [CrossRef]
- Lattante, S.; Pomponi, M.G.; Conte, A.; Marangi, G.; Bisogni, G.; Patanella, A.K.; Meleo, E.; Lunetta, C.; Riva, N.; Mosca, L.; et al. ATXN1 intermediate-length polyglutamine expansions are associated with amyotrophic lateral sclerosis. Neurobiol. Aging 2018, 64, e151–e157.e155. [Google Scholar] [CrossRef]
- Ren, Y.; Wei, B.; Song, X.; An, N.; Zhou, Y.; Jin, X.; Zhang, Y. Edaravone’s free radical scavenging mechanisms of neuroprotection against cerebral ischemia: Review of the literature. Int. J. Neurosci. 2015, 125, 555–565. [Google Scholar] [CrossRef]
- Kraus, R.L.; Pasieczny, R.; Lariosa-Willingham, K.; Turner, M.S.; Jiang, A.; Trauger, J.W. Antioxidant properties of minocycline: Neuroprotection in an oxidative stress assay and direct radical-scavenging activity. J. Neurochem. 2005, 94, 819–827. [Google Scholar] [CrossRef] [PubMed]
- Banno, M.; Mizuno, T.; Kato, H.; Zhang, G.; Kawanokuchi, J.; Wang, J.; Kuno, R.; Jin, S.; Takeuchi, H.; Suzumura, A. The radical scavenger edaravone prevents oxidative neurotoxicity induced by peroxynitrite and activated microglia. Neuropharmacology 2005, 48, 283–290. [Google Scholar] [CrossRef]
- Miyamoto, N.; Maki, T.; Pham, L.D.; Hayakawa, K.; Seo, J.H.; Mandeville, E.T.; Mandeville, J.B.; Kim, K.W.; Lo, E.H.; Arai, K. Oxidative stress interferes with white matter renewal after prolonged cerebral hypoperfusion in mice. Stroke 2013, 44, 3516–3521. [Google Scholar] [CrossRef] [PubMed]
- Lee, B.J.; Egi, Y.; van Leyen, K.; Lo, E.H.; Arai, K. Edaravone, a free radical scavenger, protects components of the neurovascular unit against oxidative stress in vitro. Brain Res. 2010, 1307, 22–27. [Google Scholar] [CrossRef] [PubMed]
- Stucki, D.M.; Ruegsegger, C.; Steiner, S.; Radecke, J.; Murphy, M.P.; Zuber, B.; Saxena, S. Mitochondrial impairments contribute to Spinocerebellar ataxia type 1 progression and can be ameliorated by the mitochondria-targeted antioxidant MitoQ. Free Radic. Biol. Med. 2016, 97, 427–440. [Google Scholar] [CrossRef] [PubMed]
- Yuan, Y.; Zha, H.; Rangarajan, P.; Ling, E.A.; Wu, C. Anti-inflammatory effects of Edaravone and Scutellarin in activated microglia in experimentally induced ischemia injury in rats and in BV-2 microglia. BMC Neurosci. 2014, 15, 125. [Google Scholar] [CrossRef]
- Porsolt, R.D.; Bertin, A.; Blavet, N.; Deniel, M.; Jalfre, M. Immobility induced by forced swimming in rats: Effects of agents which modify central catecholamine and serotonin activity. Eur. J. Pharmacol. 1979, 57, 201–210. [Google Scholar] [CrossRef]
- Larsen, S.; Nielsen, J.; Hansen, C.N.; Nielsen, L.B.; Wibrand, F.; Stride, N.; Schroder, H.D.; Boushel, R.; Helge, J.W.; Dela, F.; et al. Biomarkers of mitochondrial content in skeletal muscle of healthy young human subjects. J. Physiol. 2012, 590, 3349–3360. [Google Scholar] [CrossRef]
- Tuma, J.; Kolinko, Y.; Vozeh, F.; Cendelin, J. Mutation-related differences in exploratory, spatial, and depressive-like behavior in pcd and Lurcher cerebellar mutant mice. Front. Behav. Neurosci. 2015, 9, 116. [Google Scholar] [CrossRef]
- Porras-Garcia, E.; Cendelin, J.; Dominguez-del-Toro, E.; Vozeh, F.; Delgado-Garcia, J.M. Purkinje cell loss affects differentially the execution, acquisition and prepulse inhibition of skeletal and facial motor responses in Lurcher mice. Eur. J. Neurosci. 2005, 21, 979–988. [Google Scholar] [CrossRef]
- Cendelin, J.; Tichanek, F. Cerebellar degeneration averts blindness-induced despaired behavior during spatial task in mice. Neurosci. Lett. 2020, 722, 134854. [Google Scholar] [CrossRef] [PubMed]
- Salomova, M.; Tichanek, F.; Jelinkova, D.; Cendelin, J. Forced activity and environmental enrichment mildly improve manifestation of rapid cerebellar degeneration in mice. Behav. Brain Res. 2021, 401, 113060. [Google Scholar] [CrossRef]
- Lorivel, T.; Cendelin, J.; Hilber, P. Familiarization effects on the behavioral disinhibition of the cerebellar Lurcher mutant mice: Use of the innovative Dual Maze. Behav. Brain Res. 2021, 398, 112972. [Google Scholar] [CrossRef] [PubMed]
- Hilber, P.; Lorivel, T.; Delarue, C.; Caston, J. Stress and anxious-related behaviors in Lurcher mutant mice. Brain Res. 2004, 1003, 108–112. [Google Scholar] [CrossRef] [PubMed]
- Bohne, P.; Mourabit, D.B.; Josten, M.; Mark, M.D. Cognitive deficits in episodic ataxia type 2 mouse models. Hum. Mol. Genet. 2021, 30, 1811–1832. [Google Scholar] [CrossRef]
- Clark, H.B.; Burright, E.N.; Yunis, W.S.; Larson, S.; Wilcox, C.; Hartman, B.; Matilla, A.; Zoghbi, H.Y.; Orr, H.T. Purkinje cell expression of a mutant allele of SCA1 in transgenic mice leads to disparate effects on motor behaviors, followed by a progressive cerebellar dysfunction and histological alterations. J. Neurosci. 1997, 17, 7385–7395. [Google Scholar] [CrossRef] [PubMed]
- Mellesmoen, A.; Sheeler, C.; Ferro, A.; Rainwater, O.; Cvetanovic, M. Brain Derived Neurotrophic Factor (BDNF) Delays Onset of Pathogenesis in Transgenic Mouse Model of Spinocerebellar Ataxia Type 1 (SCA1). Front. Cell. Neurosci. 2018, 12, 509. [Google Scholar] [CrossRef]
- Holper, L.; Ben-Shachar, D.; Mann, J.J. Multivariate meta-analyses of mitochondrial complex I and IV in major depressive disorder, bipolar disorder, schizophrenia, Alzheimer disease, and Parkinson disease. Neuropsychopharmacology 2019, 44, 837–849. [Google Scholar] [CrossRef]
- Manolaras, I.; Del Bondio, A.; Griso, O.; Reutenauer, L.; Eisenmann, A.; Habermann, B.H.; Puccio, H. Mitochondrial dysfunction and calcium dysregulation in COQ8A-ataxia Purkinje neurons are rescued by CoQ10 treatment. Brain 2023, awad099. [Google Scholar] [CrossRef]
- Burtscher, J.; Di Pardo, A.; Maglione, V.; Schwarzer, C.; Squitieri, F. Mitochondrial Respiration Changes in R6/2 Huntington’s Disease Model Mice during Aging in a Brain Region Specific Manner. Int. J. Mol. Sci. 2020, 21, 5412. [Google Scholar] [CrossRef]
- Reutzel, M.; Grewal, R.; Dilberger, B.; Silaidos, C.; Joppe, A.; Eckert, G.P. Cerebral Mitochondrial Function and Cognitive Performance during Aging: A Longitudinal Study in NMRI Mice. Oxid. Med. Cell. Longev. 2020, 2020, 4060769. [Google Scholar] [CrossRef] [PubMed]
- Jiao, S.S.; Yao, X.Q.; Liu, Y.H.; Wang, Q.H.; Zeng, F.; Lu, J.J.; Liu, J.; Zhu, C.; Shen, L.L.; Liu, C.H.; et al. Edaravone alleviates Alzheimer’s disease-type pathologies and cognitive deficits. Proc. Natl. Acad. Sci. USA 2015, 112, 5225–5230. [Google Scholar] [CrossRef] [PubMed]
- Ishii, H.; Petrenko, A.B.; Sasaki, M.; Satoh, Y.; Kamiya, Y.; Tobita, T.; Furutani, K.; Matsuhashi, M.; Kohno, T.; Baba, H. Free radical scavenger edaravone produces robust neuroprotection in a rat model of spinal cord injury. Brain Res. 2018, 1682, 24–35. [Google Scholar] [CrossRef] [PubMed]
- Shan, H.; Jiao, G.; Cheng, X.; Dou, Z. Safety and efficacy of edaravone for patients with acute stroke: A protocol for randomized clinical trial. Medicine 2021, 100, e24811. [Google Scholar] [CrossRef]
- Li, H.; Min, J.; Mao, X.; Wang, X.; Yang, Y.; Chen, Y. Edaravone ameliorates experimental autoimmune thyroiditis in rats through HO-1-dependent STAT3/PI3K/Akt pathway. Am. J. Transl. Res. 2018, 10, 2037–2046. [Google Scholar]
- Yang, T.; Mao, Y.F.; Liu, S.Q.; Hou, J.; Cai, Z.Y.; Hu, J.Y.; Ni, X.; Deng, X.M.; Zhu, X.Y. Protective effects of the free radical scavenger edaravone on acute pancreatitis-associated lung injury. Eur. J. Pharmacol. 2010, 630, 152–157. [Google Scholar] [CrossRef]
- Laidou, S.; Alanis-Lobato, G.; Pribyl, J.; Raskó, T.; Tichy, B.; Mikulasek, K.; Tsagiopoulou, M.; Oppelt, J.; Kastrinaki, G.; Lefaki, M.; et al. Nuclear inclusions of pathogenic ataxin-1 induce oxidative stress and perturb the protein synthesis machinery. Redox Biol. 2020, 32, 101458. [Google Scholar] [CrossRef]
- Shimizu, H.; Nishimura, Y.; Shiide, Y.; Matsuda, H.; Akimoto, M.; Matsuda, M.; Nakamaru, Y.; Kato, Y.; Kondo, K. Evaluation of Pharmacokinetics, Safety, and Drug-Drug Interactions of an Oral Suspension of Edaravone in Healthy Adults. Clin. Pharmacol. Drug Dev. 2021, 10, 1174–1187. [Google Scholar] [CrossRef]
- Xu, J.; Wang, Y.; Wang, A.; Gao, Z.; Gao, X.; Chen, H.; Zhou, J.; Zhao, X.; Wang, Y. Safety and efficacy of Edaravone Dexborneol versus edaravone for patients with acute ischaemic stroke: A phase II, multicentre, randomised, double-blind, multiple-dose, active-controlled clinical trial. Stroke Vasc. Neurol. 2019, 4, 109–114. [Google Scholar] [CrossRef]
- Zhao, L.Q.; Parikh, A.; Xiong, Y.X.; Ye, Q.Y.; Ying, G.; Zhou, X.F.; Luo, H.Y. Neuroprotection of Oral Edaravone on Middle Cerebral Artery Occlusion in Rats. Neurotox. Res. 2022, 40, 995–1006. [Google Scholar] [CrossRef]
- Mitoma, H.; Manto, M. The physiological basis of therapies for cerebellar ataxias. Ther. Adv. Neurol. Disord. 2016, 9, 396–413. [Google Scholar] [CrossRef]
- Cendelin, J.; Mitoma, H.; Manto, M. Neurotransplantation Therapy and Cerebellar Reserve. CNS Neurol. Disord. Drug Targets 2018, 17, 172–183. [Google Scholar] [CrossRef]
- Zu, T.; Duvick, L.A.; Kaytor, M.D.; Berlinger, M.S.; Zoghbi, H.Y.; Clark, H.B.; Orr, H.T. Recovery from polyglutamine-induced neurodegeneration in conditional SCA1 transgenic mice. J. Neurosci. 2004, 24, 8853–8861. [Google Scholar] [CrossRef] [PubMed]
- Boy, J.; Schmidt, T.; Wolburg, H.; Mack, A.; Nuber, S.; Bottcher, M.; Schmitt, I.; Holzmann, C.; Zimmermann, F.; Servadio, A.; et al. Reversibility of symptoms in a conditional mouse model of spinocerebellar ataxia type 3. Hum. Mol. Genet. 2009, 18, 4282–4295. [Google Scholar] [CrossRef] [PubMed]
- Nag, N.; Tarlac, V.; Storey, E. Assessing the efficacy of specific cerebellomodulatory drugs for use as therapy for spinocerebellar ataxia type 1. Cerebellum 2013, 12, 74–82. [Google Scholar] [CrossRef] [PubMed]
- Schmidt, J.; Schmidt, T.; Golla, M.; Lehmann, L.; Weber, J.J.; Hübener-Schmid, J.; Riess, O. In vivo assessment of riluzole as a potential therapeutic drug for spinocerebellar ataxia type 3. J. Neurochem. 2016, 138, 150–162. [Google Scholar] [CrossRef] [PubMed]
- Romano, S.; Coarelli, G.; Marcotulli, C.; Leonardi, L.; Piccolo, F.; Spadaro, M.; Frontali, M.; Ferraldeschi, M.; Vulpiani, M.C.; Ponzelli, F.; et al. Riluzole in patients with hereditary cerebellar ataxia: A randomised, double-blind, placebo-controlled trial. Lancet Neurol. 2015, 14, 985–991. [Google Scholar] [CrossRef] [PubMed]
- Duarte-Silva, S.; Neves-Carvalho, A.; Soares-Cunha, C.; Teixeira-Castro, A.; Oliveira, P.; Silva-Fernandes, A.; Maciel, P. Lithium chloride therapy fails to improve motor function in a transgenic mouse model of Machado-Joseph disease. Cerebellum 2014, 13, 713–727. [Google Scholar] [CrossRef]
- Saute, J.A.; de Castilhos, R.M.; Monte, T.L.; Schumacher-Schuh, A.F.; Donis, K.C.; D’Ávila, R.; Souza, G.N.; Russo, A.D.; Furtado, G.V.; Gheno, T.C.; et al. A randomized, phase 2 clinical trial of lithium carbonate in Machado-Joseph disease. Mov. Disord. 2014, 29, 568–573. [Google Scholar] [CrossRef]
- Friedrich, J.; Kordasiewicz, H.B.; O’Callaghan, B.; Handler, H.P.; Wagener, C.; Duvick, L.; Swayze, E.E.; Rainwater, O.; Hofstra, B.; Benneyworth, M.; et al. Antisense oligonucleotide-mediated ataxin-1 reduction prolongs survival in SCA1 mice and reveals disease-associated transcriptome profiles. JCI Insight 2018, 3, e123193. [Google Scholar] [CrossRef]
- O’Callaghan, B.; Hofstra, B.; Handler, H.P.; Kordasiewicz, H.B.; Cole, T.; Duvick, L.; Friedrich, J.; Rainwater, O.; Yang, P.; Benneyworth, M.; et al. Antisense Oligonucleotide Therapeutic Approach for Suppression of Ataxin-1 Expression: A Safety Assessment. Mol. Ther. Nucleic Acids 2020, 21, 1006–1016. [Google Scholar] [CrossRef] [PubMed]
- Zhang, N.; Bewick, B.; Schultz, J.; Tiwari, A.; Krencik, R.; Zhang, A.; Adachi, K.; Xia, G.; Yun, K.; Sarkar, P.; et al. DNAzyme Cleavage of CAG Repeat RNA in Polyglutamine Diseases. Neurotherapeutics 2021, 18, 1710–1728. [Google Scholar] [CrossRef] [PubMed]
- Kaemmerer, W.F.; Low, W.C. Cerebellar allografts survive and transiently alleviate ataxia in a transgenic model of spinocerebellar ataxia type-1. Exp. Neurol. 1999, 158, 301–311. [Google Scholar] [CrossRef]
- Vrinten, D.H.; Hamers, F.F. ‘CatWalk’ automated quantitative gait analysis as a novel method to assess mechanical allodynia in the rat; a comparison with von Frey testing. Pain 2003, 102, 203–209. [Google Scholar] [CrossRef] [PubMed]
- Cendelin, J.; Voller, J.; Vozeh, F. Ataxic gait analysis in a mouse model of the olivocerebellar degeneration. Behav. Brain Res. 2010, 210, 8–15. [Google Scholar] [CrossRef] [PubMed]
- Ziegel, J.; Jensen, E.B.V.; Dorph-Petersen, K.A. Variance estimation for generalized Cavalieri estimators. Biometrika 2011, 98, 187–198. [Google Scholar] [CrossRef]
- Gundersen, H.J.; Jensen, E.B.; Kieu, K.; Nielsen, J. The efficiency of systematic sampling in stereology—Reconsidered. J. Microsc. 1999, 193, 199–211. [Google Scholar] [CrossRef]
- Palomero-Gallagher, N.; Kedo, O.; Mohlberg, H.; Zilles, K.; Amunts, K. Multimodal mapping and analysis of the cyto- and receptorarchitecture of the human hippocampus. Brain Struct. Funct. 2020, 225, 881–907. [Google Scholar] [CrossRef]
- Komlódi, T.; Sobotka, O.; Krumschnabel, G.; Bezuidenhout, N.; Hiller, E.; Doerrier, C.; Gnaiger, E. Comparison of Mitochondrial Incubation Media for Measurement of Respiration and Hydrogen Peroxide Production. Methods Mol. Biol. 2018, 1782, 137–155. [Google Scholar]
- Jedlička, J.; Tůma, Z.; Razak, K.; Kunc, R.; Kala, A.; Proskauer Pena, S.; Lerchner, T.; Ježek, K.; Kuncová, J. Impact of aging on mitochondrial respiration in various organs. Physiol. Res. 2022, 71, S227–s236. [Google Scholar] [CrossRef]
- R Core Team. A Language and Environment for Statistical Computing; R Foundation for Statistical Computing: Vienna, Austria, 2022; Available online: https://www.R-project.org/ (accessed on 10 March 2023).
- Posit Team RStudio: Integrated Development Environment for R; Posit Software, PBC: Boston, MA, USA, 2022; Available online: http://www.posit.co/ (accessed on 10 March 2023).
- Bürkner, P.-C. Advanced Bayesian Multilevel Modeling with the R Package brms. R J. 2018, 10, 395–411. [Google Scholar] [CrossRef]
- Bürkner, P.-C. An R Package for Bayesian Multilevel Models Using Stan. J. Stat. Softw. 2017, 80, 1–28. [Google Scholar] [CrossRef]
- Carpenter, B.; Gelman, A.; Hoffman, M.D.; Lee, D.; Goodrich, B.; Betancourt, M.; Brubaker, M.; Guo, J.; Li, P.; Riddell, A. Stan: A probabilistic programming language. J. Stat. Softw. 2017, 76, 1–32. [Google Scholar] [CrossRef] [PubMed]
- Stan Development Team RStan: The R interface to Stan. Available online: https://mc-stan.org/ (accessed on 12 March 2023).
- Gelman, A.; Carlin, J.B.; Stern, H.S.; Dunson, D.B.; Vehtari, A.; Rubin, D.B. Bayesian Data Analysis, 3rd ed.; CRC Press: Boca Raton, FL, USA, 2014. [Google Scholar]
- Vehtari, A.; Gelman, A.; Gabry, J. Practical Bayesian model evaluation using leave-one-out cross-validation and WAIC. Stat. Comput. 2017, 27, 1413–1432. [Google Scholar] [CrossRef]
- Oksanen, J.; Simpson, G.; Blanchet, F.; Kindt, R.; Legendre, P.; Minchin, P.; O’Hara, R.; Solymos, P.; Stevens, M.; Szoecs, E.; et al. vegan: Community Ecology Package. R Package Version 2.6-4. 2022. Available online: https://CRAN.R-project.org/package=vegan (accessed on 15 March 2023).
- Makowski, D.; Ben-Shachar, M.S.; Chen, S.H.A.; Lüdecke, D. Indices of Effect Existence and Significance in the Bayesian Framework. Front. Psychol. 2019, 10, 2767. [Google Scholar] [CrossRef]


Disclaimer/Publisher’s Note: The statements, opinions and data contained in all publications are solely those of the individual author(s) and contributor(s) and not of MDPI and/or the editor(s). MDPI and/or the editor(s) disclaim responsibility for any injury to people or property resulting from any ideas, methods, instructions or products referred to in the content. |
© 2023 by the authors. Licensee MDPI, Basel, Switzerland. This article is an open access article distributed under the terms and conditions of the Creative Commons Attribution (CC BY) license (https://creativecommons.org/licenses/by/4.0/).
Share and Cite
Sucha, M.; Benediktova, S.; Tichanek, F.; Jedlicka, J.; Kapl, S.; Jelinkova, D.; Purkartova, Z.; Tuma, J.; Kuncova, J.; Cendelin, J. Experimental Treatment with Edaravone in a Mouse Model of Spinocerebellar Ataxia 1. Int. J. Mol. Sci. 2023, 24, 10689. https://doi.org/10.3390/ijms241310689
Sucha M, Benediktova S, Tichanek F, Jedlicka J, Kapl S, Jelinkova D, Purkartova Z, Tuma J, Kuncova J, Cendelin J. Experimental Treatment with Edaravone in a Mouse Model of Spinocerebellar Ataxia 1. International Journal of Molecular Sciences. 2023; 24(13):10689. https://doi.org/10.3390/ijms241310689
Chicago/Turabian StyleSucha, Martina, Simona Benediktova, Filip Tichanek, Jan Jedlicka, Stepan Kapl, Dana Jelinkova, Zdenka Purkartova, Jan Tuma, Jitka Kuncova, and Jan Cendelin. 2023. "Experimental Treatment with Edaravone in a Mouse Model of Spinocerebellar Ataxia 1" International Journal of Molecular Sciences 24, no. 13: 10689. https://doi.org/10.3390/ijms241310689
APA StyleSucha, M., Benediktova, S., Tichanek, F., Jedlicka, J., Kapl, S., Jelinkova, D., Purkartova, Z., Tuma, J., Kuncova, J., & Cendelin, J. (2023). Experimental Treatment with Edaravone in a Mouse Model of Spinocerebellar Ataxia 1. International Journal of Molecular Sciences, 24(13), 10689. https://doi.org/10.3390/ijms241310689