
Investigating the Urinary Metabolome in the First Year of Life and Its Association with Later Diagnosis of Autism Spectrum Disorder or Non-Typical Neurodevelopment in the MARBLES Study
 , and
, and
Abstract
1. Introduction
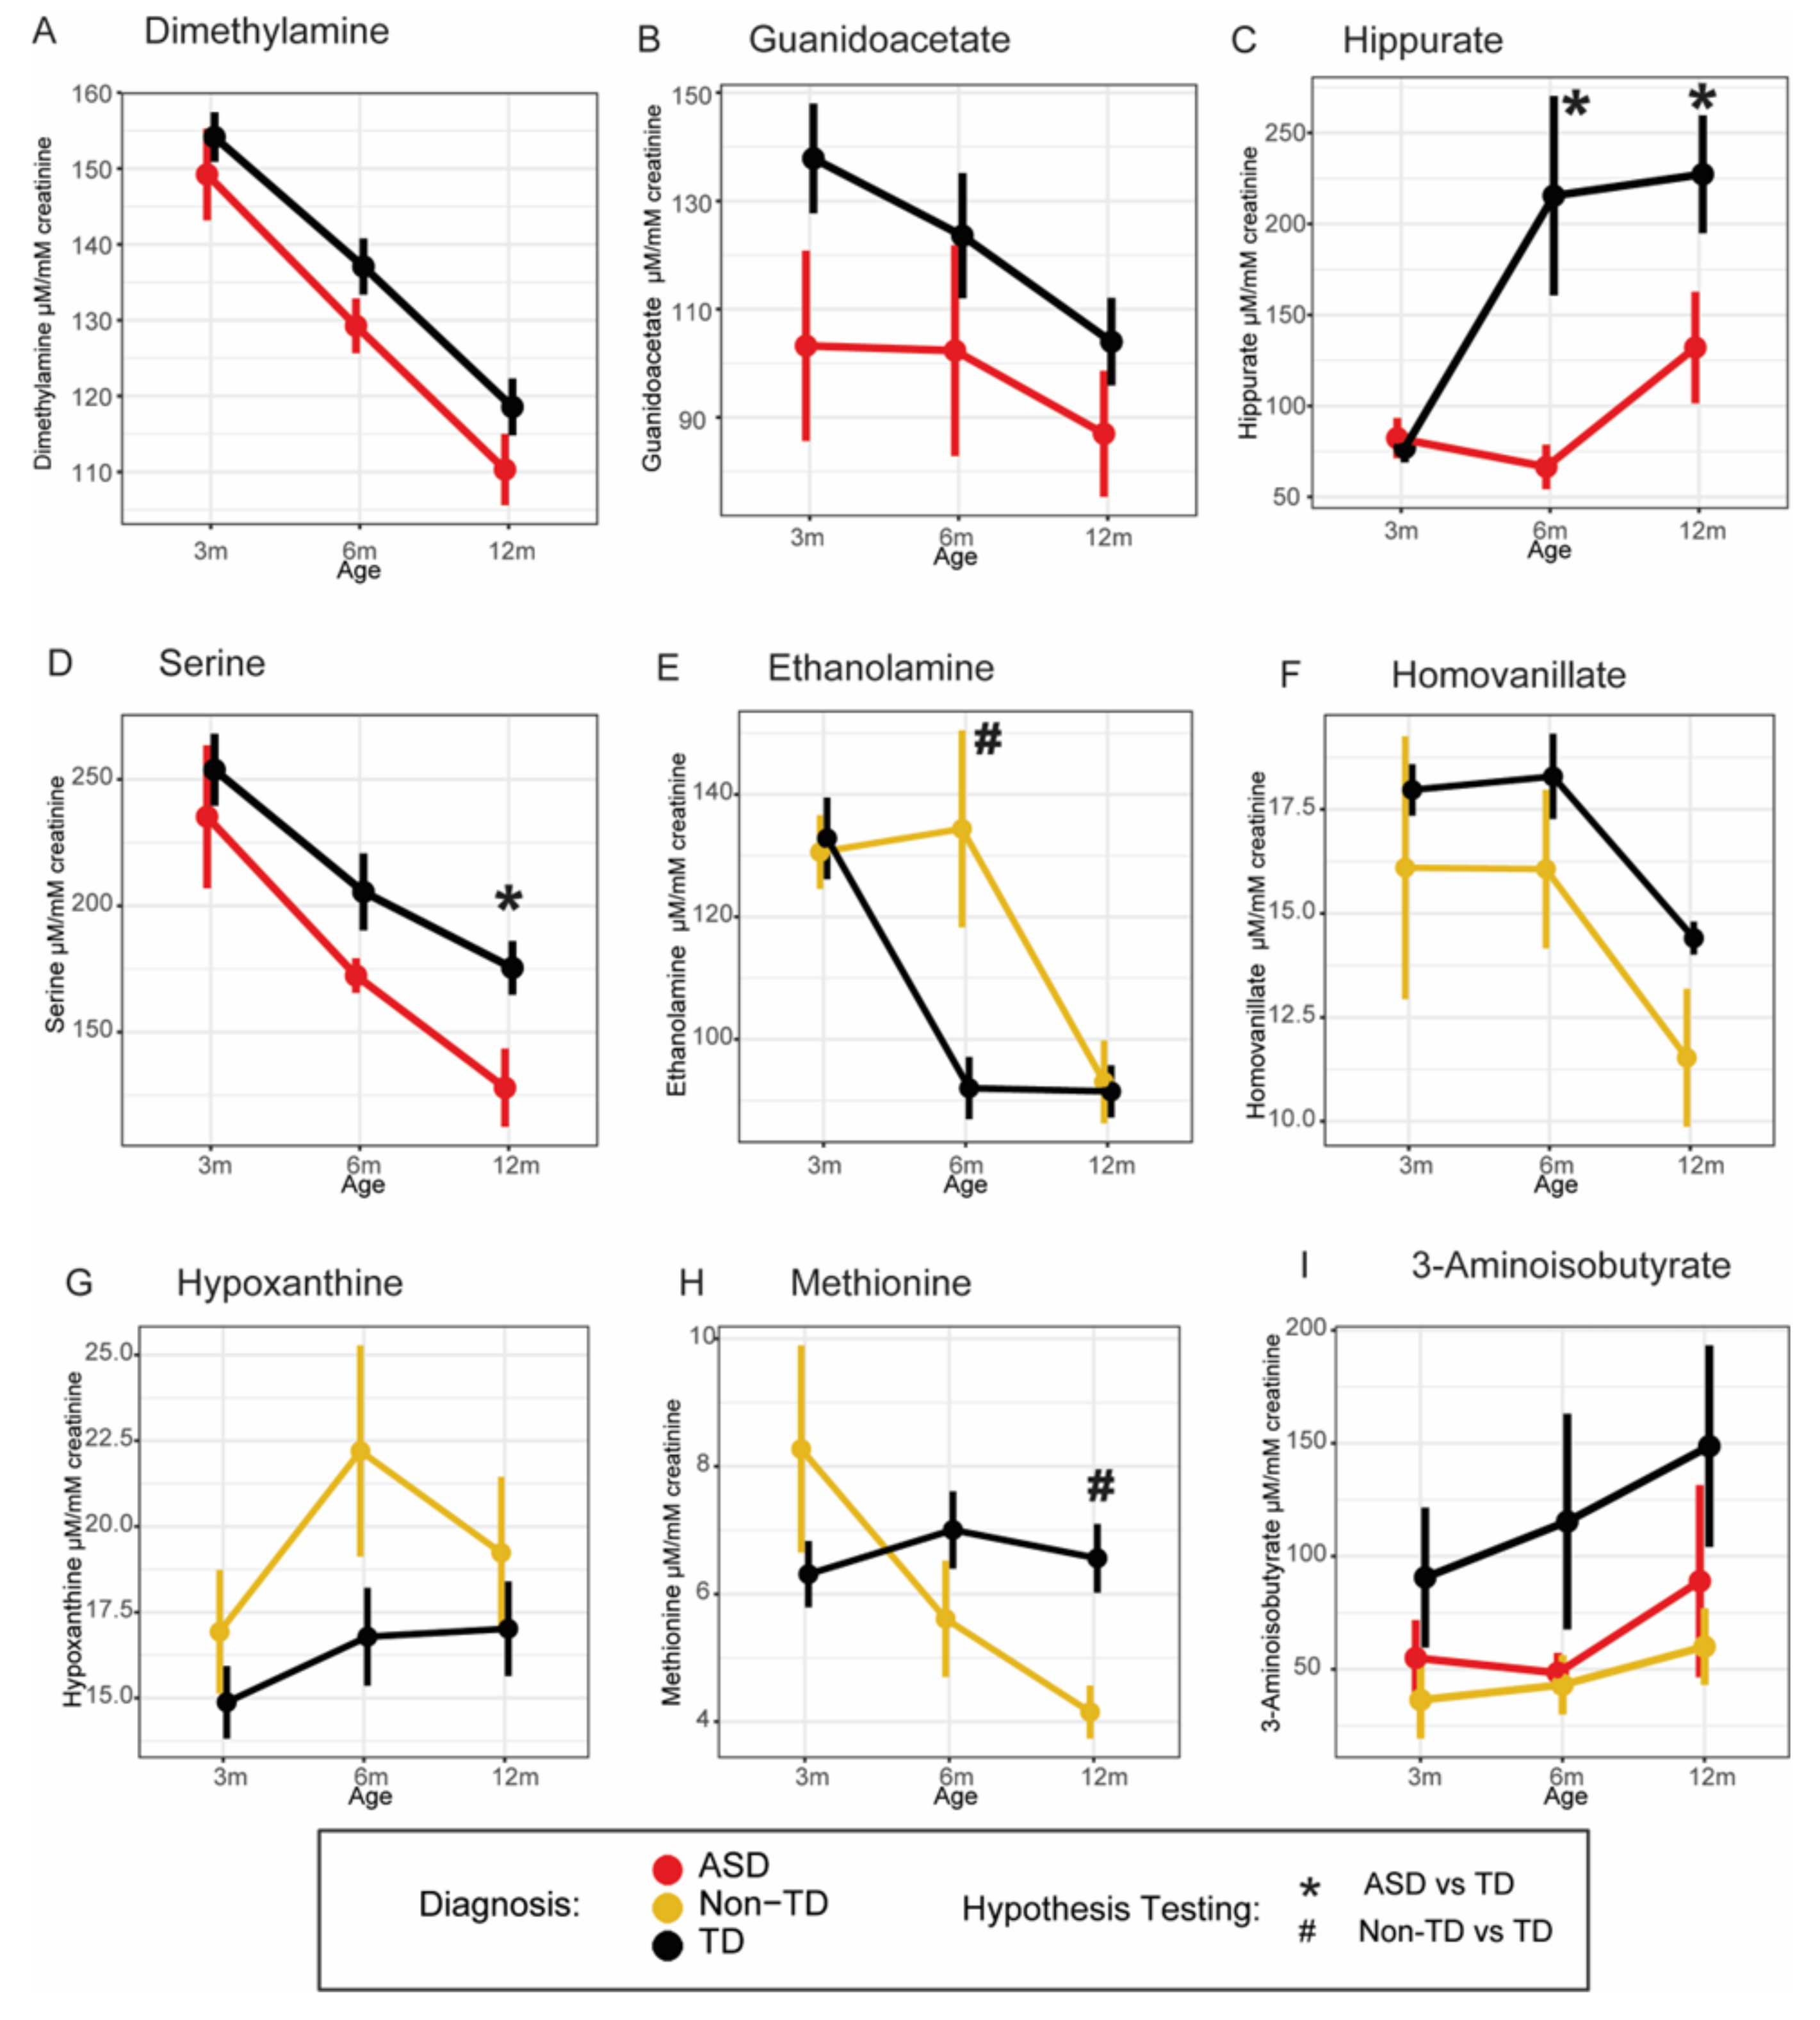
2. Results
3. Discussion
4. Materials and Methods
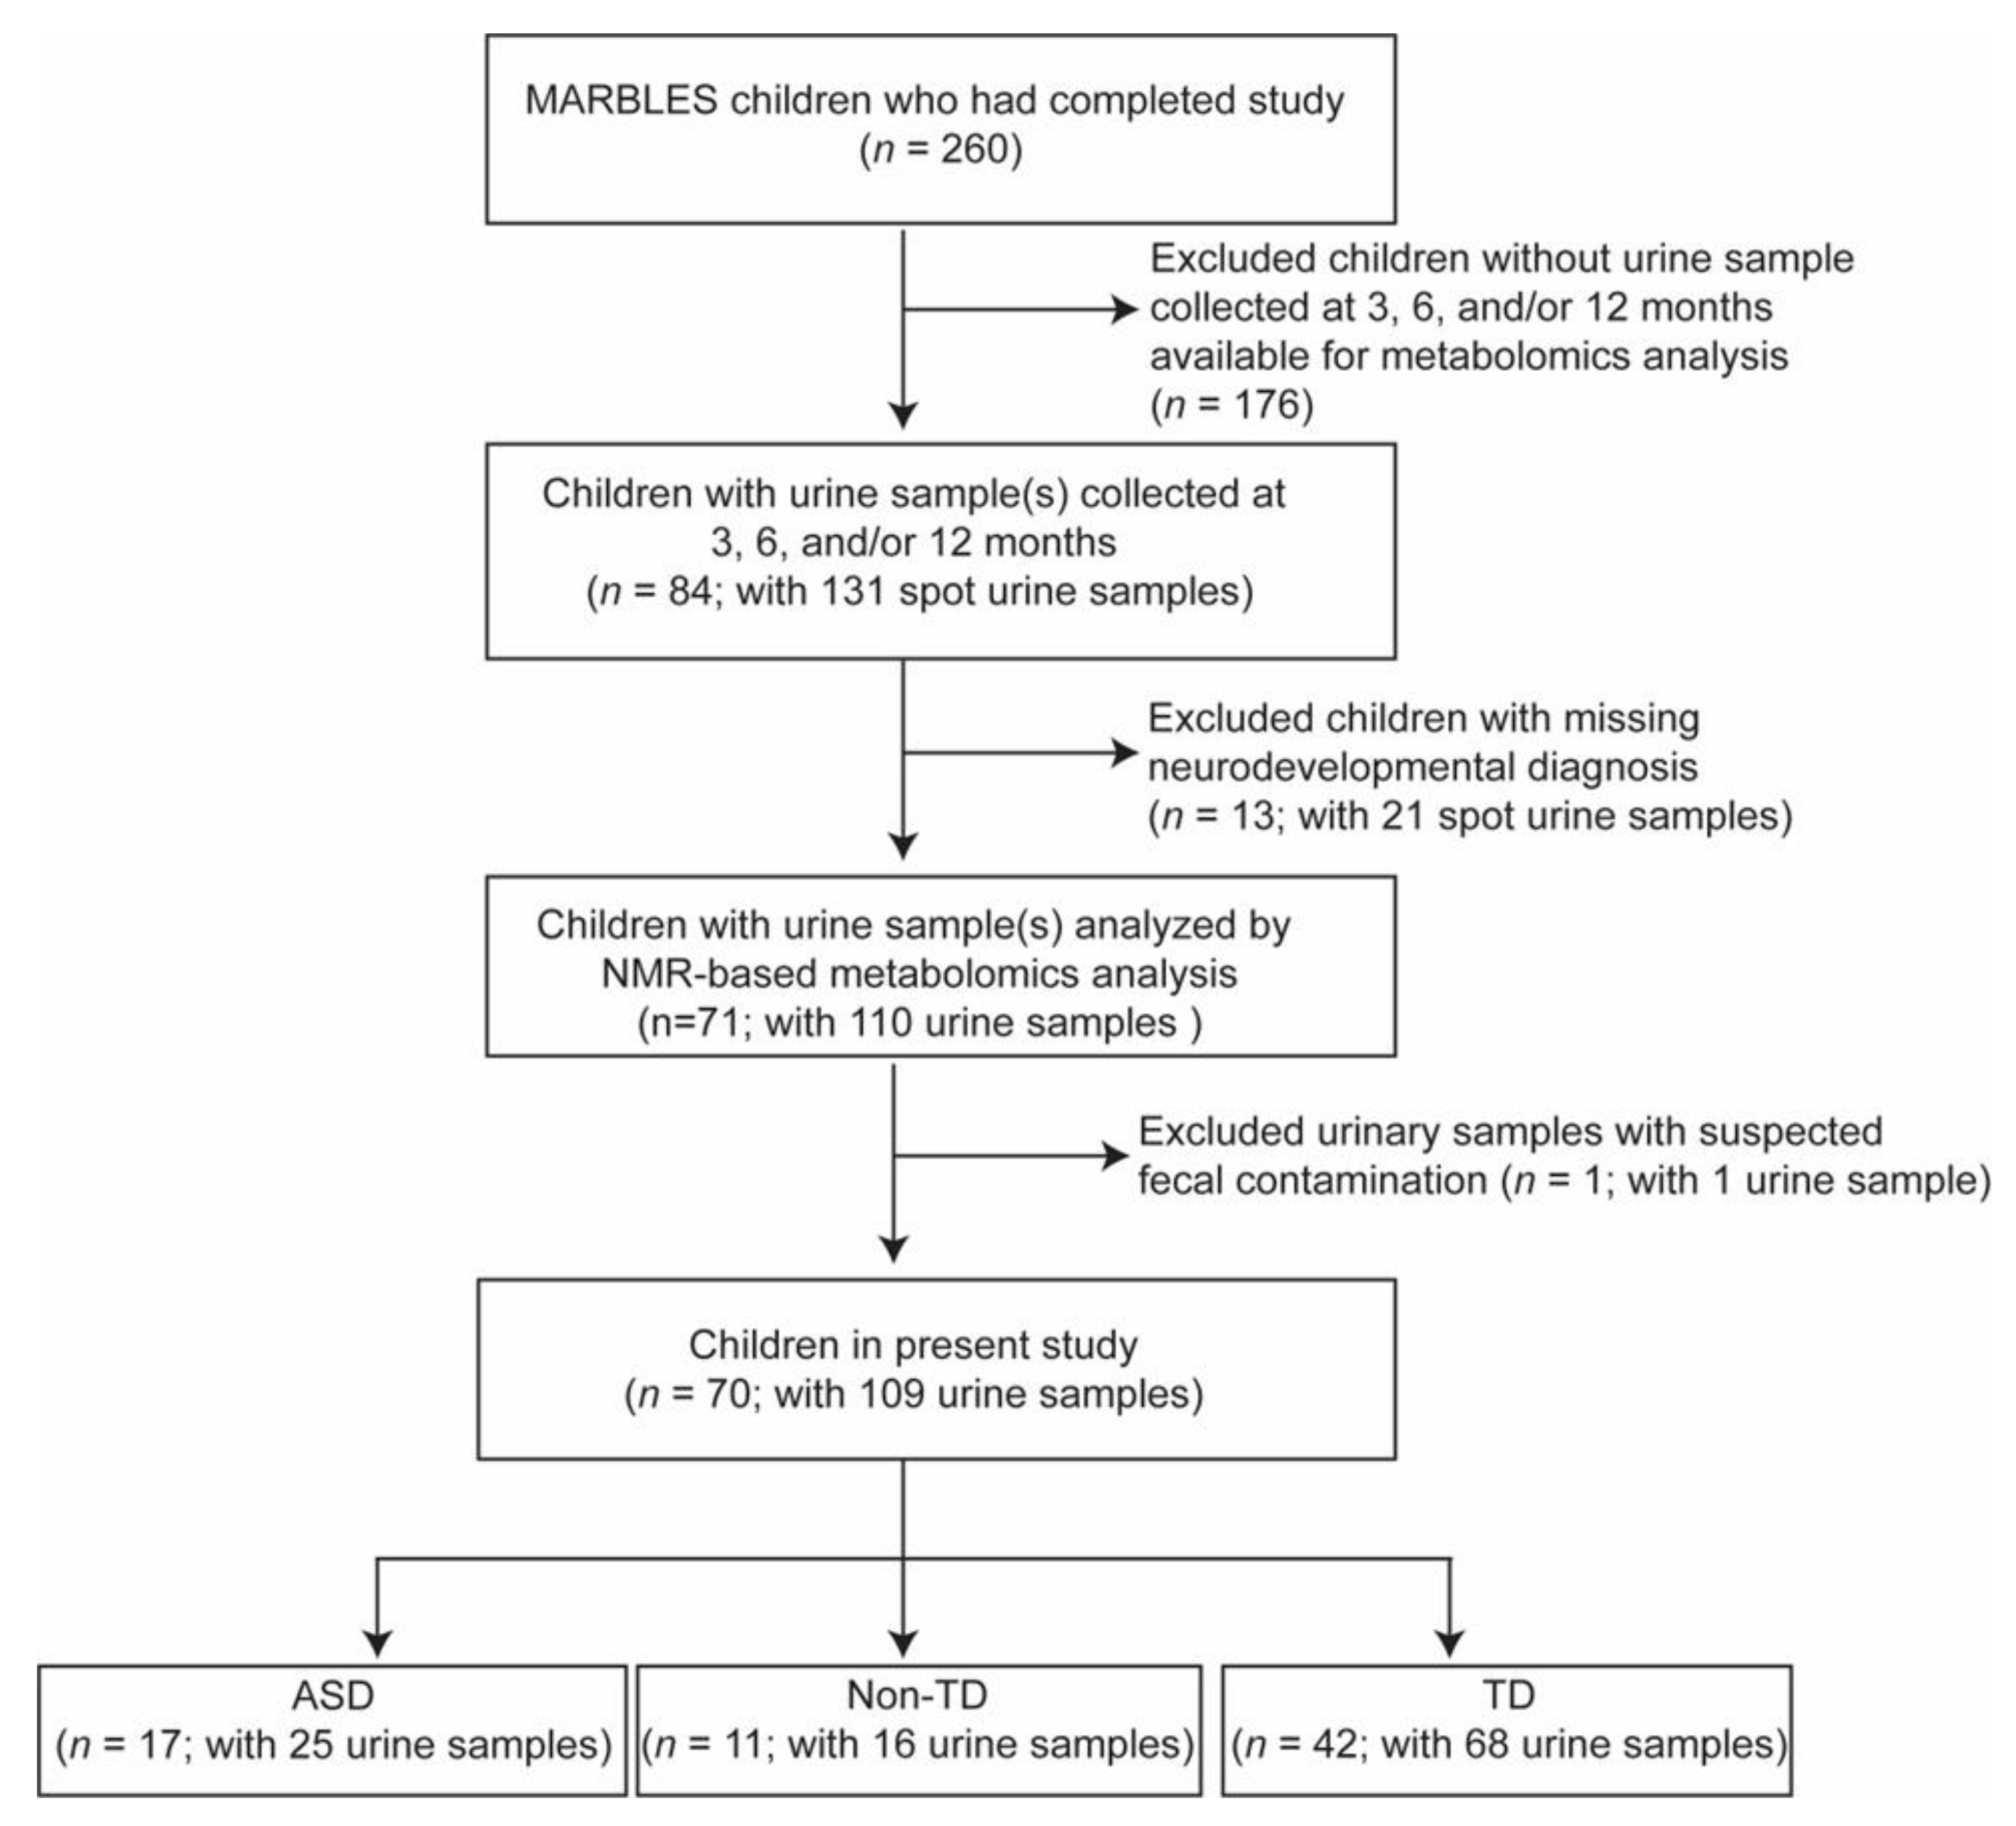
4.1. Study Population
4.2. 1H-NMR Metabolomics Analysis
4.3. Statistical Analysis
Supplementary Materials
Author Contributions
Funding
Institutional Review Board Statement
Informed Consent Statement
Data Availability Statement
Acknowledgments
Conflicts of Interest
References
- Stiles, J.; Jernigan, T.L. The basics of brain development. Neuropsychol. Rev. 2010, 20, 327–348. [Google Scholar] [CrossRef] [PubMed]
- Kelada, S.N.; Eaton, D.L.; Wang, S.S.; Rothman, N.R.; Khoury, M.J. The role of genetic polymorphisms in environmental health. Environ. Health Perspect. 2003, 111, 1055–1064. [Google Scholar] [CrossRef] [PubMed]
- Casanova, M.F. The neuropathology of autism. Brain Pathol. 2007, 17, 422–433. [Google Scholar] [CrossRef]
- Zablotsky, B.; Black, L.I.; Maenner, M.J.; Schieve, L.A.; Danielson, M.L.; Bitsko, R.H.; Blumberg, S.J.; Kogan, M.D.; Boyle, C.A. Prevalence and Trends of Developmental Disabilities among Children in the United States: 2009–2017. Pediatrics 2019, 144, e20190811. [Google Scholar] [CrossRef]
- Glinton, K.E.; Elsea, S.H. Untargeted Metabolomics for Autism Spectrum Disorders: Current Status and Future Directions. Front. Psychiatry 2019, 10, 647. [Google Scholar] [CrossRef] [PubMed]
- Troisi, J.; Autio, R.; Beopoulos, T.; Bravaccio, C.; Carraturo, F.; Corrivetti, G.; Cunningham, S.; Devane, S.; Fallin, D.; Fetissov, S.; et al. Genome, Environment, Microbiome and Metabolome in Autism (GEMMA) Study Design: Biomarkers Identification for Precision Treatment and Primary Prevention of Autism Spectrum Disorders by an Integrated Multi-Omics Systems Biology Approach. Brain Sci. 2020, 10, 743. [Google Scholar] [CrossRef]
- Likhitweerawong, N.; Thonusin, C.; Boonchooduang, N.; Louthrenoo, O.; Nookaew, I.; Chattipakorn, N.; Chattipakorn, S.C. Profiles of urine and blood metabolomics in autism spectrum disorders. Metab. Brain Dis. 2021, 36, 1641–1671. [Google Scholar] [CrossRef]
- Orozco, J.S.; Hertz-Picciotto, I.; Abbeduto, L.; Slupsky, C.M. Metabolomics analysis of children with autism, idiopathic-developmental delays, and Down syndrome. Transl. Psychiatry 2019, 9, 243. [Google Scholar] [CrossRef]
- De Angelis, M.; Piccolo, M.; Vannini, L.; Siragusa, S.; De Giacomo, A.; Serrazzanetti, D.I.; Cristofori, F.; Guerzoni, M.E.; Gobbetti, M.; Francavilla, R. Fecal Microbiota and Metabolome of Children with Autism and Pervasive Developmental Disorder Not Otherwise Specified. PLoS ONE 2013, 8, e76993. [Google Scholar] [CrossRef]
- Ming, X.; Stein, T.P.; Barnes, V.; Rhodes, N.; Guo, L. Metabolic perturbance in autism spectrum disorders: A metabolomics study. J. Proteome Res. 2012, 11, 5856–5862. [Google Scholar] [CrossRef]
- West, P.R.; Amaral, D.G.; Bais, P.; Smith, A.M.; Egnash, L.A.; Ross, M.E.; Palmer, J.A.; Fontaine, B.R.; Conard, K.R.; Corbett, B.A. Metabolomics as a tool for discovery of biomarkers of autism spectrum disorder in the blood plasma of children. PLoS ONE 2014, 9, e112445. [Google Scholar] [CrossRef] [PubMed]
- Lussu, M.; Noto, A.; Masili, A.; Rinaldi, A.C.; Dessi, A.; De Angelis, M.; De Giacomo, A.; Fanos, V.; Atzori, L.; Francavilla, R. The urinary (1) H-NMR metabolomics profile of an italian autistic children population and their unaffected siblings. Autism Res. 2017, 10, 1058–1066. [Google Scholar] [CrossRef] [PubMed]
- Mavel, S.; Nadal-Desbarats, L.; Blasco, H.; Bonnet-Brilhault, F.; Barthélémy, C.; Montigny, F.; Sarda, P.; Laumonnier, F.; Vourc, P.; Andres, C.R. 1H–13C NMR-based urine metabolic profiling in autism spectrum disorders. Talanta 2013, 114, 95–102. [Google Scholar] [CrossRef] [PubMed]
- Schmidt, R.J.; Hansen, R.L.; Hartiala, J.; Allayee, H.; Schmidt, L.C.; Tancredi, D.J.; Tassone, F.; Hertz-Picciotto, I. Prenatal vitamins, one-carbon metabolism gene variants, and risk for autism. Epidemiology 2011, 22, 476–485. [Google Scholar] [CrossRef] [PubMed]
- Noto, A.; Fanos, V.; Barberini, L.; Grapov, D.; Fattuoni, C.; Zaffanello, M.; Casanova, A.; Fenu, G.; De Giacomo, A.; De Angelis, M.; et al. The urinary metabolomics profile of an Italian autistic children population and their unaffected siblings. J. Matern. Fetal. Neonatal. Med. 2014, 27 (Suppl. 2), 46–52. [Google Scholar] [CrossRef]
- Gevi, F.; Zolla, L.; Gabriele, S.; Persico, A.M. Urinary metabolomics of young Italian autistic children supports abnormal tryptophan and purine metabolism. Mol. Autism. 2016, 7, 47. [Google Scholar] [CrossRef]
- Rangel-Huerta, O.D.; Gómez-Fernández, A.; de la Torre-Aguilar, M.J.; Gil, A.; Pérez-Navero, J.L.; Flores-Rojas, K.; Martín-Borreguero, P.; Gil-Campos, M. Metabolic profiling in children with autism spectrum disorder with and without mental regression: Preliminary results from a cross-sectional case–control study. Metabolomics 2019, 15, 1–11. [Google Scholar] [CrossRef]
- Bitar, T.; Mavel, S.; Emond, P.; Nadal-Desbarats, L.; Lefèvre, A.; Mattar, H.; Soufia, M.; Blasco, H.; Vourc’h, P.; Hleihel, W. Identification of metabolic pathway disturbances using multimodal metabolomics in autistic disorders in a Middle Eastern population. J. Pharm. Biomed. Anal. 2018, 152, 57–65. [Google Scholar] [CrossRef]
- Altieri, L.; Neri, C.; Sacco, R.; Curatolo, P.; Benvenuto, A.; Muratori, F.; Santocchi, E.; Bravaccio, C.; Lenti, C.; Saccani, M.; et al. Urinary p-cresol is elevated in small children with severe autism spectrum disorder. Biomarkers 2011, 16, 252–260. [Google Scholar] [CrossRef]
- Gabriele, S.; Sacco, R.; Cerullo, S.; Neri, C.; Urbani, A.; Tripi, G.; Malvy, J.; Barthelemy, C.; Bonnet-Brihault, F.; Persico, A.M. Urinary p-cresol is elevated in young French children with autism spectrum disorder: A replication study. Biomarkers 2014, 19, 463–470. [Google Scholar] [CrossRef]
- Persico, A.M.; Napolioni, V. Urinary p-cresol in autism spectrum disorder. Neurotoxicol. Teratol. 2013, 36, 82–90. [Google Scholar] [CrossRef] [PubMed]
- Emond, P.; Mavel, S.; Aïdoud, N.; Nadal-Desbarats, L.; Montigny, F.; Bonnet-Brilhault, F.; Barthélémy, C.; Merten, M.; Sarda, P.; Laumonnier, F. GC-MS-based urine metabolic profiling of autism spectrum disorders. Anal. Bioanal. Chem. 2013, 405, 5291–5300. [Google Scholar] [CrossRef] [PubMed]
- Yap, I.K.; Angley, M.; Veselkov, K.A.; Holmes, E.; Lindon, J.C.; Nicholson, J.K. Urinary metabolic phenotyping differentiates children with autism from their unaffected siblings and age-matched controls. J. Proteome Res. 2010, 9, 2996–3004. [Google Scholar] [CrossRef]
- Evans, C.; Dunstan, R.H.; Rothkirch, T.; Roberts, T.K.; Reichelt, K.L.; Cosford, R.; Deed, G.; Ellis, L.B.; Sparkes, D.L. Altered amino acid excretion in children with autism. Nutr. Neurosci. 2008, 11, 9–17. [Google Scholar] [CrossRef] [PubMed]
- Kaluzna-Czaplinska, J. Noninvasive urinary organic acids test to assess biochemical and nutritional individuality in autistic children. Clin. Biochem. 2011, 44, 686–691. [Google Scholar] [CrossRef]
- Elwyn, D.; Sprinson, D.B. The synthesis of thymine and purines from serine and glycine in the rat. J. Biol. Chem. 1954, 207, 467–476. [Google Scholar] [CrossRef]
- Tanianskii, D.A.; Jarzebska, N.; Birkenfeld, A.L.; O’Sullivan, J.F.; Rodionov, R.N. Beta-Aminoisobutyric Acid as a Novel Regulator of Carbohydrate and Lipid Metabolism. Nutrients 2019, 11, 524. [Google Scholar] [CrossRef] [PubMed]
- Cook, E.H.; Leventhal, B.L. The serotonin system in autism. Curr. Opin. Pediatr. 1996, 8, 348–354. [Google Scholar] [CrossRef] [PubMed]
- Kanai, M.; Funakoshi, H.; Takahashi, H.; Hayakawa, T.; Mizuno, S.; Matsumoto, K.; Nakamura, T. Tryptophan 2,3-dioxygenase is a key modulator of physiological neurogenesis and anxiety-related behavior in mice. Mol. Brain 2009, 2, 8. [Google Scholar] [CrossRef]
- Brown, A.S.; Gershon, S. Dopamine and depression. J. Neural Transm. Gen. Sect. JNT 1993, 91, 75–109. [Google Scholar] [CrossRef]
- Patel, D.; Witt, S.N. Ethanolamine and Phosphatidylethanolamine: Partners in Health and Disease. Oxid. Med. Cell Longev. 2017, 2017, 4829180. [Google Scholar] [CrossRef] [PubMed]
- Cole, D.E.; Farag, S.; Dooley, K.C. Ethanolaminuria: A non-specific laboratory finding in the seriously ill infant. Clin. Biochem. 1988, 21, 297–300. [Google Scholar] [CrossRef] [PubMed]
- Lees, H.J.; Swann, J.R.; Wilson, I.D.; Nicholson, J.K.; Holmes, E. Hippurate: The natural history of a mammalian–microbial cometabolite. J. Proteome Res. 2013, 12, 1527–1546. [Google Scholar] [CrossRef] [PubMed]
- Mussap, M.; Siracusano, M.; Noto, A.; Fattuoni, C.; Riccioni, A.; Rajula, H.S.R.; Fanos, V.; Curatolo, P.; Barberini, L.; Mazzone, L. The Urine Metabolome of Young Autistic Children Correlates with Their Clinical Profile Severity. Metabolites 2020, 10, 476. [Google Scholar] [CrossRef] [PubMed]
- Asatoor, A.M.; Simeshoff, M.L. The origin of urinary dimethylamine. Biochim. Biophys. Acta-Gen. Subj. 1965, 111, 384–392. [Google Scholar] [CrossRef] [PubMed]
- Bhargava, P.; Schnellmann, R.G. Mitochondrial energetics in the kidney. Nat. Rev. Nephrol. 2017, 13, 629–646. [Google Scholar] [CrossRef]
- Chiang, K.V.; Hamner, H.C.; Li, R.; Perrine, C.G. Timing of Introduction of Complementary Foods-United States, 2016–2018. Morb. Mortal. Wkly. Rep. 2020, 69, 1787–1791. [Google Scholar] [CrossRef]
- Lockner, D.W.; Crowe, T.K.; Skipper, B.J. Dietary Intake and Parents’ Perception of Mealtime Behaviors in Preschool-Age Children with Autism Spectrum Disorder and in Typically Developing Children. J. Am. Diet. Assoc. 2008, 108, 1360–1363. [Google Scholar] [CrossRef]
- Cermak, S.A.; Curtin, C.; Bandini, L.G. Food Selectivity and Sensory Sensitivity in Children with Autism Spectrum Disorders. J. Am. Diet. Assoc. 2010, 110, 238–246. [Google Scholar] [CrossRef]
- Bandini, L.G.; Curtin, C.; Phillips, S.; Anderson, S.E.; Maslin, M.; Must, A. Changes in Food Selectivity in Children with Autism Spectrum Disorder. J. Autism Dev. Disord. 2017, 47, 439–446. [Google Scholar] [CrossRef]
- Leader, G.; Tuohy, E.; Chen, J.L.; Mannion, A.; Gilroy, S.P. Feeding problems, gastrointestinal symptoms, challenging behavior and sensory issues in children and adolescents with autism spectrum disorder. J. Autism Dev. Disord. 2020, 50, 1401–1410. [Google Scholar] [CrossRef]
- Ledford, J.R.; Gast, D.L. Feeding Problems in Children With Autism Spectrum Disorders:A Review. Focus Autism Other Dev. Disabil. 2006, 21, 153–166. [Google Scholar] [CrossRef]
- Seiverling, L.; Towle, P.; Hendy, H.M.; Pantelides, J. Prevalence of feeding problems in young children with and without autism spectrum disorder: A chart review study. J. Early Interv. 2018, 40, 335–346. [Google Scholar] [CrossRef]
- Emond, A.; Emmett, P.; Steer, C.; Golding, J. Feeding symptoms, dietary patterns, and growth in young children with autism spectrum disorders. Pediatrics 2010, 126, e337–e342. [Google Scholar] [CrossRef]
- Playdon, M.C.; Sampson, J.N.; Cross, A.J.; Sinha, R.; Guertin, K.A.; Moy, K.A.; Rothman, N.; Irwin, M.L.; Mayne, S.T.; Stolzenberg-Solomon, R.; et al. Comparing metabolite profiles of habitual diet in serum and urine. Am. J. Clin. Nutr. 2016, 104, 776–789. [Google Scholar] [CrossRef] [PubMed]
- Capozzi, F. NMR-based metabolomics: The foodome and the assessment of dietary exposure as a key step to evaluate the effect of diet on health. In Modern Magnetic Resonance; Springer: Cham, Switzerland, 2017. [Google Scholar]
- Andersen, M.-B.S.; Rinnan, Å.; Manach, C.; Poulsen, S.K.; Pujos-Guillot, E.; Larsen, T.M.; Astrup, A.; Dragsted, L.O. Untargeted Metabolomics as a Screening Tool for Estimating Compliance to a Dietary Pattern. J. Proteome Res. 2014, 13, 1405–1418. [Google Scholar] [CrossRef] [PubMed]
- Nadal-Desbarats, L.; Aïdoud, N.; Emond, P.; Blasco, H.; Filipiak, I.; Sarda, P.; Bonnet-Brilhault, F.; Mavel, S.; Andres, C.R. Combined 1 H-NMR and 1 H–13 C HSQC-NMR to improve urinary screening in autism spectrum disorders. Analyst 2014, 139, 3460–3468. [Google Scholar] [CrossRef] [PubMed]
- Dieme, B.; Mavel, S.; Blasco, H.; Tripi, G.; Bonnet-Brilhault, F.; Malvy, J.; Bocca, C.; Andres, C.R.; Nadal-Desbarats, L.; Emond, P. Metabolomics Study of Urine in Autism Spectrum Disorders Using a Multiplatform Analytical Methodology. J. Proteome Res. 2015, 14, 5273–5282. [Google Scholar] [CrossRef]
- Cozzolino, R.; De Magistris, L.; Saggese, P.; Stocchero, M.; Martignetti, A.; Di Stasio, M.; Malorni, A.; Marotta, R.; Boscaino, F.; Malorni, L. Use of solid-phase microextraction coupled to gas chromatography–mass spectrometry for determination of urinary volatile organic compounds in autistic children compared with healthy controls. Anal. Bioanal. Chem. 2014, 406, 4649–4662. [Google Scholar] [CrossRef]
- Chen, Q.; Qiao, Y.; Xu, X.-J.; You, X.; Tao, Y. Urine organic acids as potential biomarkers for autism-spectrum disorder in Chinese children. Front. Cell. Neurosci. 2019, 13, 150. [Google Scholar] [CrossRef]
- Xiong, X.; Liu, D.; Wang, Y.; Zeng, T.; Peng, Y. Urinary 3-(3-Hydroxyphenyl)-3-hydroxypropionic Acid, 3-Hydroxyphenylacetic Acid, and 3-Hydroxyhippuric Acid Are Elevated in Children with Autism Spectrum Disorders. Biomed. Res. Int. 2016, 2016, 9485412. [Google Scholar] [CrossRef] [PubMed]
- Hertz-Picciotto, I.; Schmidt, R.J.; Walker, C.K.; Bennett, D.H.; Oliver, M.; Shedd-Wise, K.M.; LaSalle, J.M.; Giulivi, C.; Puschner, B.; Thomas, J.; et al. A Prospective Study of Environmental Exposures and Early Biomarkers in Autism Spectrum Disorder: Design, Protocols, and Preliminary Data from the MARBLES Study. Environ. Health Perspect. 2018, 126, 117004. [Google Scholar] [CrossRef] [PubMed]
- Ozonoff, S.; Young, G.S.; Carter, A.; Messinger, D.; Yirmiya, N.; Zwaigenbaum, L.; Bryson, S.; Carver, L.J.; Constantino, J.N.; Dobkins, K.; et al. Recurrence risk for autism spectrum disorders: A Baby Siblings Research Consortium study. Pediatrics 2011, 128, e488–e495. [Google Scholar] [CrossRef]
- Elm, E.V. The Strengthening the Reporting of Observational Studies in Epidemiology (STROBE) statement: Guidelines for reporting observational studies. Ann. Inter. Med. 2007, 147, 573–577. [Google Scholar] [CrossRef] [PubMed]
- Lord, C.; Rutter, M.; DiLavore, P.; Risi, S.; Gotham, K.; Bishop, S. Autism Diagnostic Observation Schedule, 2nd ed.; (ADOS-2); Western Psychological Corporation: Los Angeles, CA, USA, 2012. [Google Scholar]
- He, X.; Sotelo-Orozco, J.; Rudolph, C.; Lönnerdal, B.; Slupsky, C.M. The Role of Protein and Free Amino Acids on Intake, Metabolism, and Gut Microbiome: A Comparison Between Breast-Fed and Formula-Fed Rhesus Monkey Infants. Front. Pediatr. 2020, 7, 563. [Google Scholar] [CrossRef] [PubMed]
- Slupsky, C.M.; Rankin, K.N.; Wagner, J.; Fu, H.; Chang, D.; Weljie, A.M.; Saude, E.J.; Lix, B.; Adamko, D.J.; Shah, S.; et al. Investigations of the effects of gender, diurnal variation, and age in human urinary metabolomic profiles. Anal. Chem. 2007, 79, 6995–7004. [Google Scholar] [CrossRef]
- Weljie, A.M.; Newton, J.; Mercier, P.; Carlson, E.; Slupsky, C.M. Targeted profiling: Quantitative analysis of 1H NMR metabolomics data. Anal. Chem. 2006, 78, 4430–4442. [Google Scholar] [CrossRef]
- He, X.; Parenti, M.; Grip, T.; Domellöf, M.; Lönnerdal, B.; Hernell, O.; Timby, N.; Slupsky, C.M. Metabolic phenotype of breast-fed infants, and infants fed standard formula or bovine MFGM supplemented formula: A randomized controlled trial. Sci. Rep. 2019, 9, 339. [Google Scholar] [CrossRef]


| Diagnosis | ||||
|---|---|---|---|---|
| N = 70 | TD (N = 42) | ASD (N = 17) | Non-TD (N = 11) | p-Value a |
| Child sex, n (%) | ||||
| Female | 21 (50.00%) | 02 (11.76%) | 06 (54.55%) | 0.016 * |
| Male | 21 (50.00%) | 15 (88.24%) | 05 (45.45%) | |
| Child race/ethnicity, n (%) | ||||
| Non-Hispanic White | 15 (35.71%) | 07 (41.18%) | 05 (45.45%) | 0.55 |
| Hispanic, any race | 15 (35.71%) | 04 (23.53%) | 05 (45.45%) | |
| Other b | 12 (28.57%) | 06 (35.29%) | 01 (09.09%) | |
| Age (months) of introduction to complementary foods/solids, mean (SD) | ||||
| 5.42 (0.92) | 5.39 (1.04) | 4.78 (1.30) | 0.19 | |
| Age (months) when breastfeeding stopped, mean (SD) | ||||
| 14.2 (9.38) | 12.2 (8.99) | 13.1 (9.84) | 0.76 | |
| Maternal age at child’s birth (years), mean (SD) | ||||
| 35.11 (4.60) | 34.41 (3.93) | 34.55 (4.70) | 0.77 | |
| Maternal education, n (%) | ||||
| Some college or less | 20 (47.62%) | 09 (52.94%) | 07 (63.64%) | 0.63 |
| Bachelor’s or higher | 22 (52.38%) | 08 (47.06%) | 04 (36.36%) | |
| Insurance delivery type c, n (%) | ||||
| Private | 34 (85.00%) | 14 (82.35%) | 08 (72.73%) | 0.61 |
| Public | 06 (15.00%) | 03 (17.65%) | 03 (27.27%) | |
| Parental homeownership c, n (%) | ||||
| Renter | 14 (35.00%) | 09 (56.25%) | 04 (36.36%) | 0.33 |
| Homeowner | 26 (65.00%) | 07 (43.75%) | 07 (63.64%) | |
| Class/Pathways | Metabolite 1 | Dx | β | (95% CI) | p |
|---|---|---|---|---|---|
| Amino acid metabolism | 1-Methylnicotinamide | ASD | −0.002 | (−0.1161, 0.1112) | 0.967 |
| Non-TD | 0.098 | (−0.0270, 0.2237) | 0.124 | ||
| 2-Oxobutyrate | ASD | −0.026 | (−0.1103, 0.0577) | 0.540 | |
| Non-TD | 0.075 | (−0.0458, 0.1953) | 0.225 | ||
| 3-Aminoisobutyrate | ASD | −0.219 | (−0.4293, −0.0085) | 0.041 | |
| Non-TD | −0.278 | (−0.4866, −0.0698) | 0.009 | ||
| 3-Hydroxyisovalerate | ASD | −0.047 | (−0.1462, 0.0521) | 0.352 | |
| Non-TD | −0.096 | (−0.2133, 0.0221) | 0.111 | ||
| 3-Methylhistidine | ASD | −0.029 | (−0.1085, 0.0506) | 0.476 | |
| Non-TD | −0.004 | (−0.0961, 0.0887) | 0.938 | ||
| 4-Aminobutyrate | ASD | 0.002 | (−0.0767, 0.0798) | 0.969 | |
| Non-TD | −0.031 | (−0.1270, 0.0645) | 0.523 | ||
| Asparagine | ASD | 0.016 | (−0.0916, 0.1233) | 0.773 | |
| Non-TD | 0.000 | (−0.1078, 0.1084) | 0.995 | ||
| Carnosine | ASD | −0.104 | (−0.2706, 0.0637) | 0.225 | |
| Non-TD | −0.011 | (−0.2039, 0.1824) | 0.913 | ||
| Creatine | ASD | −0.213 | (−0.5197, 0.0934) | 0.173 | |
| Non-TD | 0.164 | (−0.0916, 0.4185) | 0.209 | ||
| Creatinine | ASD | −0.006 | (−0.1383, 0.1258) | 0.926 | |
| Non-TD | −0.030 | (−0.1717, 0.1109) | 0.673 | ||
| Guanidoacetate | ASD | −0.109 | (−0.2103, −0.007) | 0.036 | |
| Non-TD | −0.015 | (−0.1049, 0.0753) | 0.747 | ||
| Histidine | ASD | −0.078 | (−0.2056, 0.0492) | 0.229 | |
| Non-TD | −0.008 | (−0.1497, 0.1330) | 0.908 | ||
| Lysine | ASD | −0.050 | (−0.1868, 0.0869) | 0.475 | |
| Non-TD | −0.085 | (−0.2245, 0.0553) | 0.236 | ||
| Proline | ASD | −0.027 | (−0.1184, 0.0651) | 0.569 | |
| Non-TD | 0.007 | (−0.0810, 0.0953) | 0.874 | ||
| Taurine | ASD | −0.011 | (−0.1662, 0.1436) | 0.886 | |
| Non-TD | 0.010 | (−0.1274, 0.1481) | 0.883 | ||
| Threonine | ASD | 0.022 | (−0.0729, 0.1175) | 0.647 | |
| Non-TD | 0.090 | (−0.0200, 0.1990) | 0.109 | ||
| Urocanate | ASD | 0.027 | (−0.0630, 0.1168) | 0.558 | |
| Non-TD | 0.069 | (−0.0402, 0.1772) | 0.217 | ||
| Branched chain amino acid metabolism, amino acid metabolism | 3-Hydroxy−3-methylglutarate | ASD | −0.006 | (−0.0550, 0.0430) | 0.809 |
| Non-TD | −0.002 | (−0.0519, 0.0489) | 0.954 | ||
| 3-Hydroxyisobutyrate | ASD | −0.007 | (−0.0905, 0.0767) | 0.871 | |
| Non-TD | 0.042 | (−0.0409, 0.1256) | 0.319 | ||
| Isoleucine | ASD | −0.012 | (−0.0909, 0.0665) | 0.761 | |
| Non-TD | 0.030 | (−0.0467, 0.1065) | 0.444 | ||
| Leucine | ASD | −0.009 | (−0.0968, 0.0791) | 0.843 | |
| Non-TD | −0.010 | (−0.1155, 0.0952) | 0.850 | ||
| Valine | ASD | 0.012 | (−0.0586, 0.0830) | 0.736 | |
| Non-TD | 0.001 | (−0.0806, 0.0835) | 0.973 | ||
| Glutathione metabolism | 2-Aminobutyrate | ASD | −0.055 | (−0.1982, 0.0887) | 0.455 |
| Non-TD | −0.030 | (−0.1866, 0.1257) | 0.702 | ||
| Glutathione metabolism, amino acid metabolism | 2-Hydroxybutyrate | ASD | −0.023 | (−0.1304, 0.0842) | 0.673 |
| Non-TD | 0.003 | (−0.0922, 0.0973) | 0.958 | ||
| Glycine, serine, and threonine metabolism, homocysteine metabolism, lipid metabolism | Choline | ASD | 0.010 | (−0.1479, 0.1671) | 0.905 |
| Non-TD | −0.025 | (−0.0991, 0.0500) | 0.518 | ||
| Glycine, serine, and threonine metabolism, one-carbon metabolism, amino acid metabolism | Serine | ASD | −0.083 | (−0.1549, −0.0117) | 0.023 |
| Non-TD | −0.058 | (−0.1282, 0.0132) | 0.111 | ||
| Glycine, serine, and threonine metabolism, homocysteine metabolism | Betaine | ASD | 0.067 | (−0.0519, 0.1863) | 0.269 |
| Non-TD | −0.052 | (−0.2141, 0.1100) | 0.529 | ||
| N,N-Dimethylglycine | ASD | −0.013 | (−0.1341, 0.1089) | 0.839 | |
| Non-TD | −0.006 | (−0.1964, 0.1845) | 0.951 | ||
| Glycine, serine, and threonine metabolism, homocysteine metabolism, glutathione metabolism, amino acid metabolism | Glycine | ASD | −0.013 | (−0.1448, 0.1195) | 0.851 |
| Non-TD | −0.020 | (−0.1132, 0.0727) | 0.669 | ||
| Glycolysis | Lactate | ASD | −0.002 | (−0.1137, 0.1094) | 0.970 |
| Non-TD | 0.022 | (−0.0999, 0.1446) | 0.720 | ||
| Pyruvate | ASD | −0.012 | (−0.1355, 0.1111) | 0.847 | |
| Non-TD | 0.047 | (−0.0546, 0.1489) | 0.364 | ||
| Glycolysis, amino acid metabolism | Alanine | ASD | −0.024 | (−0.1294, 0.0819) | 0.660 |
| Non-TD | −0.016 | (−0.1151, 0.0833) | 0.754 | ||
| Homocysteine metabolism, methionine cycle, amino acid metabolism | Methionine | ASD | −0.050 | (−0.1683, 0.0677) | 0.403 |
| Non-TD | −0.085 | (−0.1672, −0.0022) | 0.044 | ||
| Ketone bodies | 3-Hydroxybutyrate | ASD | −0.120 | (−0.2594, 0.0191) | 0.091 |
| Non-TD | −0.062 | (−0.1690, 0.0446) | 0.254 | ||
| Acetoacetate | ASD | 0.014 | (−0.1191, 0.1468) | 0.839 | |
| Non-TD | 0.034 | (−0.1020, 0.1703) | 0.623 | ||
| Acetone | ASD | 0.027 | (−0.1237, 0.1776) | 0.726 | |
| Non-TD | 0.034 | (−0.1707, 0.2388) | 0.745 | ||
| Lipid-related metabolism | Carnitine | ASD | 0.174 | (−0.0425, 0.3903) | 0.115 |
| Non-TD | 0.014 | (−0.2345, 0.2622) | 0.913 | ||
| O-Acetylcarnitine | ASD | 0.069 | (−0.1149, 0.2537) | 0.461 | |
| Non-TD | −0.026 | (−0.1911, 0.1398) | 0.761 | ||
| Neurotransmitter precursor amino acid, amino acid metabolism | Phenylalanine | ASD | −0.013 | (−0.1189, 0.0937) | 0.816 |
| Non-TD | −0.001 | (−0.0777, 0.0762) | 0.985 | ||
| Tyrosine | ASD | −0.064 | (−0.1563, 0.0274) | 0.169 | |
| Non-TD | 0.002 | (−0.0971, 0.1011) | 0.969 | ||
| Neurotransmitter precursor amino acid, glutathione metabolism, amino acid metabolism | Glutamate | ASD | 0.025 | (−0.0826, 0.1334) | 0.645 |
| Non-TD | −0.006 | (−0.0844, 0.0719) | 0.876 | ||
| Glutamine | ASD | −0.012 | (−0.0905, 0.0662) | 0.761 | |
| Non-TD | −0.013 | (−0.1067, 0.0811) | 0.790 | ||
| Other | 2-Hydroxyisobutyrate | ASD | 0.020 | (−0.0731, 0.1129) | 0.676 |
| Non-TD | −0.041 | (−0.1179, 0.0356) | 0.293 | ||
| 4-Hydroxyphenylacetate | ASD | 0.068 | (−0.0641, 0.1991) | 0.315 | |
| Non-TD | −0.090 | (−0.2625, 0.0836) | 0.311 | ||
| Adipate | ASD | 0.002 | (−0.1411, 0.1444) | 0.982 | |
| Non-TD | 0.076 | (−0.0379, 0.1905) | 0.190 | ||
| Ascorbate | ASD | −0.111 | (−0.4801, 0.2583) | 0.556 | |
| Non-TD | 0.026 | (−0.3430, 0.3942) | 0.892 | ||
| Dimethylamine | ASD | −0.036 | (−0.0646, −0.0072) | 0.014 | |
| Non-TD | −0.020 | (−0.0490, 0.0088) | 0.173 | ||
| Ethanolamine | ASD | −0.025 | (−0.1043, 0.0543) | 0.537 | |
| Non-TD | 0.074 | (0.0291, 0.1184) | 0.001 | ||
| Ethylmalonate | ASD | −0.001 | (−0.1267, 0.1245) | 0.987 | |
| Non-TD | −0.070 | (−0.2024, 0.0619) | 0.298 | ||
| Formate | ASD | 0.143 | (−0.0232, 0.3082) | 0.092 | |
| Non-TD | −0.132 | (−0.2644, 0.0004) | 0.051 | ||
| Glycolate | ASD | −0.024 | (−0.1259, 0.0785) | 0.649 | |
| Non-TD | −0.004 | (−0.1516, 0.1443) | 0.962 | ||
| Homovanillate | ASD | −0.004 | (−0.0560, 0.0476) | 0.873 | |
| Non-TD | −0.085 | (−0.1539, −0.0156) | 0.016 | ||
| Hypoxanthine | ASD | −0.009 | (−0.0954, 0.0765) | 0.830 | |
| Non-TD | 0.098 | (0.0076, 0.1883) | 0.034 | ||
| Methanol | ASD | 0.049 | (−0.0706, 0.1689) | 0.421 | |
| Non-TD | 0.011 | (−0.1641, 0.1854) | 0.905 | ||
| Methylguanidine | ASD | −0.001 | (−0.0690, 0.0666) | 0.972 | |
| Non-TD | −0.035 | (−0.0803, 0.0106) | 0.132 | ||
| Pantothenate | ASD | 0.049 | (−0.0715, 0.1700) | 0.424 | |
| Non-TD | 0.002 | (−0.0907, 0.0941) | 0.972 | ||
| Quinolinate | ASD | −0.044 | (−0.1296, 0.0423) | 0.320 | |
| Non-TD | 0.004 | (−0.1313, 0.1389) | 0.956 | ||
| Trigonelline | ASD | −0.054 | (−0.1897, 0.0813) | 0.433 | |
| Non-TD | 0.029 | (−0.1421, 0.2000) | 0.740 | ||
| Uracil | ASD | −0.049 | (−0.1545, 0.0564) | 0.362 | |
| Non-TD | 0.034 | (−0.0464, 0.1146) | 0.407 | ||
| Urea | ASD | −0.010 | (−0.0933, 0.0739) | 0.820 | |
| Non-TD | −0.011 | (−0.1232, 0.1009) | 0.846 | ||
| Xanthosine | ASD | −0.012 | (−0.1087, 0.0846) | 0.807 | |
| Non-TD | −0.025 | (−0.1152, 0.0644) | 0.579 | ||
| Other, bacterial metabolite | 1,2-Propanediol | ASD | 0.147 | (−0.2108, 0.5039) | 0.422 |
| Non-TD | −0.111 | (−0.4332, 0.2108) | 0.498 | ||
| Dimethyl sulfone | ASD | 0.027 | (−0.1084, 0.1631) | 0.693 | |
| Non-TD | 0.079 | (−0.0477, 0.2060) | 0.222 | ||
| Hippurate | ASD | −0.136 | (−0.2474, −0.0248) | 0.017 | |
| Non-TD | −0.110 | (−0.3162, 0.0954) | 0.293 | ||
| Trimethylamine | ASD | −0.007 | (−0.0764, 0.0628) | 0.848 | |
| Non-TD | −0.060 | (−0.1197, 0.0007) | 0.053 | ||
| Trimethylamine-N-oxide | ASD | 0.023 | (−0.2011, 0.2465) | 0.843 | |
| Non-TD | 0.112 | (−0.1495, 0.3740) | 0.401 | ||
| Short-chain fatty acids | Acetate | ASD | 0.089 | (−0.1046, 0.2815) | 0.369 |
| Non-TD | −0.014 | (−0.2219, 0.1949) | 0.899 | ||
| Butyrate | ASD | 0.033 | (−0.0865, 0.1519) | 0.591 | |
| Non-TD | −0.011 | (−0.1153, 0.0942) | 0.843 | ||
| Propionate | ASD | 0.017 | (−0.1438, 0.1779) | 0.835 | |
| Non-TD | −0.060 | (−0.2233, 0.1033) | 0.472 | ||
| Sugars and their derivatives | Fucose | ASD | −0.077 | (−0.2306, 0.0764) | 0.325 |
| Non-TD | −0.039 | (−0.1815, 0.1028) | 0.588 | ||
| Galactose | ASD | −0.054 | (−0.3535, 0.2454) | 0.724 | |
| Non-TD | −0.031 | (−0.3001, 0.2390) | 0.824 | ||
| Gluconate | ASD | 0.035 | (−0.0717, 0.1422) | 0.519 | |
| Non-TD | 0.068 | (−0.0340, 0.1697) | 0.192 | ||
| Glucose | ASD | −0.070 | (−0.1782, 0.0379) | 0.203 | |
| Non-TD | −0.030 | (−0.1106, 0.0513) | 0.473 | ||
| Lactose | ASD | 0.014 | (−0.1285, 0.1561) | 0.849 | |
| Non-TD | 0.041 | (−0.1356, 0.2169) | 0.652 | ||
| Mannitol | ASD | 0.021 | (−0.0686, 0.1113) | 0.641 | |
| Non-TD | 0.028 | (−0.0675, 0.1240) | 0.563 | ||
| myo Inositol | ASD | 0.093 | (−0.0580, 0.2432) | 0.228 | |
| Non-TD | 0.035 | (−0.1126, 0.1834) | 0.639 | ||
| Tricarboxylic acid cycle | 2-Oxoglutarate | ASD | −0.039 | (−0.2292, 0.1507) | 0.686 |
| Non-TD | 0.135 | (−0.0973, 0.3663) | 0.255 | ||
| cis Aconitate | ASD | 0.026 | (−0.0927, 0.1445) | 0.668 | |
| Non-TD | 0.043 | (−0.0386, 0.1250) | 0.301 | ||
| Citrate | ASD | 0.036 | (−0.0889, 0.1613) | 0.571 | |
| Non-TD | 0.054 | (−0.1154, 0.2234) | 0.532 | ||
| Fumarate | ASD | −0.061 | (−0.2150, 0.0926) | 0.435 | |
| Non-TD | 0.048 | (−0.1070, 0.2029) | 0.544 | ||
| Succinate | ASD | 0.010 | (−0.1787, 0.1992) | 0.915 | |
| Non-TD | −0.049 | (−0.2232, 0.1251) | 0.581 | ||
| Tryptophan metabolism, amino acid metabolism | 3-Indoxylsulfate | ASD | −0.091 | (−0.2464, 0.0645) | 0.252 |
| Non-TD | −0.024 | (−0.1817, 0.1338) | 0.766 | ||
| Tryptophan | ASD | −0.072 | (−0.145, 0.0019) | 0.056 | |
| Non-TD | −0.020 | (−0.1027, 0.0627) | 0.636 |
Disclaimer/Publisher’s Note: The statements, opinions and data contained in all publications are solely those of the individual author(s) and contributor(s) and not of MDPI and/or the editor(s). MDPI and/or the editor(s) disclaim responsibility for any injury to people or property resulting from any ideas, methods, instructions or products referred to in the content. |
© 2023 by the authors. Licensee MDPI, Basel, Switzerland. This article is an open access article distributed under the terms and conditions of the Creative Commons Attribution (CC BY) license (https://creativecommons.org/licenses/by/4.0/).
Share and Cite
Sotelo-Orozco, J.; Schmidt, R.J.; Slupsky, C.M.; Hertz-Picciotto, I. Investigating the Urinary Metabolome in the First Year of Life and Its Association with Later Diagnosis of Autism Spectrum Disorder or Non-Typical Neurodevelopment in the MARBLES Study. Int. J. Mol. Sci. 2023, 24, 9454. https://doi.org/10.3390/ijms24119454
Sotelo-Orozco J, Schmidt RJ, Slupsky CM, Hertz-Picciotto I. Investigating the Urinary Metabolome in the First Year of Life and Its Association with Later Diagnosis of Autism Spectrum Disorder or Non-Typical Neurodevelopment in the MARBLES Study. International Journal of Molecular Sciences. 2023; 24(11):9454. https://doi.org/10.3390/ijms24119454
Chicago/Turabian StyleSotelo-Orozco, Jennie, Rebecca J. Schmidt, Carolyn M. Slupsky, and Irva Hertz-Picciotto. 2023. "Investigating the Urinary Metabolome in the First Year of Life and Its Association with Later Diagnosis of Autism Spectrum Disorder or Non-Typical Neurodevelopment in the MARBLES Study" International Journal of Molecular Sciences 24, no. 11: 9454. https://doi.org/10.3390/ijms24119454
APA StyleSotelo-Orozco, J., Schmidt, R. J., Slupsky, C. M., & Hertz-Picciotto, I. (2023). Investigating the Urinary Metabolome in the First Year of Life and Its Association with Later Diagnosis of Autism Spectrum Disorder or Non-Typical Neurodevelopment in the MARBLES Study. International Journal of Molecular Sciences, 24(11), 9454. https://doi.org/10.3390/ijms24119454