
Induction of Oxidative Stress in SH-SY5Y Cells by Overexpression of hTau40 and Its Mitigation by Redox-Active Nanoparticles

 , , ,
, , ,  ,
,  ,
,  and
and 
Abstract
1. Introduction
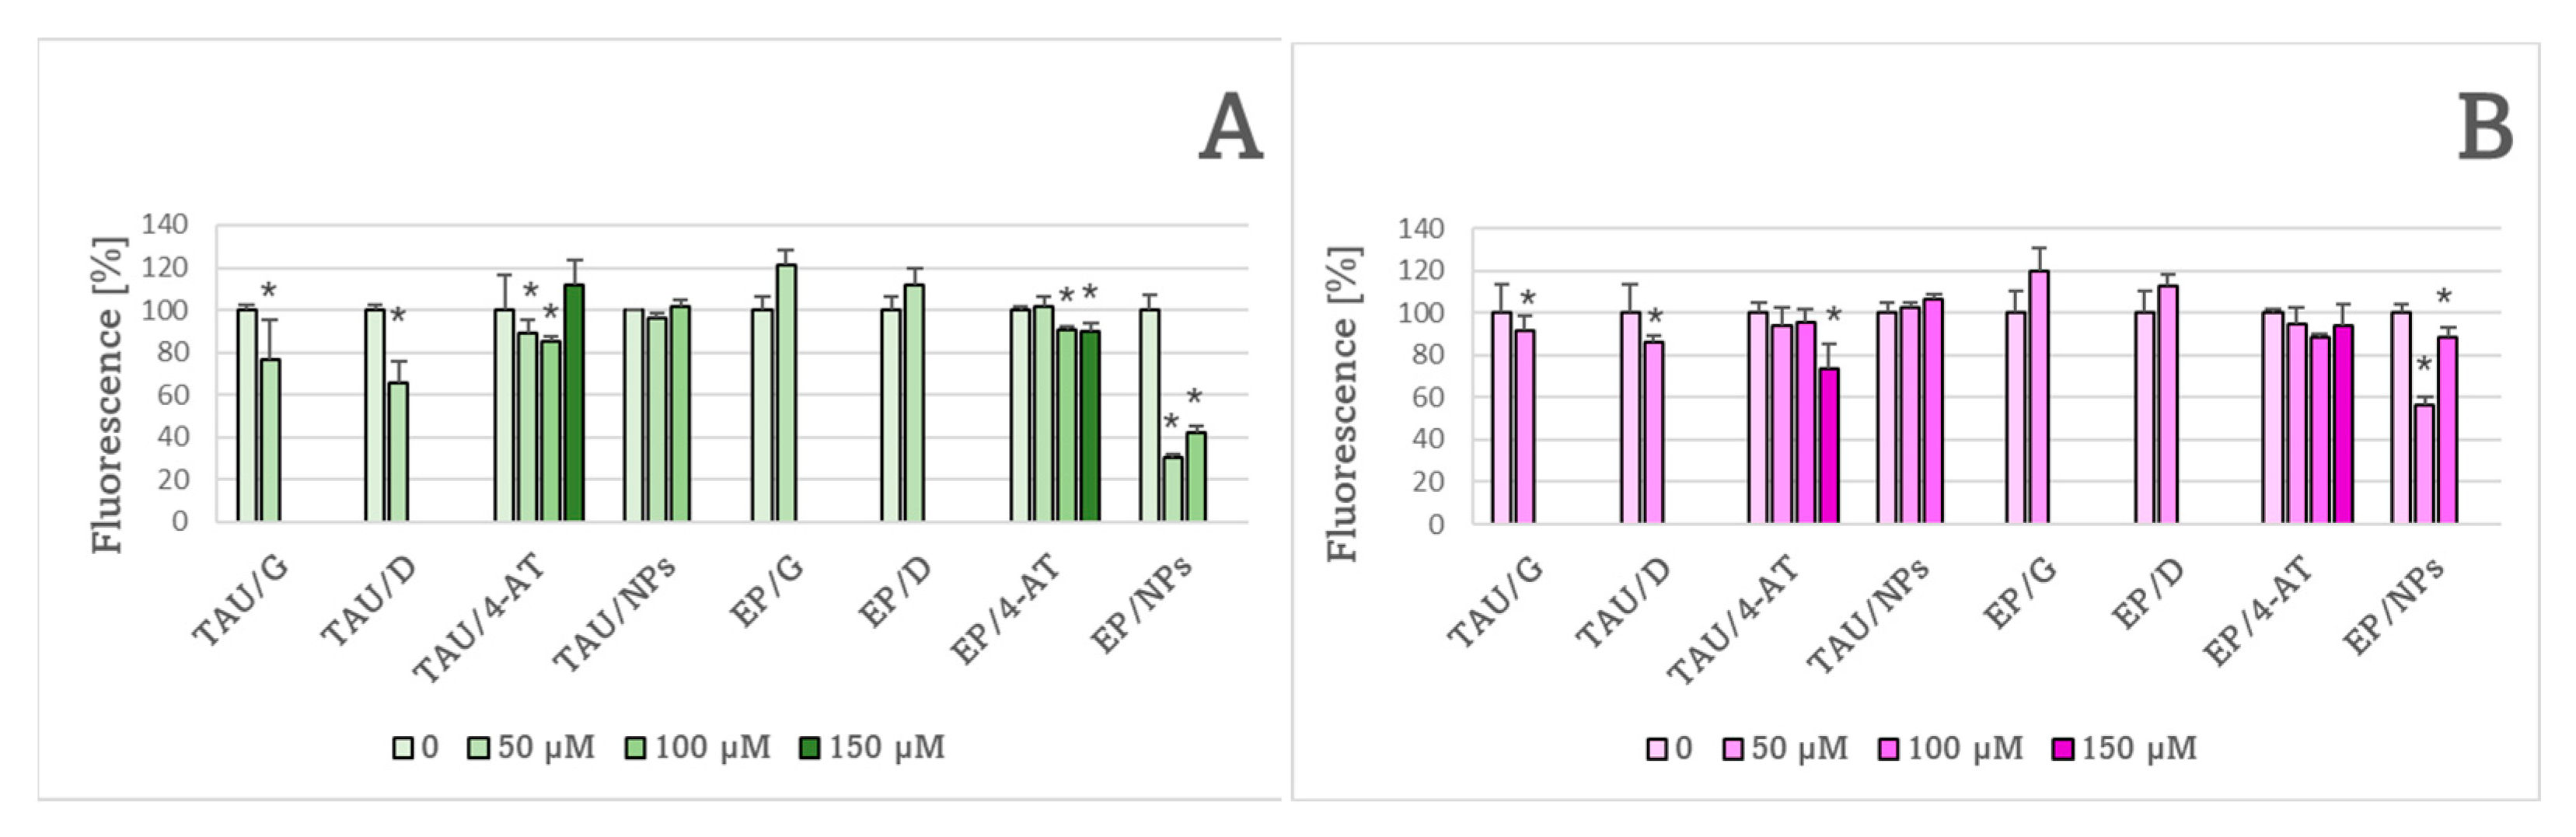
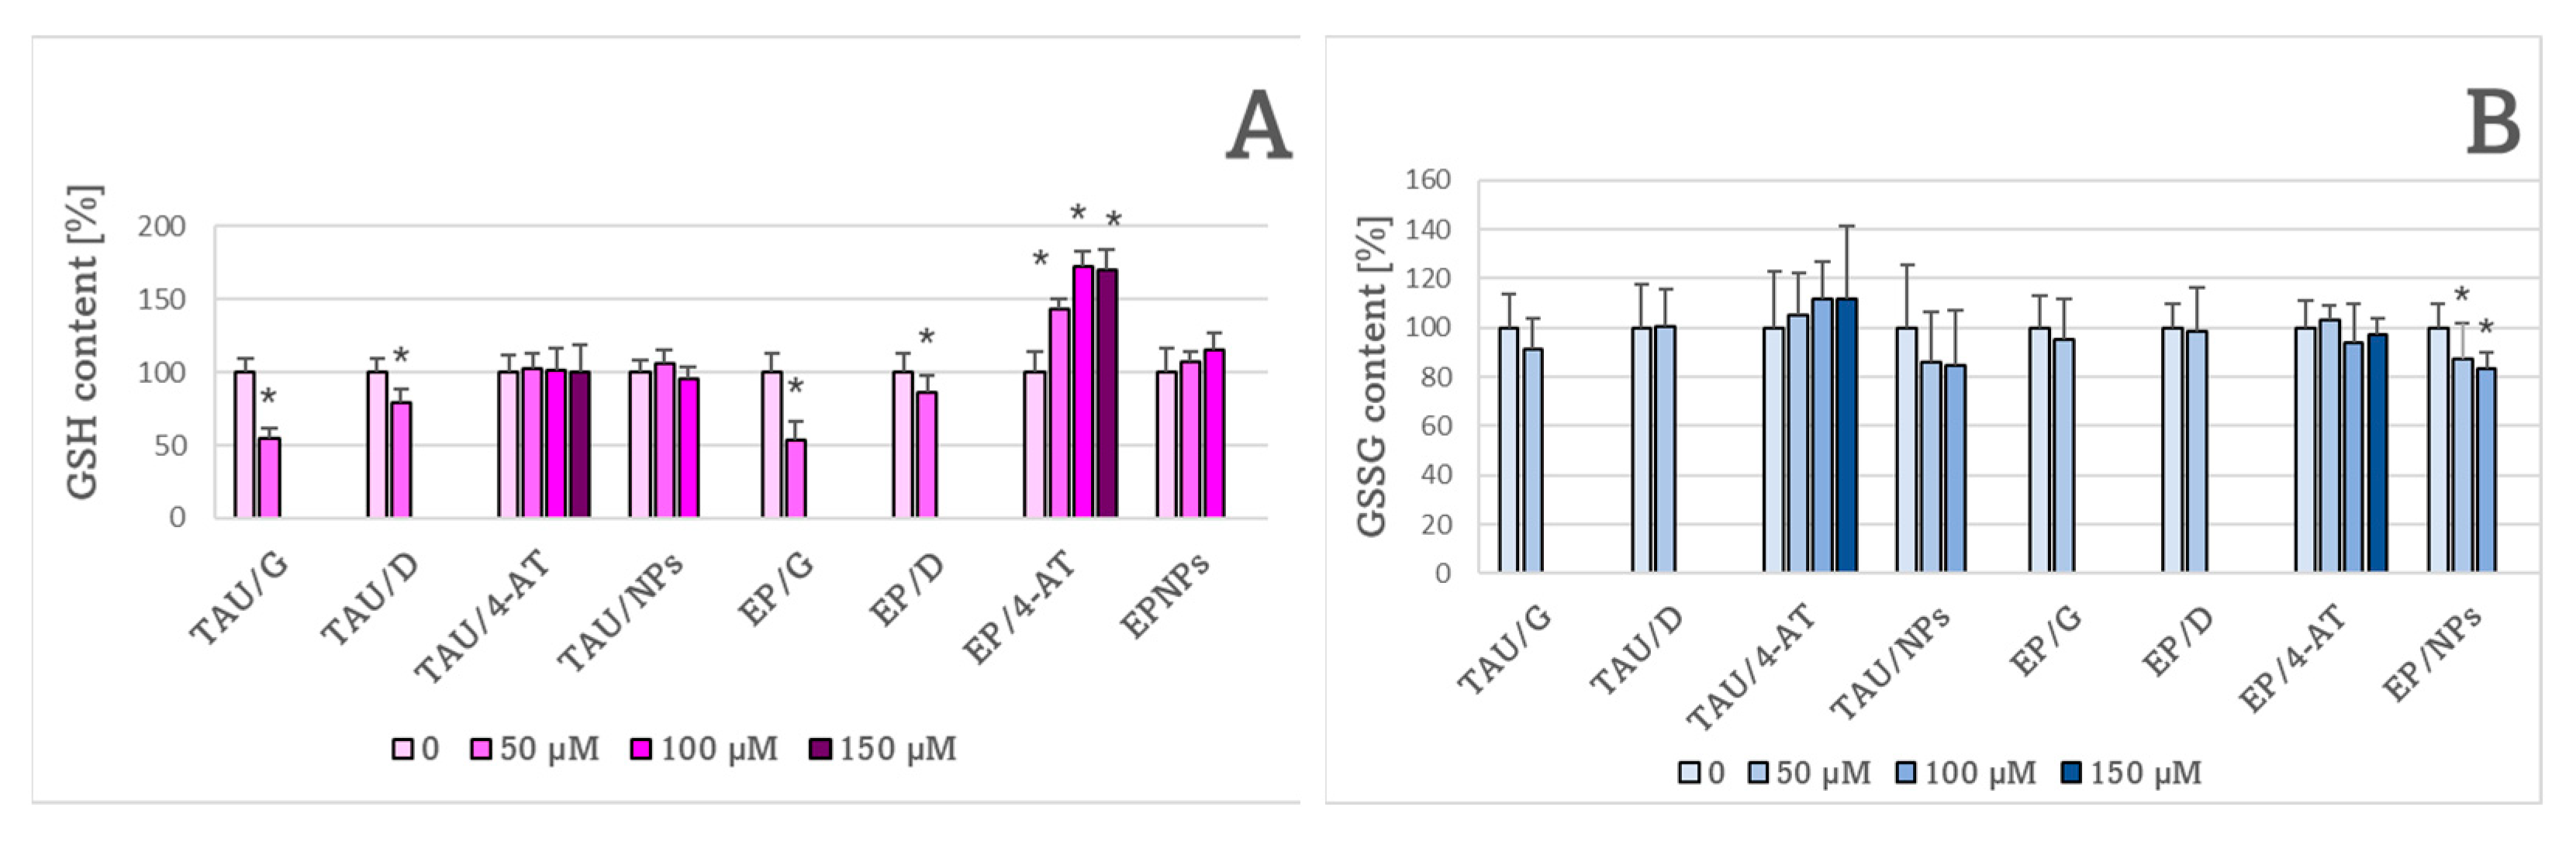
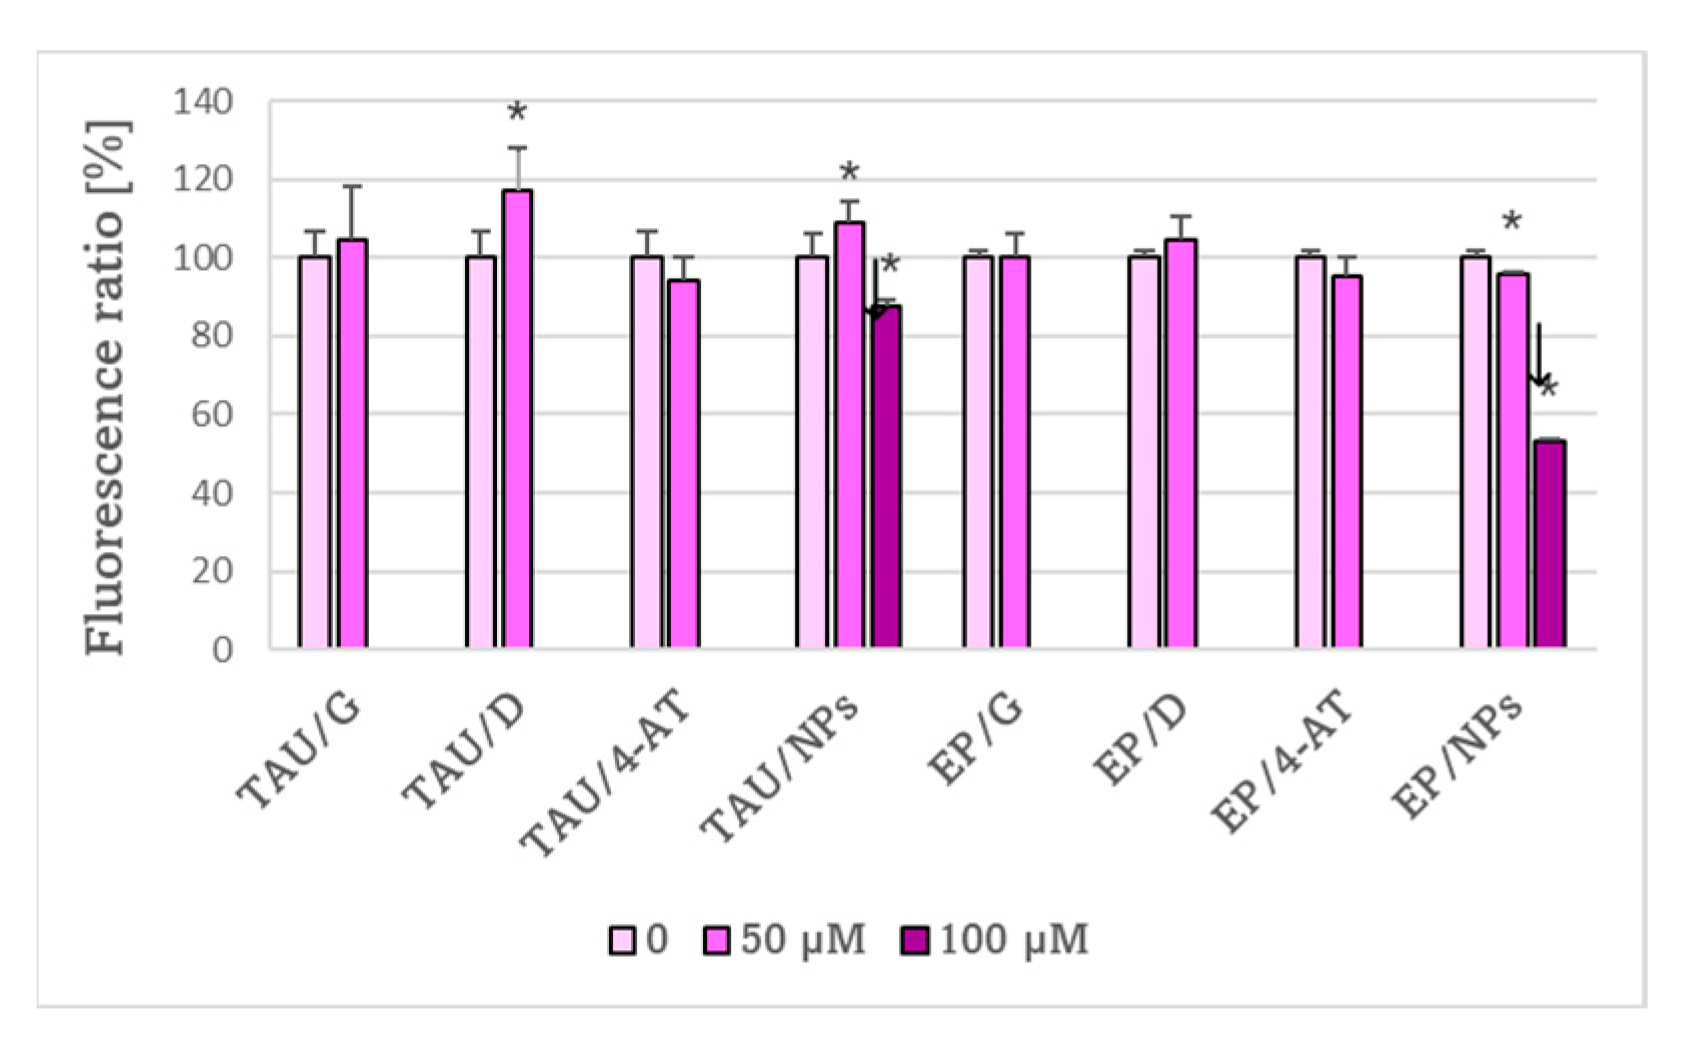
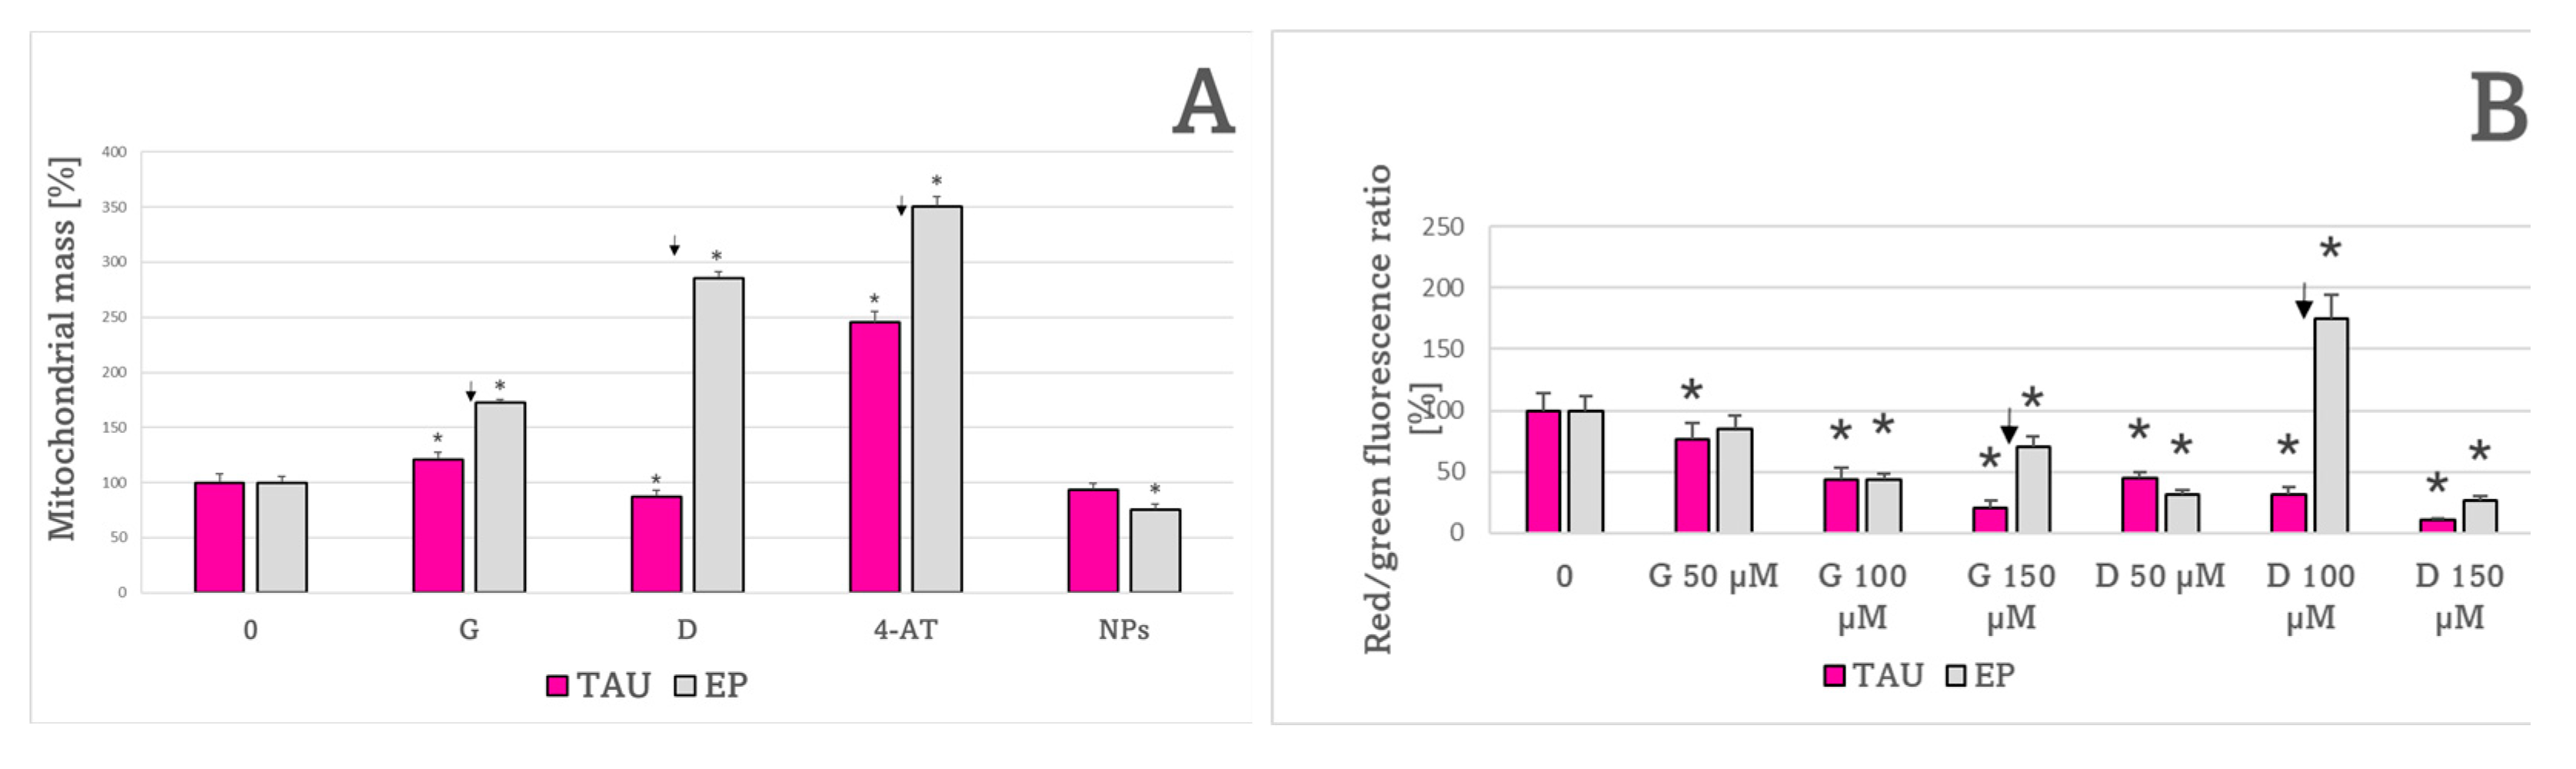
2. Results
3. Discussion
4. Materials and Methods
4.1. Materials and Equipment
4.2. Cell Culture Propagation
4.3. Protein Extraction
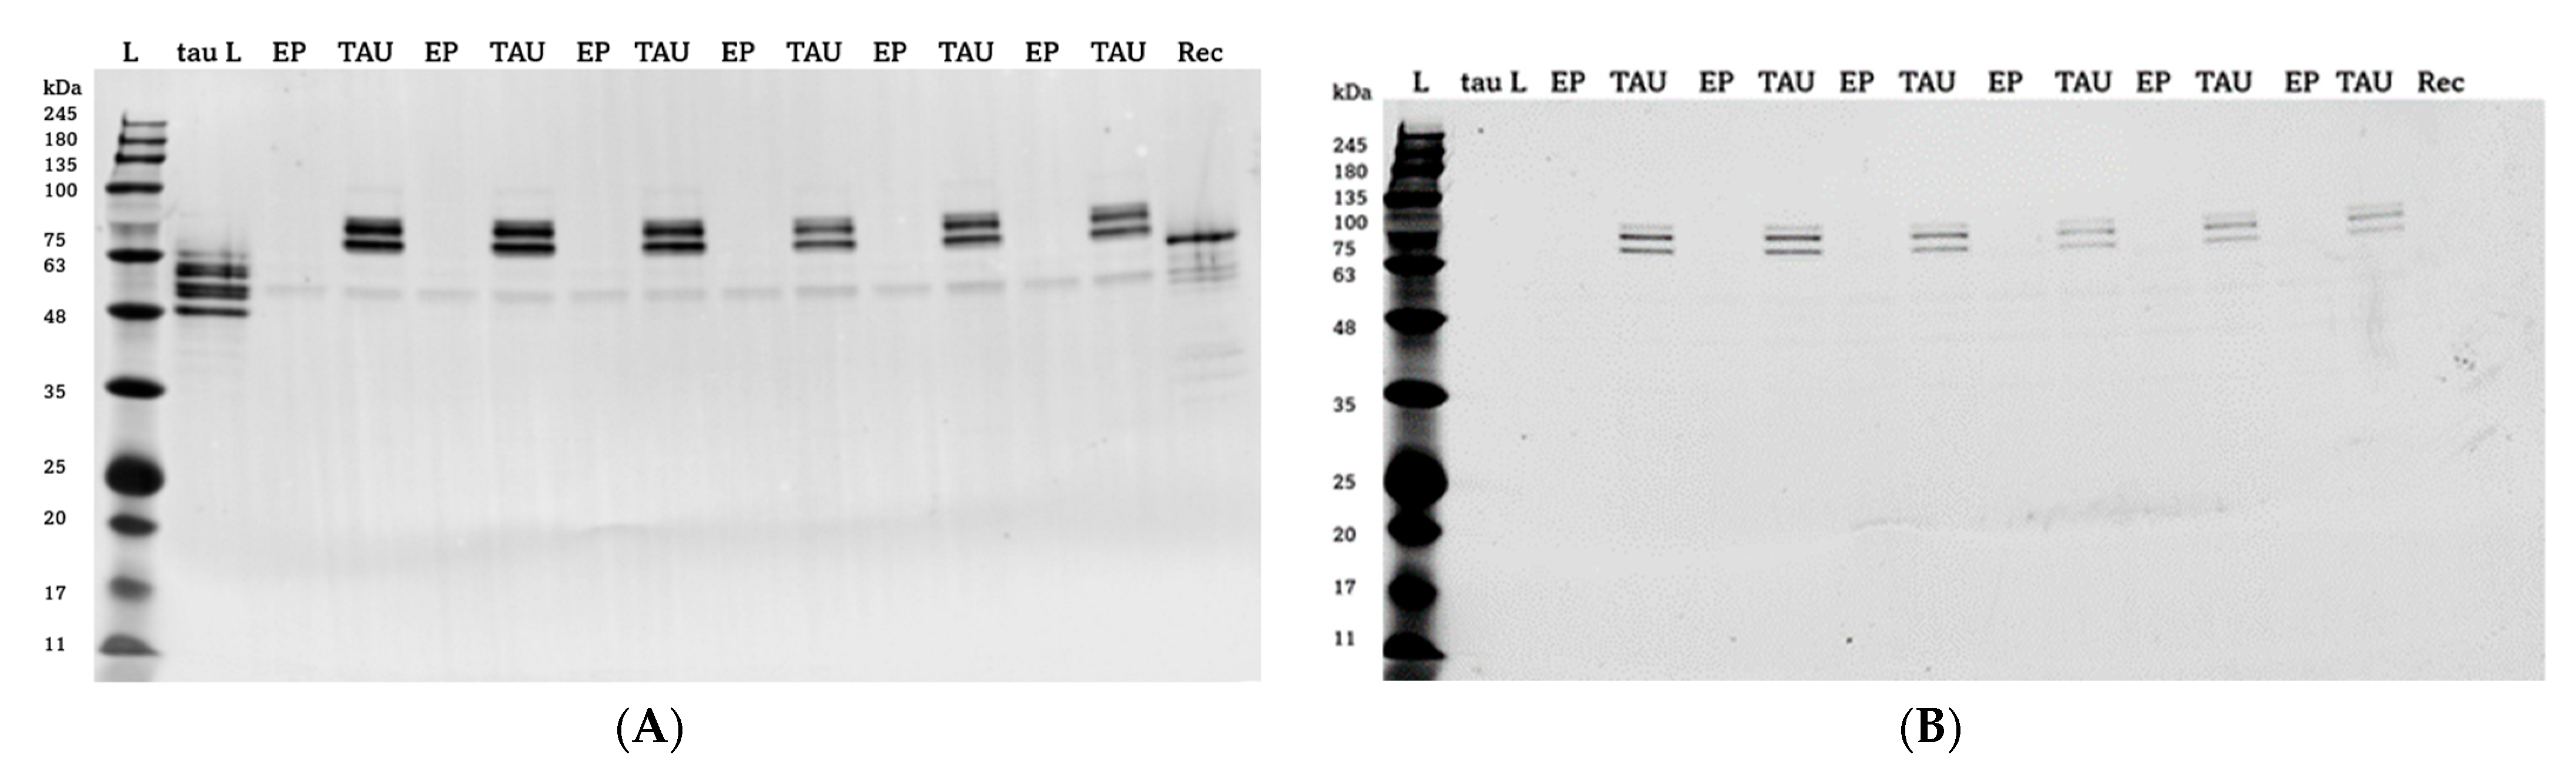
4.4. Western Blotting
4.5. Staining of Protein Aggregates
4.6. Hydrogen Peroxide and 6-Hydroxydopamine Cytotoxicity
4.7. Cytotoxicity of Antioxidants
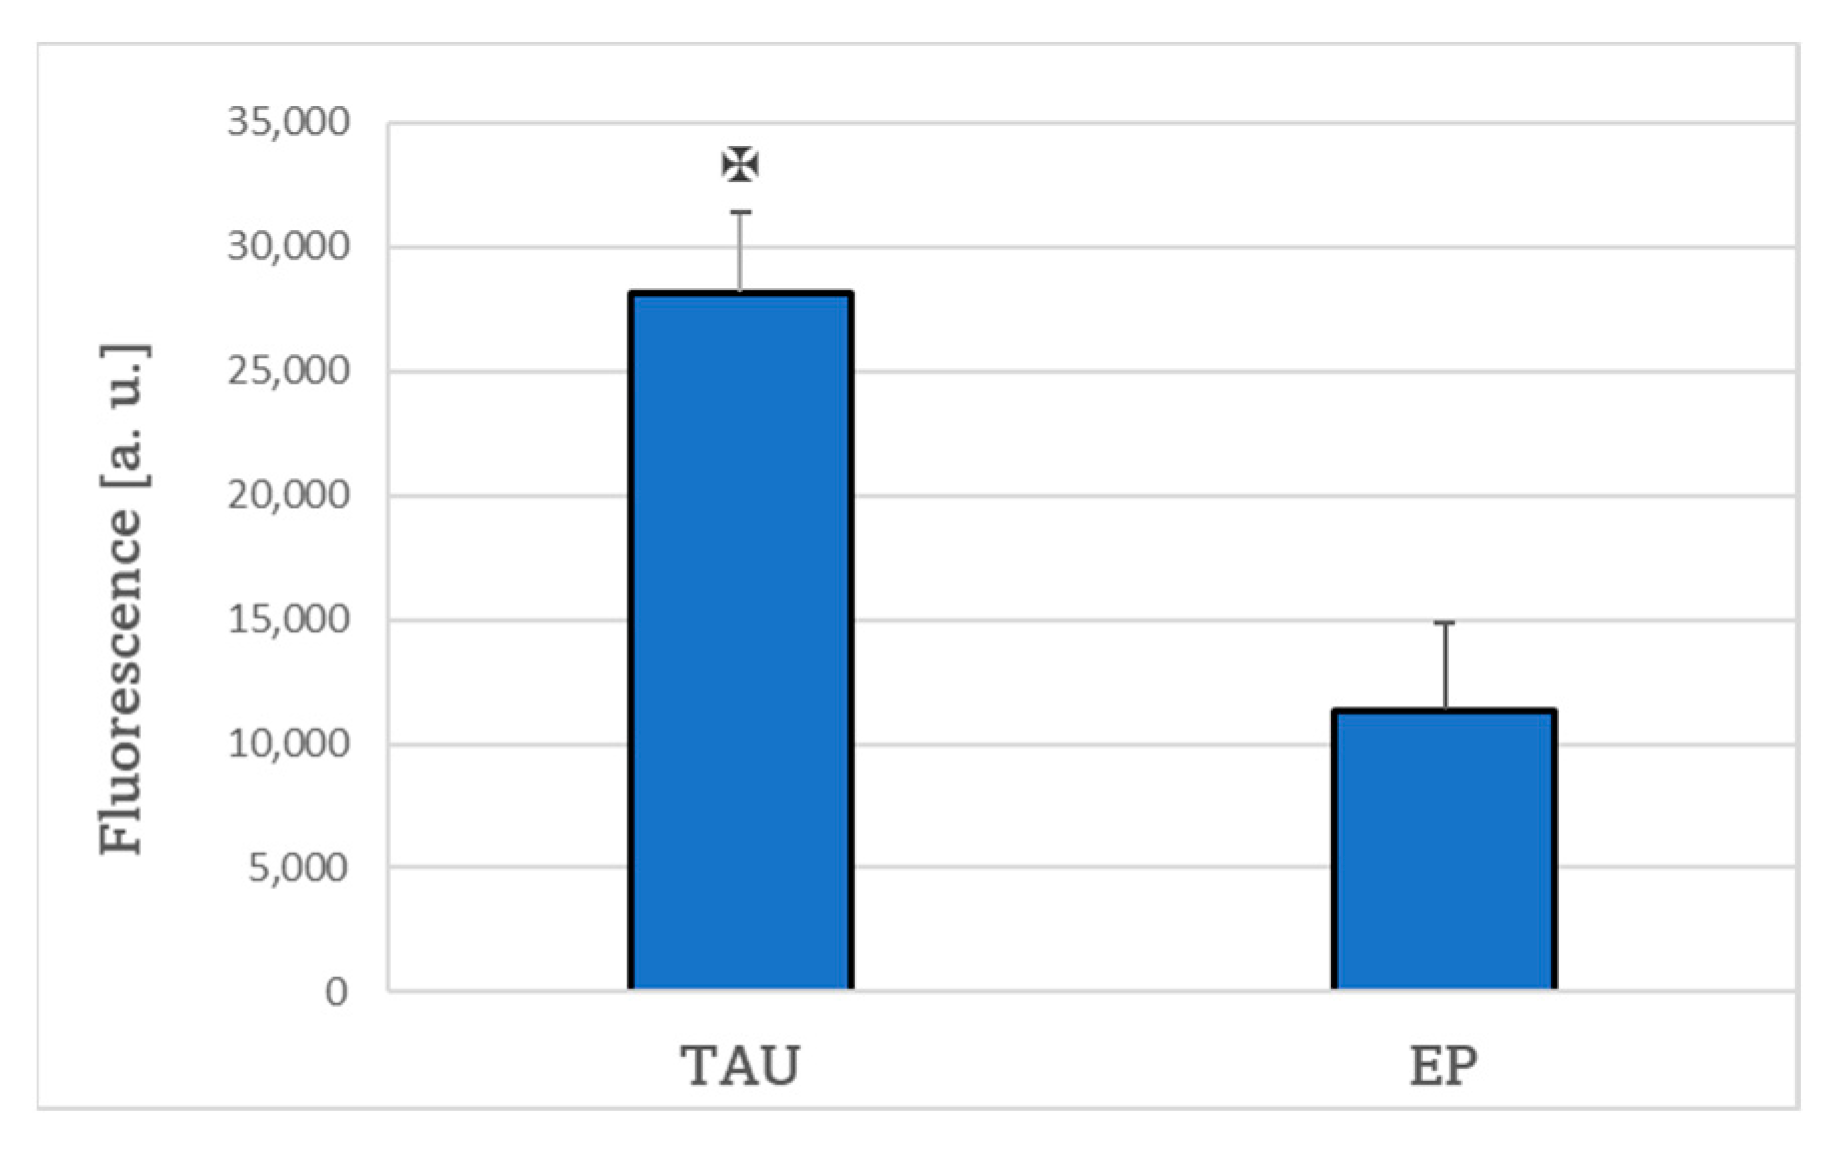
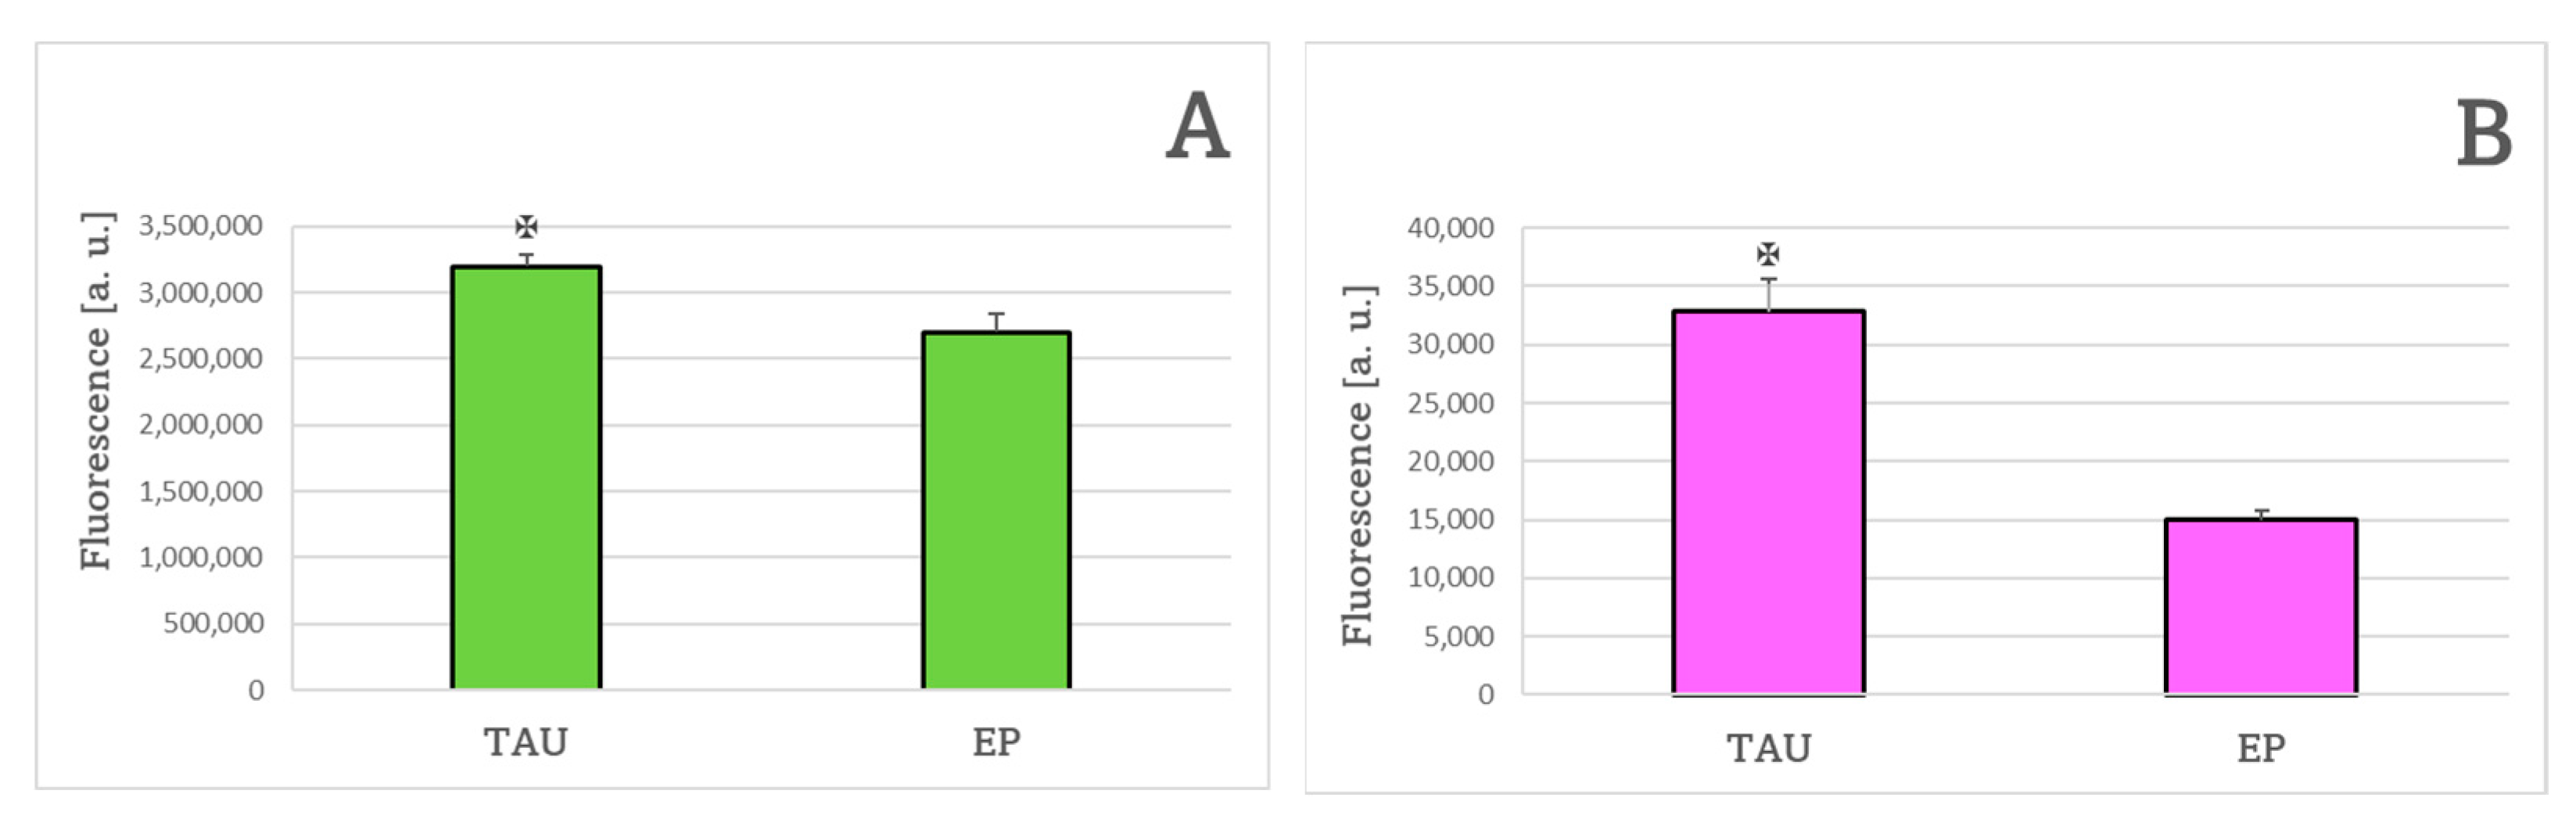
4.8. Level of Reactive Oxygen Species
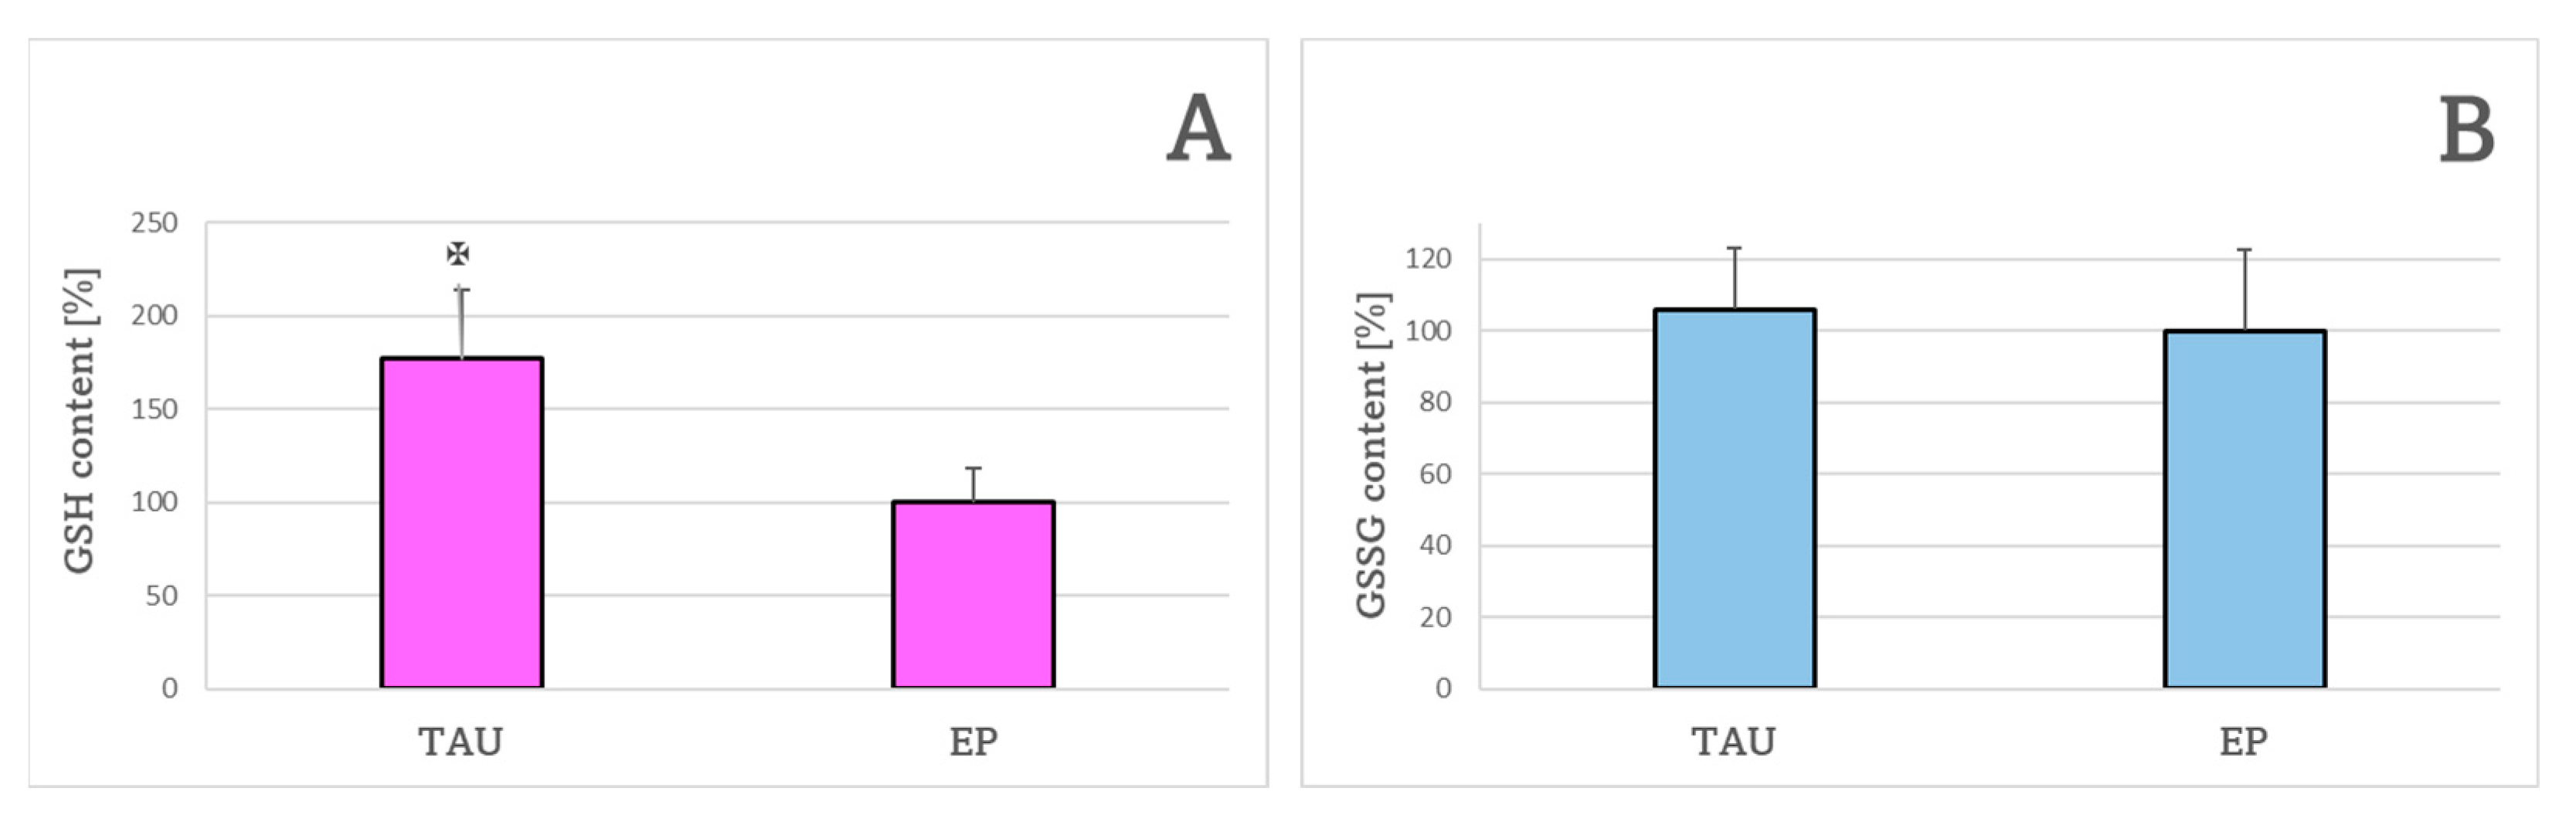
4.9. The Content of Reduced and Oxidized Glutathione
4.10. Estimation of Lipid Peroxidation with C11-BODIPY
4.11. Mitochondrial Mass Assessment
4.12. Evaluation of Changes of Mitochondrial Membrane Potential (ΔΨm)
4.13. Statistical Analysis
Author Contributions
Funding
Institutional Review Board Statement
Informed Consent Statement
Data Availability Statement
Acknowledgments
Conflicts of Interest
References
- Martínez, E.; Navarro, A.; Ordóñez, C.; del Valle, E.; Tolivia, J. Oxidative stress induces apolipoprotein D overexpression in hippocampus during aging and Alzheimer’s disease. J. Alzheimers Dis. 2013, 36, 129–144. [Google Scholar] [CrossRef] [PubMed]
- Luque-Contreras, D.; Carvajal, K.; Toral-Rios, D.; Franco-Bocanegra, D.; Campos-Peña, V. Oxidative stress and metabolic syndrome: Cause or consequence of Alzheimer’s disease? Oxid. Med. Cell. Longev. 2014, 2014, 11. [Google Scholar] [CrossRef] [PubMed]
- Pan, K.; Chen, S.; Wang, Y.; Yao, W.; Gao, X. MicroRNA-23b attenuates tau pathology and inhibits oxidative stress by targeting GnT-III in Alzheimer’s disease. Neuropharmacology 2021, 196, 108671. [Google Scholar] [CrossRef] [PubMed]
- Liu, Z.; Li, T.; Li, P.; Wei, N.; Zhao, Z.; Liang, H.; Ji, X.; Chen, W.; Xue, M.; Wei, J. The Ambiguous Relationship of Oxidative Stress, Tau Hyperphosphorylation, and Autophagy Dysfunction in Alzheimer’s Disease. Oxid. Med. Cell. Longev. 2015, 2015, 352723. [Google Scholar] [CrossRef]
- Hauw, J.J.; Verny, M.; Delaere, P.; Cervera, P.; He, Y.; Duyckaerts, C. Constant neurofibrillary changes in the neocortex in progressive supranuclear palsy. Basic differences with Alzheimer’s disease and aging. Neurosci. Lett. 1990, 119, 182–186. [Google Scholar] [CrossRef]
- Rademakers, R.; Cruts, M.; van Broeckhoven, C. The role of tau (MAPT) in frontotemporal dementia and related tauopathies. Hum. Mutat. 2004, 24, 277–295. [Google Scholar] [CrossRef]
- Arai, T.; Ikeda, K.; Akiyama, H.; Nonaka, T.; Hasegawa, M.; Ishiguro, K.; Iritani, S.; Tsuchiya, K.; Iseki, E.; Yagishita, S.; et al. Identification of amino-terminally cleaved tau fragments that distinguish progressive supranuclear palsy from corticobasal degeneration. Ann. Neurol. 2004, 55, 72–79. [Google Scholar] [CrossRef]
- Rosa, E.; Mahendram, S.; Ke, Y.D.; Ittner, L.M.; Ginsberg, S.D.; Fahnestock, M. Tau downregulates BDNF expression in animal and cellular models of Alzheimer’s disease. Neurobiol. Aging 2016, 48, 135–142. [Google Scholar] [CrossRef]
- Rodríguez-Martín, T.; Cuchillo-Ibáñez, I.; Noble, W.; Nyenya, F.; Anderton, B.H.; Hanger, D.P. Tau phosphorylation affects its axonal transport and degradation. Neurobiol. Aging 2013, 34, 2146–2157. [Google Scholar] [CrossRef]
- Kimura, T.; Sharma, G.; Ishiguro, K.; Hisanaga, S.I. Phospho-Tau Bar Code: Analysis of Phosphoisotypes of Tau and Its Application to Tauopathy. Front. Neurosci. 2018, 12, 44. [Google Scholar] [CrossRef]
- Sinsky, J.; Pichlerova, K.; Hanes, J. Tau Protein Interaction Partners and Their Roles in Alzheimer’s Disease and Other Tauopathies. Int. J. Mol. Sci. 2021, 22, 9207. [Google Scholar] [CrossRef] [PubMed]
- Junn, E.; Mouradian, M.M. Human alpha-synuclein over-expression increases intracellular reactive oxygen species levels and susceptibility to dopamine. Neurosci. Lett. 2002, 320, 146–150. [Google Scholar] [CrossRef] [PubMed]
- Paxinou, E.; Chen, Q.; Weisse, M.; Giasson, B.I.; Norris, E.H.; Rueter, S.M.; Trojanowski, J.Q.; Lee, V.M.; Ischiropoulos, H. Induction of alpha-synuclein aggregation by intracellular nitrative insult. J. Neurosci. 2001, 21, 8053–8061. [Google Scholar] [CrossRef] [PubMed]
- Stamer, K.; Vogel, R.; Thies, E.; Mandelkow, E.; Mandelkow, E.M. Tau blocks traffic of organelles, neurofilaments, and APP vesicles in neurons and enhances oxidative stress. J. Cell Biol. 2002, 156, 1051–1063. [Google Scholar] [CrossRef] [PubMed]
- Cente, M.; Filipcik, P.; Pevalova, M.; Novak, M. Expression of a truncated tau protein induces oxidative stress in a rodent model of tauopathy. Eur. J. Neurosci. 2006, 24, 1085–1090. [Google Scholar] [CrossRef] [PubMed]
- Alavi Naini, S.M.; Soussi-Yanicostas, N. Tau Hyperphosphorylation and Oxidative Stress, a Critical Vicious Circle in Neurodegenerative Tauopathies? Oxid. Med. Cell. Longev. 2015, 2015, 151979. [Google Scholar] [CrossRef]
- Calfio, C.; Gonzalez, A.; Singh, S.K.; Rojo, L.E.; Maccioni, R.B. The Emerging Role of Nutraceuticals and Phytochemicals in the Prevention and Treatment of Alzheimer’s Disease. J. Alzheimers Dis. 2020, 77, 33–51. [Google Scholar] [CrossRef]
- Kim, H.-S.; Sul, D.; Lim, J.-Y.; Lee, D.; Joo, S.S.; Hwang, K.W.; Park, S.-Y. Delphinidin Ameliorates Beta-Amyloid-Induced Neurotoxicity by Inhibiting Calcium Influx and Tau Hyperphosphorylation. Biosci. Biotechnol. Biochem. 2009, 73, 1685–1689. [Google Scholar] [CrossRef]
- Heysieattalab, S.; Sadeghi, L. Effects of Delphinidin on Pathophysiological Signs of Nucleus Basalis of Meynert Lesioned Rats as Animal Model of Alzheimer Disease. Neurochem. Res. 2020, 45, 1636–1646. [Google Scholar] [CrossRef]
- Singh, A.; Tripathi, P.; Yadawa, A.K.; Singh, S. Promising Polyphenols in Parkinson’s Disease Therapeutics. Neurochem. Res. 2020, 45, 1731–1745. [Google Scholar] [CrossRef]
- Duan, X.; Li, Y.; Xu, F.; Ding, H. Study on the neuroprotective effects of Genistein on Alzheimer’s disease. Brain Behav. 2021, 11, e02100. [Google Scholar] [CrossRef] [PubMed]
- Devi, K.P.; Shanmuganathan, B.; Manayi, A.; Nabavi, S.F.; Nabavi, S.M. Molecular and Therapeutic Targets of Genistein in Alzheimer’s Disease. Mol. Neurobiol. 2017, 54, 7028–7041. [Google Scholar] [CrossRef] [PubMed]
- Obulesu, M.; Jhansilakshmi, M. Neuroprotective Role of Nanoparticles Against Alzheimer’s Disease. Curr. Drug Metab. 2016, 17, 142–149. [Google Scholar] [CrossRef] [PubMed]
- Sadowska-Bartosz, I.; Bartosz, G. Redox nanoparticles: Synthesis, properties and perspectives of use for treatment of neurodegenerative diseases. J. Nanobiotechnol. 2018, 16, 87. [Google Scholar] [CrossRef]
- Boonruamkaew, P.; Chonpathompikunlert, P.; Vong, L.B.; Sakaue, S.; Tomidokoro, Y.; Ishii, K.; Tamaoka, A.; Nagasaki, Y. Chronic treatment with a smart antioxidative nanoparticle for inhibition of amyloid plaque propagation in Tg2576 mouse model of Alzheimer’s disease. Sci. Rep. 2017, 7, 3785. [Google Scholar] [CrossRef] [PubMed]
- Pichla, M.; Pulaski, Ł.; Kania, K.D.; Stefaniuk, I.; Cieniek, B.; Pieńkowska, N.; Bartosz, G.; Sadowska-Bartosz, I. Nitroxide Radical-Containing Redox Nanoparticles Protect Neuroblastoma SH-SY5Y Cells against 6-Hydroxydopamine Toxicity. Oxid. Med. Cell. Longev. 2020, 2020, 9260748. [Google Scholar] [CrossRef]
- Pichla, M.; Bartosz, G.; Stefaniuk, I.; Sadowska-Bartosz, I. pH-Responsive Redox Nanoparticles Protect SH-SY5Y Cells at Lowered pH in a Cellular Model of Parkinson’s Disease. Molecules 2021, 26, 543. [Google Scholar] [CrossRef]
- Cheung, Y.T.; Lau, W.K.; Yu, M.S.; Lai, C.S.; Yeung, S.C.; So, K.F.; Chang, R.C. Effects of all-trans-retinoic acid on human SH-SY5Y neuroblastoma as in vitro model in neurotoxicity research. Neurotoxicology 2009, 30, 127–135. [Google Scholar] [CrossRef]
- Schüle, B.; Pera, R.A.; Langston, J.W. Can cellular models revolutionize drug discovery in Parkinson’s disease? Biochim. Biophys. Acta 2009, 1792, 1043–1051. [Google Scholar] [CrossRef]
- Tirmenstein, M.A.; Hu, C.X.; Scicchitano, M.S.; Narayanan, P.K.; McFarland, D.C.; Thomas, H.C.; Schwartz, L.W. Effects of 6-hydroxydopamine on mitochondrial function and glutathione status in SH-SY5Y human neuroblastoma cells. Toxicol. In Vitr. 2005, 19, 471–479. [Google Scholar] [CrossRef]
- Elyasi, L.; Jahanshahi, M.; Jameie, S.B.; Hamid Abadi, H.G.; Nikmahzar, E.; Khalili, M.; Jameie, M.; Jameie, M. 6-OHDA mediated neurotoxicity in SH-SY5Y cellular model of Parkinson disease suppressed by pretreatment with hesperidin through activating L-type calcium channels. J. Basic Clin. Physiol. Pharmacol. 2020, 32, 11–17. [Google Scholar] [CrossRef] [PubMed]
- Tsai, R.T.; Tsai, C.W.; Liu, S.P.; Gao, J.X.; Kuo, Y.H.; Chao, P.M.; Hung, H.S.; Shyu, W.C.; Lin, S.Z.; Fu, R.H. Maackiain Ameliorates 6-Hydroxydopamine and SNCA Pathologies by Modulating the PINK1/Parkin Pathway in Models of Parkin-son’s Disease in Caenorhabditis elegans and the SH-SY5Y Cell Line. Int. J. Mol. Sci. 2020, 21, 4455. [Google Scholar] [CrossRef]
- Xicoy, H.; Brouwers, J.F.; Kalnytska, O.; Wieringa, B.; Martens, G.J.M. Lipid Analysis of the 6-Hydroxydopamine-Treated SH-SY5Y Cell Model for Parkinson’s Disease. Mol. Neurobiol. 2020, 57, 848–859. [Google Scholar] [CrossRef] [PubMed]
- Castello, P.R.; Drechsel, D.A.; Patel, M. Mitochondria are a major source of paraquat-induced reactive oxygen species production in the brain. J. Biol. Chem. 2007, 282, 14186–14193. [Google Scholar] [CrossRef]
- Singh, A.; Kukreti, R.; Saso, L.; Kukreti, S. Oxidative Stress: A Key Modulator in Neurodegenerative Diseases. Molecules 2019, 24, 1583. [Google Scholar] [CrossRef]
- Lee, H.C.; Yin, P.H.; Chi, C.W.; Wei, Y.H. Increase in mitochondrial mass in human fibroblasts under oxidative stress and during replicative cell senescence. J Biomed. Sci. 2002, 9, 517–526. [Google Scholar] [CrossRef] [PubMed]
- Wei, Y.H.; Lee, C.F.; Lee, H.C.; Ma, Y.S.; Wang, C.W.; Lu, C.Y.; Pang, C.Y. Increases of mitochondrial mass and mitochondrial genome in association with enhanced oxidative stress in human cells harboring 4977 BP-deleted mitochondrial DNA. Ann. N. Y. Acad. Sci. 2001, 928, 97–112. [Google Scholar] [CrossRef]
- Winklhofer, K.F.; Tatzelt, J.; Haass, C. The two faces of protein misfolding: Gain- and loss-of-function in neurodegenerative diseases. EMBO J. 2008, 27, 336–349. [Google Scholar] [CrossRef]
- Kohanski, M.A.; Dwyer, D.J.; Hayete, B.; Lawrence, C.A.; Collins, J.J. A common mechanism of cellular death induced by bactericidal antibiotics. Cell 2007, 130, 797–810. [Google Scholar] [CrossRef]
- Islam, M.T. Oxidative stress and mitochondrial dysfunction-linked neurodegenerative disorders. Neurol. Res. 2017, 39, 73–82. [Google Scholar] [CrossRef]
- Li, J.O.W.; Li, W.; Jiang, Z.G.; Ghanbari, H.A. Oxidative stress and neurodegenerative disorders. Int. J. Mol. Sci. 2013, 14, 24438–24475. [Google Scholar] [CrossRef] [PubMed]
- Salim, S. Oxidative Stress and the Central Nervous System. J. Pharmacol. Exp. Ther. 2017, 360, 201–205. [Google Scholar] [CrossRef] [PubMed]
- Kropf, E.; Fahnestock, M. Effects of Reactive Oxygen and Nitrogen Species on TrkA Expression and Signalling: Implications for proNGF in Aging and Alzheimer’s Disease. Cells 2021, 10, 1983. [Google Scholar] [CrossRef] [PubMed]
- Dias, V.; Junn, E.; Mouradian, M.M. The role of oxidative stress in Parkinson’s disease. J. Parkinsons Dis. 2013, 3, 461–491. [Google Scholar] [CrossRef]
- Shelat, P.B.; Chalimoniuk, M.; Wang, J.H.; Strosznajder, J.B.; Lee, J.C.; Sun, A.Y.; Simonyi, A.; Sun, G.Y. Amyloid beta peptide and NMDA induce ROS from NADPH oxidase and AA release from cytosolic phospholipase A2 in cortical neurons. J. Neurochem. 2008, 106, 45–55. [Google Scholar] [CrossRef]
- Kamat, P.K.; Kalani, A.; Rai, S.; Swarnkar, S.; Tota, S.; Nath, C.; Tyagi, N. Mechanism of Oxidative Stress and Synapse Dysfunction in the Pathogenesis of Alzheimer’s Disease: Understanding the Therapeutics Strategies. Mol. Neurobiol. 2016, 53, 648–661. [Google Scholar] [CrossRef]
- Patten, D.A.; Germain, M.; Kelly, M.A.; Slack, R.S. Reactive oxygen species: Stuck in the middle of neurodegeneration. J. Alzheimers Dis. 2010, 20, S357–S367. [Google Scholar] [CrossRef]
- Dias-Santagata, D.; Fulga, T.A.; Duttaroy, A.; Feany, M.B. Oxidative stress mediates tau-induced neurodegeneration in Drosophila. J. Clin. Investig. 2007, 117, 236–245. [Google Scholar] [CrossRef]
- Khurana, V. Modeling tauopathy in the fruit fly Drosophila melanogaster. J. Alzheimers Dis. 2008, 15, 541–553. [Google Scholar] [CrossRef]
- Su, X.Y.; Wu, W.H.; Huang, Z.P.; Hu, J.; Lei, P.; Yu, C.H.; Zhao, Y.F.; Li, Y.M. Hydrogen peroxide can be generated by tau in the presence of Cu(II). Biochem. Biophys. Res. Commun. 2007, 358, 661–665. [Google Scholar] [CrossRef]
- Krishnamurthy, P.K.; Mays, J.L.; Bijur, G.N.; Johnson, G.V. Transient oxidative stress in SH-SY5Y human neuroblastoma cells results in caspase dependent and independent cell death and tau proteolysis. J. Neurosci. Res. 2000, 61, 515–523. [Google Scholar] [CrossRef] [PubMed]
- Su, B.; Wang, X.; Lee, H.G.; Tabaton, M.; Perry, G.; Smith, M.A.; Zhu, X. Chronic oxidative stress causes increased tau phosphorylation in M17 neuroblastoma cells. Neurosci. Lett. 2010, 468, 267–271. [Google Scholar] [CrossRef] [PubMed]
- Chang, K.H.; Cheng, M.L.; Chiang, M.C.; Chen, C.M. Lipophilic antioxidants in neurodegenerative diseases. Clin. Chim. Acta 2018, 485, 79–87. [Google Scholar] [CrossRef] [PubMed]
- Tardiolo, G.; Bramanti, P.; Mazzon, E. Overview on the Effects of N-Acetylcysteine in Neurodegenerative Diseases. Molecules 2018, 23, 3305. [Google Scholar] [CrossRef] [PubMed]
- Bakir, S.; Catalkaya, G.; Ceylan, F.D.; Khan, H.; Guldiken, B.; Capanoglu, E.; Kamal, M.A. Role of Dietary Antioxidants in Neurodegenerative Diseases: Where are We Standing? Curr. Pharm. Des. 2020, 26, 714–729. [Google Scholar] [CrossRef] [PubMed]
- Bartosz, G. Use of spectroscopic probes for detection of reactive oxygen species. Clin. Chim. Acta 2006, 368, 53–76. [Google Scholar] [CrossRef] [PubMed]
- Soule, B.P.; Hyodo, F.; Matsumoto, K.; Simone, N.L.; Cook, J.A.; Krishna, M.C.; Mitchell, J.B. The chemistry and biology of nitroxide compounds. Free Radic. Biol. Med. 2007, 42, 1632–1650. [Google Scholar] [CrossRef]
- Krishna, M.C.; Russo, A.; Mitchell, J.B.; Goldstein, S.; Dafni, H.; Samuni, A. Do nitroxide antioxidants act as scavengers of O2−. or as SOD mimics? J. Biol. Chem. 1996, 271, 26026–26031. [Google Scholar] [CrossRef]
- Sadowska-Bartosz, I.; Gajewska, A.; Skolimowski, J.; Szewczyk, R.; Bartosz, G. Nitroxides protect against peroxynitrite-induced nitration and oxidation. Free Radic. Biol. Med. 2015, 89, 1165–1175. [Google Scholar] [CrossRef]
- Sadowska-Bartosz, I.; Galiniak, S.; Skolimowski, J.; Stefaniuk, I.; Bartosz, G. Nitroxides prevent protein glycoxidation in vitro. Free Radic. Res. 2015, 49, 113–121. [Google Scholar] [CrossRef]
- Lewandowski, M.; Gwozdzinski, K. Nitroxides as Antioxidants and Anticancer Drugs. Int. J. Mol. Sci. 2017, 18, 2490. [Google Scholar] [CrossRef] [PubMed]
- Yoshitomi, T.; Nagasaki, Y. Nitroxyl radical-containing nanoparticles for novel nanomedicine against oxidative stress injury. Nanomedicine 2011, 6, 509–518. [Google Scholar] [CrossRef] [PubMed]
- Nagasaki, Y. Nitroxide radicals and nanoparticles: A partnership for nanomedicine radical delivery. Ther. Deliv. 2012, 3, 165–179. [Google Scholar] [CrossRef] [PubMed]
- Rosa, E.; Fahnestock, M. CREB expression mediates amyloid β-induced basal BDNF downregulation. Neurobiol. Aging 2015, 36, 2406–2413. [Google Scholar] [CrossRef]
- Chmielarz, P. Synthesis of α-d-glucose-based star polymers through simplified electrochemically mediated ATRP. Polymer 2016, 102, 192–198. [Google Scholar] [CrossRef]
- Senft, A.P.; Dalton, T.P.; Shertzer, H.G. Determining glutathione and glutathione disulfide using the fluorescence probe o-phthalaldehyde. Anal. Biochem. 2000, 280, 80–86. [Google Scholar] [CrossRef]
- Lowry, O.H.; Rosebrough, N.J.; Farr, A.L.; Randall, R.J. Protein measurement with the Folin phenol reagent. J. Biol. Chem. 1951, 193, 265–275. [Google Scholar] [CrossRef]


| Compound | Cell Line | |
|---|---|---|
| TAU | EP | |
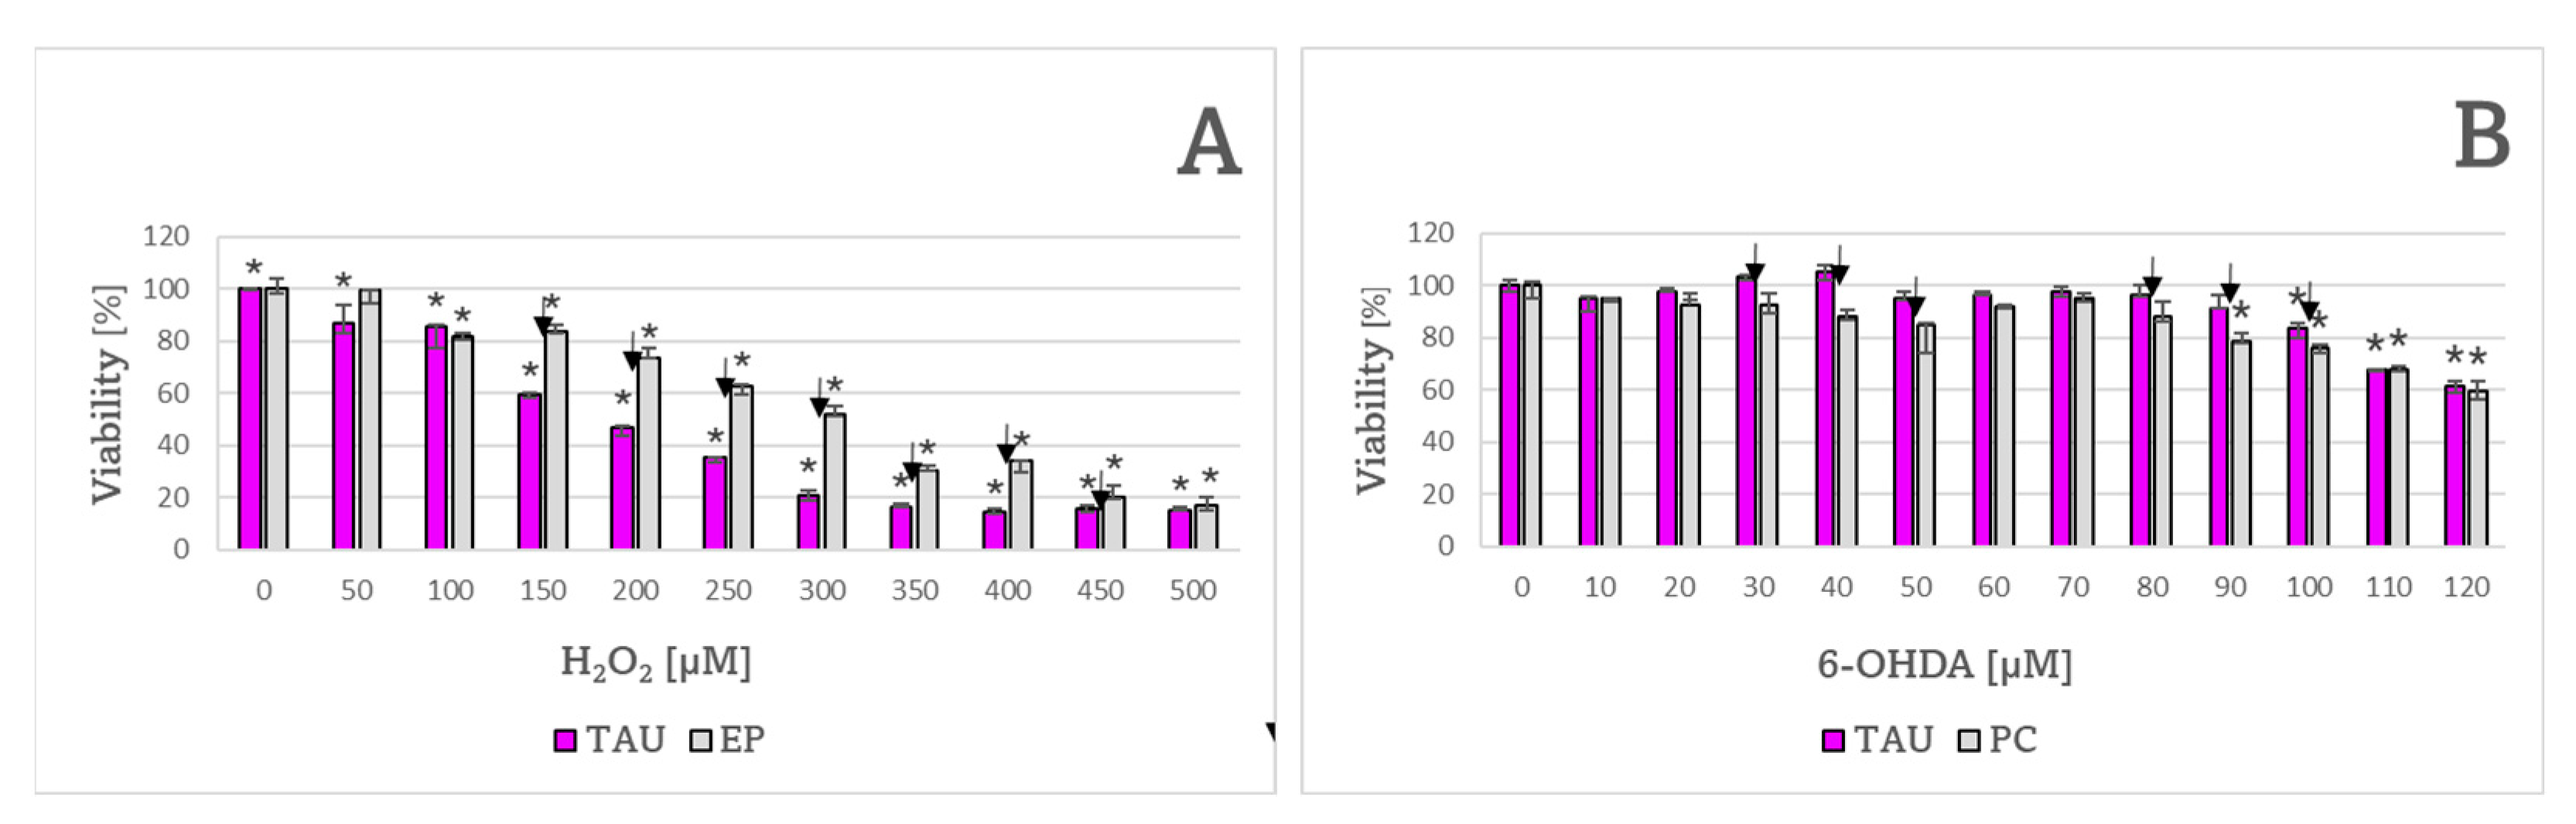
| H2O2 | 190 ± 7 μM ✠ | 312 ± 17 μM |
| 6-OHDA | 128 ± 4 μM | 133 ± 9 μM |
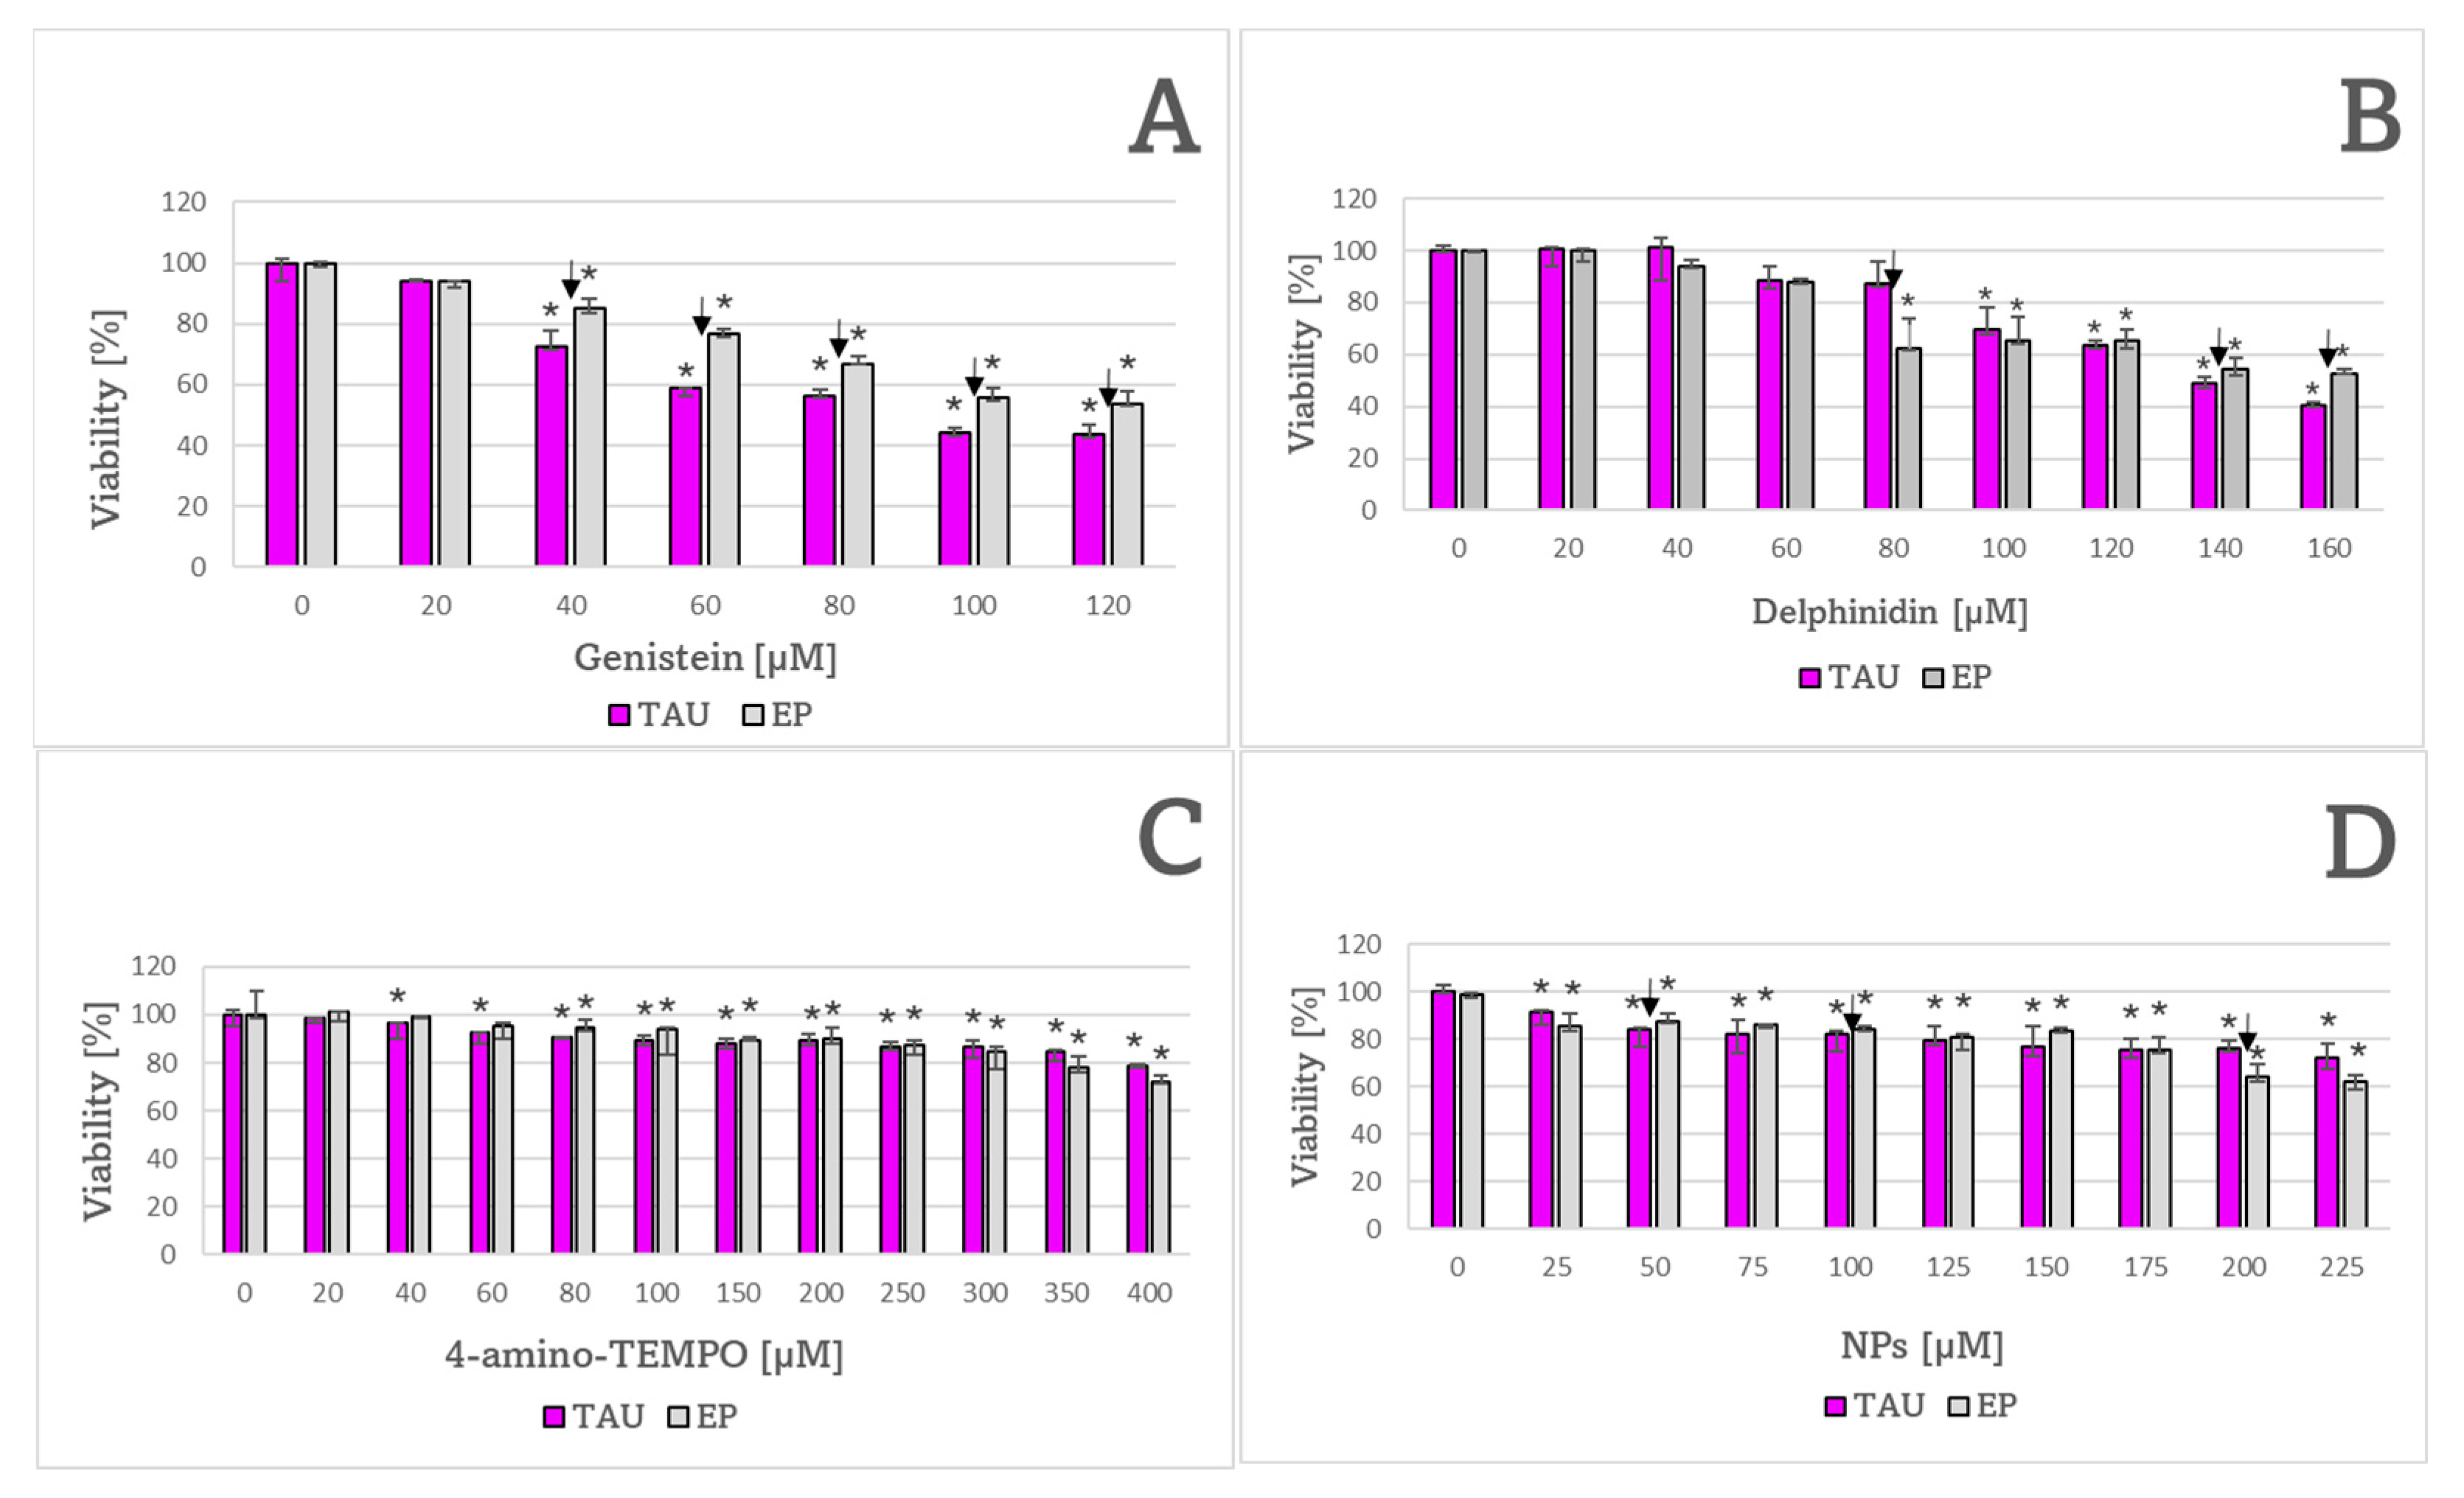
| Genistein | 100 ± 11 μM ✠ | 137 ± 12 μM |
| Delphinidin | 141 ± 2 μM | 133 ± 9 μM |
| 4-Amino TEMPO | 850 ± 157 μM | 614 ± 26 μM |
| NPs | 295 ± 37 μM | 305 ± 4 μM |
Disclaimer/Publisher’s Note: The statements, opinions and data contained in all publications are solely those of the individual author(s) and contributor(s) and not of MDPI and/or the editor(s). MDPI and/or the editor(s) disclaim responsibility for any injury to people or property resulting from any ideas, methods, instructions or products referred to in the content. |
© 2022 by the authors. Licensee MDPI, Basel, Switzerland. This article is an open access article distributed under the terms and conditions of the Creative Commons Attribution (CC BY) license (https://creativecommons.org/licenses/by/4.0/).
Share and Cite
Pieńkowska, N.; Fahnestock, M.; Mahadeo, C.; Zaborniak, I.; Chmielarz, P.; Bartosz, G.; Sadowska-Bartosz, I. Induction of Oxidative Stress in SH-SY5Y Cells by Overexpression of hTau40 and Its Mitigation by Redox-Active Nanoparticles. Int. J. Mol. Sci. 2023, 24, 359. https://doi.org/10.3390/ijms24010359
Pieńkowska N, Fahnestock M, Mahadeo C, Zaborniak I, Chmielarz P, Bartosz G, Sadowska-Bartosz I. Induction of Oxidative Stress in SH-SY5Y Cells by Overexpression of hTau40 and Its Mitigation by Redox-Active Nanoparticles. International Journal of Molecular Sciences. 2023; 24(1):359. https://doi.org/10.3390/ijms24010359
Chicago/Turabian StylePieńkowska, Natalia, Margaret Fahnestock, Crystal Mahadeo, Izabela Zaborniak, Paweł Chmielarz, Grzegorz Bartosz, and Izabela Sadowska-Bartosz. 2023. "Induction of Oxidative Stress in SH-SY5Y Cells by Overexpression of hTau40 and Its Mitigation by Redox-Active Nanoparticles" International Journal of Molecular Sciences 24, no. 1: 359. https://doi.org/10.3390/ijms24010359
APA StylePieńkowska, N., Fahnestock, M., Mahadeo, C., Zaborniak, I., Chmielarz, P., Bartosz, G., & Sadowska-Bartosz, I. (2023). Induction of Oxidative Stress in SH-SY5Y Cells by Overexpression of hTau40 and Its Mitigation by Redox-Active Nanoparticles. International Journal of Molecular Sciences, 24(1), 359. https://doi.org/10.3390/ijms24010359