


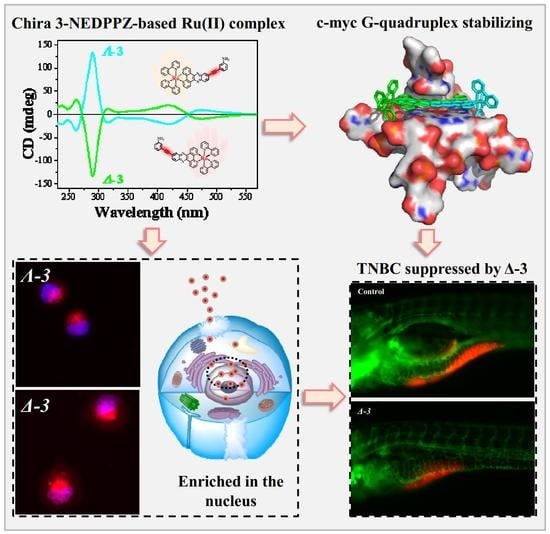
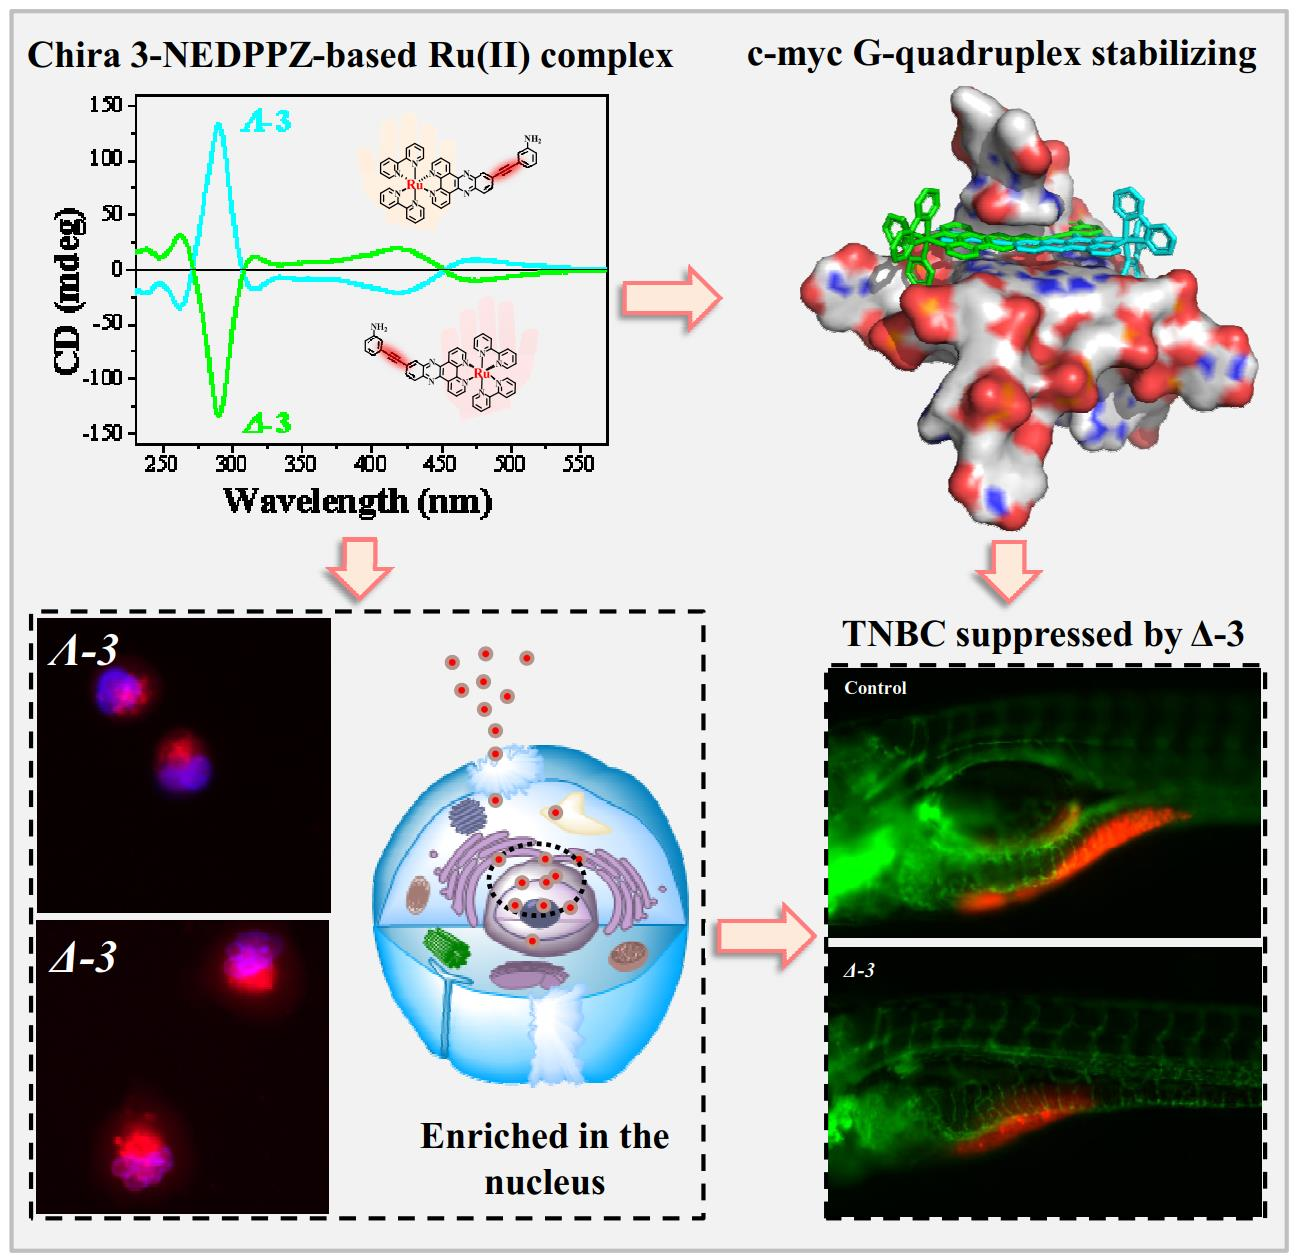
Novel Chiral Ru(II) Complexes as Potential c-myc G-quadruplex DNA Stabilizers Inducing DNA Damage to Suppress Triple-Negative Breast Cancer Progression

Abstract
1. Introduction
2. Results and Discussion
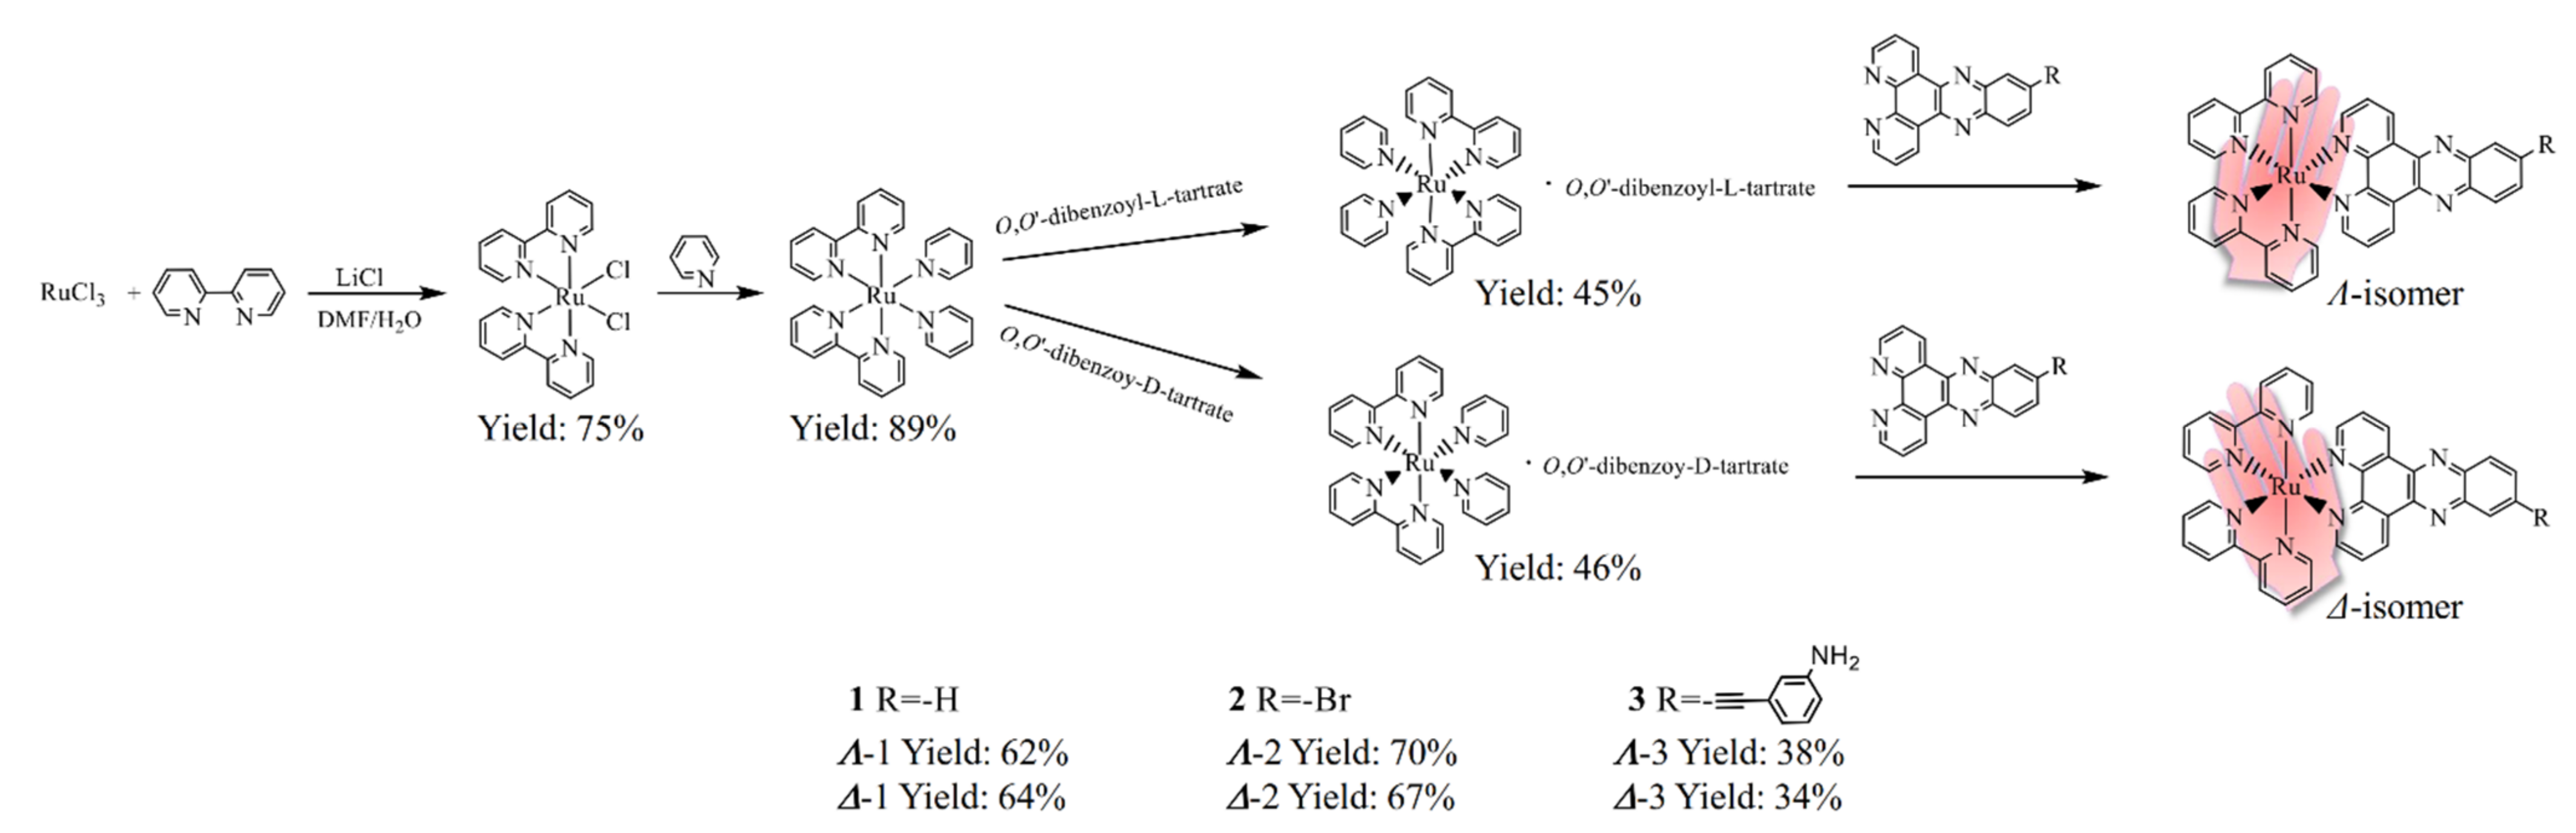
2.1. Synthesis and Characterization
2.2. Structure–Activity Relationship Analysis
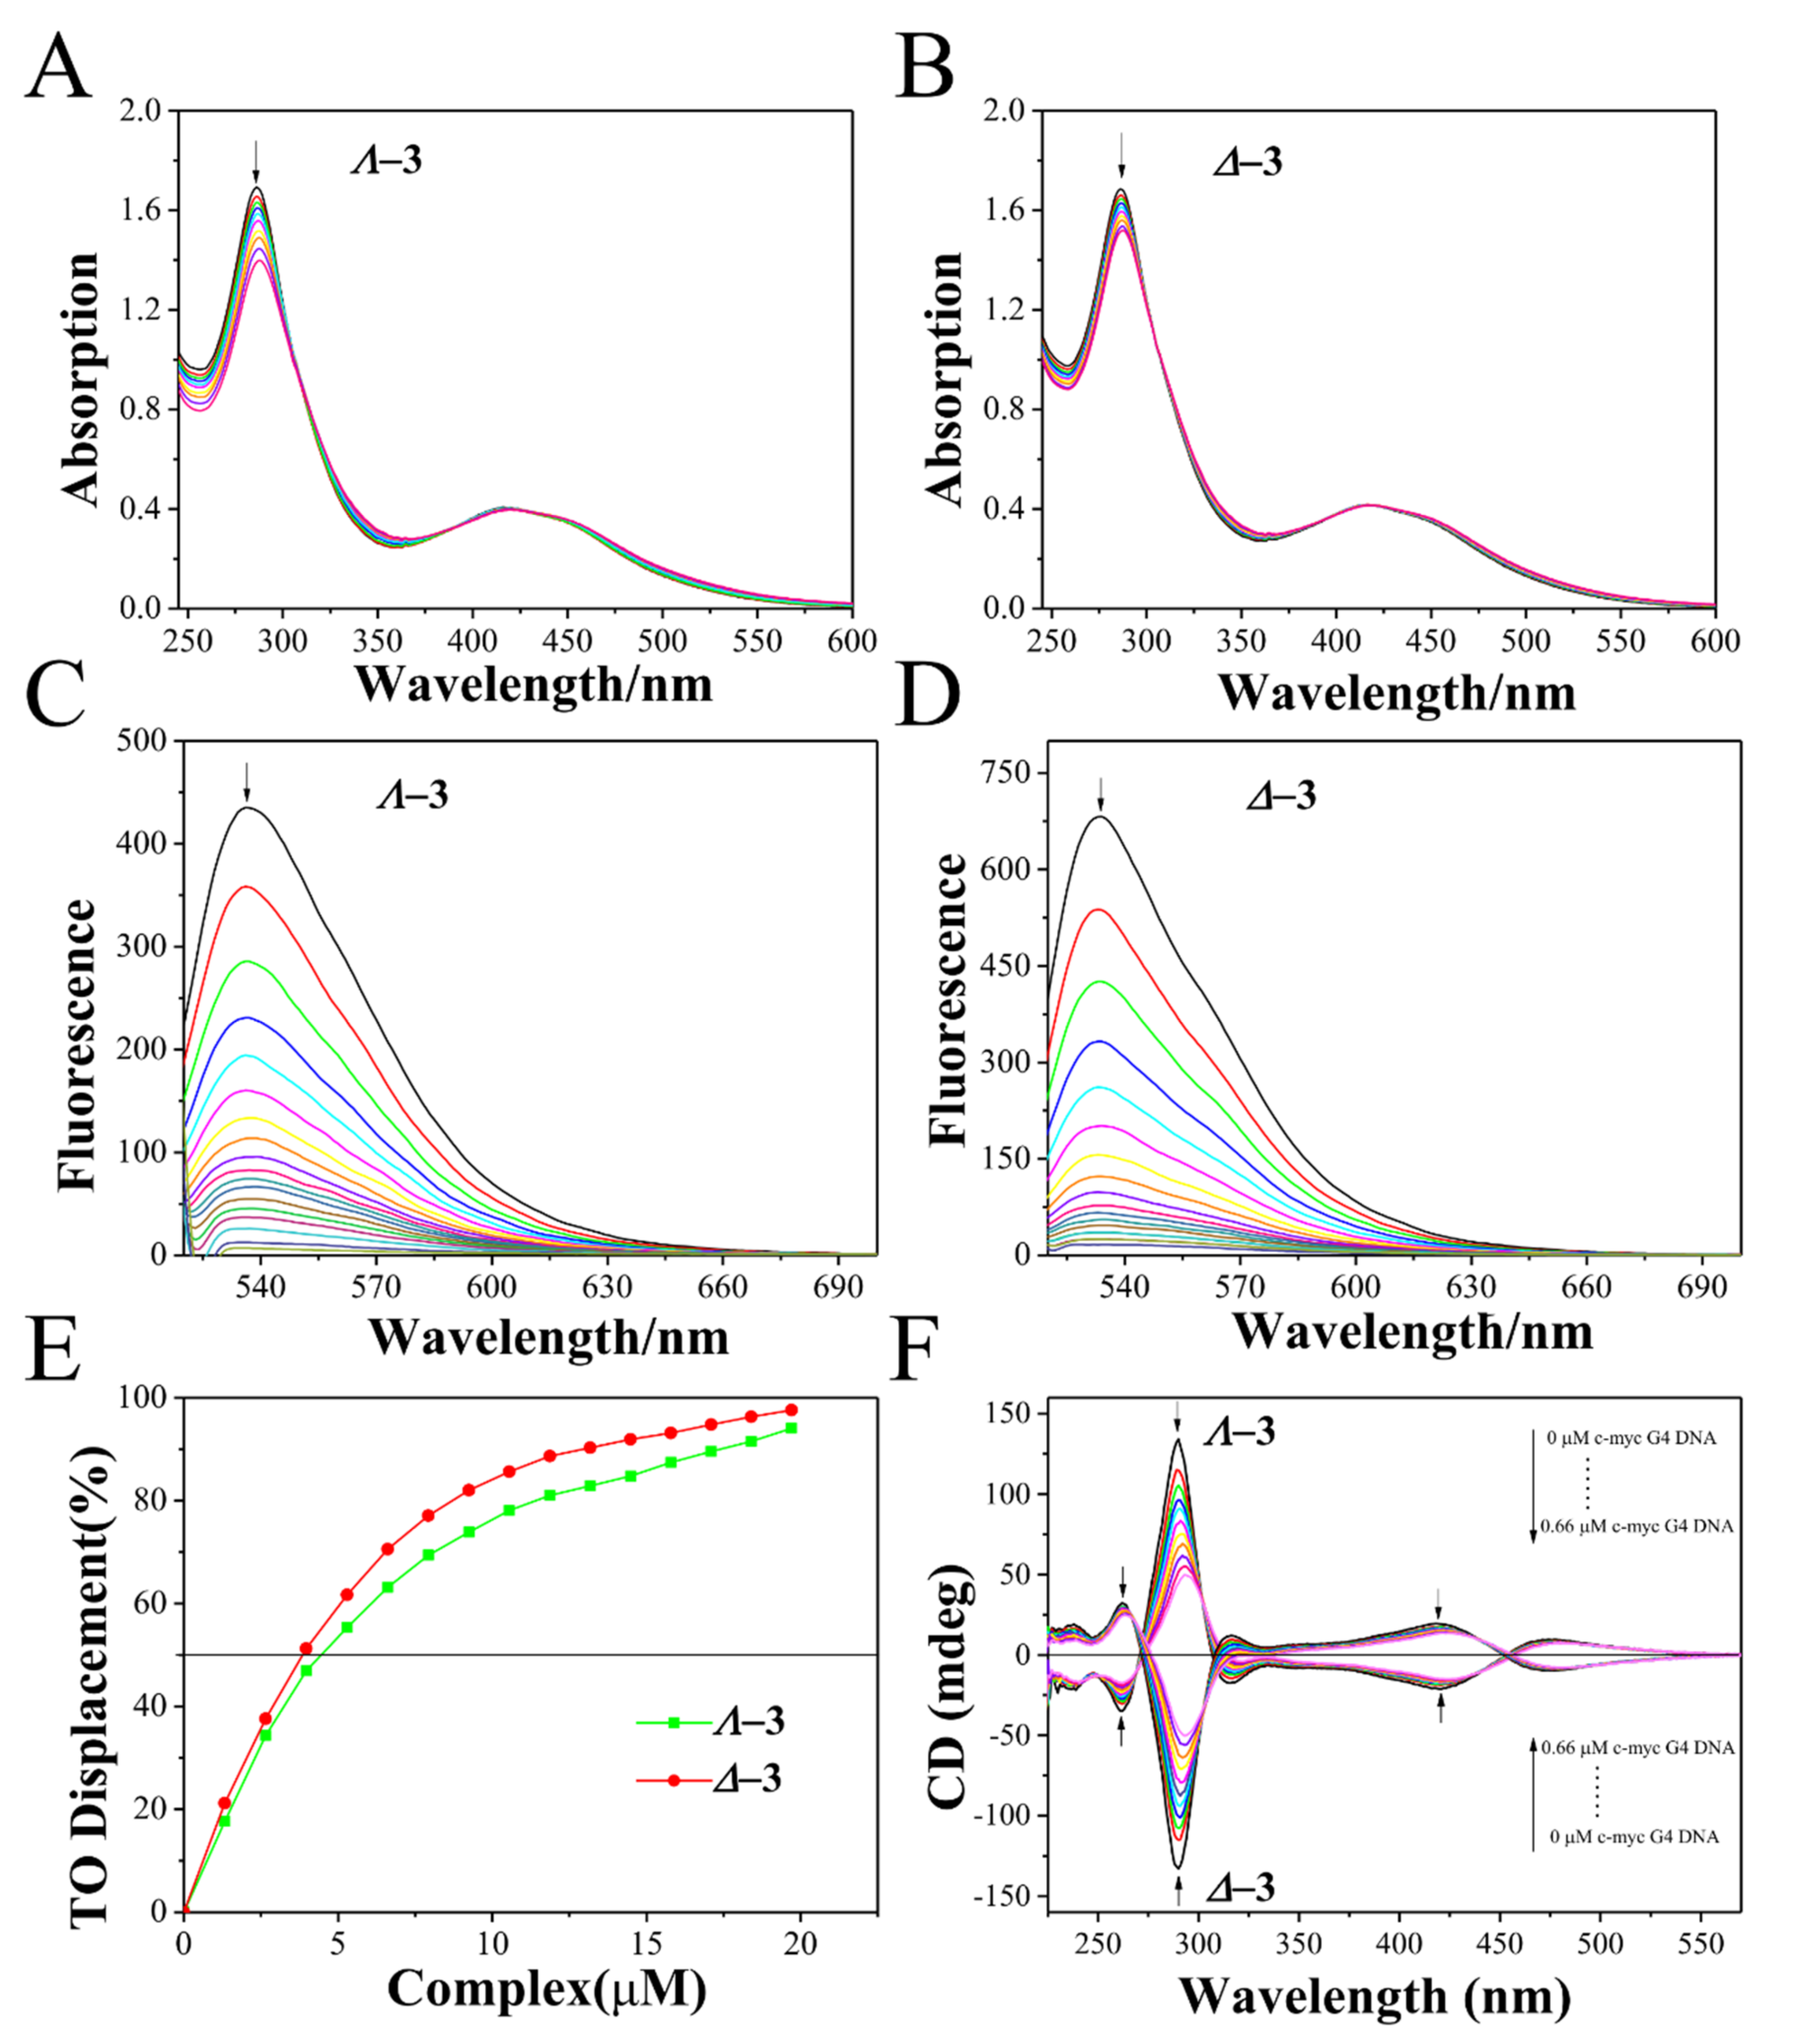
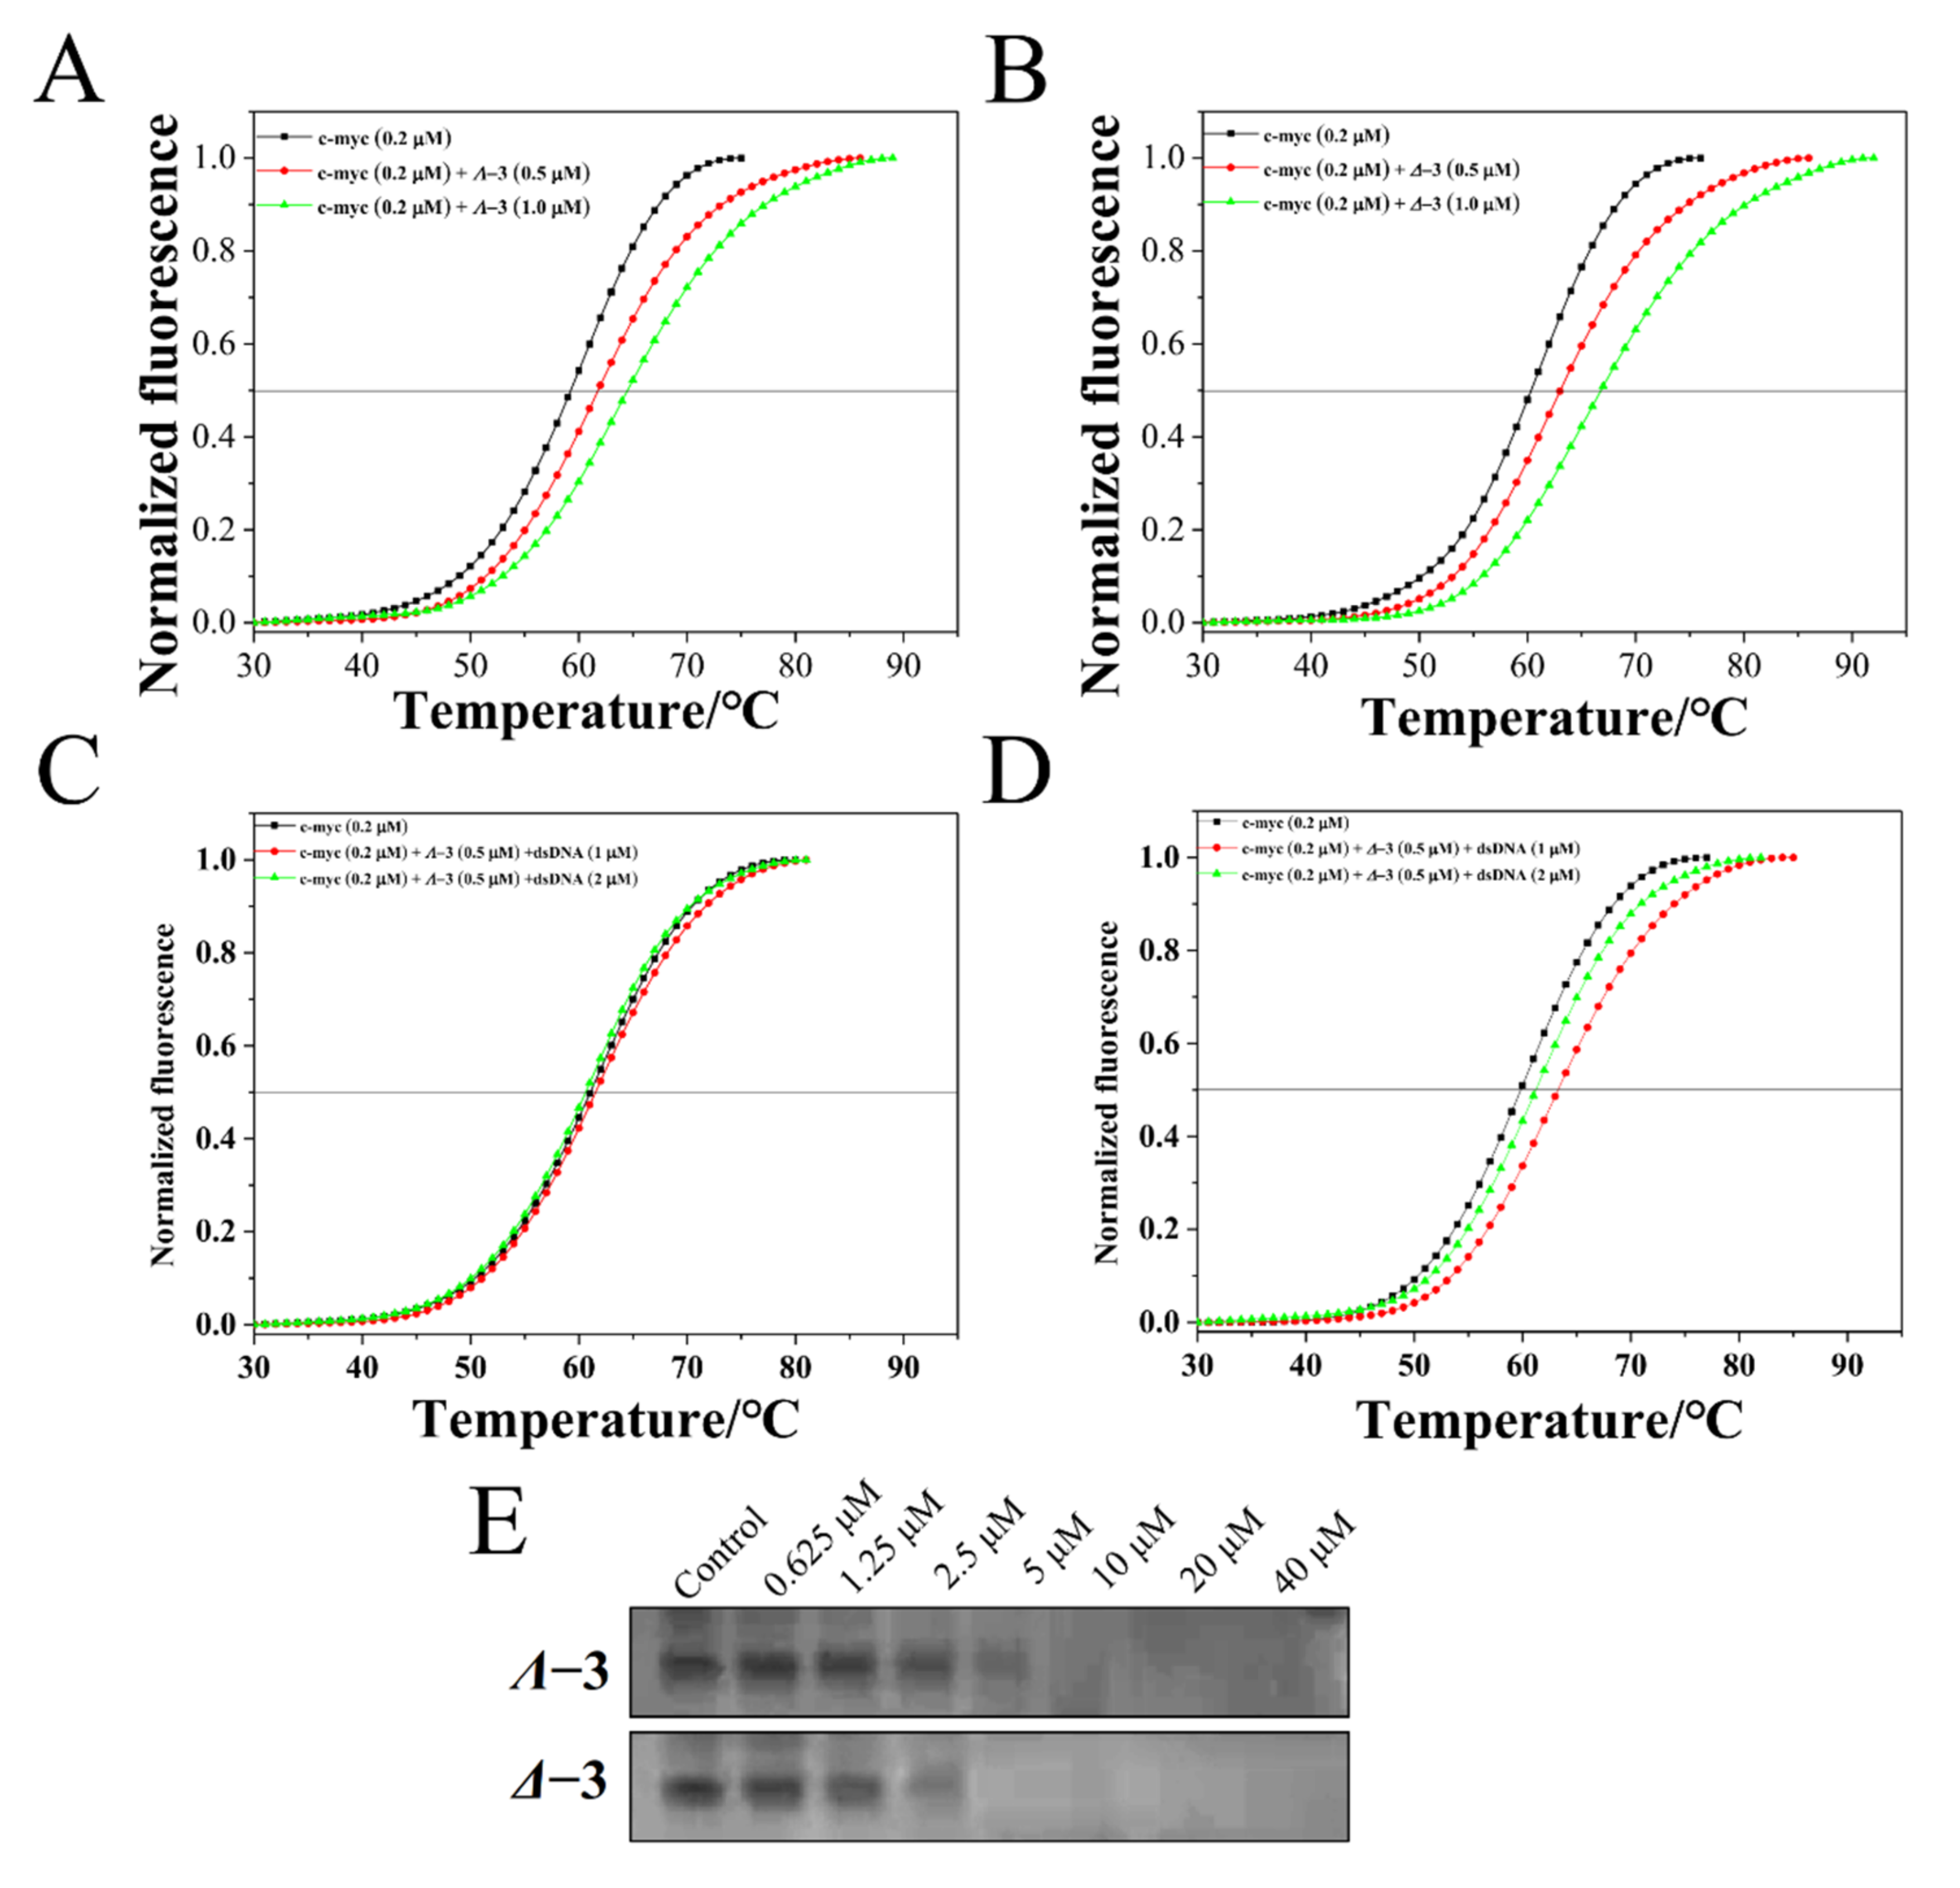
2.3. c-myc G-quadruplex-DNA-Binding Properties
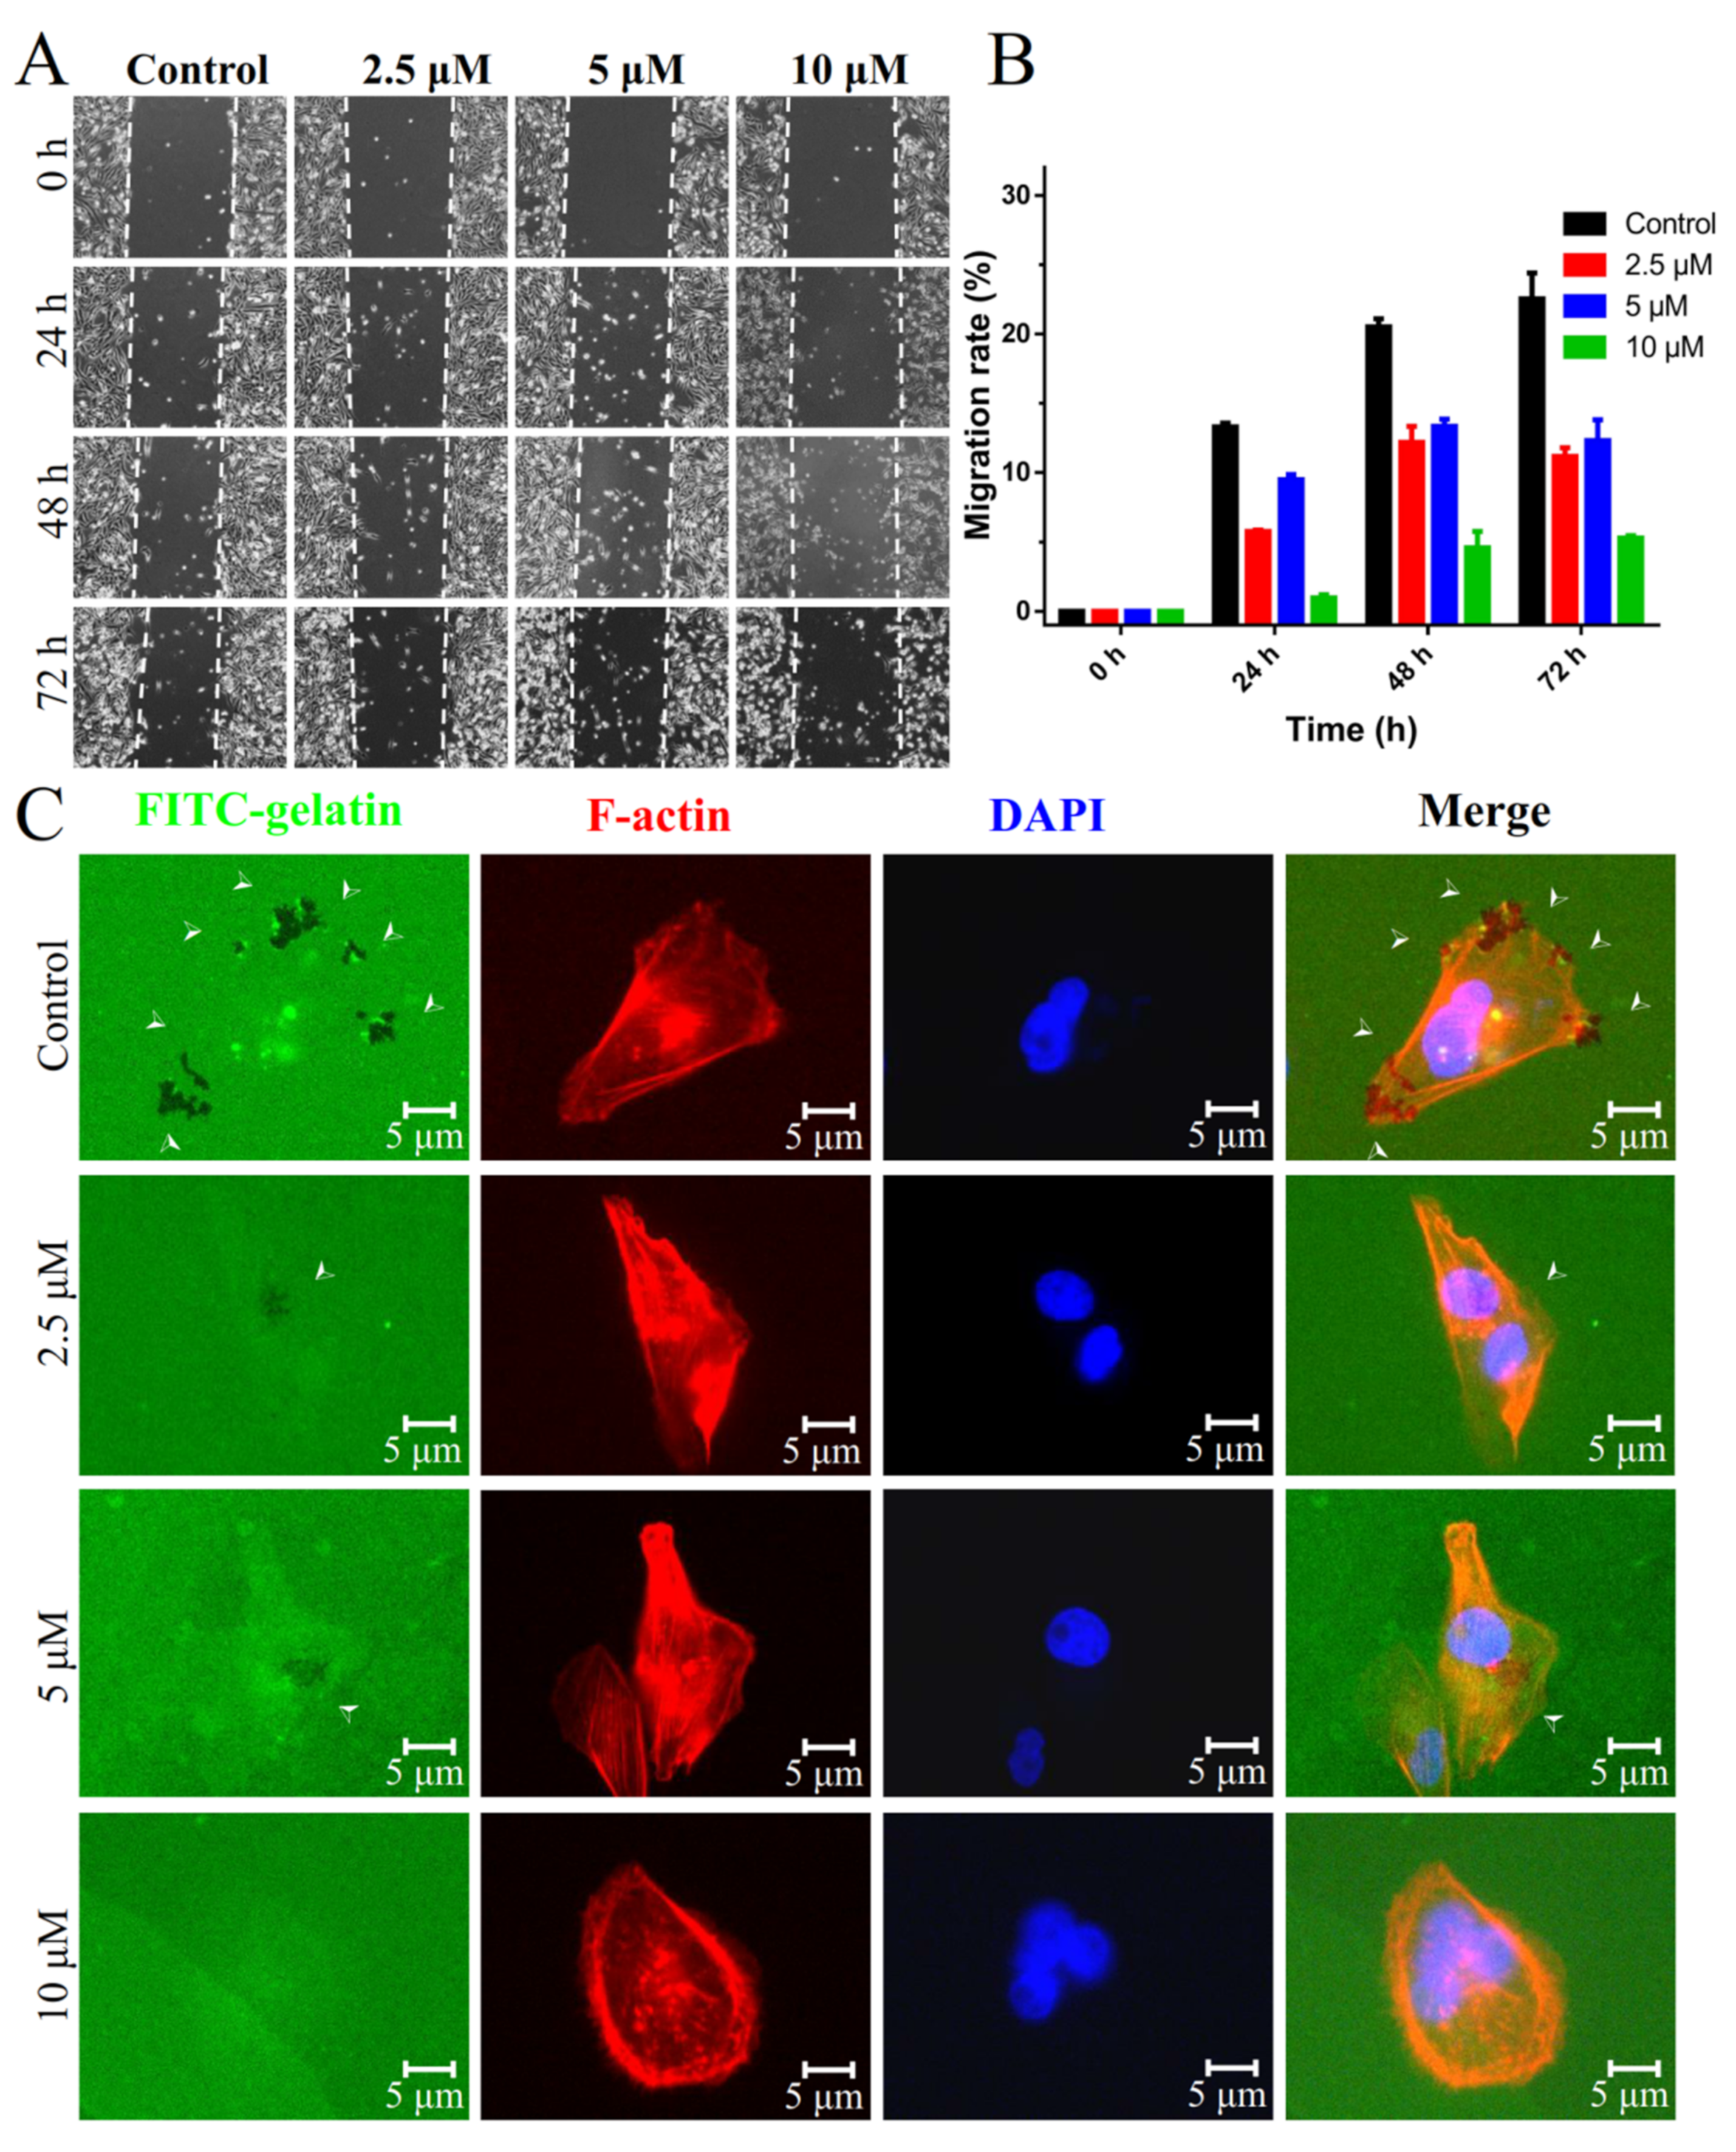
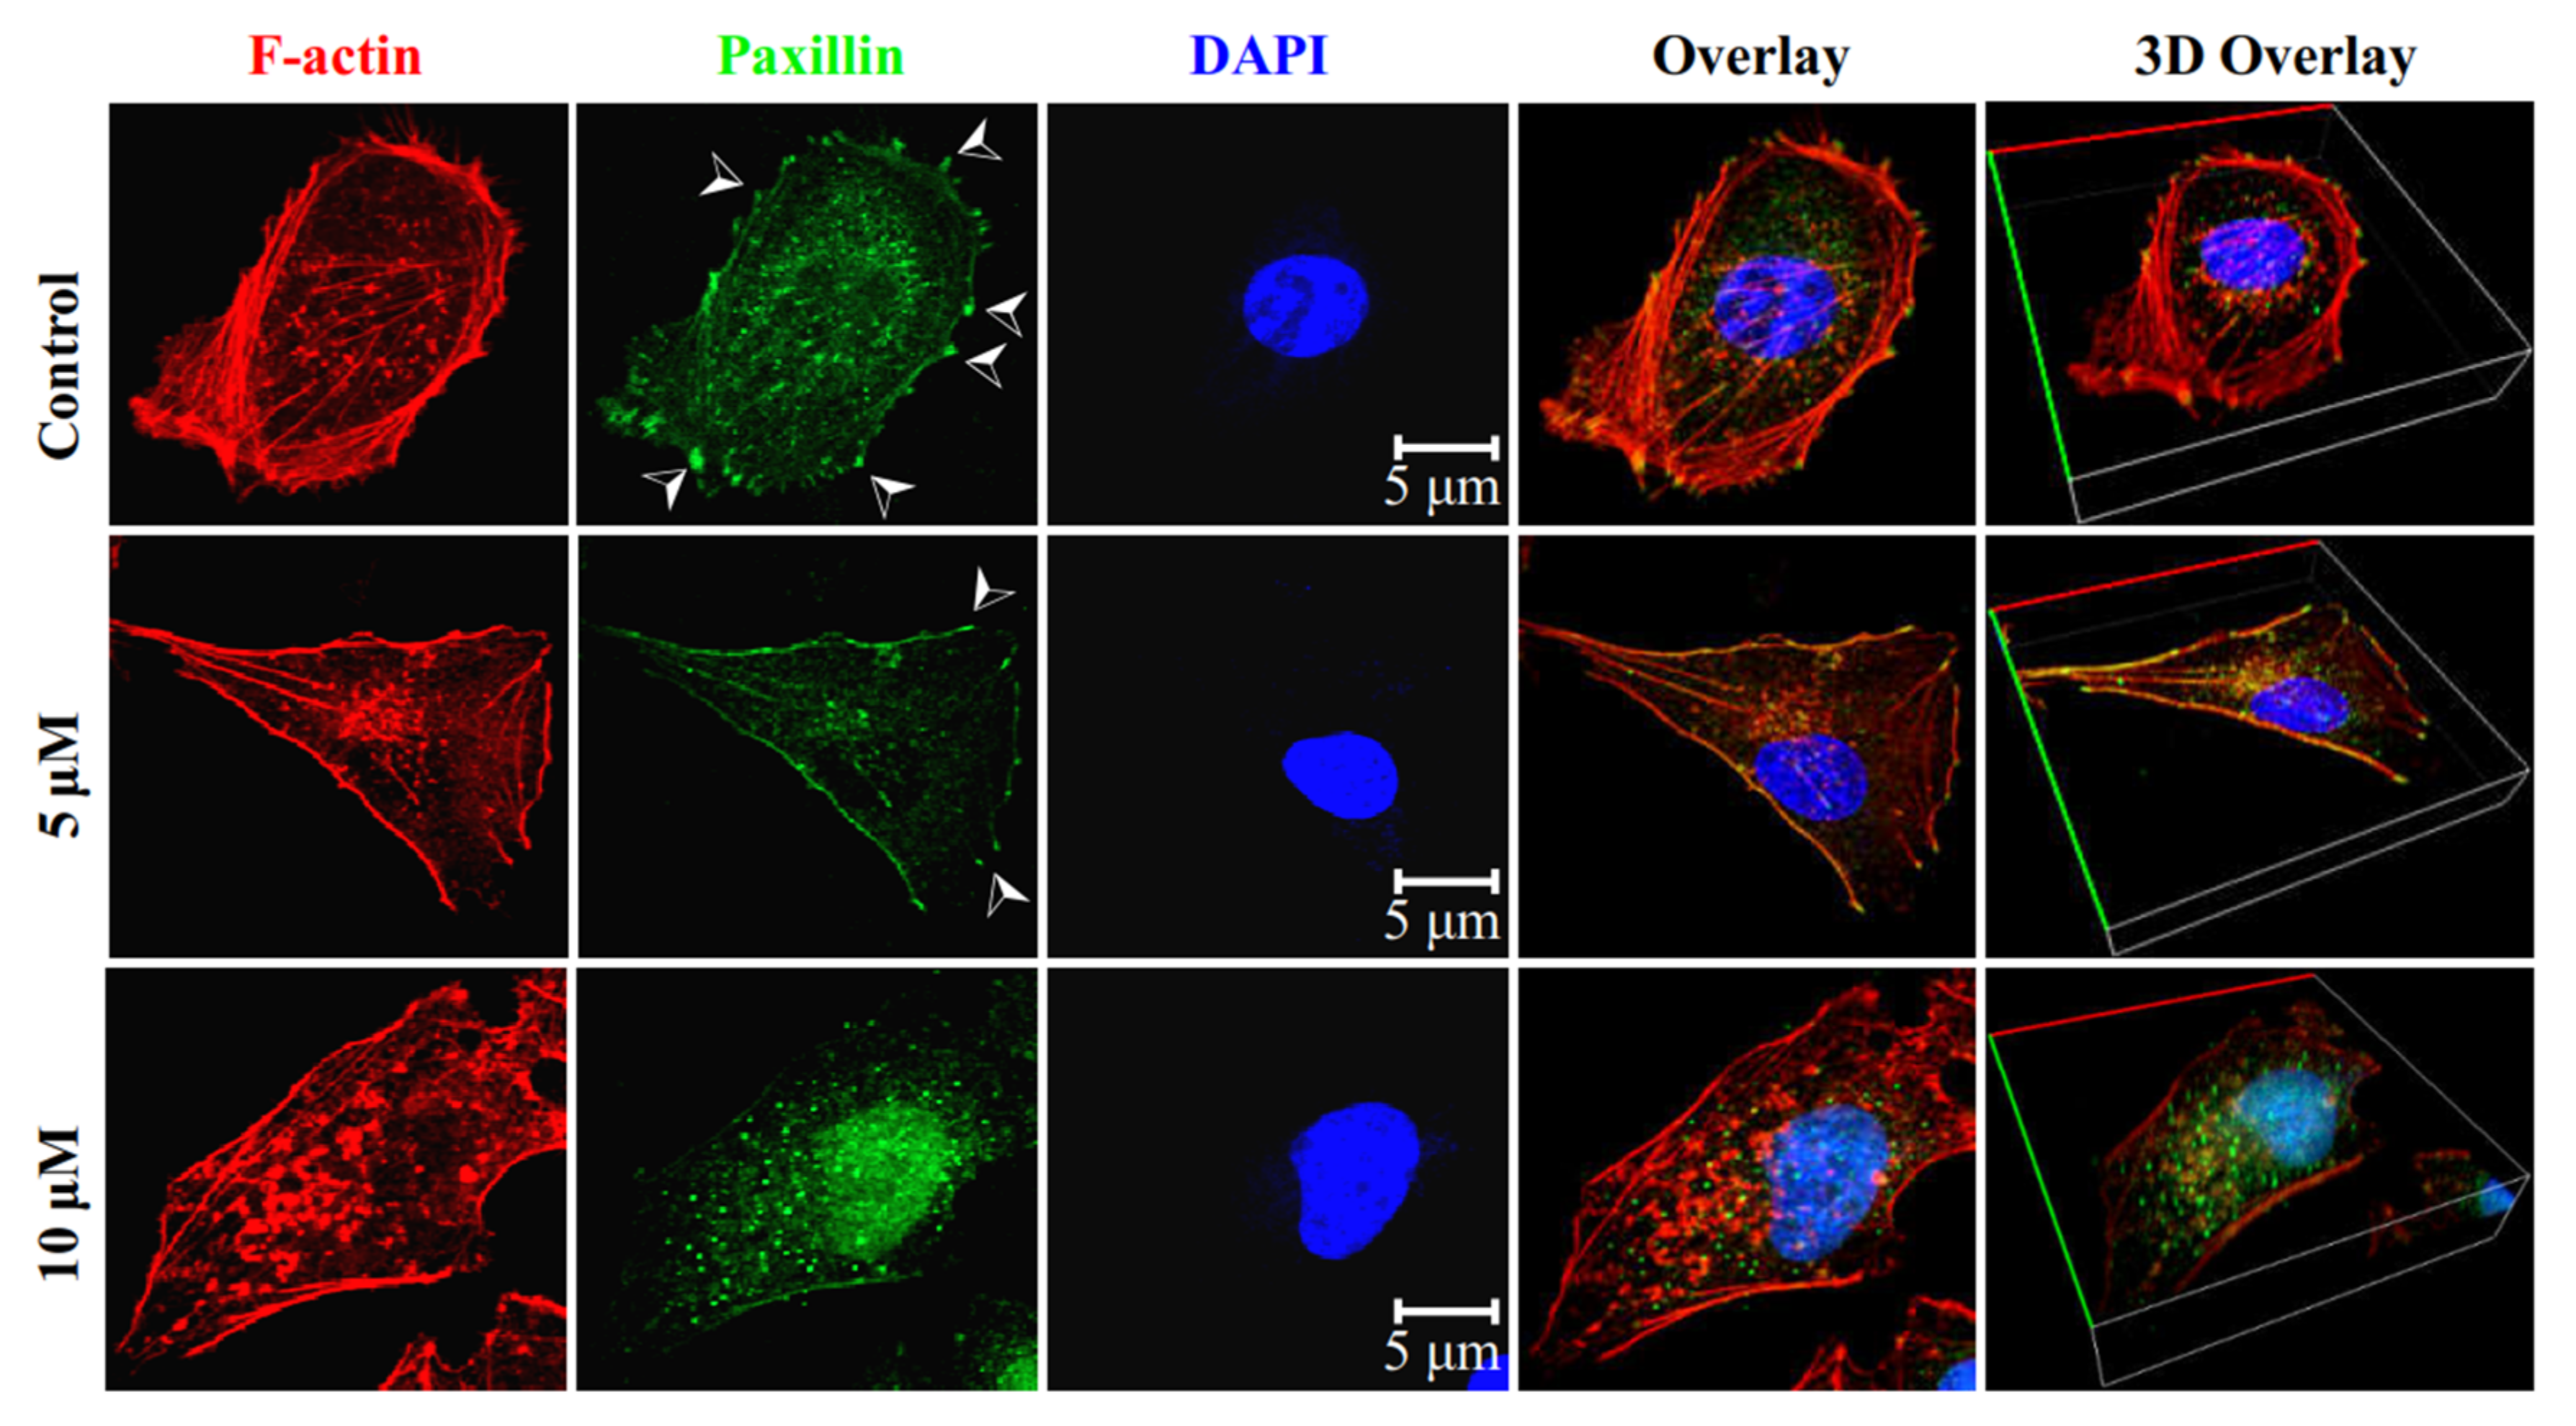
2.4. Inhibition of Migration and Invasion of TNBCs
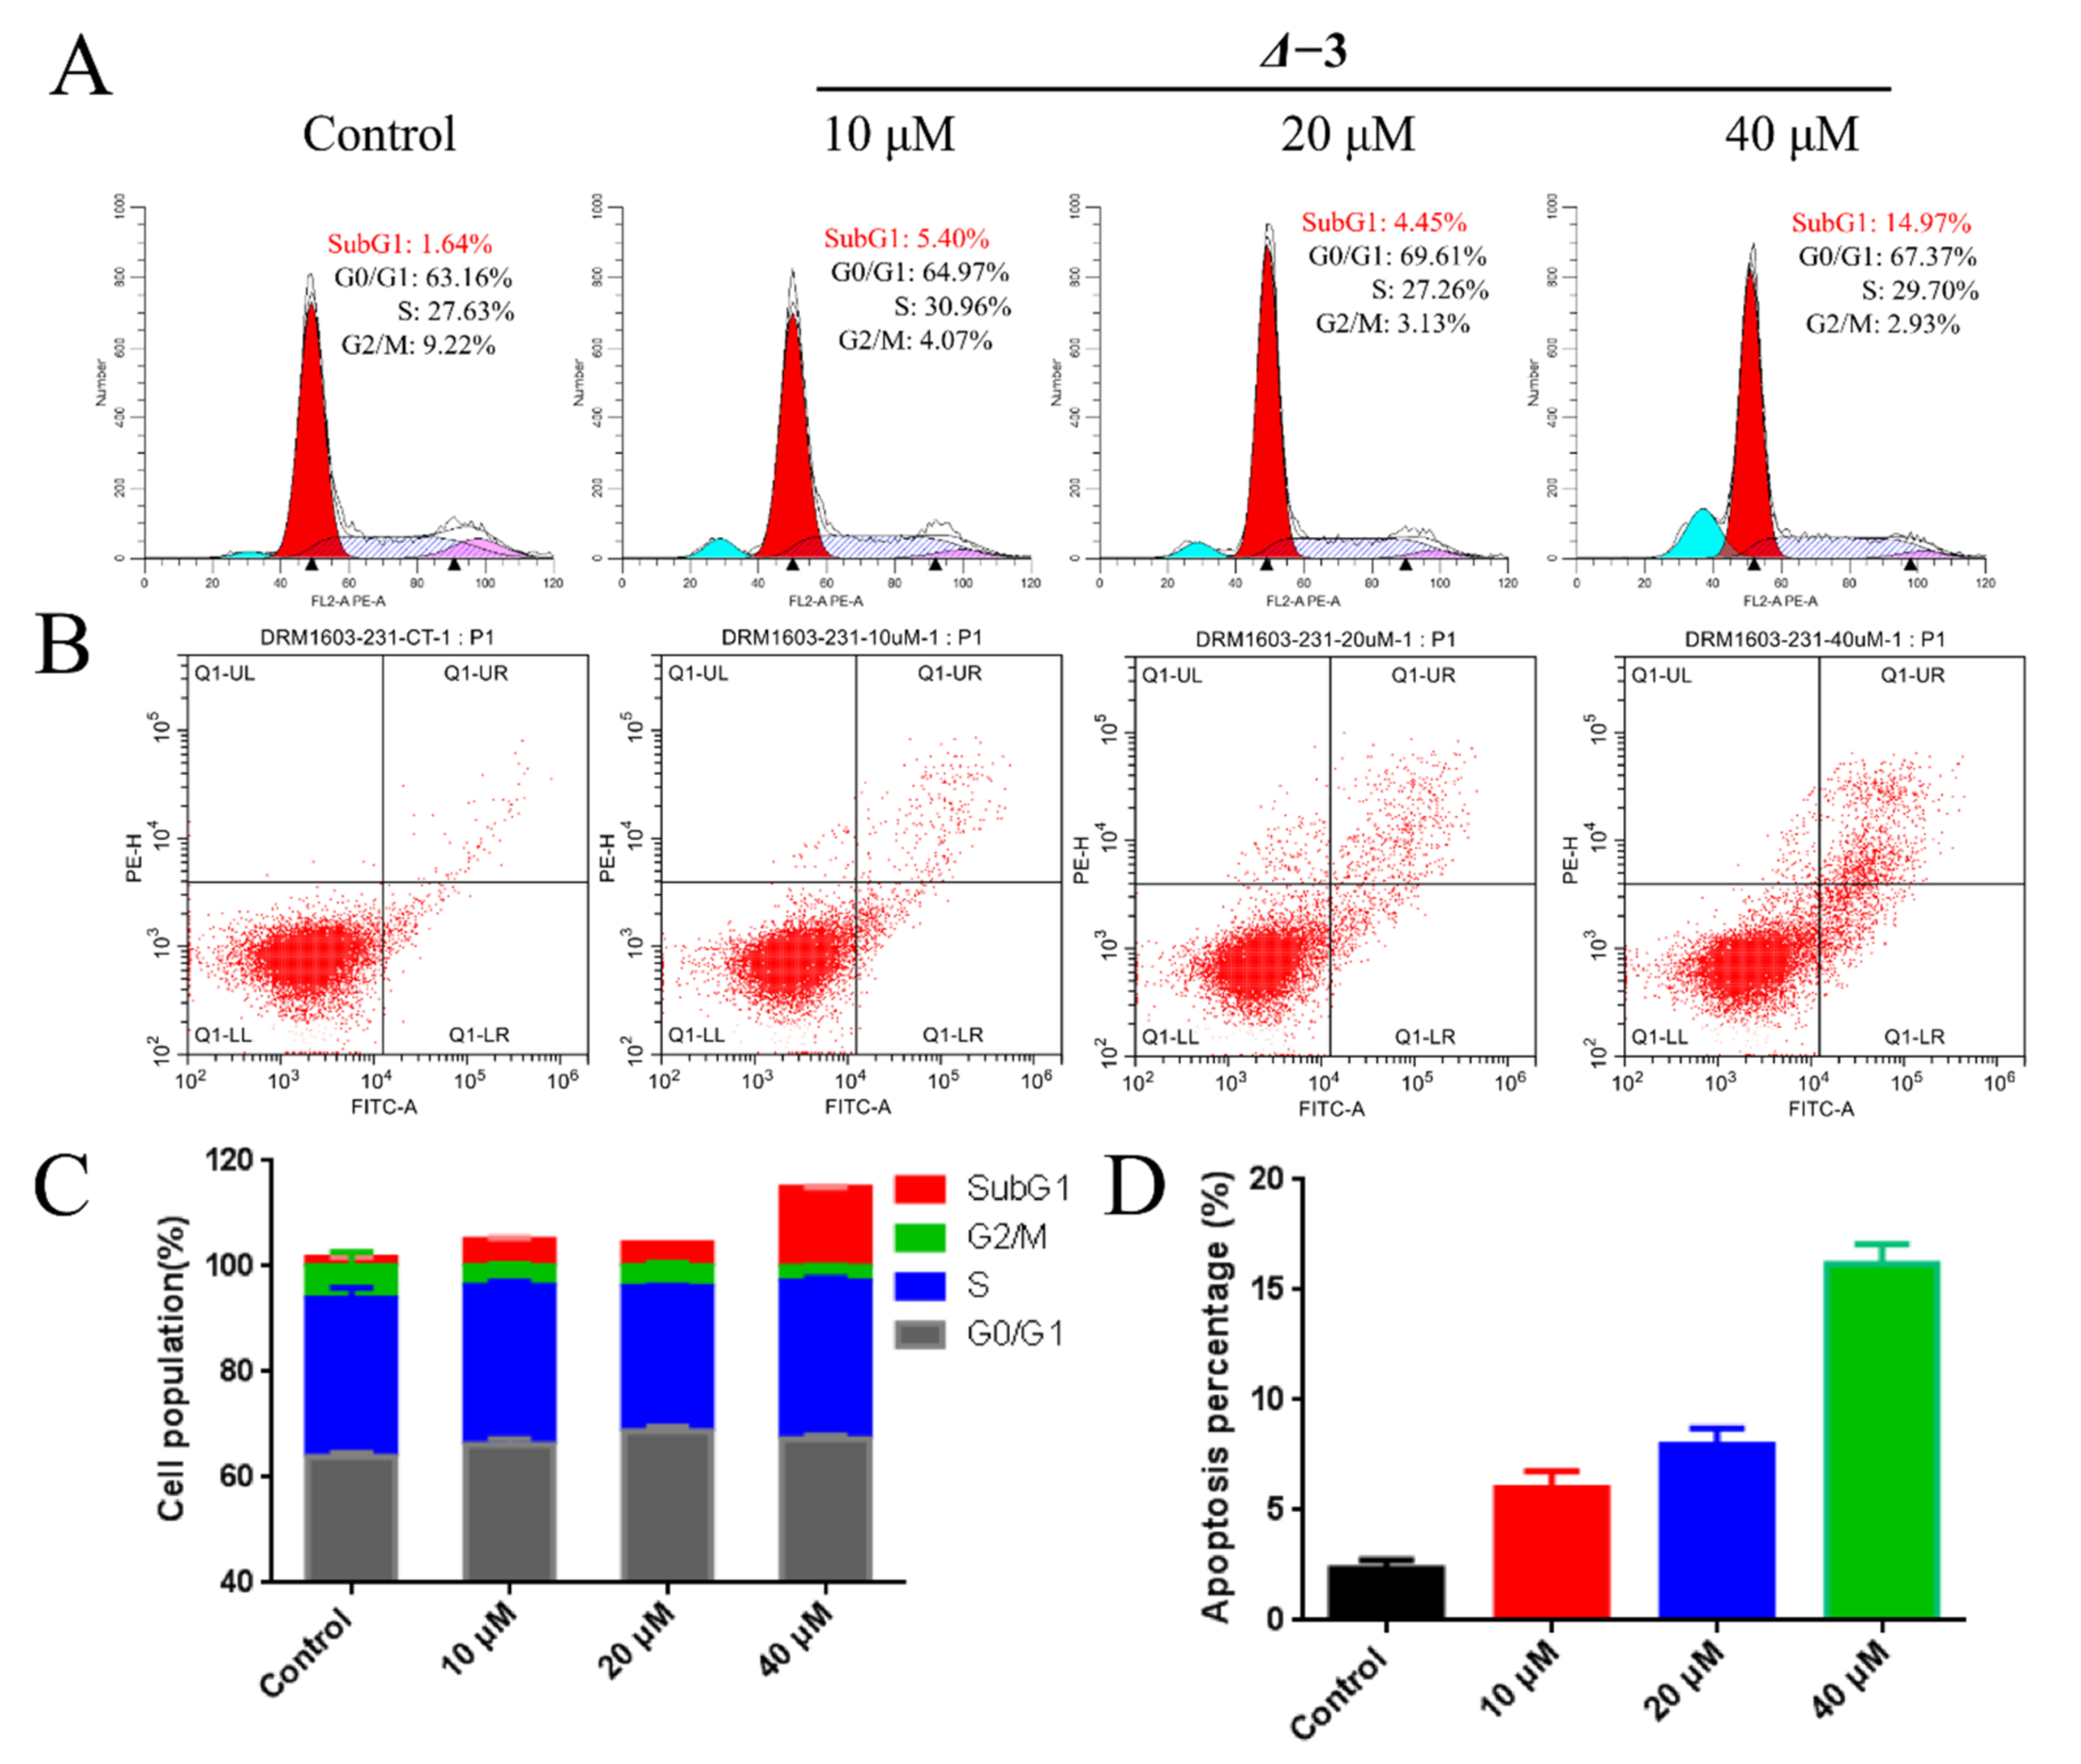
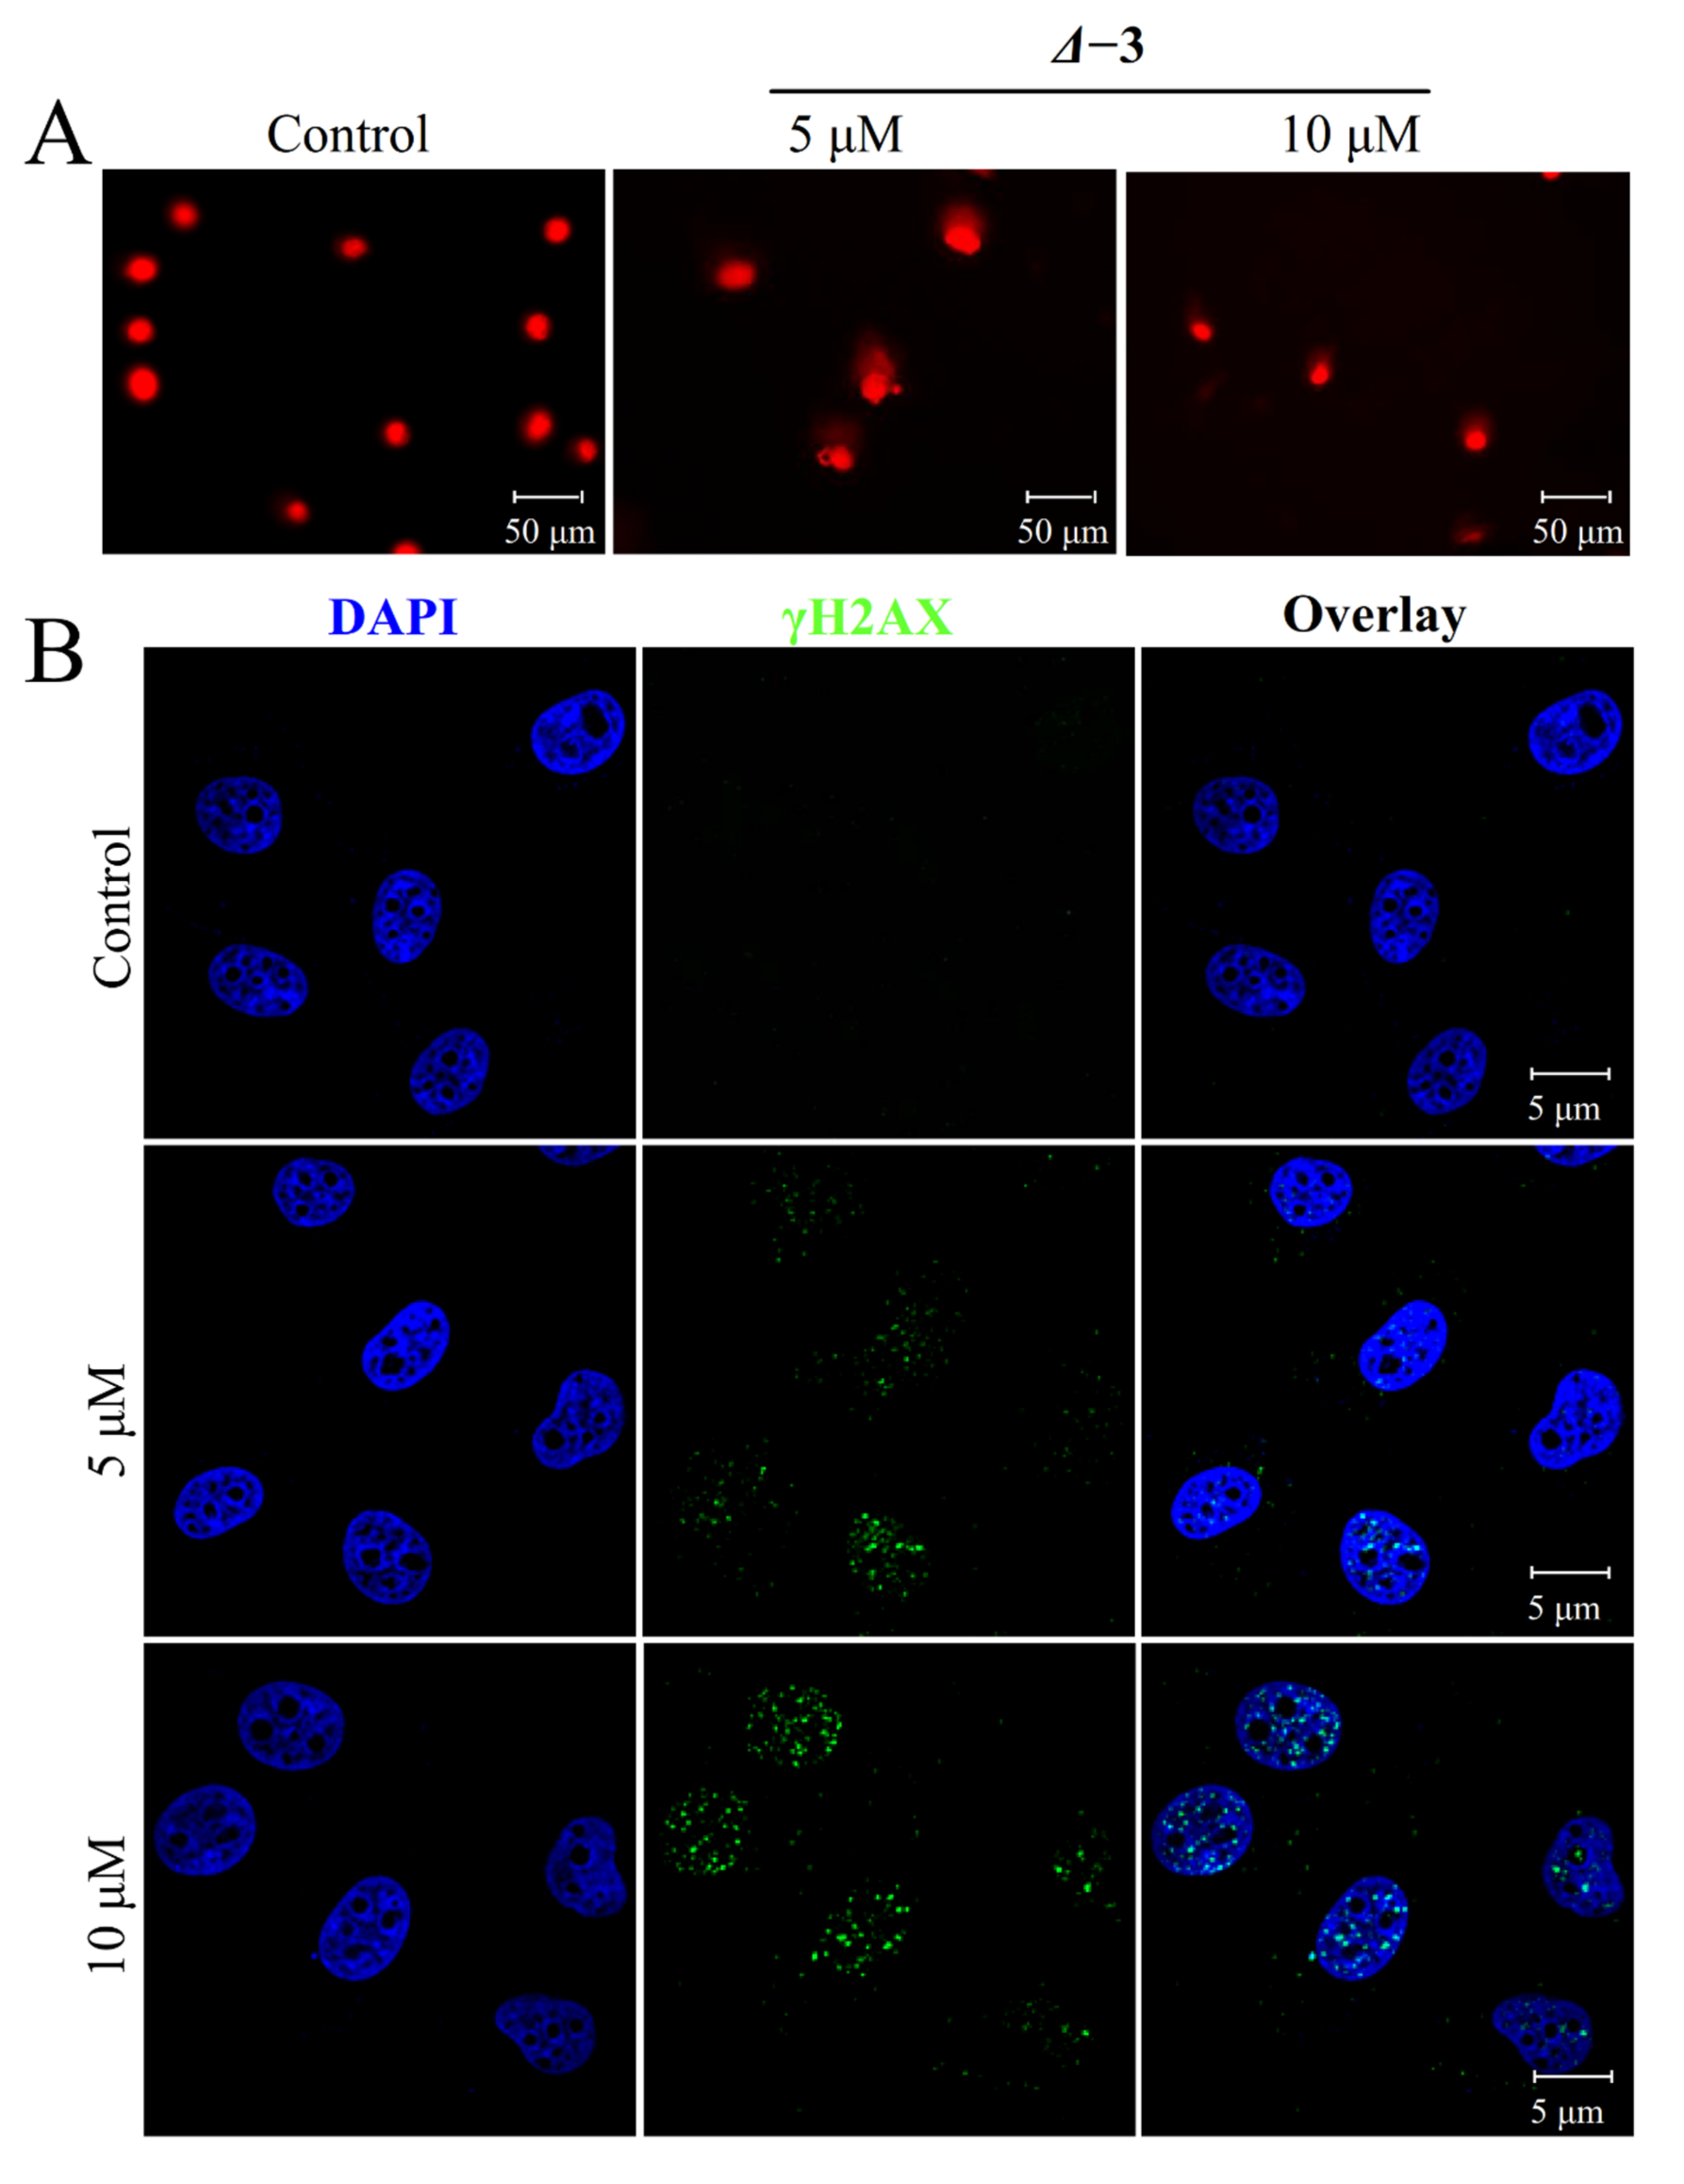
2.5. DNA-Damage-Mediated Apoptosis of TNBCs
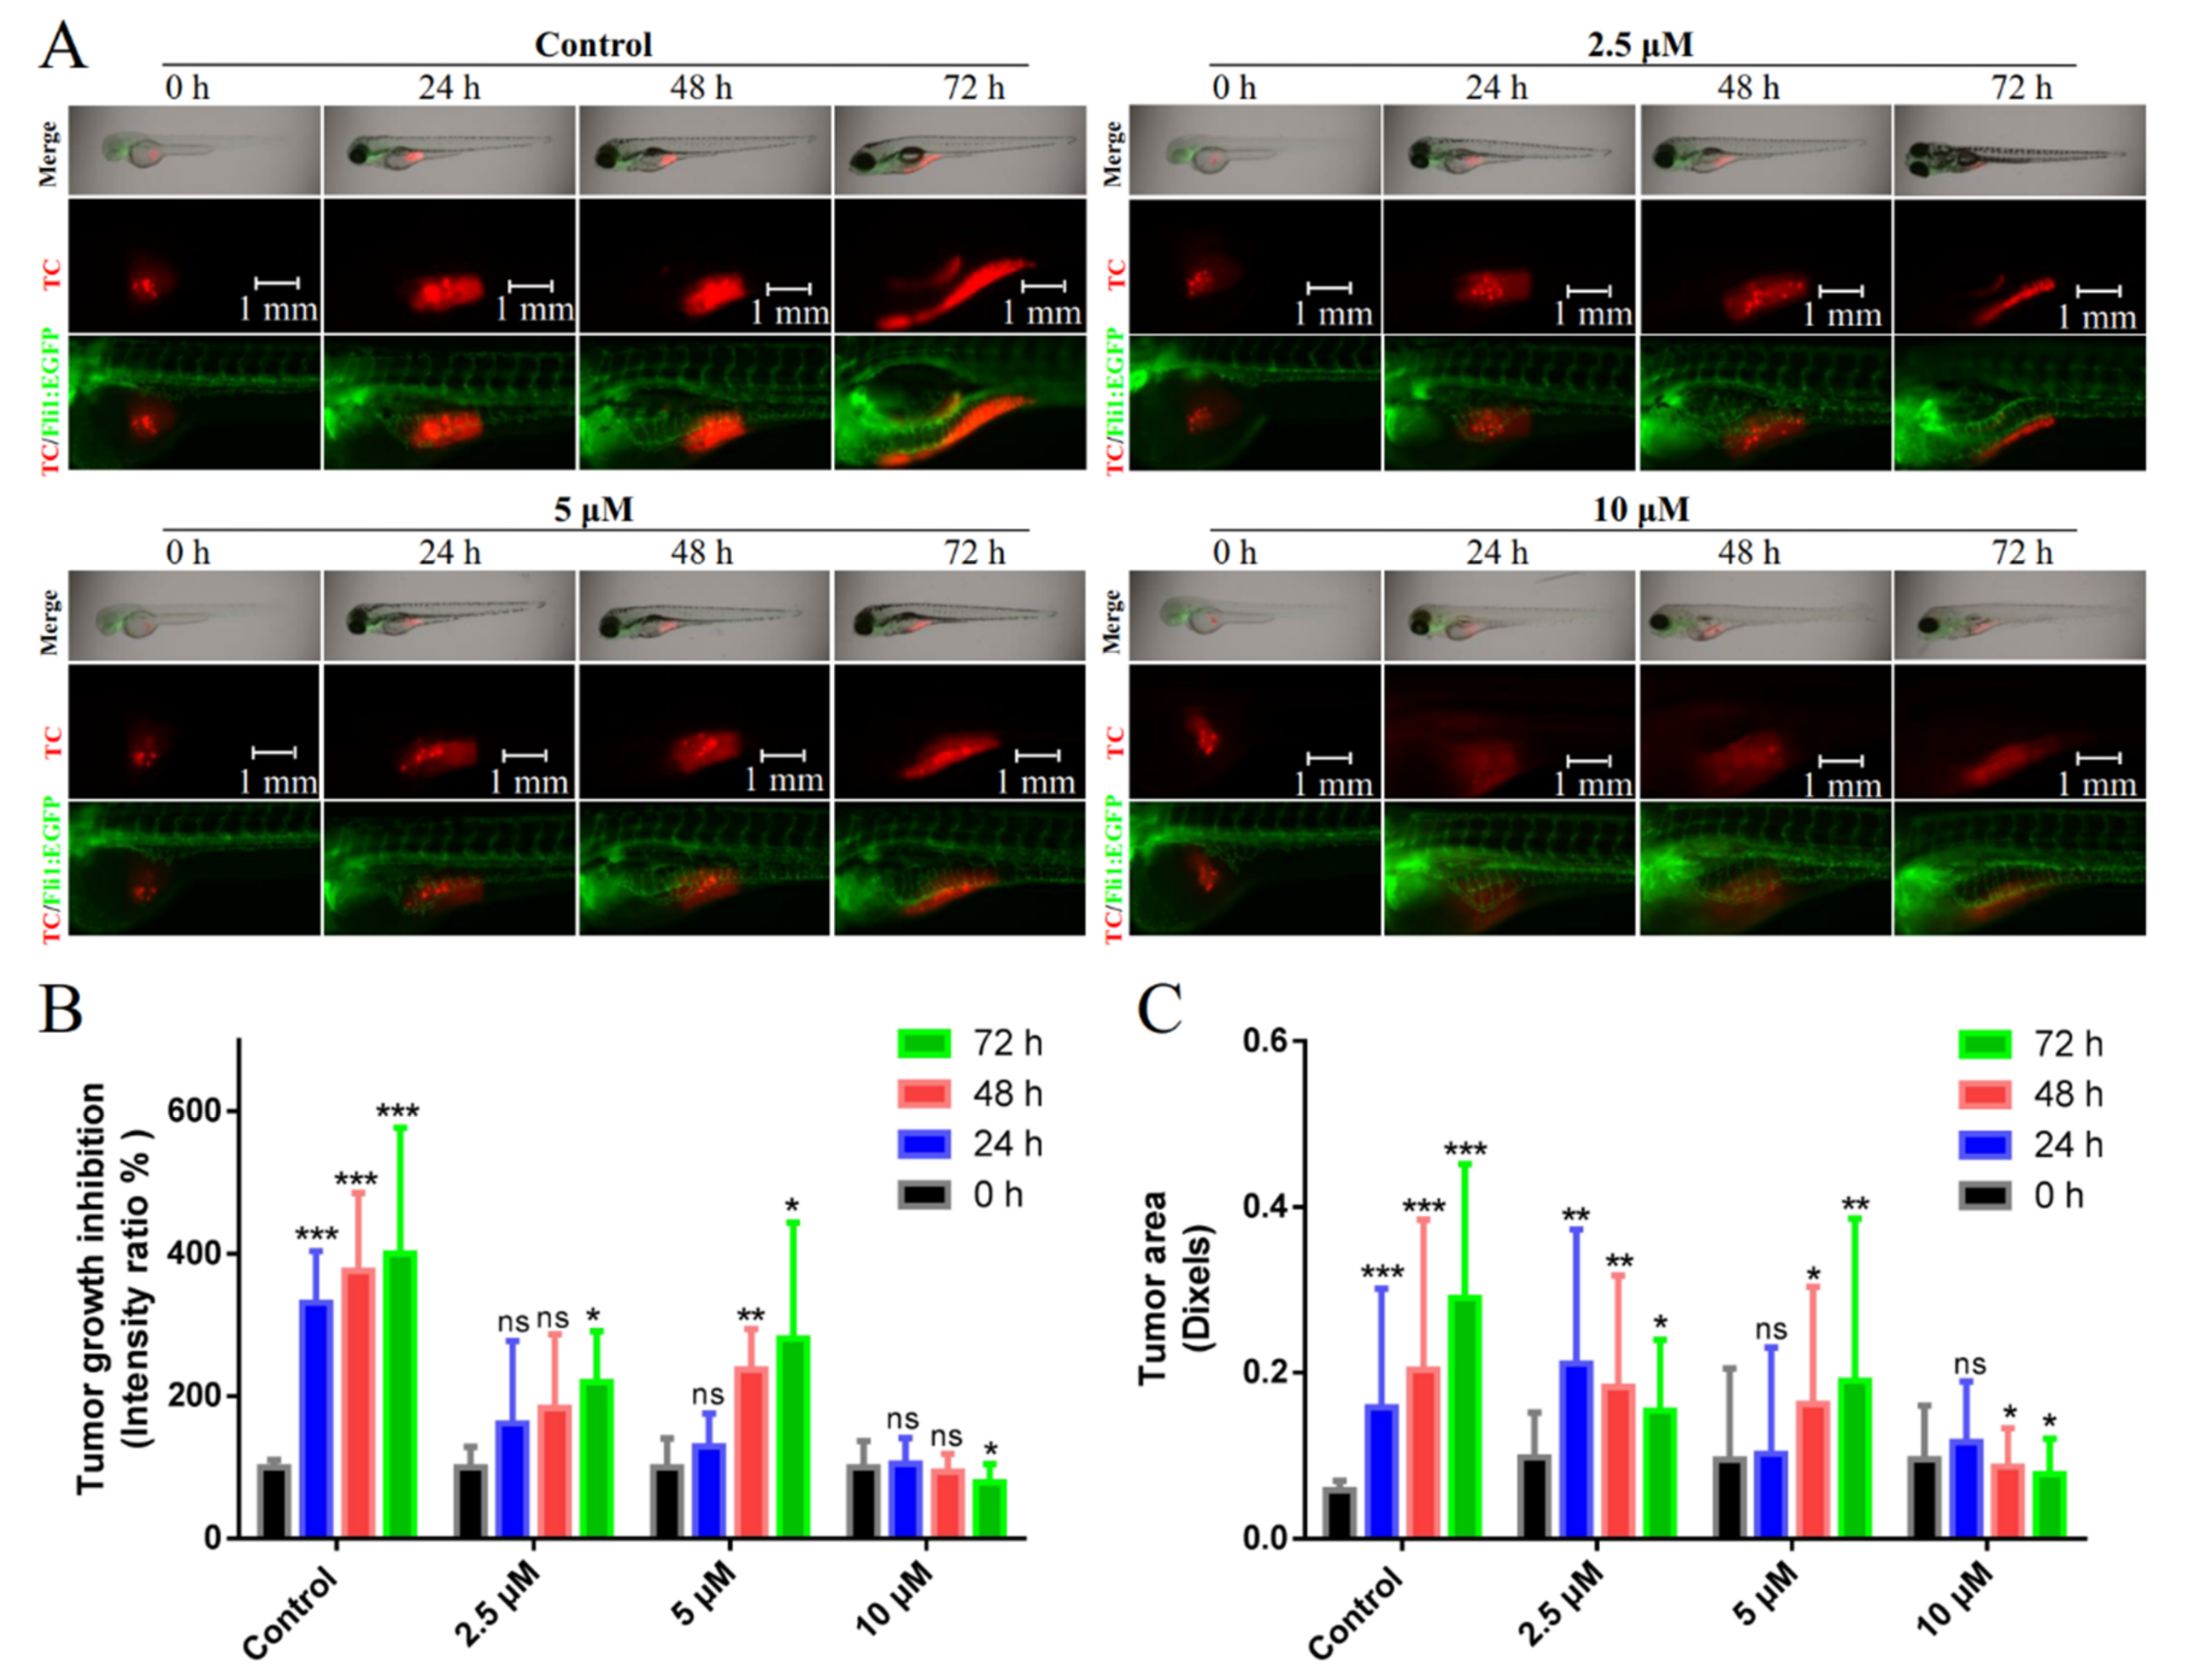
2.6. Suppression of Breast Cancer Growth and Metastasis in Vivo
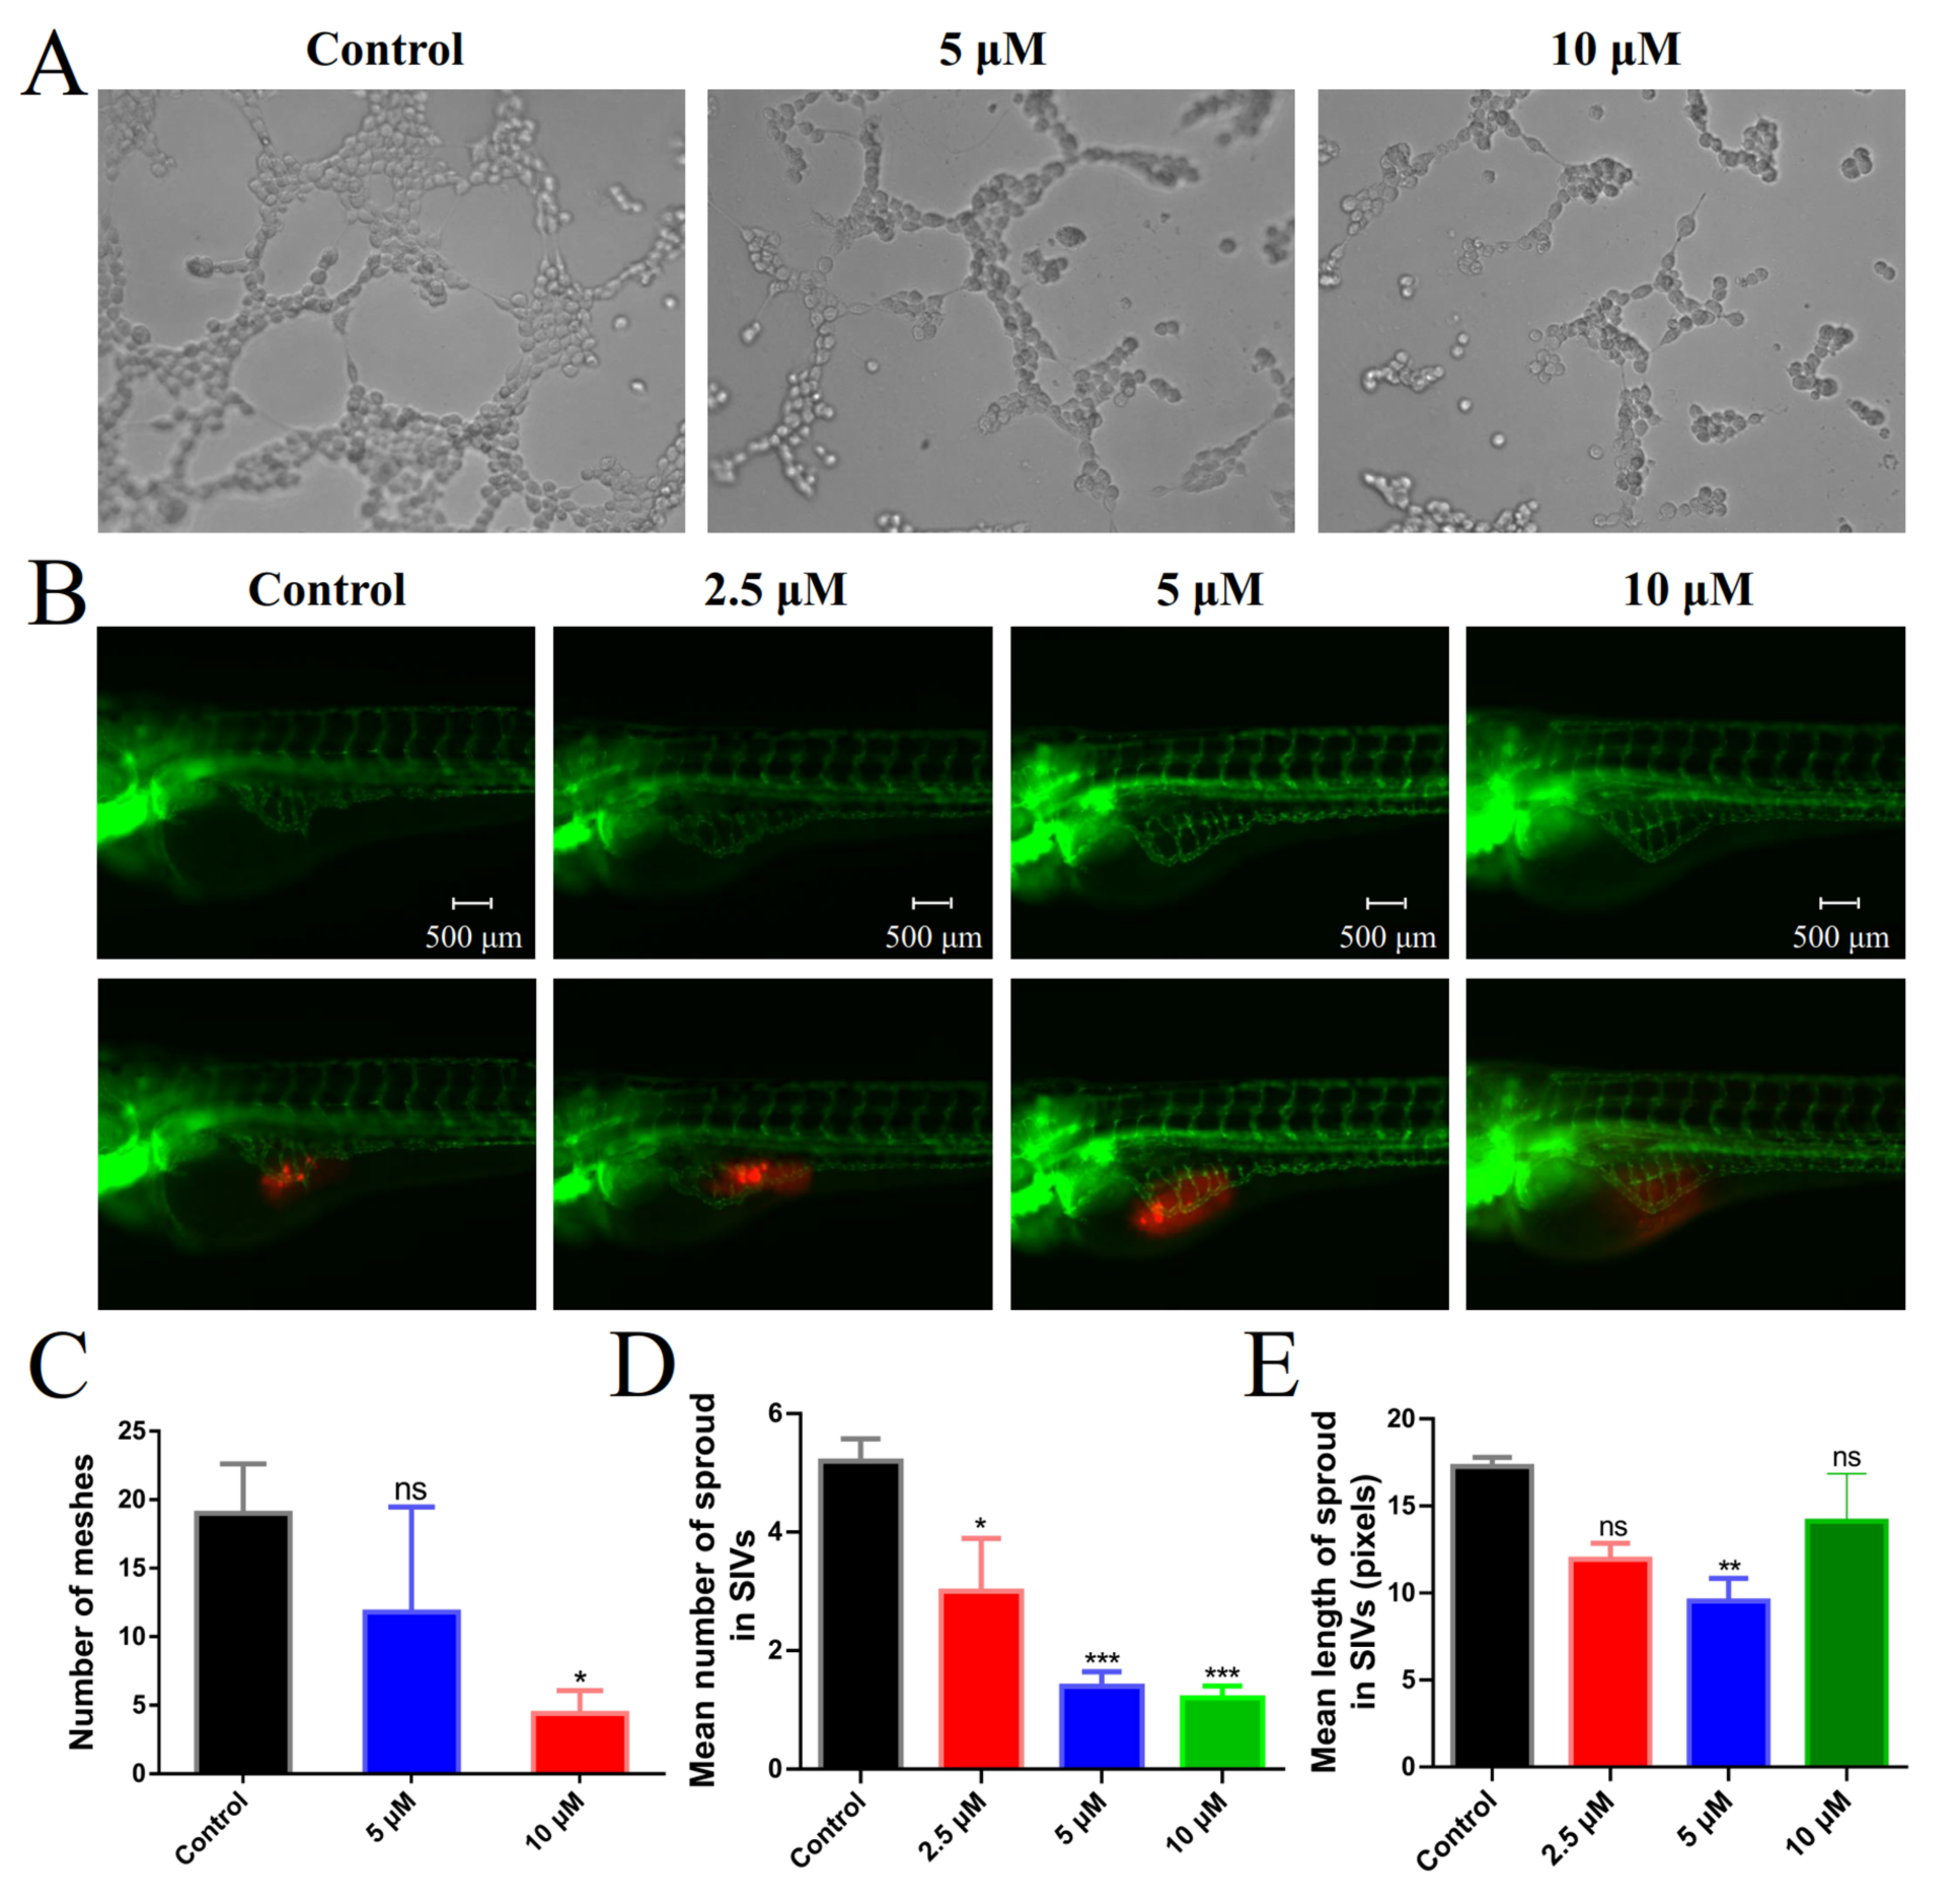
2.7. Angiogenesis Inhibition in Vitro and in Vivo
3. Materials and Methods
3.1. Reagents and Materials
3.2. Synthesis
3.2.1. Synthesis and Characterization of Λ-[Ru(bpy)2(DPPZ)](ClO4)2 (Λ−1)
3.2.2. Synthesis and Characterization of Δ-[Ru(bpy)2(DPPZ)](ClO4)2 (Δ−1)
3.2.3. Synthesis and Characterization of Λ-[Ru(bpy)2(BrDPPZ)](ClO4)2 (Λ−2)
3.2.4. Synthesis and Characterization of Δ-[Ru(bpy)2(BrDPPZ)](ClO4)2 (Δ−2)
3.2.5. Synthesis and Characterization of Λ-[Ru(bpy)2(3-NBEDPPZ)](ClO4)2 (Λ−−3)
3.2.6. Synthesis and Characterization of Δ-[Ru(bpy)2(3-NBEDPPZ)](ClO4)2 (Δ−−3)
3.3. MTT Assay
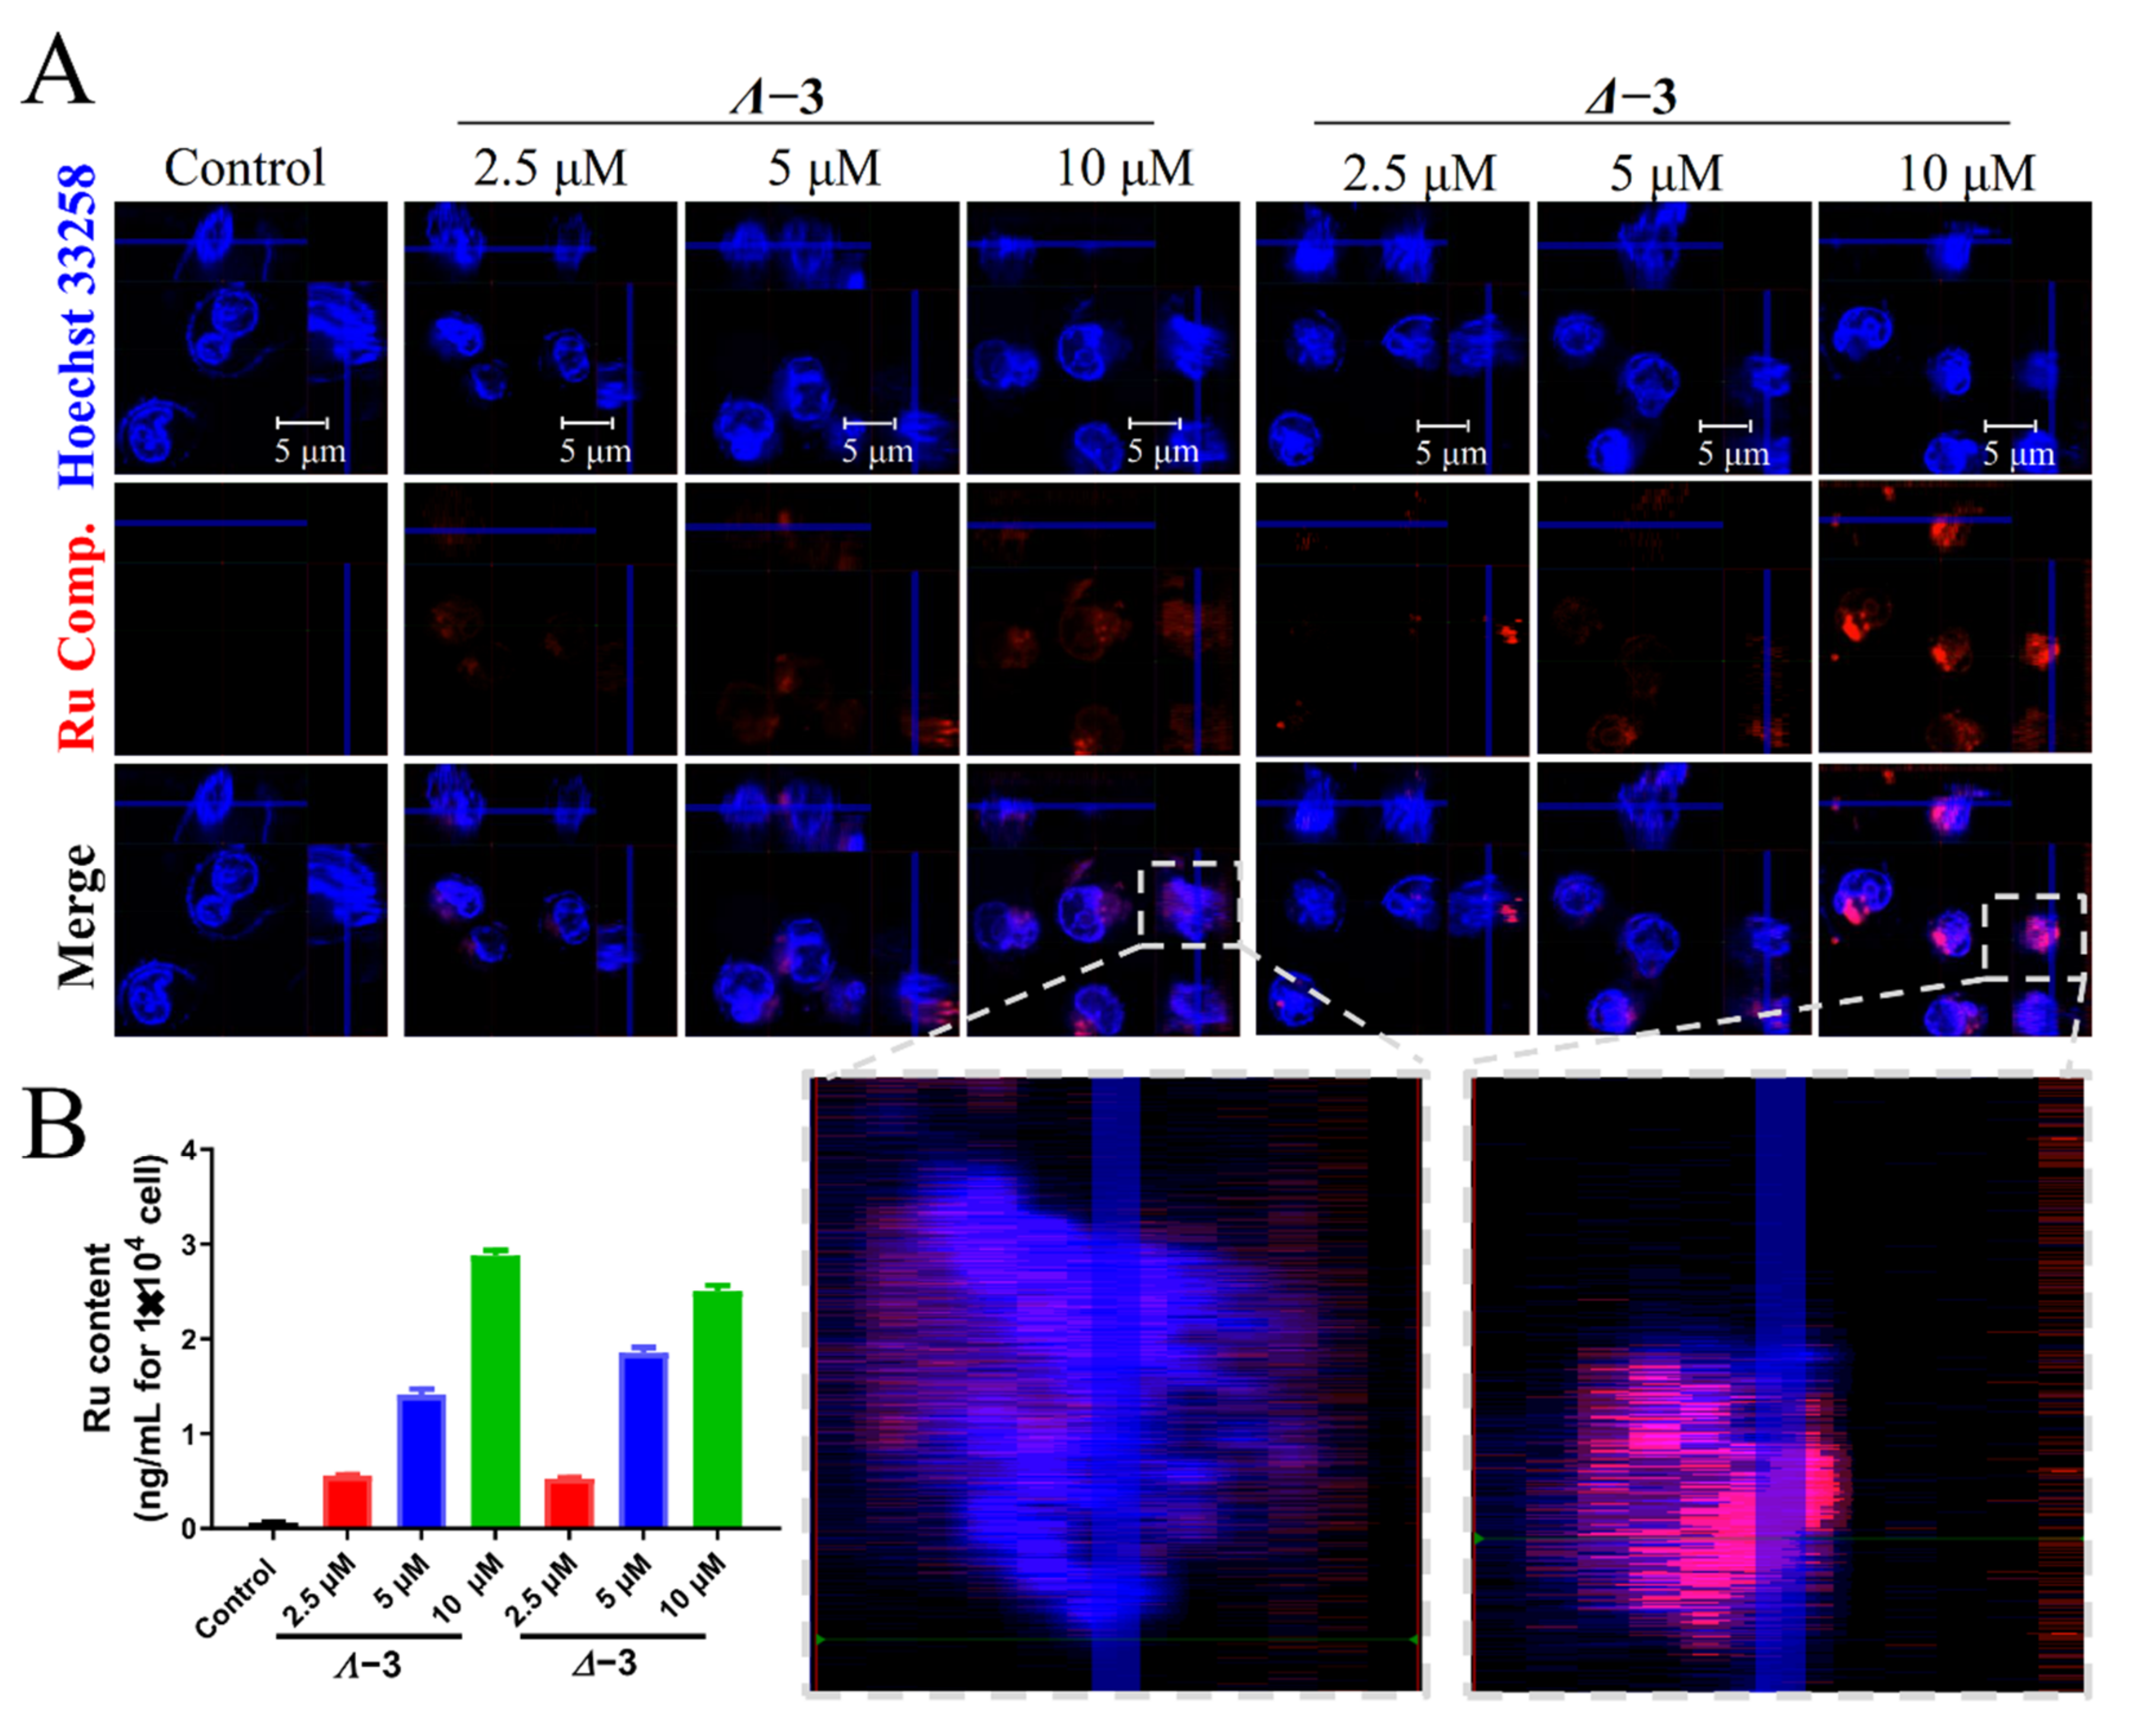
3.4. Cellular Localization
3.5. ICP Detection
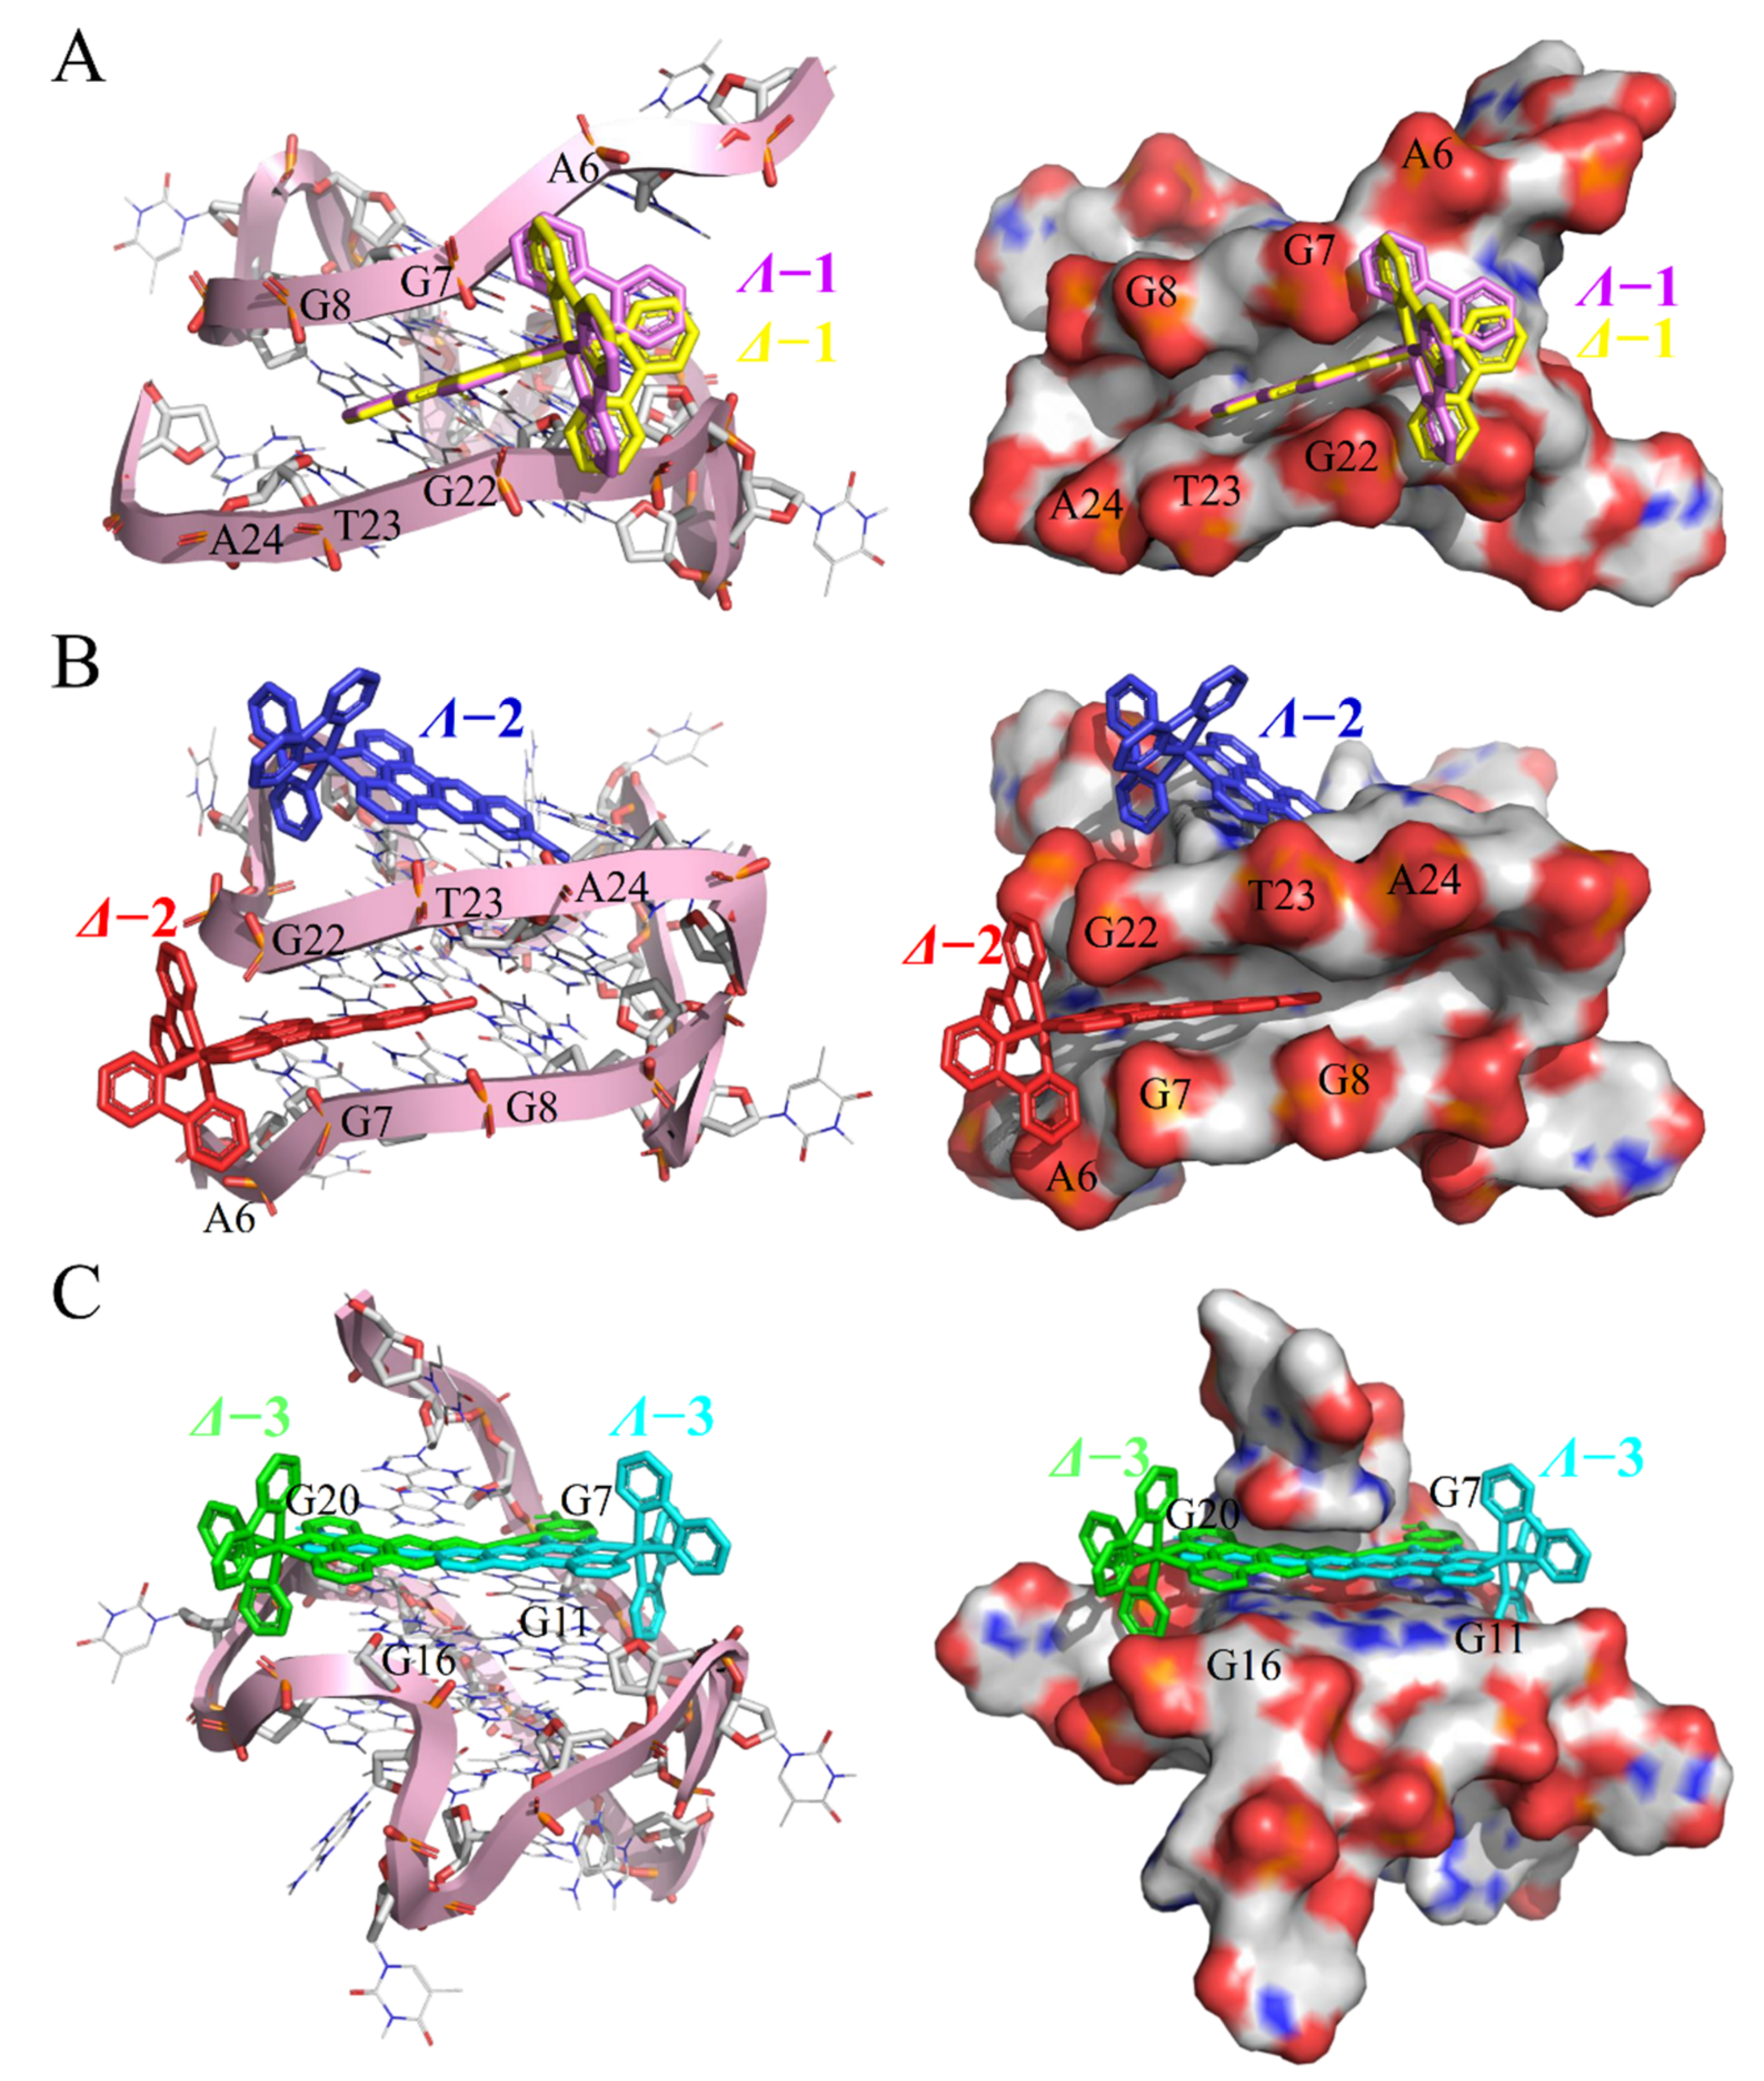
3.6. Molecular Docking
3.7. UV Titration
3.8. FID Assay
3.9. CD Spectrum
3.10. FRET assay
3.11. PCR-Stop Assay
3.12. Wound-Healing Assay
3.13. FITC–Gelatine Assay
3.14. Immunofluorescence
3.15. Flow Cytometry
3.16. Comet Assay
3.17. In Vivo Activity Evaluation using the Zebrafish Xenograft Model
3.18. Tube Formation Assay
4. Conclusions
Supplementary Materials
Author Contributions
Funding
Institutional Review Board Statement
Informed Consent Statement
Data Availability Statement
Conflicts of Interest
References
- Feng, Y.; Spezia, M.; Huang, S.; Yuan, C.; Zeng, Z.; Zhang, L.; Ji, X.; Liu, W.; Huang, B.; Luo, W.; et al. Breast cancer development and progression: Risk factors, cancer stem cells, signaling pathways, genomics, and molecular pathogenesis. Genes Dis. 2018, 5, 77–106. [Google Scholar] [CrossRef]
- Foulkes, W.D.; Smith, I.E.; Reis-Filho, J.S. Triple-Negative Breast Cancer. N. Engl. J. Med. 2010, 363, 1938–1948. [Google Scholar] [CrossRef] [PubMed]
- Wilde, B.R.; Ayer, D.E. Interactions between Myc and MondoA transcription factors in metabolism and tumourigenesis. Br. J. Cancer 2015, 113, 1529–1533. [Google Scholar] [CrossRef] [PubMed]
- Wang, E.; Sorolla, A.; Cunningham, P.T.; Bogdawa, H.M.; Beck, S.; Golden, E.; Dewhurst, R.E.; Florez, L.; Cruickshank, M.N.; Hoffmann, K.; et al. Tumor penetrating peptides inhibiting MYC as a potent targeted therapeutic strategy for triple-negative breast cancers. Oncogene 2019, 38, 140–150. [Google Scholar] [CrossRef]
- Todorović-Raković, N.; Nešković-Konstantinović, Z.; Nikolić-Vukosavljević, D. C-myc as a predictive marker for chemotherapy in metastatic breast cancer. Clin. Exp. Med. 2012, 12, 217–223. [Google Scholar] [CrossRef] [PubMed]
- Yu, C.; Niu, X.; Jin, F.; Liu, Z.; Jin, C.; Lai, L. Structure-based Inhibitor Design for the Intrinsically Disordered Protein c-Myc. Sci. Rep. 2016, 6, 22298. [Google Scholar] [CrossRef]
- Chen, H.; Liu, H.; Qing, G. Targeting oncogenic Myc as a strategy for cancer treatment. Signal Transduct. Target. Ther. 2018, 3, 5. [Google Scholar] [CrossRef]
- Han, H.; Jain, A.D.; Truica, M.I.; Izquierdo-Ferrer, J.; Anker, J.F.; Lysy, B.; Sagar, V.; Luan, Y.; Chalmers, Z.R.; Unno, K.; et al. Small-Molecule MYC Inhibitors Suppress Tumor Growth and Enhance Immunotherapy. Cancer Cell 2019, 36, 483.e415–497.e415. [Google Scholar] [CrossRef]
- Fekete, A.; Kenesi, E.; Hunyadi-Gulyas, E.; Durgo, H.; Berko, B.; Dunai, Z.A.; Bauer, P.I. The guanine-quadruplex structure in the human c-myc gene’s promoter is converted into B-DNA form by the human poly(ADP-ribose)polymerase-1. PLoS ONE 2012, 7, e42690. [Google Scholar] [CrossRef]
- Chauhan, A.; Paladhi, S.; Debnath, M.; Dash, J. Selective recognition of c-MYC G-quadruplex DNA using prolinamide derivatives. Org. Biomol. Chem. 2016, 14, 5761–5767. [Google Scholar] [CrossRef]
- Awadasseid, A.; Ma, X.; Wu, Y.; Zhang, W. G-quadruplex stabilization via small-molecules as a potential anti-cancer strategy. Biomed. Pharmacother. 2021, 139, 111550. [Google Scholar] [CrossRef] [PubMed]
- Han, H.; Langley, D.R.; Rangan, A.; Hurley, L.H. Selective Interactions of Cationic Porphyrins with G-Quadruplex Structures. J. Am. Chem. Soc. 2001, 123, 8902–8913. [Google Scholar] [CrossRef] [PubMed]
- Qin, Y.; Hurley, L.H. Structures, folding patterns, and functions of intramolecular DNA G-quadruplexes found in eukaryotic promoter regions. Biochimie 2008, 90, 1149–1171. [Google Scholar] [CrossRef] [PubMed]
- Liu, H.-Y.; Chen, A.-C.; Yin, Q.-K.; Li, Z.; Huang, S.-M.; Du, G.; He, J.-H.; Zan, L.-P.; Wang, S.-K.; Xu, Y.-H.; et al. New Disubstituted Quindoline Derivatives Inhibiting Burkitt’s Lymphoma Cell Proliferation by Impeding c-MYC Transcription. J. Med. Chem. 2017, 60, 5438–5454. [Google Scholar] [CrossRef]
- Shan, C.; Yan, J.-W.; Wang, Y.-Q.; Che, T.; Huang, Z.-L.; Chen, A.-C.; Yao, P.-F.; Tan, J.-H.; Li, D.; Ou, T.-M.; et al. Design, Synthesis, and Evaluation of Isaindigotone Derivatives To Downregulate c-myc Transcription via Disrupting the Interaction of NM23-H2 with G-Quadruplex. J. Med. Chem. 2017, 60, 1292–1308. [Google Scholar] [CrossRef]
- Hu, M.-H.; Lin, J.-H. New Dibenzoquinoxalines Inhibit Triple-Negative Breast Cancer Growth by Dual Targeting of Topoisomerase 1 and the c-MYC G-Quadruplex. J. Med. Chem. 2021, 64, 6720–6729. [Google Scholar] [CrossRef]
- Xu, L.; Liao, G.-L.; Chen, X.; Zhao, C.-Y.; Chao, H.; Ji, L.-N. Trinuclear Ru(II) polypyridyl complexes as human telomeric quadruplex DNA stabilizers. Inorg. Chem. Commun. 2010, 13, 1050–1053. [Google Scholar] [CrossRef]
- Zheng, C.; Liu, Y.; Liu, Y.; Qin, X.; Zhou, Y.; Liu, J. Dinuclear ruthenium complexes display loop isomer selectivity to c-MYC DNA G-quadriplex and exhibit anti-tumour activity. J. Inorg. Biochem. 2016, 156, 122–132. [Google Scholar] [CrossRef]
- Zhang, Z.; Wu, Q.; Wu, X.-H.; Sun, F.-Y.; Chen, L.-M.; Chen, J.-C.; Yang, S.-L.; Mei, W.-J. Ruthenium(II) complexes as apoptosis inducers by stabilizing c-myc G-quadruplex DNA. Eur. J. Med. Chem. 2014, 80, 316–324. [Google Scholar] [CrossRef]
- McQuaid, K.T.; Takahashi, S.; Baumgaertner, L.; Cardin, D.J.; Paterson, N.G.; Hall, J.P.; Sugimoto, N.; Cardin, C.J. Ruthenium Polypyridyl Complex Bound to a Unimolecular Chair-Form G-Quadruplex. J. Am. Chem. Soc. 2022, 144, 5956–5964. [Google Scholar] [CrossRef]
- Shi, S.; Geng, X.; Zhao, J.; Yao, T.; Wang, C.; Yang, D.; Zheng, L.; Ji, L. Interaction of [Ru(bpy)2(dppz)]2+ with human telomeric DNA: Preferential binding to G-quadruplexes over i-motif. Biochimie 2010, 92, 370–377. [Google Scholar] [CrossRef] [PubMed]
- Li, G.; Sun, L.; Ji, L.; Chao, H. Ruthenium(ii) complexes with dppz: From molecular photoswitch to biological applications. Dalton Trans. 2016, 45, 13261–13276. [Google Scholar] [CrossRef] [PubMed]
- Zhang, S.; Wu, Q.; Zhang, H.; Wang, Q.; Wang, X.; Mei, W.; Wu, X.; Zheng, W. Microwave-assisted synthesis of ruthenium(II) complexes with alkynes as potential inhibitor by selectively recognizing c-myc G-quadruplex DNA. J. Inorg. Biochem. 2017, 176, 113–122. [Google Scholar] [CrossRef] [PubMed]
- Zeng, Z.-P.; Wu, Q.; Sun, F.-Y.; Zheng, K.-D.; Mei, W.-J. Imaging Nuclei of MDA-MB-231 Breast Cancer Cells by Chiral Ruthenium(II) Complex Coordinated by 2-(4-Phenyacetylenephenyl)-1H-imidazo[4,5f][1,10]phenanthroline. Inorg. Chem. 2016, 55, 5710–5718. [Google Scholar] [CrossRef]
- Poynton, F.E.; Hall, J.P.; Keane, P.M.; Schwarz, C.; Sazanovich, I.V.; Towrie, M.; Gunnlaugsson, T.; Cardin, C.J.; Cardin, D.J.; Quinn, S.J.; et al. Direct observation by time-resolved infrared spectroscopy of the bright and the dark excited states of the [Ru(phen)2(dppz)]2+ light-switch compound in solution and when bound to DNA. Chem. Sci. 2016, 7, 3075–3084. [Google Scholar] [CrossRef]
- Zhu, B.-Z.; Chao, X.-J.; Huang, C.-H.; Li, Y. Delivering the cell-impermeable DNA ‘light-switching’ Ru(ii) complexes preferentially into live-cell nucleus via an unprecedented ion-pairing method. Chem. Sci. 2016, 7, 4016–4023. [Google Scholar] [CrossRef]
- Amezaga, N.J.M.; Pamies, S.C.; Peruchena, N.M.; Sosa, G.L. Halogen Bonding: A Study based on the Electronic Charge Density. J. Phys. Chem. A 2010, 114, 552–562. [Google Scholar] [CrossRef]
- Wang, C.; Abbas, M.; Wantz, G.; Kawabata, K.; Takimiya, K. “Heavy-atom effects” in the parent [1]benzochalcogenopheno[3,2-b][1]benzochalcogenophene system. J. Mater. Chem. C 2020, 8, 15119–15127. [Google Scholar] [CrossRef]
- Komor, A.C.; Barton, J.K. The path for metal complexes to a DNA target. Chem. Commun. 2013, 49, 3617–3630. [Google Scholar] [CrossRef]
- Gong, J.Y.; Wen, C.J.; Tang, M.L.; Duan, R.F.; Chen, J.N.; Zhang, J.Y.; Zheng, K.W.; He, Y.D.; Hao, Y.H.; Yu, Q.; et al. G-quadruplex structural variations in human genome associated with single-nucleotide variations and their impact on gene activity. Proc. Natl. Acad. Sci. USA 2021, 118, e2013230118. [Google Scholar] [CrossRef]
- Horiuchi, D.; Kusdra, L.; Huskey, N.E.; Chandriani, S.; Lenburg, M.E.; Gonzalez-Angulo, A.M.; Creasman, K.J.; Bazarov, A.V.; Smyth, J.W.; Davis, S.E.; et al. MYC pathway activation in triple-negative breast cancer is synthetic lethal with CDK inhibition. J. Exp. Med. 2012, 209, 679–696. [Google Scholar] [CrossRef] [PubMed]
- Svensson, F.R.; Abrahamsson, M.; Strömberg, N.; Ewing, A.G.; Lincoln, P. Ruthenium(II) Complex Enantiomers as Cellular Probes for Diastereomeric Interactions in Confocal and Fluorescence Lifetime Imaging Microscopy. J Phys Chem Lett 2011, 2, 397–401. [Google Scholar] [CrossRef] [PubMed]
- Guo, R.-J.; Yan, J.-W.; Chen, S.-B.; Gu, L.-Q.; Huang, Z.-S.; Tan, J.-H. A simple structural modification to thiazole orange to improve the selective detection of G-quadruplexes. Dye. Pigment. 2016, 126, 76–85. [Google Scholar] [CrossRef]
- Swiatkowska, A.; Kosman, J.; Juskowiak, B. FRET study of G-quadruplex forming fluorescent oligonucleotide probes at the lipid monolayer interface. Spectrochim. Acta. Part A Mol. Biomol. Spectrosc. 2016, 152, 614–621. [Google Scholar] [CrossRef] [PubMed]
- Han, H.; Hurley, L.H.; Salazar, M. A DNA polymerase stop assay for G-quadruplex-interactive compounds. Nucleic Acids Res. 1999, 27, 537–542. [Google Scholar] [CrossRef] [PubMed]
- Al-Mahmood, S.; Sapiezynski, J.; Garbuzenko, O.B.; Minko, T. Metastatic and triple-negative breast cancer: Challenges and treatment options. Drug Deliv. Transl. Res. 2018, 8, 1483–1507. [Google Scholar] [CrossRef] [PubMed]
- Wang, X.; Khalil, R.A. Chapter Eight—Matrix Metalloproteinases, Vascular Remodeling, and Vascular Disease. In Advances in Pharmacology; Khalil, R.A., Ed.; Academic Press: Cambridge, MA, USA, 2018; Volume 81, pp. 241–330. [Google Scholar]
- Paz, H.; Pathak, N.; Yang, J. Invading one step at a time: The role of invadopodia in tumor metastasis. Oncogene 2014, 33, 4193–4202. [Google Scholar] [CrossRef]
- Wu, Q.; Zheng, K.; Huang, X.; Li, L.; Mei, W. Tanshinone-IIA-Based Analogues of Imidazole Alkaloid Act as Potent Inhibitors To Block Breast Cancer Invasion and Metastasis in Vivo. J. Med. Chem. 2018, 61, 10488–10501. [Google Scholar] [CrossRef]
- Weis, S.M.; Cheresh, D.A. Tumor angiogenesis: Molecular pathways and therapeutic targets. Nat. Med. 2011, 17, 1359–1370. [Google Scholar] [CrossRef]
- Zhao, X.; Li, L.; Yu, G.; Zhang, S.; Li, Y.; Wu, Q.; Huang, X.; Mei, W. Nucleus-enriched Ruthenium Polypyridine Complex Acts as a Potent Inhibitor to Suppress Triple-negative Breast Cancer Metastasis In vivo. Comput. Struct. Biotechnol. J. 2019, 17, 21–30. [Google Scholar] [CrossRef]
- Long, W.; Zheng, B.-X.; Li, Y.; Huang, X.-H.; Lin, D.-M.; Chen, C.-C.; Hou, J.-Q.; Ou, T.-M.; Wong, W.-L.; Zhang, K.; et al. Rational design of small-molecules to recognize G-quadruplexes of c-MYC promoter and telomere and the evaluation of their in vivo antitumor activity against breast cancer. Nucleic Acids Res. 2022, 50, 1829–1848. [Google Scholar] [CrossRef] [PubMed]
- Verma, S.; Ghuge, S.A.; Ravichandiran, V.; Ranjan, N. Spectroscopic studies of Thioflavin-T binding to c-Myc G-quadruplex DNA. Spectrochim. Acta Part A Mol. Biomol. Spectrosc. 2019, 212, 388–395. [Google Scholar] [CrossRef] [PubMed]
- Nandhakumar, S.; Parasuraman, S.; Shanmugam, M.M.; Rao, K.R.; Chand, P.; Bhat, B.V. Evaluation of DNA damage using single-cell gel electrophoresis (Comet Assay). J. Pharmacol. Pharmacother. 2011, 2, 107–111. [Google Scholar] [CrossRef] [PubMed]


| Comp. | Inhibitory Effect (IC50/μM) | Selectivity Index * | |||||
|---|---|---|---|---|---|---|---|
| MDA-MB-231 | MCF-7 | HepG2 | A549 | CNE-1 | HaCaT | ||
| Λ−1 | 60.81 ± 7.41 | >100 | >100 | >100 | >100 | >100 | / |
| Δ−1 | >100 | >100 | >100 | >100 | >100 | >100 | / |
| Λ−2 | 92.06 ± 12.09 | >100 | >100 | 91.47 ± 10.81 | >100 | >100 | / |
| Δ−2 | 94.50 ± 9.10 | >100 | >100 | 89.87 ± 11.35 | >100 | >100 | / |
| Λ−3 | 53.5 ± 1.7 | 146.9 ± 2.7 | 74.8 ± 2.4 | 55.4 ± 2.4 | >100 | >100 | / |
| Δ−3 | 25.51 ± 1.42 | 90.64 ± 6.34 | 37.78 ± 0.6 | 24.66 ± 0.28 | 40.94 ± 0.53 | 70.95 ± 6.81 | 2.78 |
| Cis-platin | 25.9 ± 1.9 | 14.27 ± 0.07 | 12.68 ± 0.7 | 9.90 ± 0.25 | / | 7.1 ± 0.5 | 0.27 |
Disclaimer/Publisher’s Note: The statements, opinions and data contained in all publications are solely those of the individual author(s) and contributor(s) and not of MDPI and/or the editor(s). MDPI and/or the editor(s) disclaim responsibility for any injury to people or property resulting from any ideas, methods, instructions or products referred to in the content. |
© 2022 by the authors. Licensee MDPI, Basel, Switzerland. This article is an open access article distributed under the terms and conditions of the Creative Commons Attribution (CC BY) license (https://creativecommons.org/licenses/by/4.0/).
Share and Cite
Yuan, C.; Wang, Z.; Wang, Z.; Liu, W.; Li, G.; Meng, J.; Wu, R.; Wu, Q.; Wang, J.; Mei, W. Novel Chiral Ru(II) Complexes as Potential c-myc G-quadruplex DNA Stabilizers Inducing DNA Damage to Suppress Triple-Negative Breast Cancer Progression. Int. J. Mol. Sci. 2023, 24, 203. https://doi.org/10.3390/ijms24010203
Yuan C, Wang Z, Wang Z, Liu W, Li G, Meng J, Wu R, Wu Q, Wang J, Mei W. Novel Chiral Ru(II) Complexes as Potential c-myc G-quadruplex DNA Stabilizers Inducing DNA Damage to Suppress Triple-Negative Breast Cancer Progression. International Journal of Molecular Sciences. 2023; 24(1):203. https://doi.org/10.3390/ijms24010203
Chicago/Turabian StyleYuan, Chanling, Zhixiang Wang, Zongtao Wang, Wentao Liu, Guohu Li, Jinlan Meng, Ruzhen Wu, Qiong Wu, Jiacheng Wang, and Wenjie Mei. 2023. "Novel Chiral Ru(II) Complexes as Potential c-myc G-quadruplex DNA Stabilizers Inducing DNA Damage to Suppress Triple-Negative Breast Cancer Progression" International Journal of Molecular Sciences 24, no. 1: 203. https://doi.org/10.3390/ijms24010203
APA StyleYuan, C., Wang, Z., Wang, Z., Liu, W., Li, G., Meng, J., Wu, R., Wu, Q., Wang, J., & Mei, W. (2023). Novel Chiral Ru(II) Complexes as Potential c-myc G-quadruplex DNA Stabilizers Inducing DNA Damage to Suppress Triple-Negative Breast Cancer Progression. International Journal of Molecular Sciences, 24(1), 203. https://doi.org/10.3390/ijms24010203