Article

Kinetic Modeling of Time-Dependent Enzyme Inhibition by Pre-Steady-State Analysis of Progress Curves: The Case Study of the Anti-Alzheimer’s Drug Galantamine

by
Doriano Lamba
1,2 and
Alessandro Pesaresi
1,*
1
Istituto di Cristallografia, Consiglio Nazionale delle Ricerche, Area Science Park, I-34149 Trieste, Italy
2
Consorzio Interuniversitario, Istituto Nazionale Biostrutture e Biosistemi, I-00136 Rome, Italy
*
Author to whom correspondence should be addressed.
Int. J. Mol. Sci. 2022, 23(9), 5072; https://doi.org/10.3390/ijms23095072
Submission received: 14 April 2022 / Revised: 29 April 2022 / Accepted: 30 April 2022 / Published: 3 May 2022
(This article belongs to the Section Biochemistry)

Abstract

:
The Michaelis–Menten model of enzyme kinetic assumes the free ligand approximation, the steady-state approximation and the rapid equilibrium approximation. Analytical methods to model slow-binding inhibitors by the analysis of initial velocities have been developed but, due to their inherent complexity, they are seldom employed. In order to circumvent the complications that arise from the violation of the rapid equilibrium assumption, inhibition is commonly evaluated by pre-incubating the enzyme and the inhibitors so that, even for slow inhibitors, the binding equilibrium is established before the reaction is started. Here, we show that for long drug-target residence time inhibitors, the conventional analysis of initial velocities by the linear regression of double-reciprocal plots fails to provide a correct description of the inhibition mechanism. As a case study, the inhibition of acetylcholinesterase by galantamine, a drug approved for the symptomatic treatment of Alzheimer’s disease, is reported. For over 50 years, analysis based on the conventional steady-state model has overlooked the time-dependent nature of galantamine inhibition, leading to an erroneous assessment of the drug potency and, hence, to discrepancies between biochemical data and the pharmacological evidence. Re-examination of acetylcholinesterase inhibition by pre-steady state analysis of the reaction progress curves showed that the potency of galantamine has indeed been underestimated by a factor of ~100.

Graphical Abstract

1. Introduction

The study of enzyme inhibition is an essential aspect of biochemistry with implications in many fields of life sciences, including mechanistic enzymology, drug design, pharmacology and the study of metabolism regulation [1]. In particular, the correct assessment of the inhibition constant (Ki) and of the type of inhibition caused by a drug (Figure 1) are important pieces of information required to translate biochemical data into pharmacodynamics models [2,3,4]. Half-maximal inhibitory concentration (IC50), for example, is notoriously a very poor predictor of the pharmacodynamics properties of a drug [5]. It does not account for the inhibition mechanism nor for the inhibitors’ residence time, defined as the reciprocal of the dissociation constant rate (1/koff), which recently has emerged as a critical feature of effective drugs [6,7]. The Ki determination through a proper steady-state kinetic analysis, on the contrary, can provide a reliable depiction of the inhibition mechanism and of the kinetic parameters, although at the cost of a more time consuming and labor-intensive experimentation. Some circumstances, however, can turn the determination of an inhibitor’s Ki into a rather problematic task. From this perspective, here is presented the case of acetylcholinesterase inhibition by galantamine.
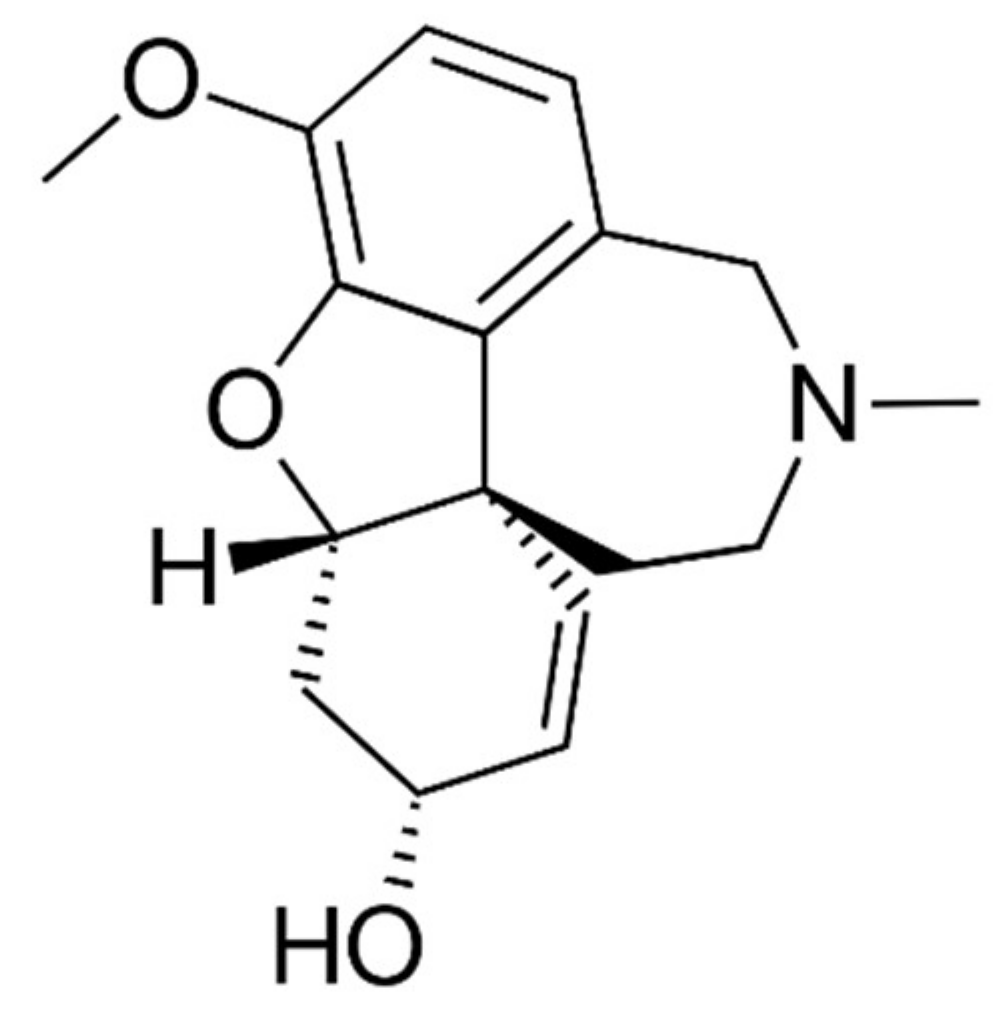
Acetylcholinesterase (AChE, EC. 3.1.1.7) catalyzes the fast hydrolysis of the neurotransmitter acetylcholine, playing a crucial role in the regulation of the synaptic cholinergic signal transmission. The alteration of cholinergic systems is involved in many neurodegenerative disorders, including Alzheimer’s disease [8], hence a huge effort has been devoted over the decades to discovering and developing AChE inhibitors that can contrast cognitive impairment. Rivastigmine, donepezil and galantamine (GAL, Figure 2) are the three AChE inhibitors currently marketed as anti-Alzheimer drugs. GAL is an alkaloid originally isolated from the plant Galanthus nivalis, whose anti-cholinesterase activity was first discovered in the 1950s [9] and it was approved for the treatment of mild-to-moderate Alzheimer’s symptoms in 2001 [10]. It is also an allosteric modulator of nicotinic cholinergic receptor potentiating cholinergic neurotransmission [10]. In the incessant search for more effective anti-Alzheimer’s treatments, the development of new GAL derivatives continues to be an active field of investigation [11,12,13].
The evidence gathered along with more than 50 years of biochemical research suggested that GAL is a moderate AChE inhibitor, being 50 to 500 times less potent than donepezil [14], whose Ki is in the low nM range [15,16]. Despite its pharmacological relevance, however, published data on the inhibition of AChE by GAL are surprisingly inconsistent. The 15 entries present in the BRENDA database [17] for example report IC50 values spanning almost 3 orders of magnitude, from 0.25 µM [18] to 100 µM [19]. While there are plenty of studies reporting in vitro or ex vivo IC50 determination, thorough steady-state kinetic analysis are rather scarce. To the best of the author’s knowledge, there are only two papers on the inhibition of the human brain AChE (HuAChE). The first, dating to 1976, was originally written in German and reported a competitive inhibition with Ki of 52 nM [20]. The second, made using a recombinant form of HuAChE, was published in 2003 and reported a ten-fold higher Ki of 0.52 µm [21]. Studies on the brain enzyme of mouse and rats confirmed the competitive nature of AChE inhibition by GAL and evaluated the Ki to be of 0.86 µM and 0.16 µM, respectively [22,23]. In contrast, the inhibition of AChE from Torpedo californica (TcAChE), an important enzyme because it was the first, and for a long time the only one to have been crystallized [24], was reported to be of the mixed-type with a Ki of 0.2 µM [25]. Furthermore, a comparative in vivo study on rats, mice and rabbits suggested that GAL is an AChE inhibitor that is only 3–15 times weaker than donepezil [26], adding further confusion to the picture.
Because AChEs are highly conserved enzymes [27], their diversity alone can hardly account for the observed inconsistency. The likely explanation instead lays in the time-dependent nature of the inhibition exerted by GAL. As it is shown hereinafter, both the binding and the unbinding of GAL to the AChE active site are slow; a combination which seems to have tricked the unaware experimenters, preventing the correct assessment of the steady-state inhibition parameters and causing a gross overestimation of both Kis and IC50s.
The conventional steady-state analysis of enzyme kinetic in fact relies on two main assumptions, that substrate and inhibitor are in concentrations much larger than the enzyme, and that the establishment of thermodynamic equilibrium between all the reactants occurs rapidly on the steady-state time scale. For certain inhibitors, however, one or both of these two conditions might not apply and consequently the conventional steady-state treatment results inadequate. This occurs, for example, in the case of tight-binding inhibitors, which due to Ki values of 10 nM or smaller, are likely to be less than the concentration of the enzyme, and for slow-binding inhibitors. Slow enzyme-inhibitor (E-I) association rates can arise in different ways [28,29]. If a simple one-step interaction is assumed, slow association can be the consequence of a slow binding mechanism (small kon). Large kon can also result in a slow association in the case of strong inhibitors, because of their very low concentration in the assay. In some cases, the E-I interaction is better described as a two-step process, with the rapid formation of an initial collision complex followed by a slow isomerization leading to a tight EI complex [30].
The typical reaction progress curves of slow-binding inhibitors show an initial burst followed, once that the EI complex has formed, by the fall off of the turnover rate to the steady-state inhibited rate. This implies that the initial velocities are a large overestimation of the actual steady-state rates. The proper study of slow inhibition requires the determination of three parameters, i.e., the initial burst rate, the final inhibited steady-state turnover rate and a term that accounts for the rate of onset of inhibition [28,31,32]. The procedure, however, entails non-trivial data acquisition and data analysis problems. For instance, due to the depletion of the substrate occurring along with the reaction, the detection of the steady-state rates after tens of seconds or even minutes after the beginning of the reactions, especially for data at low substrate concentrations, can be challenging or impossible.
On the other hand, if the slow onset of inhibition is overlooked and kinetic data are forced into the simpler conventional model, slopes and intercepts of the resulting plots do not behave in the expected ways and the analysis is very likely to give misleading results [31,33,34].
To avoid the troubles arising with slow-binders it is a common practice to pre-incubate enzyme and inhibitor so that the equilibrium is established before the reaction is started [35]. This, however, exposes the experimenter to the risk that, for substrate-initiated reactions, the initial velocities largely depend on the rate of dissociation of the E-I complex [31]. Indeed, although the term “time dependent inhibition” generally is intended only as a synonym of slow-onset inhibition, for reactions started after an extensive E-I pre-incubation, slow dissociating inhibitors represent a further deviation from the steady-state assumptions whose study demands an equally complex analysis as in the case of slow inhibition [28,31] and whose implications surprisingly have not been thoroughly addressed.
A much more convenient and accurate way to study time-dependent inhibition is to drop the classic steady-state analysis based on the initial velocities in favor of the global fitting of the reaction progress curves [36]. This method, by being not based on any of the steady-state simplifying assumptions, allows us to draw information from the pre-steady-state phase of the reactions and to directly determine, beside the Ki, the on and off microscopic rates for the EI complex formation [32].
The main focus of this paper is about the effects of slow inhibitor binding/unbinding on the conventional steady-state analysis of initial velocity data. Using a computational and theoretical approach we first show how, in the case of E-I pre-incubation, slow dissociation rates unavoidably cause competitive inhibition to seemingly look like mixed-type or noncompetitive. We than re-examine the inhibition of TcAChE by GAL. The analysis of initial velocities showed the time-dependent nature of the inhibition providing a rationale that explains why the assessment of GAL potency has proven to be so problematic. Next, the global fitting of the reaction full time courses was performed with a two-fold intention. The first aim was to determine the actual GAL potency, which turned out to be at least 100-fold higher than what is generally believed. The second aim was to display the effectiveness and ease of use of this new method for the study of enzyme kinetics and inhibition. We provide a deep analysis of the molecular mechanisms leading to the slow AChE inhibition by GAL. Furthermore, we highlight the substantial contribution that the use of software for the direct simulation of enzyme kinetic can give to the advancement of biochemical and pharmacological research.

2. Results

2.1. Simulation of Enzyme Inhibition by Slow-Dissociating Inhibitors

To evaluate the impact of an inhibitor’s residence time on the assessment of the steady-state inhibition parameters, synthetic kinetic data were generated using the software KinTek Explorer [37]. Figure 3 shows the simulations of the activity of a hypothetical enzyme with a Km of 10 µM and a kcat of 1000 s−1 inhibited by three competitive inhibitors with an identical Ki of 1 µM but with different dissociation rates. In order to simulate real experiments with the reactions started with the substrate, an extensive enzyme-inhibitor incubation time of 106 s was allowed, and the reaction courses were lagged by 10 s to account for the dead time between the reaction start and the beginning of detection. In panels A–B are the curves and the relative data analysis for the fast unbinder (koff = 102 s−1), in C–D those of an inhibitor with intermediate dissociation rate (koff = 3 × 10⁻² s−1) and in E–F those of the slow unbinder (koff = 10−4 s−1). It is at first glance evident from the plot of initial velocities versus [S] (Figure 3A,C,E) how, despite the identical potency and mechanism of inhibition, inhibitors behave differently. Lineweaver–Burk plots confirm the differences, showing that for the fast unbinder the inhibition, as expected, is competitive (lines intersecting on the 1/V axis, Figure 3B), while the slow unbinder gives an inhibition that seems purely noncompetitive (line intersecting on the 1/[S] axis, Figure 3F). In general, for mixed-type inhibition, the lines of a double-reciprocal plot would be expected to intersect in a point at positive 1/V and at negative 1/[S] values. As shown in Figure 3D, however, the intermediate inhibitor data at low inhibitor concentrations are not consistent with those at higher concentrations. This results in an unexpected and characteristic plot, with intersections between lines that shift towards the 1/V axis as the [I] increases. However, if the competitive and uncompetitive contributions are uncoupled by analyzing data with the Dixon and Cornish–Bowden plot (see supporting information), for inhibitors with intermediate koff, the inhibition results are of the mixed type. Figure 3G shows how the apparent competitive (Kic) and uncompetitive (Kiu) inhibition constants are affected by the dissociation constant rates. For fast dissociating inhibitors (koff > 3 × 10⁻² s−1), the inhibition is competitive (Kiu >> Kic).
A gradual transition from competitive to noncompetitive occurs within koff values in the 3 × 10⁻²–3 × 10⁻⁴ s−1 range, where the inhibition appears to be mixed-type and Kiu decreases with the inhibitor residence time. Then it turns purely noncompetitive, with Kic = Kiu, for koff smaller than 3 × 10⁻⁴ s−1. The explanation of this apparent paradox is indeed trivial. When to start the reaction the substrate is added to the pre-incubated enzyme-inhibitor mixture, its binding causes a shift in the EI equilibrium according to the mass–action principle. For example, if the enzyme is incubated with an inhibitor concentration equal to Ki, by definition at the equilibrium half of the total enzyme (e0) will be in the EI form, hence [EI] = [E] = 0.5 e0. If the reaction is started by adding the substrate in concentration equal to Km, a new equilibrium will be attained such that [EI] = [E] = [ES] = 0.33 e0. Hence, upon the reaction start, a partial dissociation of the EI complex takes place, which causes a corresponding apparent enzyme activation. In the presence of a competitive inhibitor the steady-state initial rate (vss) is given by:
v s s = V m a x S S + K m 1 + I K i .
If the enzyme is pre-incubated with the inhibitor, at time t0 when the S is added to start the reaction, the portion of E available to interact with S is a fraction of the total enzyme equal to:
1 1 + I K i ;
Hence, if the EI dissociation is slow, the actual initial limiting velocity (Vimax) is:
V i m a x = V m a x 1 1 + 1 K i ,
and by assuming an instantaneous E-S equilibrium, the measured initial velocity (Vmeas) is:
v m e a s = V m a x 1 1 + I K i S S + K m ,
which corresponds to the equation for the pure non-competitive inhibition (Kiu = Kic). For moderately slow EI dissociation rates, the measured initial velocities will be intermediate between vss and vmeas, leading to an apparent mixed-type inhibition (Kic < Kiu < ~20 Kic).
Because the monitoring of the reaction has a dead time that generally is not less than ~10 s (unless a stopped flow apparatus is used), for fast dissociating inhibitors (i.e., koff larger than 1 s−1), the dissociation is not detected and it does not affect the measure of the initial velocities. On the contrary, if the dissociation occurs on a time scale similar to or larger than the typical dead time of the technique employed to monitor the reaction progress, it will be detected as an apparent enzyme activation. In this case, the recorded initial velocities underestimate the steady-state rates and the progress curves display an upward curvature resulting from the combination of EI dissociation and of substrate depletion.
This mechanism can be best visualized by the time course of the [ES] as a function or substrate concentrations (Figure 3H). Because the reaction rate is given by [ES] kcat, changes over time of [ES] are directly reflected in the slope of the progress curves. Moreover, because the mass–action effect is larger at high S and/or I concentration, data at low [I] and [S] are not consistent with those at a higher concentration. Hence, for koff resulting in the mixed inhibition range, the plots are difficult to interpret, the inhibition mechanism is very likely to be mistaken and, in general, the outcome of data analysis is dependent on how the experiment is carried out (reagents concentration used, dead time, time of curve integration). The time required for the recovery of the full enzyme activity is dependent only on koff and it can easily be calculated that the dissociation of ~95% of the bound inhibitor requires 3.5 times the residence time. Hence, once the reaction is started, a hypothetical inhibitor with koff of 10−2 s−1 would cause a slow reactivation that is completed in ~6 min (Figure 3H). For a proper characterization of the inhibition mechanism, steady-state turnover rates should be recorded after 6 min from the reaction start and after ~1 h for an inhibitor with koff of 10−3 s−1. However, even in that case, the detection of the actual steady-state initial velocities would remain impossible due to the concomitant substrate depletion, making the proper steady-state treatment of these kinetic data highly problematic.

2.2. Steady-State Analysis of AChE Inhibition by GAL

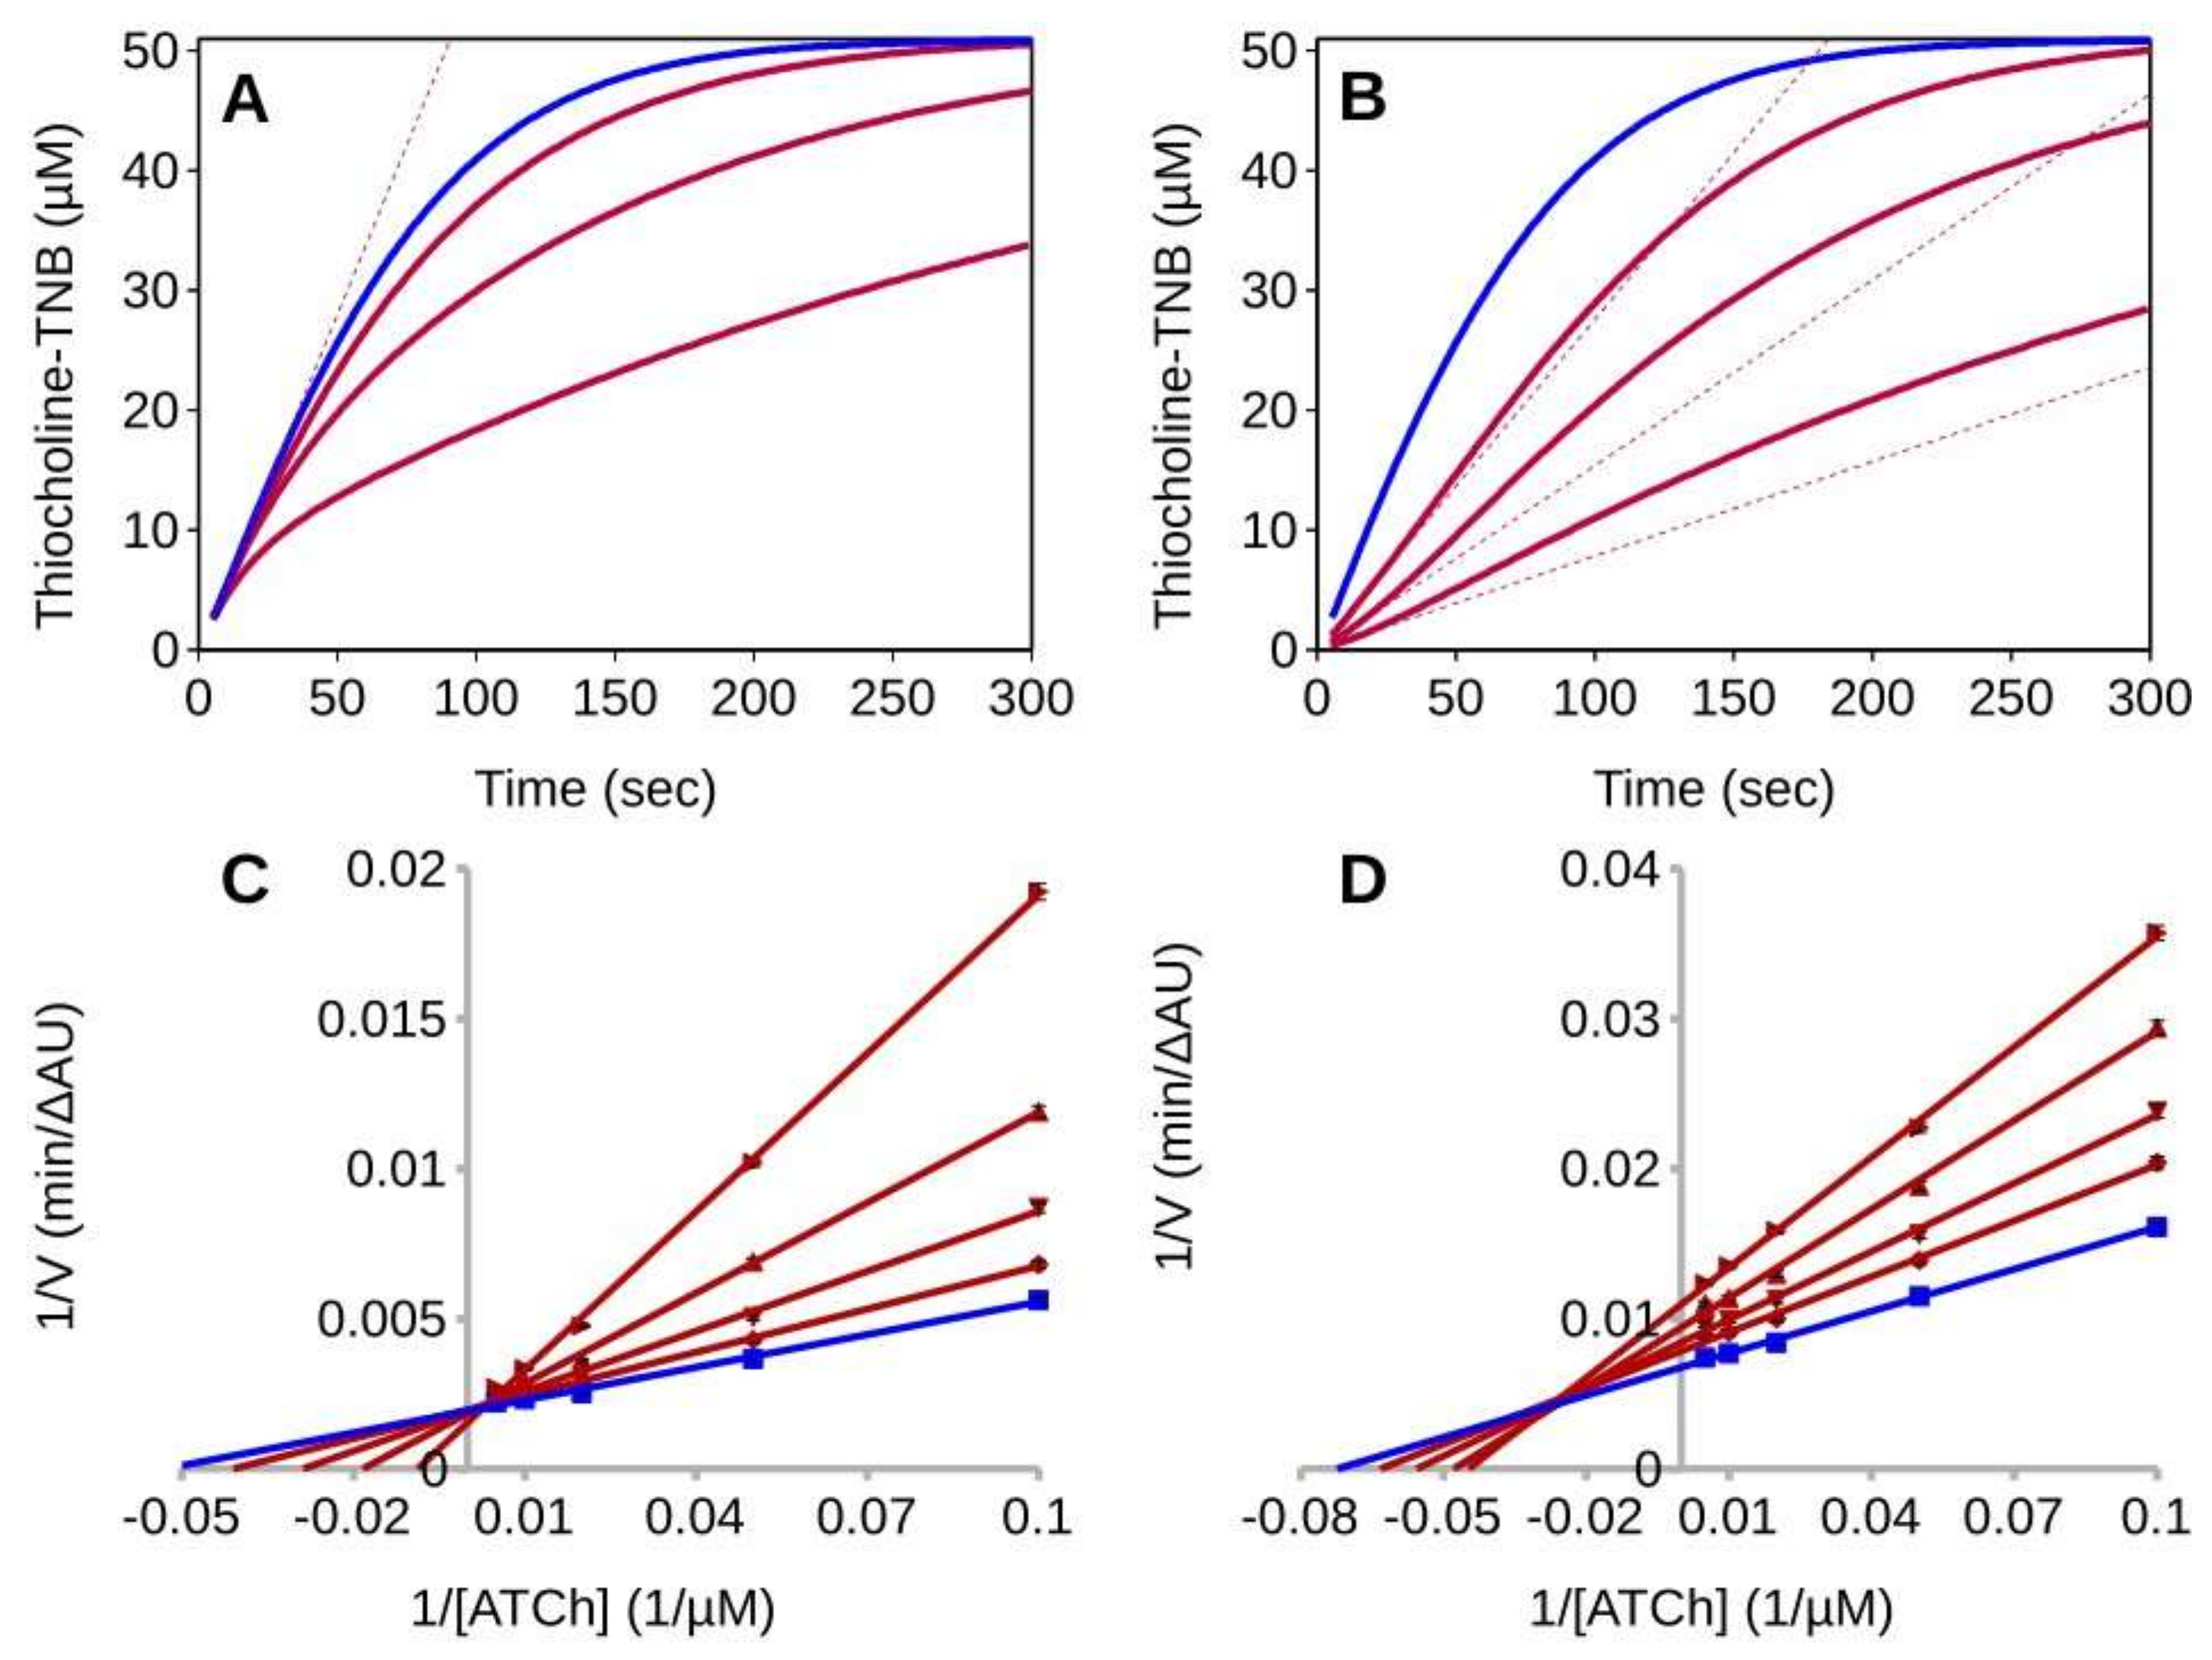
Figure 4 reports the progress curves for the hydrolysis of acetylthiocholine (ATCh) catalyzed by the TcAChE in the absence or presence of GAL. If the reactions are started adding the enzyme as the last reagent, initial velocities are substantially independent from the inhibitor concentration (Figure 4A), which is diagnostic for slow-inhibition. As expected for a second order reaction, the rate of the EI formation is proportional to the GAL concentration and the onset of the inhibited steady-state rates is delayed accordingly. Conversely, if the reactions are started with the substrate after an E-I pre-incubation of 20 min, the progress curves show an upward curvature which is diagnostic for the slow inhibitor dissociation (Figure 4B). In this case the initial velocities are an underestimation of the actual steady-state rates.
Despite the non-compliance with the steady-state requirements these initial velocities are analyzed according to the Michaelis–Menten model. Depending on how the reactions are initiated, the result is either a large overestimation of the Ki or the emergence of an apparent uncompetitive inhibition component. For enzyme-initiated reactions, the Lineweaver–Burk plot is consistent with competitive inhibition and with a Ki of 122.8 ± 20.7 nM (Figure 4C), while for the reactions initiated by adding the substrate as the last reagent, the inhibition seems to be of the mixed-type with Kic of 18.0 ± 1.5 nM and Kiu of 52.7 ± 2.7 nM (Figure 4D). It is worth noting that, while for the substrate-initiated reactions the initial velocities fit the mixed-type inhibition model, for the reaction started with the enzyme the fit is rather inaccurate. Lines do not intersect on the 1/V axis, as expected for competitive inhibition, but at positive 1/[S] value (Figure 4C). The reason is that the actual initial velocities, i.e., the velocities extrapolated at time t0, would fit the non-competitive model if the reactions are started with substrate (see previous chapter), but in the case of the enzyme-initiated reactions their analysis would fail to detect any inhibition. Hence, in the latter case, the extent of the observed inhibition is largely dependent on the way the experiment is being carried out. Particularly relevant are the reagent concentrations and the portion of the progress curves that are integrated to detect the initial velocities. The faster the detection, the weaker the resulting apparent inhibition will be.

2.3. Pre-Steady-State Analysis of AChE Inhibition by Fitting of the Full Progress Curves

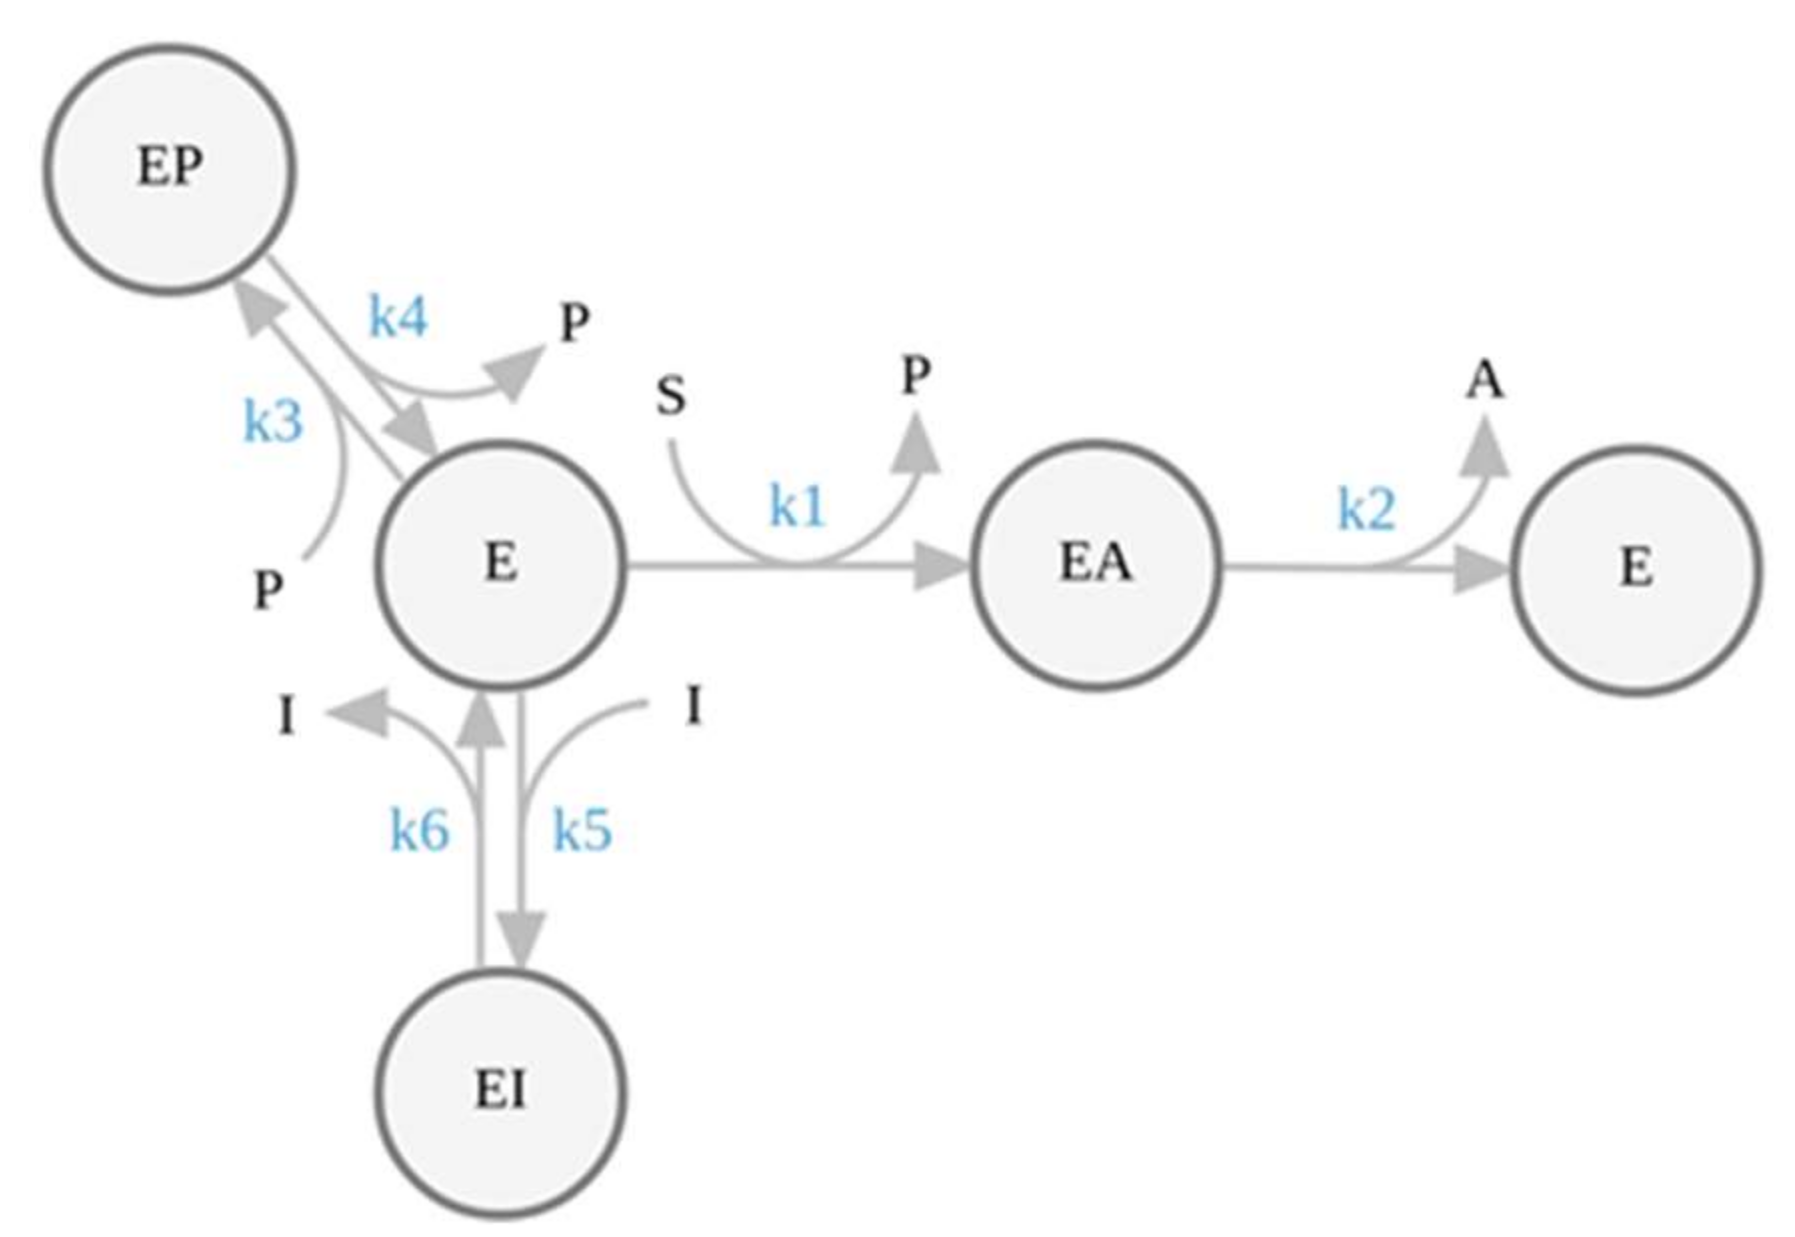
The study of enzyme kinetics by simulations generated by numerical integration is a not-so-new method [38] that in the last ten years has been made accessible to the general biochemist thanks to the development of a new generation of software [37,39]. The analysis of the progress curves of TcAChE inhibited by GAL was performed using the ENZO web application, implemented at www.enzo.cmm.ki.si [39], (accessed on 1 December 2021). This program is designed to generate differential equations from drawn reaction schemes and to subsequently fit the coefficients of these equations by a least-squares method, to reproduce the experimental data using a numerical integration algorithm. There is not yet a univocal definition of this method, and terms such as “global fitting of progress curves”, “numerical integration of progress curves” or “kinetic analysis by direct simulation” should be considered as synonyms, as each one depicts a different aspect of the analytical process. The study of inhibition is a two-step process. The catalytic properties of the enzyme have to be resolved before the study of the inhibited curves can be performed. In principle, if there is no product inhibition, direct simulation by data-fitting of full reaction time courses allows the determination of the Michaelian parameters from a single progress curve [36,40]. In the case of the ATCh hydrolysis by AChE, however, the final product evolved in the presence of the Ellman’s reagent, i.e., thiocholine-thionitrobenzoic acid (thiocholin-TNB), is a relatively potent competitive inhibitor of the enzyme [41]. Hence, to simultaneously determine the kinetic mechanism and product inhibition, the van Slyke–Cullen single-intermediate reaction scheme [42] (Figure 5, Video S1) for substrate hydrolysis by TcAChE was combined with a competitive inhibition step to account for product inhibition. Then, a further competitive inhibition mechanism step was added to the scheme to probe the inhibition by GAL (Figure 5, Video S2).
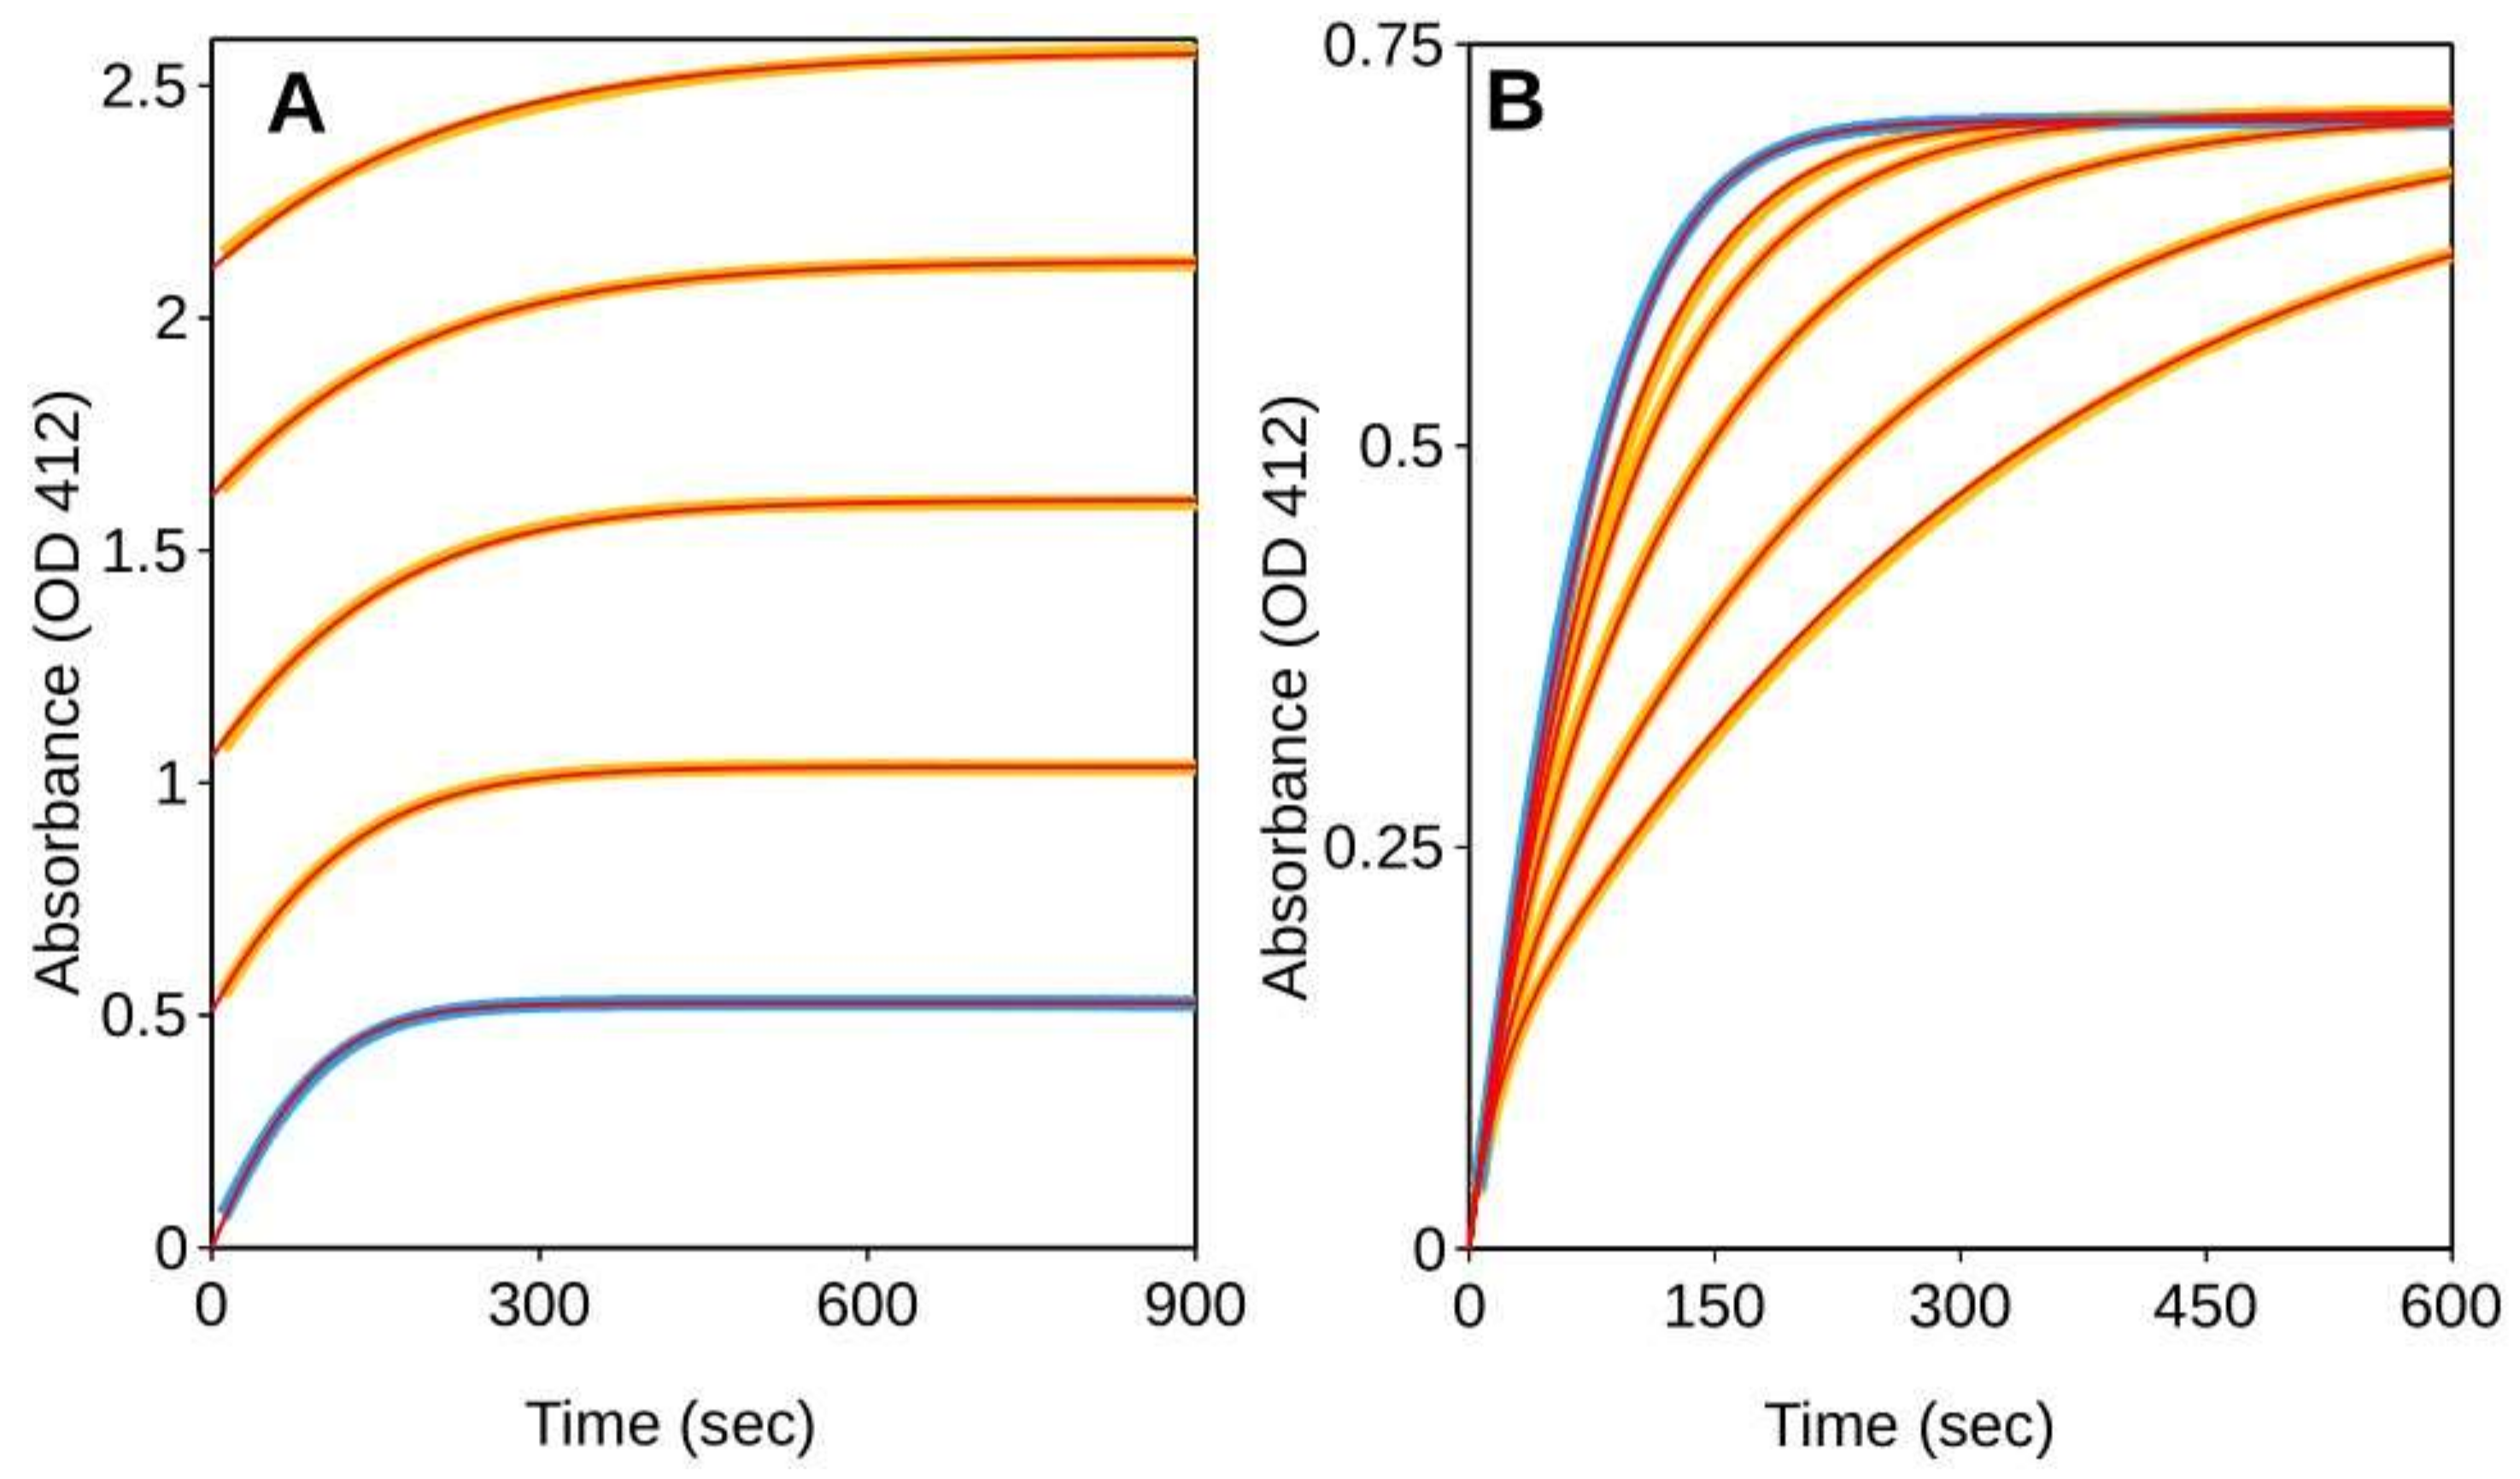
To determine kcat/Km, kcat (corresponding to k1 and k2 of the van Slyke–Cullen reaction scheme, respectively) and to assay the product inhibition, five progress curves measured in the presence of initial thiocholine-TNB concentration from 0 to ~150 µM were analyzed with ENZO (Figure 6A and Video S2). kcat and kcat/Km were evaluated to be 2965 ± 3 s−1 and 3.73 ± 0.01 × 10⁸ M−1s−1 respectively. For the reactions at higher initial thiocholine-TNB concentrations, the plateau is reached at longer times which indicates inhibition by the reaction product. The curves fit with a competitive inhibition mechanism and a Ki for thiocholine-TNB of 21.54 ± 0.38 µM. These values were constrained in the subsequent analysis of TcAChE inhibition by GAL. In the evaluation, the second-order binding rate constant (k3) was set to the diffusion rate-limited value of 2 × 10⁸ M−1s−1, so that only the constant rates for the binding/unbinding of GAL to the free enzyme (k5/k6) had to be evaluated, along with the initial substrate and AChE concentrations. Figure 6B and Video S2 show the fitting of the progress curves measured in the presence of GAL.
Reactions were started by adding the enzyme as the last reagent, i.e., without E-I pre-incubation. Analogously to what was found for AChEs from other sources, and in contrast to what has previously been reported for the enzyme form Torpedo californica [25], the curves of the GAL-inhibited TcAChE are consistent with a pure competitive inhibition mechanism. The Ki, however, was evaluated to be of 8.45 ± 0.23 nM, showing that for this enzyme the potency of GAL is 25-fold larger than what previous Ki determinations suggested [25] and 230-fold larger than what can be deduced by the reported IC50 of 1.82 µM [43].
It is important to note here that the pre-steady-state phase of the inhibited progress curves contains information on the kinetic of binding of GAL to TcAChE. By fitting the curves with ENZO this information is automatically used to explicitly determine the on and off microscopic rates. On the basis of reagents concentrations and of the time for the onset of the steady-state (see Video S2), the kon was found to be of 1.9 × 10⁶ M−1s−1 and, consequently, the koff was calculated to be of 1.57 × 10⁻² s−1, corresponding to a residence time of 63.8 s.

3. Discussion

The dissociation constant rate, koff, is a direct measure of the thermodynamic stability of the EI complex, while the second order rate kon reflects the energy activation barrier for the binding reaction and hence the microscopic probability of a productive encounter between E and I [44]. kon has an upper limit in the diffusion rate, which at room temperature is ~108–109 M−1s−1 [6]. So, the binding of GAL to TcAChE herein reported, with a kon of 1.9 × 10⁶ M−1s−1 is roughly 2–3 orders of magnitude slower than what is expected for a diffusion limited interaction. As already suggested for other slow AChE inhibitors [29], the likely explanation resides in the relation between the size of the GAL molecule and the geometry of the AChE active site. In AChEs, the active site is positioned at the bottom of a narrow and deep gorge [24] (Figure 7A). A feature common to all AChEs is the presence, roughly half way down the gorge, of four aromatic residues (Tyr121, Phe290, Phe331, and Tyr 334 in TcAChE), generally referred to as the bottleneck, which narrow the passage of in- and out-bound molecules down to a solvent accessible section that in TcAChE is of 28 Å2 (calculated by CAVER [45], Figure 7B [46,47,48,49]). GAL is a rigid and rather bulky molecule with dimensions of 8.9 × 6.5 × 3.0 Å. Hence, in order for GAL to reach its binding site TcAChE has to undergo a significant conformational rearrangement. Because the motions of amino acid side chains and/or of secondary structure elements within proteins occur at a much slower rate than free diffusion [50], the inhibitor passage through the bottleneck likely constitutes the rate limiting step of the GAL-TcAChE interaction. Recently, employing a surface plasmon resonance (SPR)-based assay, Fabini et al. have determined the constant rates for the binding to the human AChE of several inhibitors [51]. The kon and koff for GAL were evaluated to be 9.5 × 10⁴ M−1s−1, and 2.5 × 10⁻² s−1 respectively, corresponding to a residence time of 40.3 s and to a Ki of 0.26 µM. While the off constant rate is consistent with the koff that we have found for the enzyme of Torpedo californica, the kon is 20 times slower. A discrepancy that, however, seems to collide with the structural evidence available. Indeed, in HuAChE, the bottleneck is considerably narrower than in TcAChE (its solvent accessible section is of 14 Å2, Figure 7C), suggesting that the extent of the structural distortion it has to undergo to allow the GAL through the gorge has to be larger, and hence that the binding should be equally as slow as or possibly slower than for TcAChE. The likely explanation, supported by a rather rich literature, is that the chemical modifications and the consequent conformational constraints occurring when a protein is immobilized on the SPR sensor chip interfere with its dynamic properties, primarily affecting the detection of the kon [52,53]. The main conclusion that can be drawn from SPR data is the confirmation of the time-dependent nature of AChEs inhibition by GAL.
Because AChEs are highly conserved enzymes, the identification of a structural–activity relationship linking the crystallographic structures of human and Torpedo californica enzymes to the inhibition mechanism strongly suggests that the slow binding and unbinding of GAL are a general feature pertaining to all AChE isozymes. This, in turn, is the likely cause of both the large overestimation and the large variance observed within the published IC50s and Kis. In contrast to the accepted belief, mostly based on unreliable IC50 measurements, that GAL is a much weaker inhibitor of AChE than donepezil, here we proved that these two anti-Alzheimer’s drugs indeed share a very similar potency. This is also consistent with GAL and donepezil being used at similar therapeutic doses (16–24 mg/day and 5–10 mg/day, respectively) [54].
The data presented in this work support two conclusions. The first, of general relevance, is that a preincubating enzyme and inhibitor is not a safe way to study enzyme inhibition as this might cause, in the case of long residence time, to mistake a competitive inhibitor for a mixed-type or noncompetititve inhibitor. The second, which is specifically relevant to the field of anti-Alzheimer’s drug development, is that GAL is at least 100 times more potent than what has for many years been reported and hence that its potency is comparable to that of donepezil.
Furthermore, there is another general consideration that can be drawn and that we would like to share with the biochemist and medicinal chemist communities.
It is becoming increasingly clear that oversights similar to those regarding GAL and AChE are a rather common matter in biochemistry. The concern is such that efforts are being made to counteract the problem, for example, by developing software that can help to standardize and validate the analytical procedures [55] and databases that foster the accurate reporting of enzyme kinetic data [56]. However, as long as mechanisms that deviate from the steady-state model continue to be analyzed using methods that assume and require a steady state, any standardization attempt will only result in the standardization of errors.
A common source of data inaccuracy is the widespread use of dose–response experiments. IC50s are known to deliver a limited amount of information and it has been stressed many times that they should be handled with much caution [5,57,58]. Nonetheless, because dose–response analysis enables the assessment of ligand potency with a single (or very few) measurements, IC50s are regarded as an indispensable tool in drug design, where large compound libraries have to be screened [59]. Understandably, the labor-intensive analytical methods envisaged by enzymologists to study certain complex mechanisms can hardly be implemented in high-throughput screening methodologies and do not fit well with the needs of pharmacological research. At the same time, the pharmacodynamic models used to translate biochemical into pharmacological data and to predict the properties of potential drugs, are destined to fail if the biochemical inputs are too inaccurate [44,60,61]. It is important to remark that the overuse of IC50 does not pertain exclusively to medicinal chemistry. The tendency to oversimplify kinetic analysis seems to broadly affect all those fields of research where the study of enzyme activity is still central. See, as an example, the questionable habit to report Ki derived by IC50 through the Cheng–Prusoff equation rather than by an actual steady-state analysis. The evidence herein reported shows once again how misleading the output of kinetic studies can be if oversimplified analytical approaches are employed. Methods that properly account for the deviations from the Michaelis–Menten model have indeed been devised but due to the complexity of the data analysis involved they have generally failed to turn into common real-life laboratory practices and, as a matter of fact, the accuracy that more thorough analysis might deliver is very often traded off with the ease of dose–response analysis.
In this context, the substantial benefit brought about by the development of computer programs for the assessment of enzyme kinetic by the global fitting of full reaction time-courses should be mentioned [62]. Notably, once the mechanism of the target enzyme has been resolved, the analysis of a single progress curve measured in the presence of the inhibitor is sufficient to provide an accurate Ki determination and to discriminate between the possible inhibition mechanisms [63] (for a two-substrate enzyme, two curves at varying substrates concentrations would be required), hence abolishing the convenience of the IC50 measure over thorough analysis and Ki determination. A deeper discussion of the principle and of the technicalities involved in this analytical method are beyond the scope of this work, and we refer the readers to the cited specialized literature. In general, the direct simulation of enzymatic reactions streamlines the otherwise difficult study of mechanisms that deviate from the steady-state assumptions, as are the cases, quite common in pharmacology, of tight-binders and time-dependent inhibitors. By facilitating a deeper and more thorough understanding of the interaction between pharmacological targets and lead compounds this new approach to enzyme kinetics might contribute to alleviating the high failure rate of drug candidates in clinical trials [64,65]. However, unfortunately, although software such as KinTek Explorer and ENZO has been released more than 10 years ago, they are still not very popular among biochemists, in part because their use implies the acquisition of new non-trivial skills.
For the sake of the quality and reliability of both biochemical and pharmacological research, the authors call for a more resolute joint effort should be undertaken by teachers, scientists and the editors of scientific journals to promote the switch from the 100-years old initial velocities method to the computer-assisted global fitting of progress curves. This would concomitantly discourage the widespread use of the often-misleading IC50s.

4. Material and Methods

4.1. Generation and Analysis of Synthetic Kinetic Data

Synthetic data were generated with the software KinTek Explorer [37]. The program, developed to solve enzyme kinetics by the global fitting of the reaction full time-courses through numerical integration, implements a module which allows us to compute synthetic data once that a mechanism and initial conditions are given. To simulate the inhibition of an enzyme with Km of 10 µM by a competitive inhibitor with Ki of 1 µM, k1 and k-1, the constant rates for the association and dissociation of the ES complex were set to 108 M−1s−1 and 1 s−1, respectively, and the catalytic constant Kcat was set to 1000 s−1. The ratio between the koff and kon constant rates for the EI formation was set to 10−6 M. The koff value was varied in the 10−5–103 s−1 range to simulate slow or fast dissociating inhibitors. Enzyme concentration was set to 100 pM, the concentrations of substrate were 1, 2, 5, 10, 20, 50, 100, 150, 200 µM and those of the inhibitor were 0.5, 1, 2, 5, 10, 20 and 50 µM. An extensive E-I pre-incubation of 106 s was allowed to ensure that the thermodynamic equilibrium was attained before the start of the reaction. To simulate the dead time between the mixing of reagents and the recording of reactions, initial velocities were detected after 10 s from the start.
Double reciprocal plots were assessed by a weighted least-squares analysis that assumed the variance of the velocity (v) to be a constant percentage of v for the entire dataset. The calculation of the competitive inhibitor constant (Kic) value was carried out by re-plotting slopes of lines from the Lineweaver–Burk plot versus the inhibitor concentration and Kic was determined as the intersect on the negative x-axis (Dixon plot, Figure S1A). The apparent uncompetitive Kiu (dissociation constant for the enzyme–substrate–inhibitor complex) value was determined by plotting the apparent 1/Vmax versus inhibitor concentration (Cornish–Bowden plot, Figure S1B). Data analyses were performed with LibreOffice Calc 7.2.

4.2. Chemicals

TcAChE was isolated and purified as previously described [66], except for the affinity chromatography ligand, mono-(aminocaproyl)-p-aminophenyltrimethylammonium. Galantamine (purity > 99%) was from Sopharma AD (Sofia, Bulgaria). Dithio-bis-di-nitro benzoic acid (DTNB), acetylthiocholine iodide and all other chemicals were from Sigma-Aldrich (Milano, Italy).

4.3. Measure of Enzymatic Activity

The enzymatic activity of TcAChE was evaluated spectrophotometrically by Ellman’s method [67] using a Ultrospec 7000 (Milano, Italy) double beam spectrophotometer. Measures were carried out at room temperature in 25 mM K-phosphate buffer at pH 7.0 and 340 µM DTNB. The formation of the reaction product thiocholine-TNB was followed, measuring the absorbance change at 412 nm (ε 13,600 M−1cm−1).

4.4. Steady-State Inhibition Analysis

Reactions catalyzed by TcAChE were measured in the absence and presence of galantamine for 60 s. For substrate-initiated reactions, 50 pM of enzyme was pre-incubated with GAL for 20 min. For the enzyme-initiated reactions, the enzyme concentration was 200 pM. Reciprocal plots of 1/velocity versus 1/[substrate] were constructed at substrate concentration in the 10–200 µM range. Data points are average values of three replicates. Four concentrations of inhibitors were selected for each assay: 50, 100, 200 and 400 nM for the enzyme-initiated reactions, and 5, 10, 20, 30 nM for the reaction started with the substrate. Kic and Kiu were determined by Dixon plot and Cornish–Bowden plot, respectively (see Supplementary Materials).

4.5. Kinetic Analysis of Reaction Progress Curves

Two distinct sets of progress curves were measured in triplicate either in the absence or in the presence of GAL. The analysis was performed using the ENZO web application. To evaluate the Michaelian parameters of the TcAChE, the hydrolysis of 35 µM acetylthiocholine by ~200 pM enzyme was monitored for 15 min. To assay the product inhibition by thiocholine-TNB, five consecutive reaction time courses were measured in the same 1 mL cuvette by adding 2 µL of a 20 mM fresh substrate solution once the previous reaction had come to completion so that four concentrations from 35 to 150 µM of the inhibitory thiocholine-TNB compound were assayed.
For the determination of GAL inhibition, the reactions with 200 pM enzyme and 50 µM acetylthiocholine were monitored for up to 33 min. Galantamine concentrations were 15, 30, 60, 120 and 180 nM.

Supplementary Materials

The following supporting information can be downloaded at: https://www.mdpi.com/article/10.3390/ijms23095072/s1.

Author Contributions

Conceptualization, A.P.; Data curation, A.P.; Writing—original draft preparation, A.P.; Writing—review and editing, A.P., D.L. All authors have read and agreed to the published version of the manuscript.

Funding

This research received no external funding.

Institutional Review Board Statement

Not applicable.

Informed Consent Statement

Not applicable.

Data Availability Statement

Not applicable.

Conflicts of Interest

Authors declare no conflict of interest.

References

  1. Alam, M.T.; Olin-Sandoval, V.; Stincone, A.; Keller, M.A.; Zelezniak, A.; Luisi, B.F.; Ralser, M. The self-inhibitory nature of metabolic networks and its alleviation through compartmentalization. Nat. Commun. 2017, 10, 16018. [Google Scholar] [CrossRef] [PubMed]
  2. Koch, G.; Schropp, J.; Jusko, W.J. Assessment of non-linear combination effect terms for drug-drug interactions. J. Pharmacokinet. Pharmacodyn. 2016, 43, 461–479. [Google Scholar] [CrossRef] [PubMed] [Green Version]
  3. Deodhar, M.; Al Rihani, S.B.; Arwood, M.J.; Darakjian, L.; Dow, P.; Turgeon, J.; Michaud, V. Mechanisms of CYP450 Inhibition: Understanding Drug-Drug Interactions Due to Mechanism-Based Inhibition in Clinical Practice. Pharmaceutics 2020, 4, 846. [Google Scholar] [CrossRef] [PubMed]
  4. Upton, R.N.; Mould, D.R. Basic concepts in population modeling, simulation, and model-based drug development: Part 3-introduction to pharmacodynamic modeling methods. CPT Pharmacomet. Syst. Pharmacol. 2014, 3, e88. [Google Scholar] [CrossRef] [PubMed]
  5. Holdgate, G.A.; Meek, T.D.; Grimley, R.L. Mechanistic enzymology in drug discovery: A fresh perspective. Nat. Rev. Drug Discov. 2018, 17, 115–132. [Google Scholar] [CrossRef] [PubMed]
  6. Copeland, R.A.; Pompliano, D.L.; Meek, T.D. Drug-target residence time and its implications for lead optimization. Nat. Rev. Drug Discov. 2006, 5, 730–739. [Google Scholar] [CrossRef] [PubMed]
  7. Copeland, R.A. The drug-target residence time model: A 10-year retrospective. Nat. Rev. Drug Discov. 2016, 15, 87–95. [Google Scholar] [CrossRef] [PubMed]
  8. Contestabile, A. The history of the cholinergic hypothesis. Behav. Brain Res. 2011, 221, 334–340. [Google Scholar] [CrossRef]
  9. Ueda, M.; Matsumura, S.; Kimoto, S.; Matsuda, S. Studies on the anticholinesterase and twitch potentiation activities of galanthamine. Jpn. J. Pharmacol. 1962, 12, 111–119. [Google Scholar] [CrossRef] [Green Version]
  10. Olin, J.; Schneider, L. Galantamine for Alzheimer’s disease. Cochrane Database Syst. Rev. 2002, 3, CD001747, Update in: Cochrane Database Syst. Rev. 2004, 4, CD001747. [Google Scholar] [CrossRef]
  11. Przybyłowska, M.; Dzierzbicka, K.; Kowalski, S.; Chmielewska, K.; Inkielewicz-Stepniak, I. Therapeutic Potential of Multifunctional Derivatives of Cholinesterase Inhibitors. Curr. Neuropharmacol. 2021, 19, 1323–1344. [Google Scholar] [CrossRef]
  12. Lazarova, M.I.; Tsekova, D.S.; Tancheva, L.P.; Kirilov, K.T.; Uzunova, D.N.; Vezenkov, L.T.; Tsvetanova, E.R.; Alexandrova, A.V.; Georgieva, A.P.; Gavrilova, P.T.; et al. New Galantamine Derivatives with Inhibitory Effect on Acetylcholinesterase Activity. J. Alzheimers Dis. 2021, 83, 1211–1220. [Google Scholar] [CrossRef]
  13. Lazarova, M.; Tancheva, L.; Alexandrova, A.; Tsvetanova, E.; Georgieva, A.; Stefanova, M.; Tsekova, D.; Vezenkov, L.; Kalfin, R.; Uzunova, D.; et al. Effects of New Galantamine Derivatives in a Scopolamine Model of Dementia in Mice. J. Alzheimers Dis. 2021, 84, 671–690. [Google Scholar] [CrossRef]
  14. Colović, M.B.; Krstić, D.Z.; Lazarević-Pašti, T.D.; Bondžić, A.M.; Vasić, V.M. Acetylcholinesterase inhibitors: Pharmacology and toxicology. Curr. Neuropharmacol. 2013, 11, 315–335. [Google Scholar] [CrossRef] [Green Version]
  15. Caliandro, R.; Pesaresi, A.; Cariati, L.; Procopio, A.; Oliverio, M.; Lamba, D. Kinetic and structural studies on the interactions of Torpedo californica acetylcholinesterase with two donepezil-like rigid analogues. J. Enzym. Inhib. Med. Chem. 2018, 33, 794–803. [Google Scholar] [CrossRef] [Green Version]
  16. Sugimoto, H.; Yamanishi, Y.; Iimura, Y.; Kawakami, Y. Donepezil hydrochloride (E2020) and other acetylcholinesterase inhibitors. Curr. Med. Chem. 2000, 7, 303–339. [Google Scholar] [CrossRef]
  17. Chang, A.; Jeske, L.; Ulbrich, S.; Hofmann, J.; Koblitz, J.; Schomburg, I.; Neumann-Schaal, M.; Jahn, D.; Schomburg, D. BRENDA, the ELIXIR core data resource in 2021: New developments and updates. Nucleic Acids Res. 2021, 49, D498–D508. [Google Scholar] [CrossRef]
  18. Jukic, M.; Politeo, O.; Maksimovic, M.; Milos, M. In vitro acetylcholinesterase inhibitory properties of thymol, carvacrol and their derivatives thymoquinone and thymohydroquinone. Phytother. Res. 2007, 21, 259–261. [Google Scholar] [CrossRef]
  19. Alarcón, J.; Astudillo, L.; Gutierrez, M. Inhibition of acetylcholinesterase activity by dihydro-beta-agarofuran sesquiterpenes isolated from Chilean Celastraceae. Z. Naturforsch. C J. Biosci. 2008, 63, 853–856. [Google Scholar] [CrossRef] [Green Version]
  20. Schuh, F.T. Zum molekularen Wirkungsmechanismus von Galathamin, einem Curare-Antagonisten (On the molecular mechanism of action of galanthamine, an antagonist of nondepolarizing muscle relaxants (author’s transl)). Anaesthesist 1976, 25, 444–448. [Google Scholar]
  21. Darvesh, S.; Walsh, R.; Kumar, R.; Caines, A.; Roberts, S.; Magee, D.; Rockwood, K.; Martin, E. Inhibition of human cholinesterases by drugs used to treat Alzheimer disease. Alzheimer Dis. Assoc. Disord. 2003, 17, 117–126. [Google Scholar] [CrossRef]
  22. Han, S.Y.; Sweeney, J.E.; Bachman, E.S.; Schweiger, E.J.; Forloni, G.; Coyle, J.T.; Davis, B.M.; Joullié, M.M. Chemical and pharmacological characterization of galanthamine, an acetylcholinesterase inhibitor, and its derivatives. A potential application in Alzheimer’s disease? Eur. J. Med. Chem. 1992, 27, 673–687. [Google Scholar] [CrossRef]
  23. Bores, G.M.; Huger, F.P.; Petko, W.; Mutlib, A.E.; Camacho, F.; Rush, D.K.; Selk, D.E.; Wolf, V.; Kosley, R.W.; Davis, L.; et al. Pharmacological evaluation of novel Alzheimer’s disease therapeutics: Acetylcholinesterase inhibitors related to galanthamine. J. Pharmacol. Exp. Ther. 1996, 277, 728–738. [Google Scholar]
  24. Sussman, J.L.; Harel, M.; Frolow, F.; Oefner, C.; Goldman, A.; Toker, L.; Silman, I. Atomic structure of acetylcholinesterase from Torpedo californica: A prototypic acetylcholine-binding protein. Science 1991, 253, 872–879. [Google Scholar] [CrossRef]
  25. Khalid, A.; Azim, M.K.; Parveen, S.; Atta-ur-Rahman; Choudhary, M.I. Structural basis of acetylcholinesterase inhibition by triterpenoidal alkaloids. Biochem. Biophys. Res. Commun. 2005, 331, 1528–1532. [Google Scholar] [CrossRef] [PubMed]
  26. Geerts, H.; Guillaumat, P.O.; Grantham, C.; Bode, W.; Anciaux, K.; Sachak, S. Brain levels and acetylcholinesterase inhibition with galantamine and donepezil in rats, mice, and rabbits. Brain Res. 2005, 1033, 186–193. [Google Scholar] [CrossRef] [PubMed]
  27. Wiesner, J.; Kriz, Z.; Kuca, K.; Jun, D.; Koca, J. Acetylcholinesterases—The structural similarities and differences. J. Enzym. Inhib. Med. Chem. 2007, 22, 417–424. [Google Scholar] [CrossRef]
  28. Masson, P.; Lushchekina, S.V. Slow-binding inhibition of cholinesterases, pharmacological and toxicological relevance. Arch. Biochem. Biophys. 2016, 593, 60–68. [Google Scholar] [CrossRef]
  29. Lushchekina, S.V.; Masson, P. Slow-binding inhibitors of acetylcholinesterase of medical interest. Neuropharmacology 2020, 177, 108236. [Google Scholar] [CrossRef]
  30. Waley, S.G. The kinetics of slow-binding and slow, tight-binding inhibition: The effects of substrate depletion. Biochem. J. 1993, 15, 195–200. [Google Scholar] [CrossRef] [PubMed]
  31. Morrison, J.F.; Walsh, C.T. The behavior and significance of slow-binding enzyme inhibitors. In Advances in Enzymology and Related Areas of Molecular Biology; Meister, A., Ed.; John Wyley & Sons, Inc.: Hoboken, NJ, USA, 2007; Volume 61, pp. 201–301. [Google Scholar] [CrossRef]
  32. Johnson, K.A. Slow-onset Inhibition. In Kinetic Analysis for the New Enzymology; Johnson, K.A., Ed.; Kintek Corporation: Austin, TX, USA, 2019; pp. 361–383. [Google Scholar]
  33. Cornish-Bowden, A. Tight-binding and irreversible inhibitors. In Fundamentals of Enzyme Kinetic, 3rd ed.; Portland Press Ltd.: London, UK, 2004; pp. 145–155. [Google Scholar]
  34. Turner, P.M.; Lerea, K.M.; Kull, F.J. The ribonuclease inhibitors from porcine thyroid and liver are slow, tight-binding inhibitors of bovine pancreatic ribonuclease A. Biochem. Biophys. Res. Commun. 1983, 114, 1154–1160. [Google Scholar] [CrossRef]
  35. Kuzmic, P. Optimal Duration of the Pre-incubation Phase in Enzyme Inhibition Experiments. ChemRxiv 2020. [Google Scholar] [CrossRef]
  36. Duggleby, R.G. Quantitative analysis of the time courses of enzyme-catalyzed reactions. Methods 2001, 24, 168–174. [Google Scholar] [CrossRef] [Green Version]
  37. Johnson, K.A.; Simpson, Z.B.; Blom, T. Global kinetic explorer: A new computer program for dynamic simulation and fitting of kinetic data. Anal. Biochem. 2009, 387, 20–29. [Google Scholar] [CrossRef]
  38. Zimmerle, C.T.; Frieden, C. Analysis of progress curves by simulations generated by numerical integration. Biochem. J. 1989, 258, 381–387. [Google Scholar] [CrossRef]
  39. Bevc, S.; Konc, J.; Stojan, J.; Hodošček, M.; Penca, M.; Praprotnik, M.; Janežič, D. ENZO: A web tool for derivation and evaluation of kinetic models of enzyme catalyzed reactions. PLoS ONE 2011, 6, e22265. [Google Scholar] [CrossRef]
  40. Bäuerle, F.; Zotter, A.; Schreiber, G. Direct determination of enzyme kinetic parameters from single reactions using a new progress curve analysis tool. Protein Eng. Des. Sel. 2017, 30, 149–156. [Google Scholar] [CrossRef] [Green Version]
  41. Stojan, J. The mechanism and benefit of human butyrylcholinesterase activation by what would otherwise be inhibitors. Chem. Biol. Interact. 2019, 308, 350–356. [Google Scholar] [CrossRef]
  42. Kuzmic, P. Application of the Van Slyke-Cullen irreversible mechanism in the analysis of enzymatic progress curves. Anal. Biochem. 2009, 394, 287–289. [Google Scholar] [CrossRef]
  43. Berkov, S.; Codina, C.; Viladomat, F.; Bastida, J. N-Alkylated galanthamine derivatives: Potent acetylcholinesterase inhibitors from Leucojum aestivum. Bioorg. Med. Chem. Lett. 2008, 18, 2263–2266. [Google Scholar] [CrossRef]
  44. Tonge, P.J. Drug-Target Kinetics in Drug Discovery. ACS Chem. Neurosci. 2018, 9, 29–39. [Google Scholar] [CrossRef] [Green Version]
  45. Damborsky, J.; Kozlikova, B. CAVER Analyst 2.0: Analysis and visualization of channels and tunnels in protein structures and molecular dynamics trajectories. BioinformaticS 2018, 34, 3586–3588. [Google Scholar] [CrossRef] [Green Version]
  46. Dvir, H.; Jiang, H.L.; Wong, D.M.; Harel, M.; Chetrit, M.; He, X.C.; Jin, G.Y.; Yu, G.L.; Tang, X.C.; Silman, I.; et al. X-ray structures of Torpedo californica acetylcholinesterase complexed with (+)-huperzine A and (−)-huperzine B: Structural evidence for an active site rearrangement. Biochemistry 2002, 41, 10810–10818. [Google Scholar] [CrossRef]
  47. Greenblatt, H.M.; Kryger, G.; Lewis, T.; Silman, I.; Sussman, J.L. Structure of acetylcholinesterase complexed with (−)-galanthamine at 2.3 A resolution. FEBS Lett. 1999, 463, 321–326. [Google Scholar] [CrossRef] [Green Version]
  48. Cheung, J.; Rudolph, M.J.; Burshteyn, F.; Cassidy, M.S.; Gary, E.N.; Love, J.; Franklin, M.C.; Height, J.J. Structures of human acetylcholinesterase in complex with pharmacologically important ligands. J. Med. Chem. 2012, 55, 10282–10286. [Google Scholar] [CrossRef]
  49. DeLano, W.L. PyMOL: An open-source molecular graphics tool. CCP4 Newsl. Protein Crystallogr. 2002, 40, 82–92. [Google Scholar]
  50. Henzler-Wildman, K.; Kern, D. Dynamic personalities of proteins. Nature 2007, 450, 964–972. [Google Scholar] [CrossRef]
  51. Fabini, E.; Tramarin, A.; Bartolini, M. Combination of human acetylcholinesterase and serum albumin sensing surfaces as highly informative analytical tool for inhibitor screening. J. Pharm. Biomed. Anal. 2018, 155, 177–184. [Google Scholar] [CrossRef]
  52. Sundberg, E.J.; Andersen, P.S.; Gorshkova, I.I.; Schuck, P. Surface Plasmon Resonance Biosensing in the Study of Ternary Systems of Interacting Proteins. In Protein Interactions—Biophysical Approaches for the Study of Complex Reversible Systems; Schuck, P., Ed.; Springer: Boston, MA, USA, 2007; pp. 97–141. [Google Scholar] [CrossRef] [Green Version]
  53. Rich, R.L.; Myszka, D.G. Survey of the year 2007 commercial optical biosensor literature. J. Mol. Recognit. 2008, 21, 355–400. [Google Scholar] [CrossRef] [PubMed]
  54. Mehta, M.; Adem, A.; Sabbagh, M. New Acetylcholinesterase Inhibitors for Alzheimer’s Disease. Int. J. Alzheimer Dis. 2012, 2012, 728983. [Google Scholar] [CrossRef]
  55. Sussman, J.L.; Harel, M.; Frolow, F.; Varon, L.; Toker, L.; Futerman, A.H.; Silman, I. Purification and crystallization of a dimeric form of acetylcholinesterase from Torpedo californica subsequent to solubilization with phosphatidylinositol-specific phospholipase C. J. Mol. Biol. 1988, 203, 821–823. [Google Scholar] [CrossRef]
  56. Ellman, G.L.; Courtney, K.D.; Andres, V.; Feather-Stone, R.M. A new and rapid colorimetric determination of acetylcholinesterase activity. Biochem. Pharmacol. 1961, 7, 88–95. [Google Scholar] [CrossRef]
  57. Pinto, M.F.; Baici, A.; Pereira, P.J.B.; Macedo-Ribeiro, S.; Pastore, A.; Rocha, F.; Martins, P.M. interferENZY: A Web-Based Tool for Enzymatic Assay Validation and Standardized Kinetic Analysis. J. Mol. Biol. 2021, 433, 166613. [Google Scholar] [CrossRef] [PubMed]
  58. Swainston, N.; Baici, A.; Bakker, B.M.; Cornish-Bowden, A.; Fitzpatrick, P.F.; Halling, P.; Leyh, T.S.; O’Donovan, C.; Raushel, F.M.; Reschel, U.; et al. STRENDA DB: Enabling the validation and sharing of enzyme kinetics data. FEBS J. 2018, 285, 2193–2204. [Google Scholar] [CrossRef]
  59. Haupt, L.J.; Kazmi, F.; Ogilvie, B.W.; Buckley, D.B.; Smith, B.D.; Leatherman, S.; Paris, B.; Parkinson, O.; Parkinson, A. The Reliability of Estimating Ki Values for Direct, Reversible Inhibition of Cytochrome P450 Enzymes from Corresponding IC50 Values: A Retrospective Analysis of 343 Experiments. Drug Metab. Dispos. 2015, 43, 1744–1750. [Google Scholar] [CrossRef] [Green Version]
  60. Ramsay, R.R.; Tipton, K.F. Assessment of Enzyme Inhibition: A Review with Examples from the Development of Monoamine Oxidase and Cholinesterase Inhibitory Drugs. Molecules 2017, 22, 1192. [Google Scholar] [CrossRef] [Green Version]
  61. Lloyd, M.D. High-Throughput Screening for the Discovery of Enzyme Inhibitors. J. Med. Chem. 2020, 63, 10742–10772. [Google Scholar] [CrossRef]
  62. Swinney, D.C. Biochemical mechanisms of drug action: What does it take for success? Nat. Rev. Drug Discov. 2004, 3, 801–808. [Google Scholar] [CrossRef]
  63. Daryaee, F.; Tonge, P.J. Pharmacokinetic-pharmacodynamic models that incorporate drug-target binding kinetics. Curr. Opin. Chem. Biol. 2019, 50, 120–127. [Google Scholar] [CrossRef]
  64. Johnson, K.A. A century of enzyme kinetic analysis, 1913 to 2013. FEBS Lett. 2013, 587, 2753–2766. [Google Scholar] [CrossRef] [Green Version]
  65. Stojan, J. Rapid Mechanistic Evaluation and Parameter Estimation of Putative Inhibitors in a Single-Step Progress-Curve Analysis: The Case of Horse Butyrylcholinesterase. Molecules 2017, 22, 1248. [Google Scholar] [CrossRef] [Green Version]
  66. Cook, D.; Brown, D.; Alexander, R.; March, R.; Morgan, P.; Satterthwaite, G.; Pangalos, M.N. Lessons learned from the fate of AstraZeneca’s drug pipeline: A five-dimensional framework. Nat. Rev. Drug Discov. 2014, 13, 419–431. [Google Scholar] [CrossRef]
  67. Schuetz, D.A.; de Witte, W.E.A.; Wong, Y.C.; Knasmueller, B.; Richter, L.; Kokh, D.B.; Sadiq, S.K.; Bosma., R.; Nederpelt, I.; Heitman, L.H.; et al. Kinetics for Drug Discovery: An industry-driven effort to target drug residence time. Drug Discov. Today 2017, 22, 896–911. [Google Scholar] [CrossRef] [Green Version]
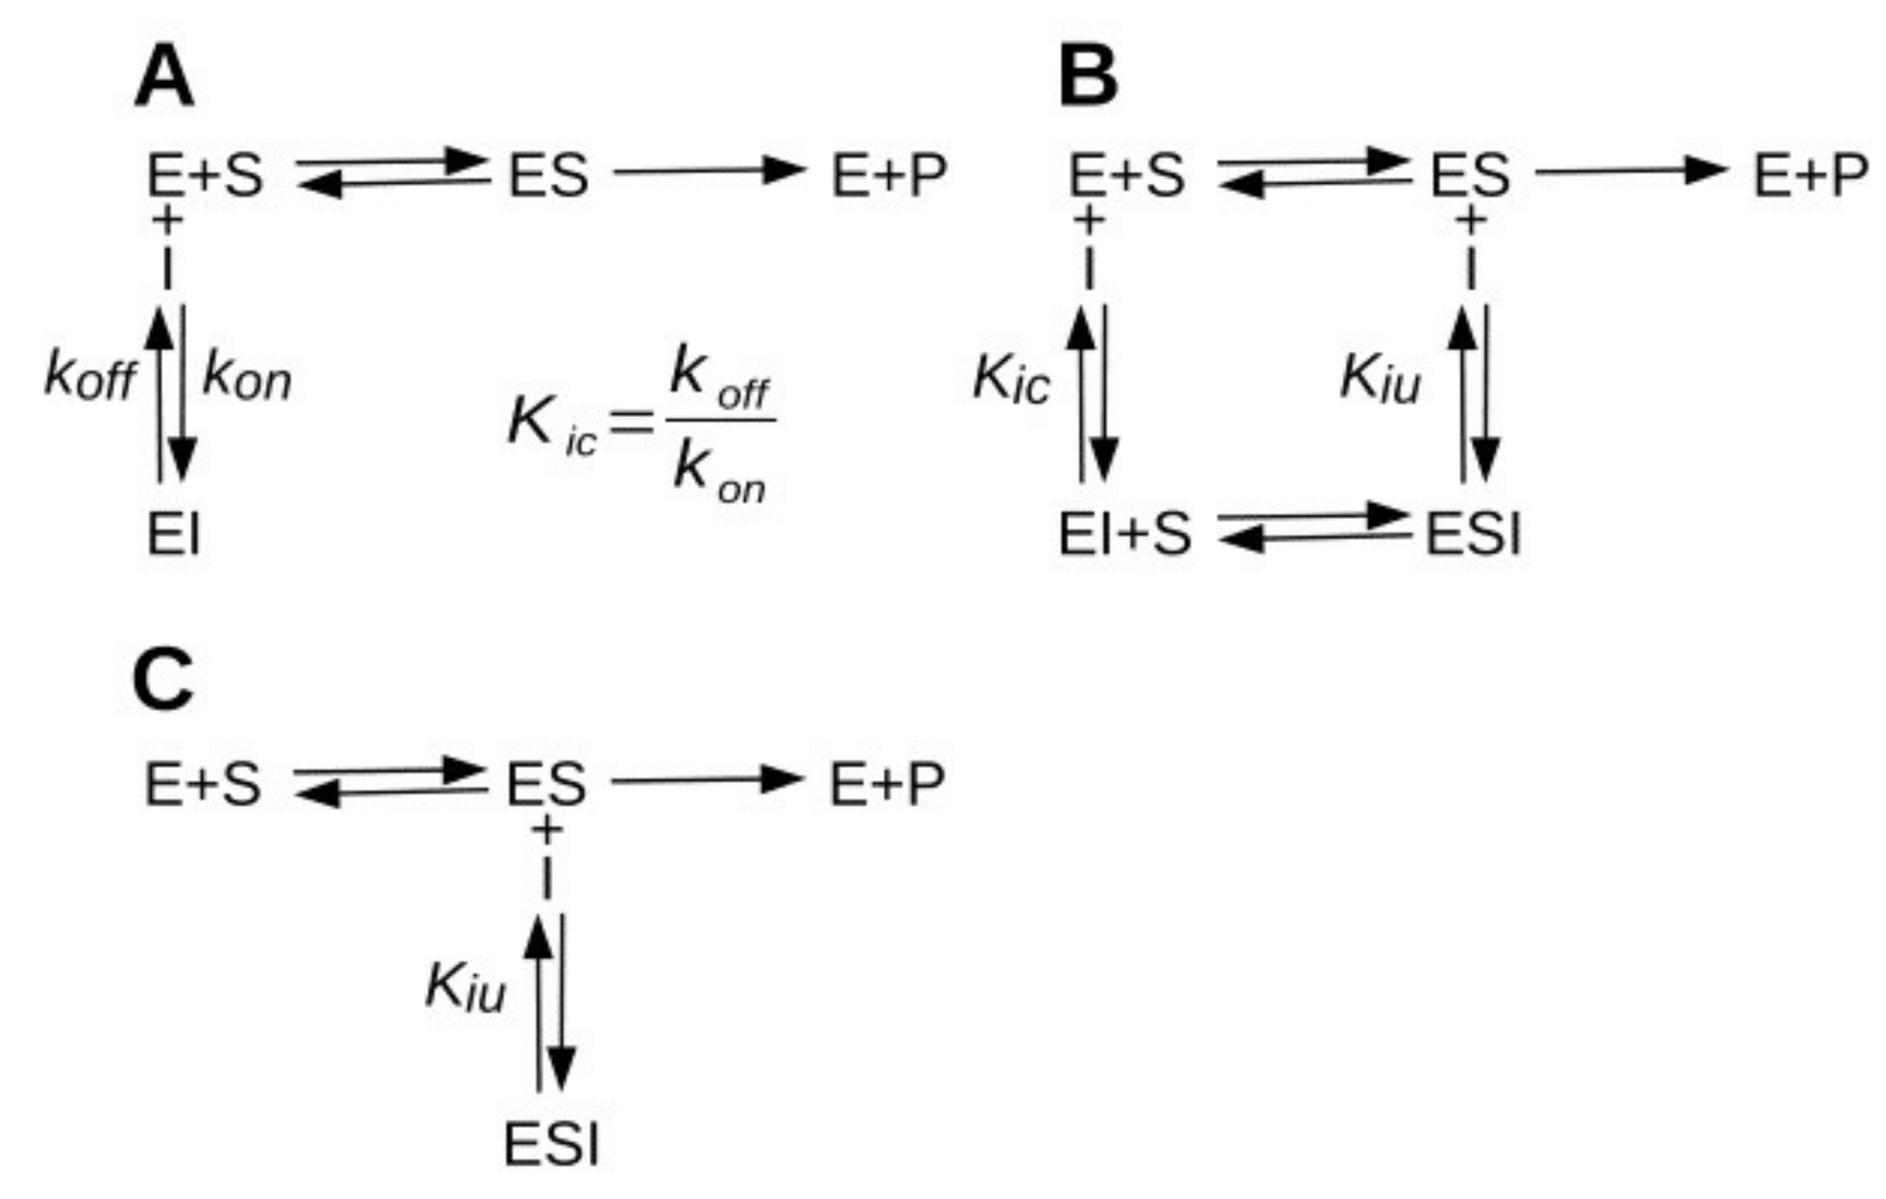
Figure 1. Inhibition mechanisms. (A) Competitive inhibition. The inhibition constant (Kic) is the dissociation constant for the formation of the EI complex. Kic corresponds to the ratio between the off and on constant rates. (B) Mixed-type inhibition. The inhibitor binds to both the free enzyme and to the enzyme-substrate complex (ES). The uncompetitive inhibition constant (Kiu) is the dissociation constant for the formation of the trimolecular complex ES-I. If Kic = Kiu the inhibition is defined as noncompetitive. (C) Uncompetitive inhibition mechanism.
Ijms 23 05072 g001
Figure 2. Molecular structure of galantamine.
Ijms 23 05072 g002
Figure 3. Analysis of synthetic kinetic data. Initial velocities were computed for an enzyme with Km = 10 µM and kcat = 1000 s−1 inhibited by three different competitive inhibitors with Ki = 1 µM. An extensive E-I pre-incubation of 106 s was allowed before the start of the reaction with substrate. (A,C,E) Initial velocity vs. [S] curves; for all curves [E] = 100 pM and [S] = 2, 5, 10, 20, 50, 100, 150, 200 µM. For each inhibitor [I] = 0, 0.5, 1, 2, 5, 10, 20 and 50 µM. Blue traces are for non-inhibited reactions. (A) fast unbinder (koff = 102 s−1), (C) intermediate unbinder (koff = 3 × 10⁻² s−1), (E) slow unbinder (koff = 10−4 s−1). (B,D,F) Lineweaver–Burk plots; for the fast dissociating inhibitor the inhibition is pure competitive (B) while the slow unbinder gives a plot typical of noncompetitive inhibition (F). For the intermediate inhibitor (D) a characteristic plot is obtained with an intersection between lines that shifts toward the 1/V axis as the [I] increases. For data point at low [I], the shift toward 1/V axis is less pronounced and the plot is consistent with mixed-type inhibition. (G) Emergence of the apparent uncompetitive inhibition component as a function of koff; for koff larger than 3 × 10⁻² s−1 the inhibition as expected is competitive (Kiu >> Kic). For koff smaller than 3 × 10⁻³ s−1 the inhibition seems pure noncompetitive (Kiu = Kic). Artifacts suggesting a mixed-type inhibition occur for koff in the range ~3 × 10⁻⁴–3 × 10⁻² s−1, where the corresponding apparent Kiu value varies from 1 Kic to ~20 Kic. (H) Time course of the ES complex formation for substrate initiated reactions. The enzyme was pre-incubated with a slow dissociating inhibitor (koff = 10−2 s−1, continue lines) or with a fast dissociating inhibitor (koff = 103 s−1, dashed lines). For all curves [E] = 100 pM and [I] = 1 µM. Four different substrate concentrations were assayed, 10 µM (black lines), 20 µM (green lines), 50 µM (blue lines) and 200 µM (red lines). It should be noted how the discrepancy between continuous and dashed lines at time t0 are larger for the curves at high [S]. For reactions at saturating initial [S] (red continue line), the velocity approaches the steady-state rate (red dashed line) after ~350 s of reaction. However, for reactions at lower initial [S] due to substrate depletion, the steady-state rate cannot be detected.
Ijms 23 05072 g003
Figure 4. Steady−state analysis of TcAChE inhibition by GAL. (A,B) Time course of product formation for TcAChE (200 pM) and ATCh (50 µM) in the absence (blue line) or presence (red lines) of GAL (30, 60, 180 nM). Dashed lines represent the slope of the first 10 s of reaction. (A) Reactions started with the enzyme (i.e., with no E-I pre-incubation). The initial rates are substantially unaffected by the presence of GAL and are a large overestimation the steady-state inhibited rates, which are only attained after 30–60 s from the start of the reactions. (B) Reactions started with substrate after a 20 min of E-I pre-incubation. Curves show an upward curvature so that initial velocities underestimate the steady-state turn-over rates. (C,D) Overlaid Lineweaver-Burk reciprocal plots of the TcAChE initial velocity (V) at increasing substrate concentrations ([ATCh] = 0–200 µM) in the absence and in the presence of inhibitors. Data points are average values of three replicates. Lines were derived from a weighted least-squares analysis of the data points. (C) Reaction started with enzyme (200 pM), in the absence or presence of GAL (0, 50, 100, 200, 400 nM). (D) Reaction started with substrate after an E-I pre-incubation time of 20 min in the absence (blue lines) or presence (red lines) of GAL (5, 10, 20, 30 nM). Enzyme concentration was 50 pM.
Ijms 23 05072 g004
Figure 5. Mechanims of AChE inhibition by GAL. The hydrolysis of ACh (S) by AChE is a two-step reaction. The first step lead to the release of choline (P) and formation of the acylated enzyme (EA). In the second step the acyl-enzyme is resolved with release of acetate (A) and formation of free enzyme (E). P rapidly reacts stechiometrically with the Ellman’s reagent to form thiocholine-TNB (the detected specie), which competitively inhibits AChE. I is the inhibitor (galantamine). k1 is an apparent bimolecular constant rate equivalent to kcat/Km and k2 is the catalytic constant. k3 and k4 are the binding and the dissociation rate constants for the formation of the EP complex. k5 and k6 are the microscopic rate constants for the binding (kon) and the dissociation (koff) of GAL to the AChE active site.
Ijms 23 05072 g005
Figure 6. Kinetic analysis of progress curves. Time course of product formation for ATCh and TcAChE in the absence (blue trace) or presence (yellow traces) of the inhibitor. The red lines are from fitting the kinetic parameters to the corresponding experimental data. (A) Determination of kat/Km, Kcat and of the Ki for product inhibition. Five subsequent reactions were measured in the same cuvette with 200 pM of TcAChE and 35 µM of ATCh. Once the substrate was completely converted to thiocholine-TNB, a new reaction was started by adding further 35 µM of ATCh. Four initial concentrations of thiocholine-TNB were tested (from 35 to ~150 µM). At higher thiocholine-TNB initial concentration the plateau is reached at longer reaction times, which indicates product inhibition. (B) Determination of GAL inhibition. TcAChE was 200 pM, ATCh 50 µM and GAL concentrations were 0 (blue trace), 15, 30, 60, 120 and 180 nM (yellow traces).
Ijms 23 05072 g006
Figure 7. Structure of AChEs active site gorge. (A) Depiction of the crystal structure of TcAChE (PDB 1EA5 [46]) showing the internal surface of the active site gorge (cyan, generated using CAVER [45] with a bound GAL molecule (yellow sticks, obtained from superimposition of PDB IDX6 [47]). Four aromatic residues, Tyr70, Phe290, Phe331 and Tyr 334 (green sticks), cause a narrowing of the gorge generally referred to as the bottleneck. Trp 279 and Trp 84 (orange sticks) mark the entrance and the bottom of the gorge, respectively. (B,C) View of a section of the active site gorge of the apo form of the TcAChE (B, PDB 1EA5 [46]) and of the enzyme from human brain (C, PDB 4EY4 [48]) seen along the main axis and showing the bottleneck lumen. Residues lining the bottleneck are shown in stick and their van der Waals surface is shown as a gray mesh. Geometric analysis of the gorge performed with CAVER [45] evaluated the opening through the gorge narrowing to have a solvent accessible area of 28 Å2 in TcAChE and of 14 Å2 in HuAChE. Behind the bottleneck, depicted in yellow stick, is shown the GAL inhibitor bound in the active site at the bottom of the gorge, obtained from superimposition of the AChE-GAL crystallographic complexes PDB ID 1DX6 [47] for T. californica and PDB ID 4EY6 [50] for the human enzyme. Created using PyMol [49].
Ijms 23 05072 g007
Publisher’s Note: MDPI stays neutral with regard to jurisdictional claims in published maps and institutional affiliations.