
Adiponectin Deficiency Alters Placenta Function but Does Not Affect Fetal Growth in Mice

 , , and
Abstract
: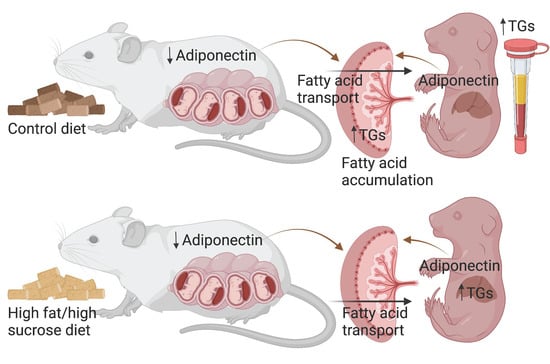
1. Introduction
2. Results
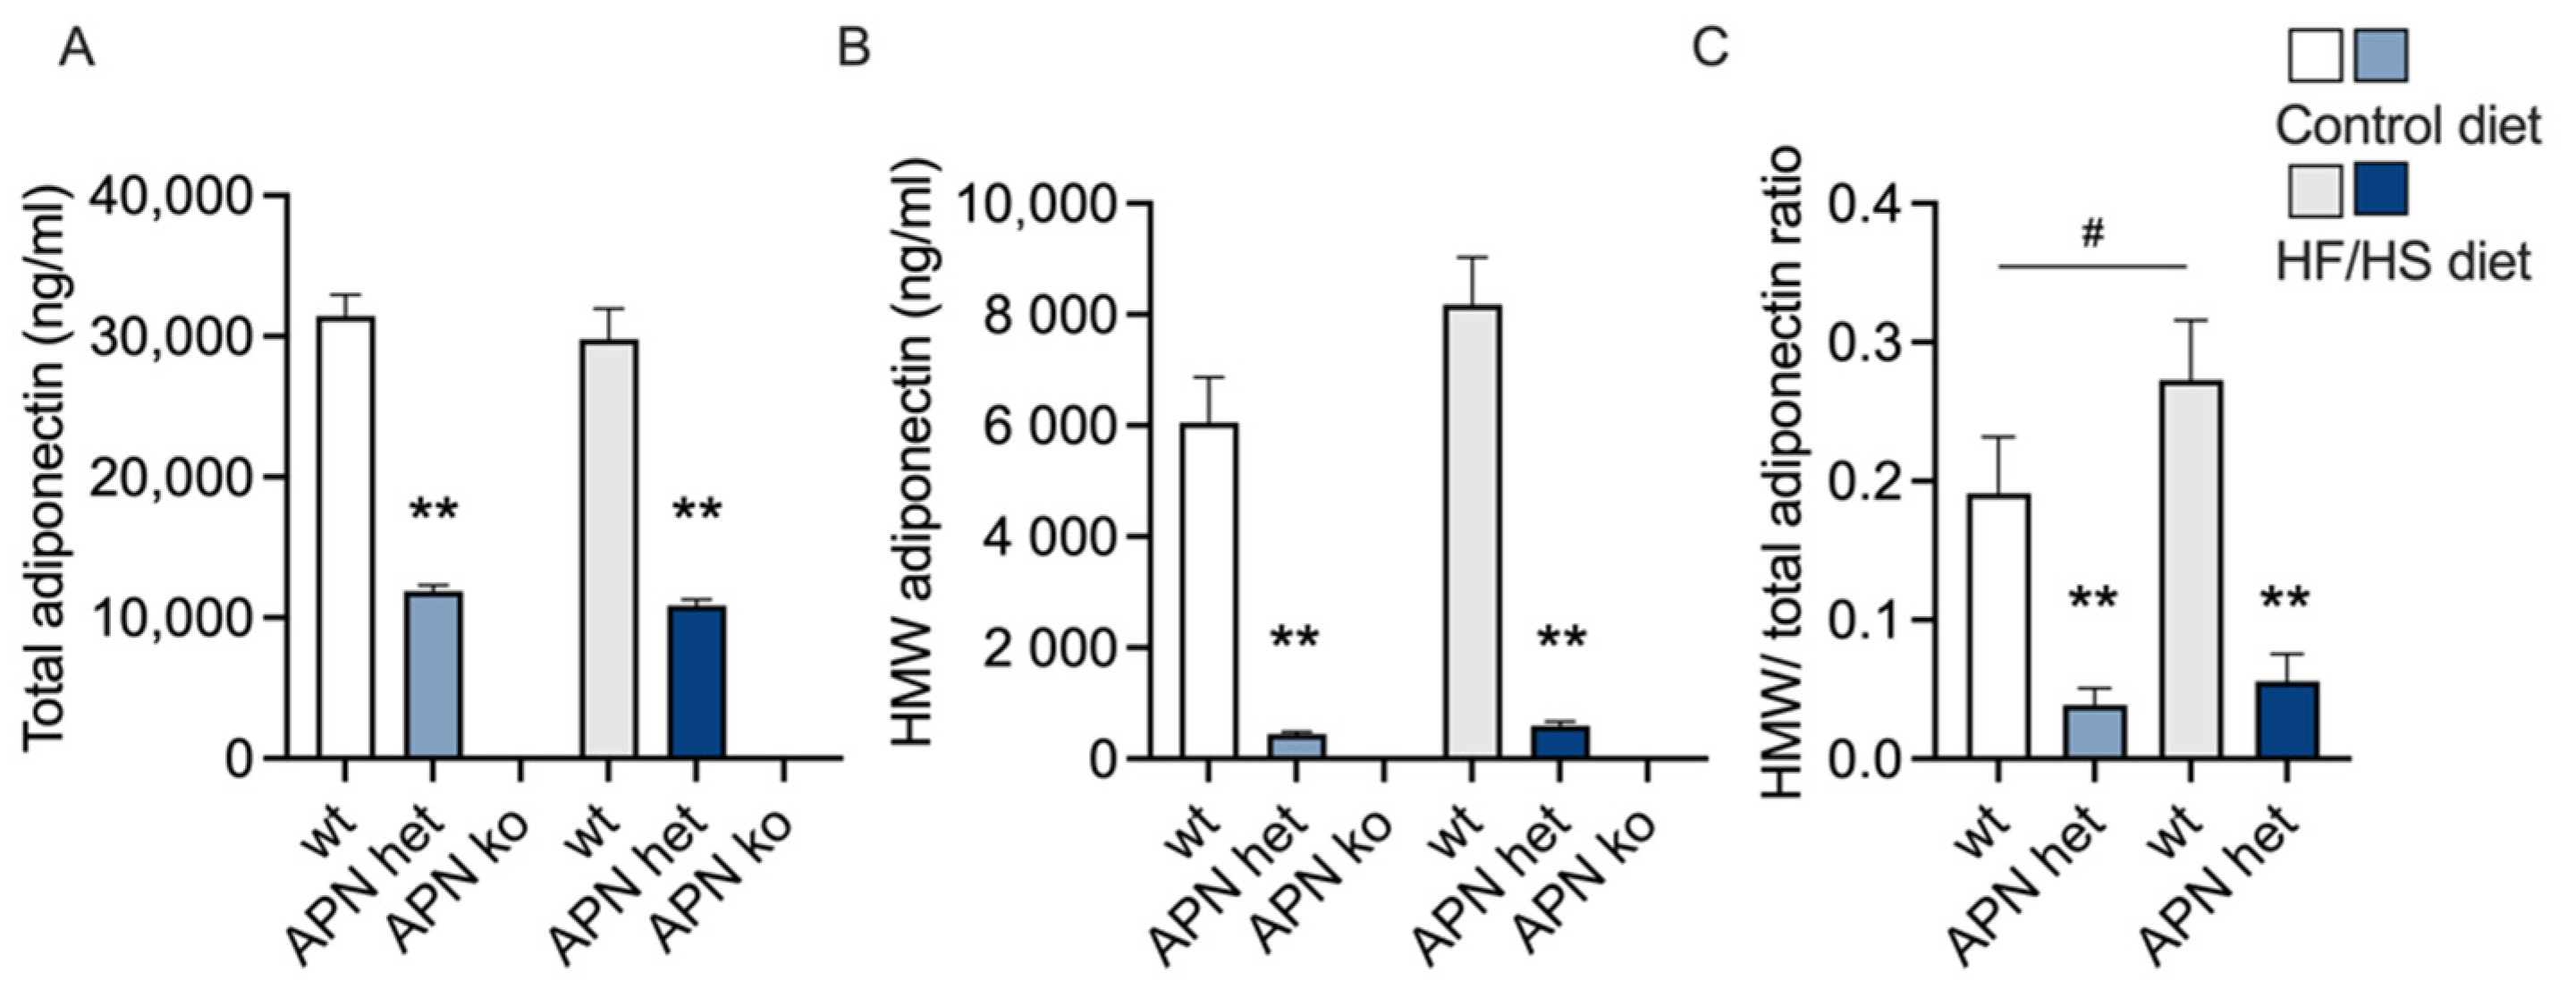
2.1. Maternal Variables
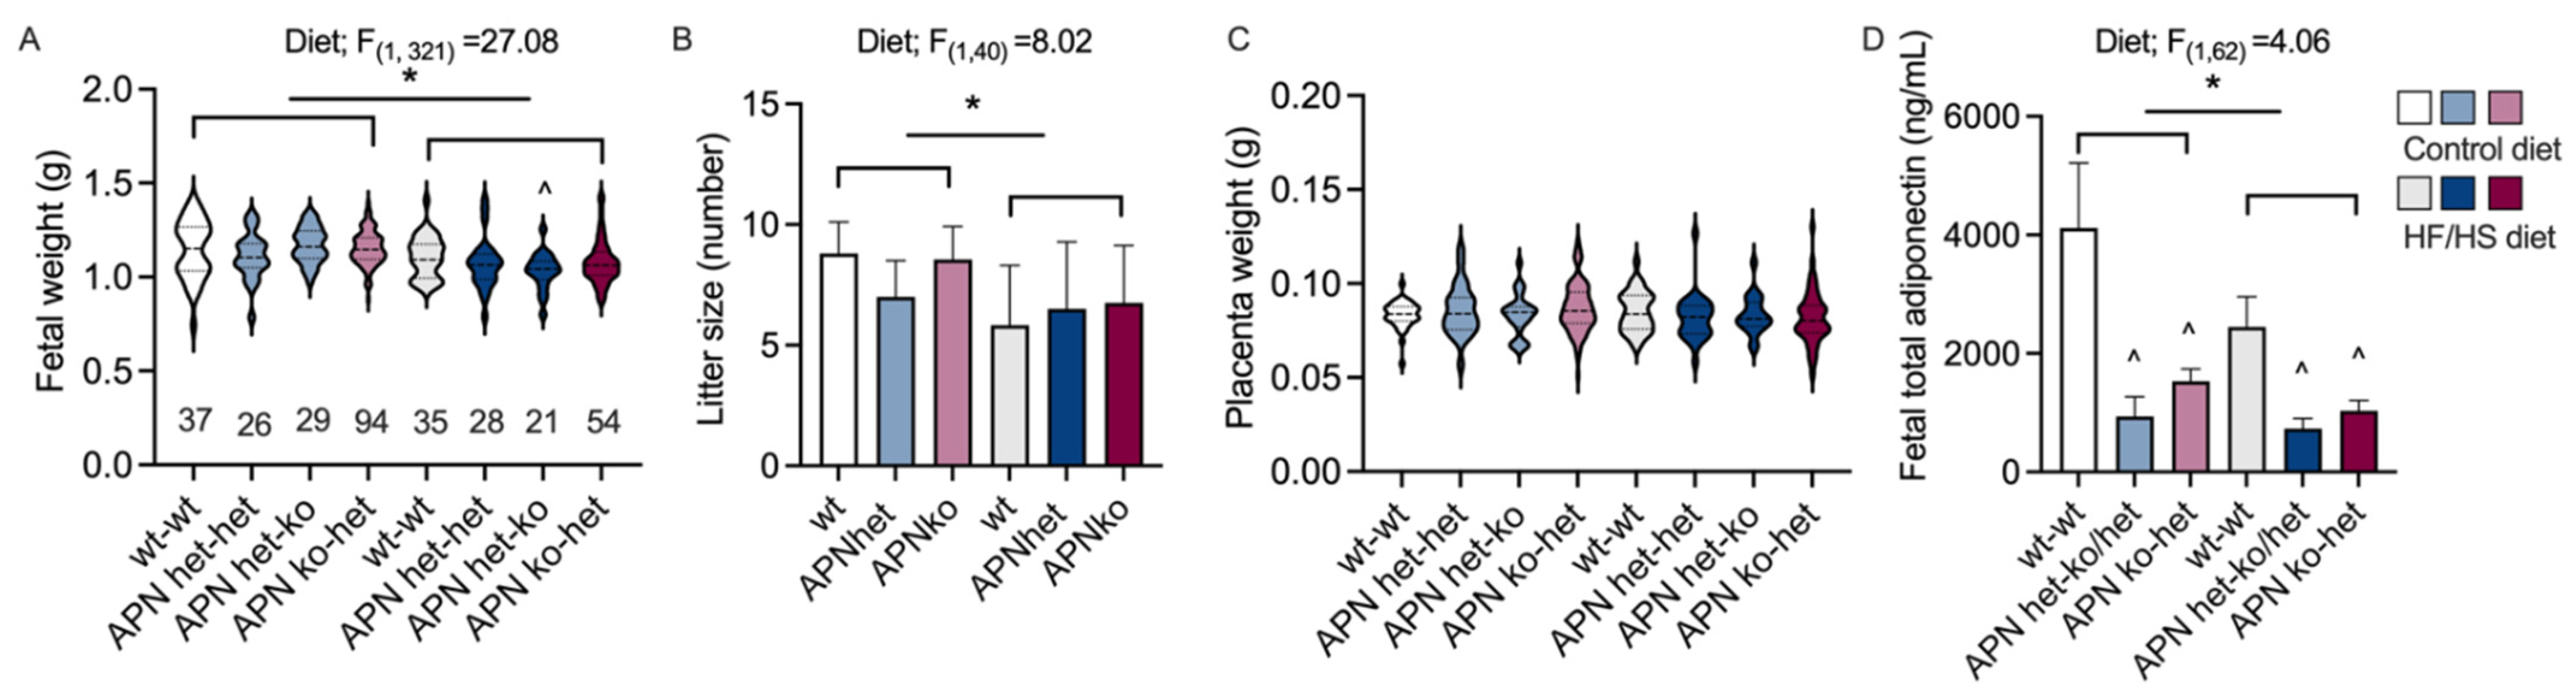
2.2. Fetal Variables
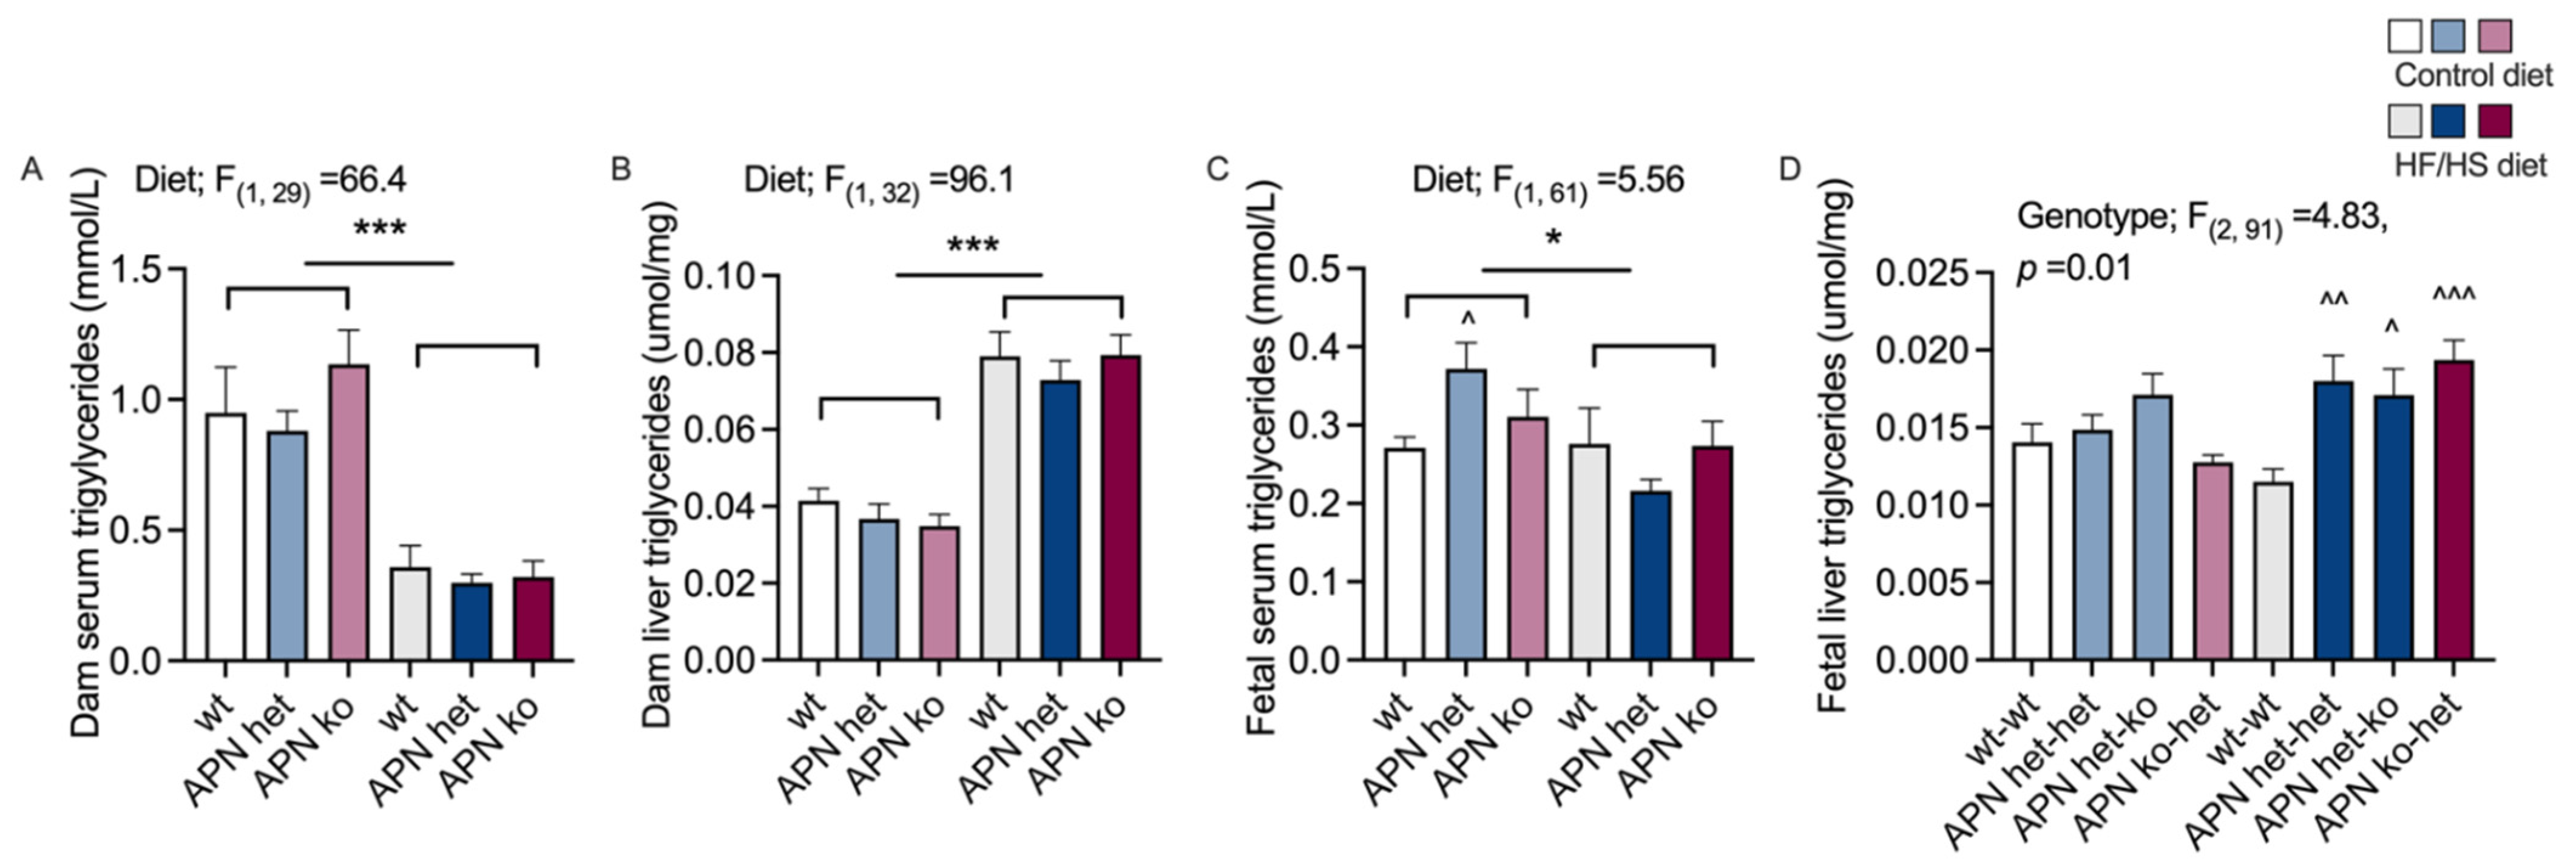
2.3. Triglycerides
2.4. Placenta
3. Discussion
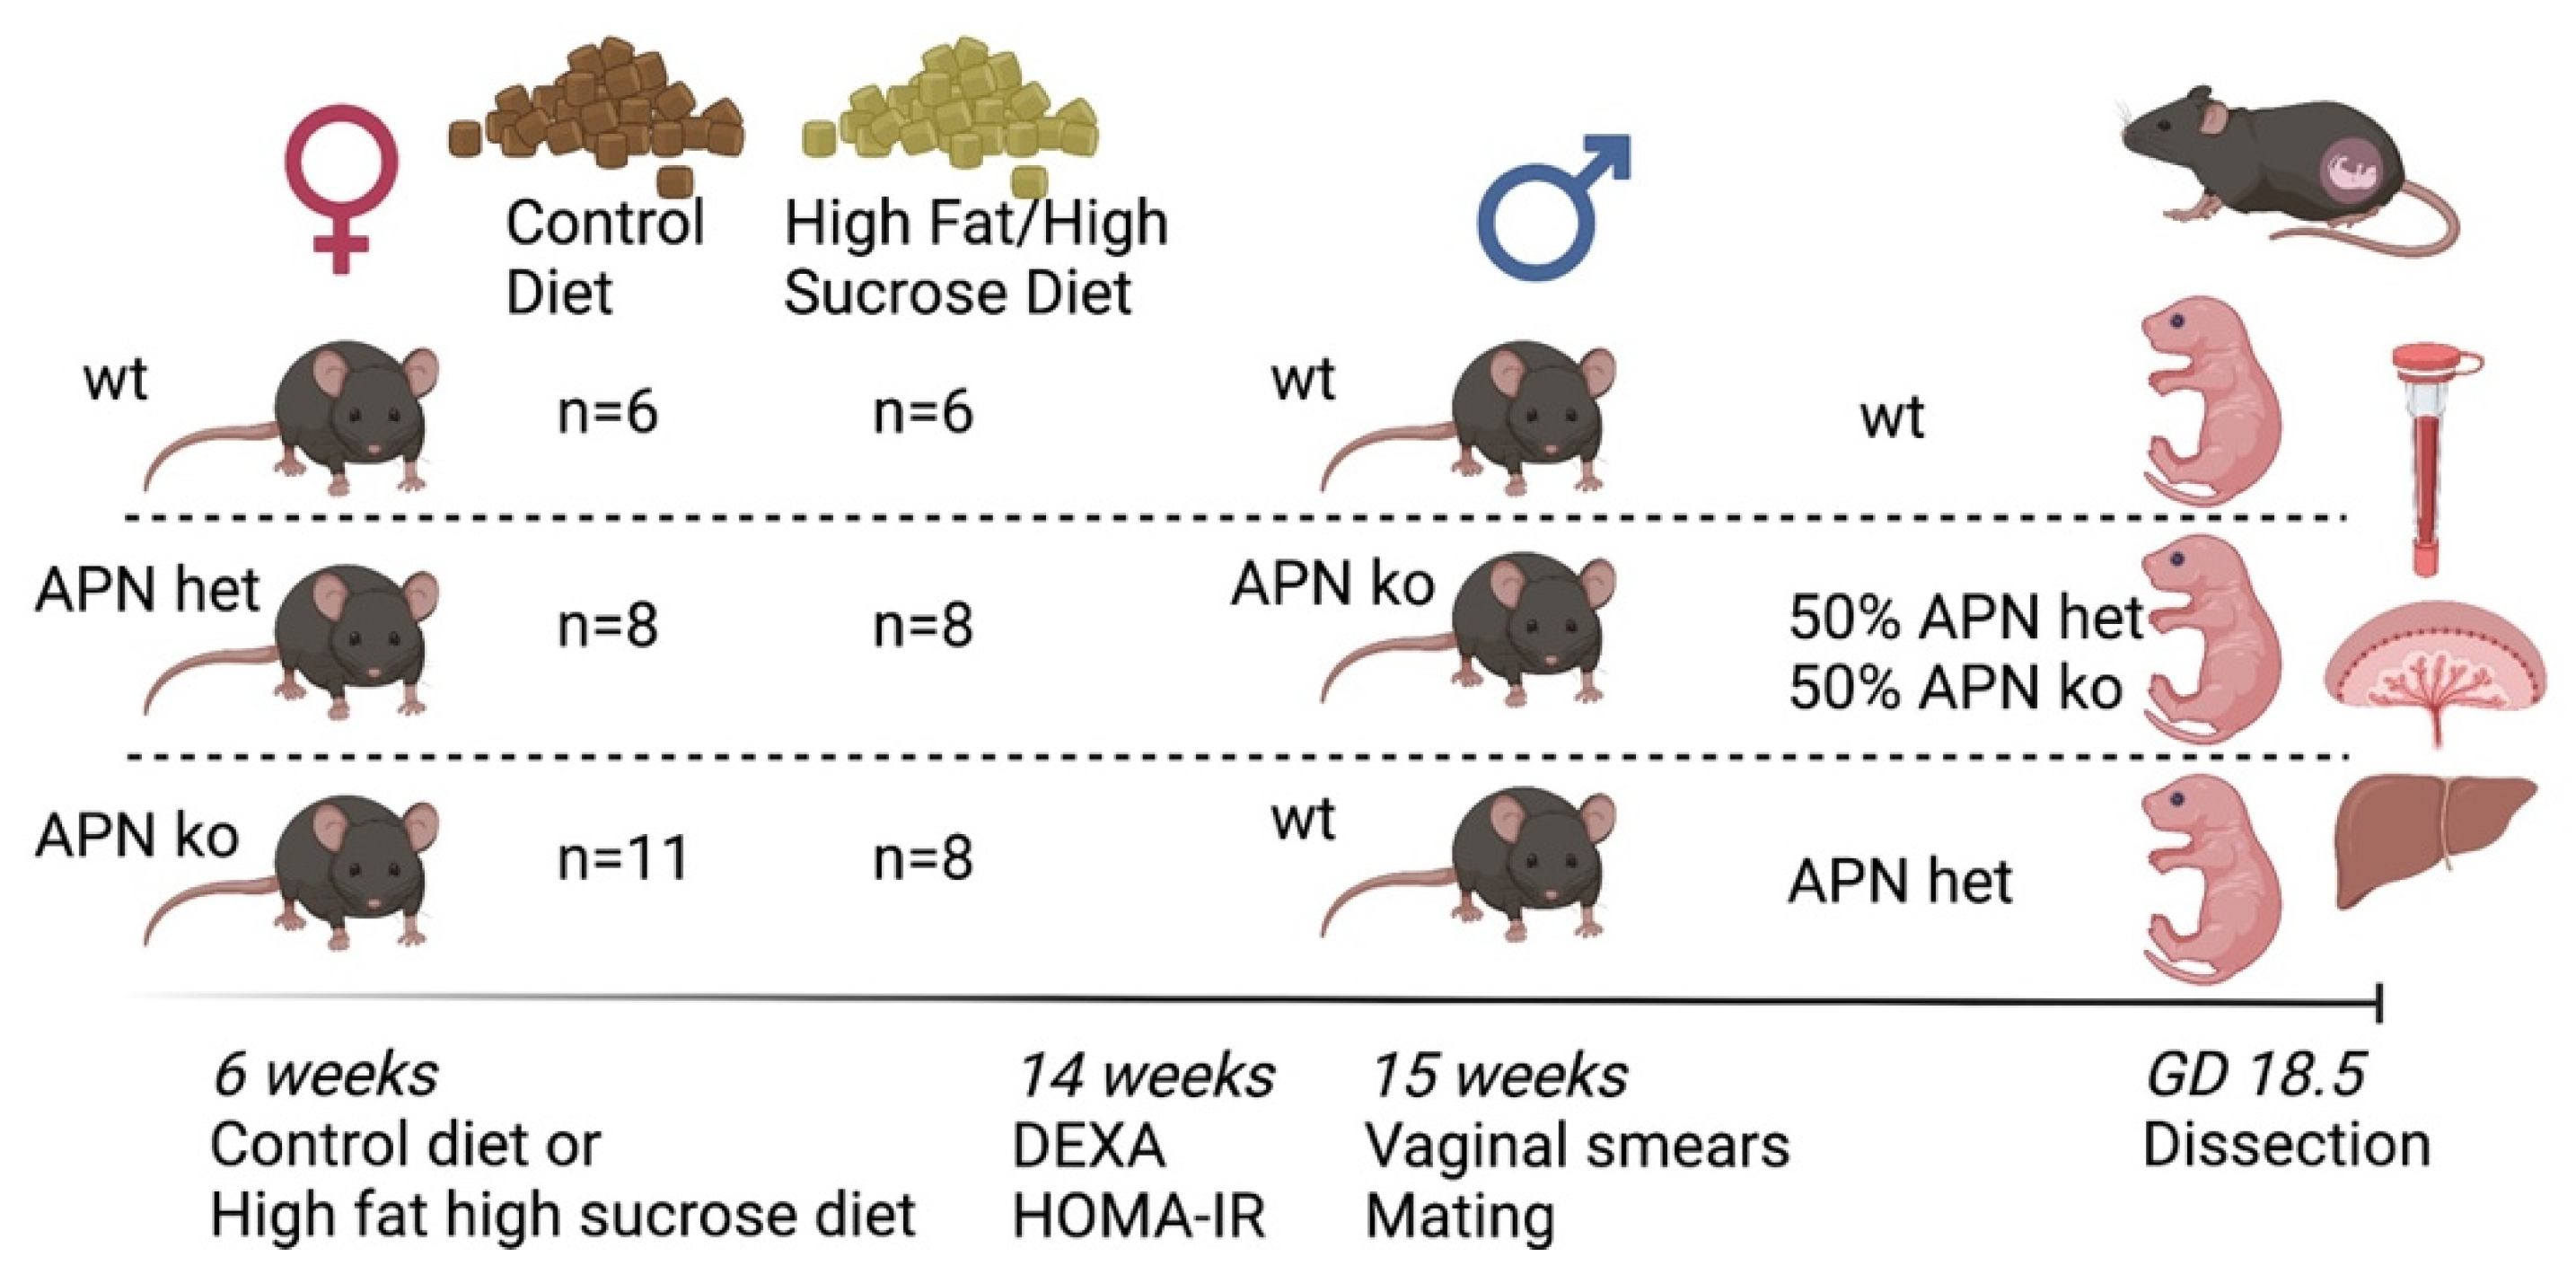
4. Materials and Methods
4.1. Mouse Model
4.2. Experimental Design
4.3. Dual-Energy X-ray Absorptiometry
4.4. Serum Measurements
4.5. Liver and Placenta Triglyceride Content
4.6. Placenta Glycogen Content
4.7. Quantitative Real-Time PCR
4.8. Statistical Analysis
5. Conclusions
Supplementary Materials
Author Contributions
Funding
Institutional Review Board Statement
Data Availability Statement
Acknowledgments
Conflicts of Interest
References
- Barbour, L.A.; McCurdy, C.E.; Hernandez, T.L.; Kirwan, J.P.; Catalano, P.M.; Friedman, J.E. Cellular mechanisms for insulin resistance in normal pregnancy and gestational diabetes. Diabetes Care 2007, 30 (Suppl. S2), S112–S119. [Google Scholar] [CrossRef] [PubMed] [Green Version]
- Kelly, A.C.; Powell, T.L.; Jansson, T. Placental function in maternal obesity. Clin. Sci. 2020, 134, 961–984. [Google Scholar] [CrossRef] [PubMed] [Green Version]
- Johns, E.C.; Denison, F.C.; Reynolds, R.M. The impact of maternal obesity in pregnancy on placental glucocorticoid and macronutrient transport and metabolism. Biochim. Biophys. Acta Mol. Basis Dis. 2020, 1866, 165374. [Google Scholar] [CrossRef] [PubMed] [Green Version]
- Hemond, J.; Robbins, R.B.; Young, P.C. The Effects of Maternal Obesity on Neonates, Infants, Children, Adolescents, and Adults. Clin. Obstet. Gynecol. 2016, 59, 216–227. [Google Scholar] [CrossRef] [PubMed]
- Lager, S.; Powell, T.L. Regulation of nutrient transport across the placenta. J. Pregnancy 2012, 2012, 179827. [Google Scholar] [CrossRef] [PubMed] [Green Version]
- Vaughan, O.R.; Rosario, F.J.; Powell, T.L.; Jansson, T. Regulation of Placental Amino Acid Transport and Fetal Growth. Prog. Mol. Biol. Transl. Sci. 2017, 145, 217–251. [Google Scholar] [CrossRef]
- Campbell, F.M.; Bush, P.G.; Veerkamp, J.H.; Dutta-Roy, A.K. Detection and cellular localization of plasma membrane-associated and cytoplasmic fatty acid-binding proteins in human placenta. Placenta 1998, 19, 409–415. [Google Scholar] [CrossRef]
- Acosta, O.; Ramirez, V.I.; Lager, S.; Gaccioli, F.; Dudley, D.J.; Powell, T.L.; Jansson, T. Increased glucose and placental GLUT-1 in large infants of obese nondiabetic mothers. Am. J. Obstet. Gynecol. 2015, 212, e221–e227. [Google Scholar] [CrossRef]
- Dumolt, J.H.; Powell, T.L.; Jansson, T. Placental Function and the Development of Fetal Overgrowth and Fetal Growth Restriction. Obstet. Gynecol. Clin. N. Am. 2021, 48, 247–266. [Google Scholar] [CrossRef]
- Rosario, F.J.; Schumacher, M.A.; Jiang, J.; Kanai, Y.; Powell, T.L.; Jansson, T. Chronic maternal infusion of full-length adiponectin in pregnant mice down-regulates placental amino acid transporter activity and expression and decreases fetal growth. J. Physiol. 2012, 590, 1495–1509. [Google Scholar] [CrossRef]
- Aye, I.L.; Powell, T.L.; Jansson, T. Review: Adiponectin--the missing link between maternal adiposity, placental transport and fetal growth? Placenta 2013, 34, S40–S45. [Google Scholar] [CrossRef] [PubMed] [Green Version]
- Arroyo-Jousse, V.; Jaramillo, A.; Castaño-Moreno, E.; Lépez, M.; Carrasco-Negüe, K.; Casanello, P. Adipokines underlie the early origins of obesity and associated metabolic comorbidities in the offspring of women with pregestational obesity. Biochim. Biophys. Acta Mol. Basis Dis. 2020, 1866, 165558. [Google Scholar] [CrossRef] [PubMed]
- Qiao, L.; Wattez, J.S.; Lee, S.; Nguyen, A.; Schaack, J.; Hay, W.W., Jr.; Shao, J. Adiponectin Deficiency Impairs Maternal Metabolic Adaptation to Pregnancy in Mice. Diabetes 2017, 66, 1126–1135. [Google Scholar] [CrossRef] [PubMed] [Green Version]
- Aye, I.L.; Rosario, F.J.; Powell, T.L.; Jansson, T. Adiponectin supplementation in pregnant mice prevents the adverse effects of maternal obesity on placental function and fetal growth. Proc. Natl. Acad. Sci. USA 2015, 112, 12858–12863. [Google Scholar] [CrossRef] [PubMed] [Green Version]
- Lekva, T.; Roland, M.C.P.; Michelsen, A.E.; Friis, C.M.; Aukrust, P.; Bollerslev, J.; Henriksen, T.; Ueland, T. Large Reduction in Adiponectin During Pregnancy Is Associated With Large-for-Gestational-Age Newborns. J. Clin. Endocrinol. Metab. 2017, 102, 2552–2559. [Google Scholar] [CrossRef]
- Balachandiran, M.; Bobby, Z.; Dorairajan, G.; Gladwin, V.; Vinayagam, V.; Packirisamy, R.M. Decreased maternal serum adiponectin and increased insulin-like growth factor-1 levels along with increased placental glucose transporter-1 expression in gestational diabetes mellitus: Possible role in fetal overgrowth. Placenta 2021, 104, 71–80. [Google Scholar] [CrossRef]
- Trujillo, M.E.; Scherer, P.E. Adiponectin--journey from an adipocyte secretory protein to biomarker of the metabolic syndrome. J. Intern. Med. 2005, 257, 167–175. [Google Scholar] [CrossRef]
- Andersson-Hall, U.; Svedin, P.; Svensson, H.; Lönn, M.; Mallard, C.; Holmäng, A. Longitudinal changes in adipokines and free leptin index during and after pregnancy in women with obesity. Int. J. Obes. 2020, 44, 675–683. [Google Scholar] [CrossRef]
- Lee, B.; Shao, J. Adiponectin and energy homeostasis. Rev. Endocr. Metab. Disord. 2014, 15, 149–156. [Google Scholar] [CrossRef]
- Howell, K.R.; Powell, T.L. Effects of maternal obesity on placental function and fetal development. Reproduction 2017, 153, R97–R108. [Google Scholar] [CrossRef]
- Retnakaran, R.; Ye, C.; Hanley, A.J.; Connelly, P.W.; Sermer, M.; Zinman, B.; Hamilton, J.K. Effect of maternal weight, adipokines, glucose intolerance and lipids on infant birth weight among women without gestational diabetes mellitus. CMAJ 2012, 184, 1353–1360. [Google Scholar] [CrossRef] [PubMed] [Green Version]
- Yalinbas, E.E.; Binay, C.; Simsek, E.; Aksit, M.A. The Role of Umbilical Cord Blood Concentration of IGF-I, IGF-II, Leptin, Adiponectin, Ghrelin, Resistin, and Visfatin in Fetal Growth. Am. J. Perinatol. 2019, 36, 600–608. [Google Scholar] [CrossRef] [PubMed]
- Vernini, J.M.; Moreli, J.B.; Costa, R.A.A.; Negrato, C.A.; Rudge, M.V.C.; Calderon, I.M.P. Maternal adipokines and insulin as biomarkers of pregnancies complicated by overweight and obesity. Diabetol. Metab. Syndr. 2016, 8, 68. [Google Scholar] [CrossRef] [PubMed] [Green Version]
- Mazurek, D.; Bronkowska, M. Maternal Anthropometric Factors and Circulating Adipokines as Predictors of Birth Weight and Length. Int. J. Environ. Res. Public Health 2020, 17, 4799. [Google Scholar] [CrossRef] [PubMed]
- Jara, A.; Dreher, M.; Porter, K.; Christian, L.M. The association of maternal obesity and race with serum adipokines in pregnancy and postpartum: Implications for gestational weight gain and infant birth weight. Brain. Behav. Immun. Health 2020, 3, 100053. [Google Scholar] [CrossRef] [PubMed]
- Farias, D.R.; Poston, L.; Franco-Sena, A.B.; Moura da Silva, A.A.; Pinto, T.; de Oliveira, L.C.; Kac, G. Maternal lipids and leptin concentrations are associated with large-for-gestational-age births: A prospective cohort study. Sci. Rep. 2017, 7, 804. [Google Scholar] [CrossRef] [Green Version]
- Han, L.; Li, B.; Xu, X.; Liu, S.; Li, Z.; Li, M.; Wang, D. Umbilical Cord Blood Adiponectin, Leptin, Insulin, and Ghrelin in Premature Infants and Their Association With Birth Outcomes. Front. Endocrinol. 2021, 12, 738964. [Google Scholar] [CrossRef]
- Tan, K.; Tint, M.T.; Michael, N.; Yap, F.; Chong, Y.S.; Tan, K.H.; Godfrey, K.M.; Larbi, A.; Lee, Y.S.; Chan, S.Y.; et al. Determinants of cord blood adipokines and association with neonatal abdominal adipose tissue distribution. Int. J. Obes. 2022, 46, 637–645. [Google Scholar] [CrossRef]
- Schneider, C.R.; Catalano, P.M.; Biggio, J.R.; Gower, B.A.; Chandler-Laney, P.C. Associations of neonatal adiponectin and leptin with growth and body composition in African American infants. Pediatr. Obes. 2018, 13, 485–491. [Google Scholar] [CrossRef]
- Qiao, L.; Yoo, H.S.; Madon, A.; Kinney, B.; Hay, W.W., Jr.; Shao, J. Adiponectin enhances mouse fetal fat deposition. Diabetes 2012, 61, 3199–3207. [Google Scholar] [CrossRef] [Green Version]
- Qiao, L.; Wattez, J.S.; Lee, S.; Guo, Z.; Schaack, J.; Hay, W.W., Jr.; Zita, M.M.; Parast, M.; Shao, J. Knockout maternal adiponectin increases fetal growth in mice: Potential role for trophoblast IGFBP-1. Diabetologia 2016, 59, 2417–2425. [Google Scholar] [CrossRef] [PubMed] [Green Version]
- Xia, J.Y.; Sun, K.; Hepler, C.; Ghaben, A.L.; Gupta, R.K.; An, Y.A.; Holland, W.L.; Morley, T.S.; Adams, A.C.; Gordillo, R.; et al. Acute loss of adipose tissue-derived adiponectin triggers immediate metabolic deterioration in mice. Diabetologia 2018, 61, 932–941. [Google Scholar] [CrossRef] [PubMed] [Green Version]
- Nawrocki, A.R.; Rajala, M.W.; Tomas, E.; Pajvani, U.B.; Saha, A.K.; Trumbauer, M.E.; Pang, Z.; Chen, A.S.; Ruderman, N.B.; Chen, H.; et al. Mice lacking adiponectin show decreased hepatic insulin sensitivity and reduced responsiveness to peroxisome proliferator-activated receptor gamma agonists. J. Biol. Chem. 2006, 281, 2654–2660. [Google Scholar] [CrossRef] [PubMed] [Green Version]
- Di Filippo, D.; Wanniarachchi, T.; Wei, D.; Yang, J.J.; Mc Sweeney, A.; Havard, A.; Henry, A.; Welsh, A. The diagnostic indicators of gestational diabetes mellitus from second trimester to birth: A systematic review. Clin. Diabetes Endocrinol. 2021, 7, 19. [Google Scholar] [CrossRef]
- Lorenzo-Almorós, A.; Hang, T.; Peiró, C.; Soriano-Guillén, L.; Egido, J.; Tuñón, J.; Lorenzo, Ó. Predictive and diagnostic biomarkers for gestational diabetes and its associated metabolic and cardiovascular diseases. Cardiovasc. Diabetol. 2019, 18, 140. [Google Scholar] [CrossRef]
- Moyce Gruber, B.L.; Cole, L.K.; Xiang, B.; Fonseca, M.A.; Klein, J.; Hatch, G.M.; Doucette, C.A.; Dolinsky, V.W. Adiponectin deficiency induces hepatic steatosis during pregnancy and gestational diabetes in mice. Diabetologia 2022, 65, 733–747. [Google Scholar] [CrossRef]
- Sivan, E.; Mazaki-Tovi, S.; Pariente, C.; Efraty, Y.; Schiff, E.; Hemi, R.; Kanety, H. Adiponectin in human cord blood: Relation to fetal birth weight and gender. J. Clin. Endocrinol. Metab. 2003, 88, 5656–5660. [Google Scholar] [CrossRef] [Green Version]
- Desoye, G.; Hauguel-de Mouzon, S. The human placenta in gestational diabetes mellitus: The insulin and cytokine network. Diabetes Care 2007, 30 (Suppl. S2), S120–S126. [Google Scholar] [CrossRef] [Green Version]
- Andersson-Hall, U.K.; Pivodic, A.; de Mare, H.K.; Pernilla Svedin, J.; Carina Mallard, E.; Albertsson-Wikland, K.G.; Holmang, A.B. Infant body composition relationship to maternal adipokines and fat mass: The PONCH study. Pediatr. Res. 2021, 89, 1756–1764. [Google Scholar] [CrossRef]
- Wu, Y.; Chanclon, B.; Micallef, P.; Stener-Victorin, E.; Wernstedt Asterholm, I.; Benrick, A. Maternal adiponectin prevents visceral adiposity and adipocyte hypertrophy in prenatal androgenized female mice. FASEB J. 2021, 35, e21299. [Google Scholar] [CrossRef]
- Wang, Q.A.; Tao, C.; Gupta, R.K.; Scherer, P.E. Tracking adipogenesis during white adipose tissue development, expansion and regeneration. Nat. Med. 2013, 19, 1338–1344. [Google Scholar] [CrossRef] [PubMed]
- Mazaki-Tovi, S.; Kanety, H.; Pariente, C.; Hemi, R.; Efraty, Y.; Schiff, E.; Shoham, A.; Sivan, E. Determining the source of fetal adiponectin. J. Reprod. Med. 2007, 52, 774–778. [Google Scholar] [PubMed]
- Dutta-Roy, A.K. Transport mechanisms for long-chain polyunsaturated fatty acids in the human placenta. Am. J. Clin. Nutr. 2000, 71, 315S–322S. [Google Scholar] [CrossRef] [PubMed] [Green Version]
- Schaiff, W.T.; Knapp, F.F., Jr.; Barak, Y.; Biron-Shental, T.; Nelson, D.M.; Sadovsky, Y. Ligand-activated peroxisome proliferator activated receptor gamma alters placental morphology and placental fatty acid uptake in mice. Endocrinology 2007, 148, 3625–3634. [Google Scholar] [CrossRef] [PubMed]
- Benrick, A.; Chanclon, B.; Micallef, P.; Wu, Y.; Hadi, L.; Shelton, J.M.; Stener-Victorin, E.; Wernstedt Asterholm, I. Adiponectin protects against development of metabolic disturbances in a PCOS mouse model. Proc. Natl. Acad. Sci. USA 2017, 114, E7187–E7196. [Google Scholar] [CrossRef] [PubMed] [Green Version]
- Rosario, F.J.; Kanai, Y.; Powell, T.L.; Jansson, T. Increased placental nutrient transport in a novel mouse model of maternal obesity with fetal overgrowth. Obesity (Silver Spring) 2015, 23, 1663–1670. [Google Scholar] [CrossRef] [Green Version]
- Caligioni, C.S. Assessing reproductive status/stages in mice. Curr. Protoc. Neurosci. 2009, 48, A-4I. [Google Scholar] [CrossRef] [Green Version]
- Nagy, T.R.; Clair, A.L. Precision and accuracy of dual-energy X-ray absorptiometry for determining in vivo body composition of mice. Obes. Res. 2000, 8, 392–398. [Google Scholar] [CrossRef]


| Maternal Variables | Wt CD | APN Het CD | APN Ko CD | Wt HF/HS | APN Het HF/HS | APN Ko HF/HS | Two-Way ANOVA |
|---|---|---|---|---|---|---|---|
| n = 6 | n = 8 | n = 11 | n = 6 | n = 8 | n = 8 | ||
| Body weight (g) | 40.9 ± 1.0 | 35.0 ± 0.9 ** | 41.2 ± 1.4 | 37.3 ± 1.9 | 38.3 ± 1.1 | 39.9 ± 0.7 | |
| Blood glucose (mmol/L) | 5.58 ± 0.16 | 6.66 ± 0.52 | 6.77 ± 0.42 * | 6.26 ± 0.45 | 6.33 ± 0.20 | 5.49 ± 0.29 | |
| Insulin (µg/L) | 1.29 ± 0.33 | 1.16 ± 0.28 | 1.37 ± 0.36 | 0.78 ±0.25 | 1.98 ± 0.40 | 0.93 ± 0.29 | |
| Heart (mg) | 115 ± 3 | 113 ± 3 | 124 ± 4 | 131 ± 7 | 135 ± 4 | 150 ± 6 | a; F(1, 39) = 29.8, p < 0.001 b; F(2, 39) = 5.57, p = 0.007 |
| Subcutaneous inguinal fat (g) | 0.62 ± 0.05 | 0.39 ± 0.03 ** | 0.52 ± 0.05 | 0.86 ± 0.18 | 0.72 ± 0.07 | 0.89 ± 0.10 | a; F(1, 38) = 19.9, p < 0.001 |
| Mesenteric fat (g) | 0.38 ± 0.03 | 0.29 ± 0.02 | 0.32 ± 0.04 | 0.35 ± 0.08 | 0.32 ± 0.03 | 0.39 ± 0.07 | |
| Brown adipose tissue (mg) | 62.6 ± 3.4 | 58.7 ± 4.6 | 72.3 ± 7.1 | 80.6 ± 8.7 | 69.4 ± 1.9 | 78.6 ± 6.6 | a; F(1, 39) = 5.73, p = 0.022 |
| Liver (g) | 1.57 ± 0.06 | 1.58 ± 0.07 | 1.74 ± 0.05 | 2.17 ± 0.12 | 2.32 ± 0.13 | 2.43 ± 0.142 | a; F(1, 39) = 65.9, p < 0.001 |
Publisher’s Note: MDPI stays neutral with regard to jurisdictional claims in published maps and institutional affiliations. |
© 2022 by the authors. Licensee MDPI, Basel, Switzerland. This article is an open access article distributed under the terms and conditions of the Creative Commons Attribution (CC BY) license (https://creativecommons.org/licenses/by/4.0/).
Share and Cite
Mohan Shrestha, M.; Wermelin, S.; Stener-Victorin, E.; Wernstedt Asterholm, I.; Benrick, A. Adiponectin Deficiency Alters Placenta Function but Does Not Affect Fetal Growth in Mice. Int. J. Mol. Sci. 2022, 23, 4939. https://doi.org/10.3390/ijms23094939
Mohan Shrestha M, Wermelin S, Stener-Victorin E, Wernstedt Asterholm I, Benrick A. Adiponectin Deficiency Alters Placenta Function but Does Not Affect Fetal Growth in Mice. International Journal of Molecular Sciences. 2022; 23(9):4939. https://doi.org/10.3390/ijms23094939
Chicago/Turabian StyleMohan Shrestha, Man, Sanne Wermelin, Elisabet Stener-Victorin, Ingrid Wernstedt Asterholm, and Anna Benrick. 2022. "Adiponectin Deficiency Alters Placenta Function but Does Not Affect Fetal Growth in Mice" International Journal of Molecular Sciences 23, no. 9: 4939. https://doi.org/10.3390/ijms23094939
APA StyleMohan Shrestha, M., Wermelin, S., Stener-Victorin, E., Wernstedt Asterholm, I., & Benrick, A. (2022). Adiponectin Deficiency Alters Placenta Function but Does Not Affect Fetal Growth in Mice. International Journal of Molecular Sciences, 23(9), 4939. https://doi.org/10.3390/ijms23094939