
Systematic Review and Meta-Analysis of Mass Spectrometry Proteomics Applied to Human Peripheral Fluids to Assess Potential Biomarkers of Schizophrenia

 , , , , , and
Abstract
1. Introduction
1.1. Neuropsychiatric Disorders
1.2. Schizophrenia
1.3. The Search for Biomarkers
1.4. Biological Markers in Psychiatric Disorders
1.5. Mass Spectrometry
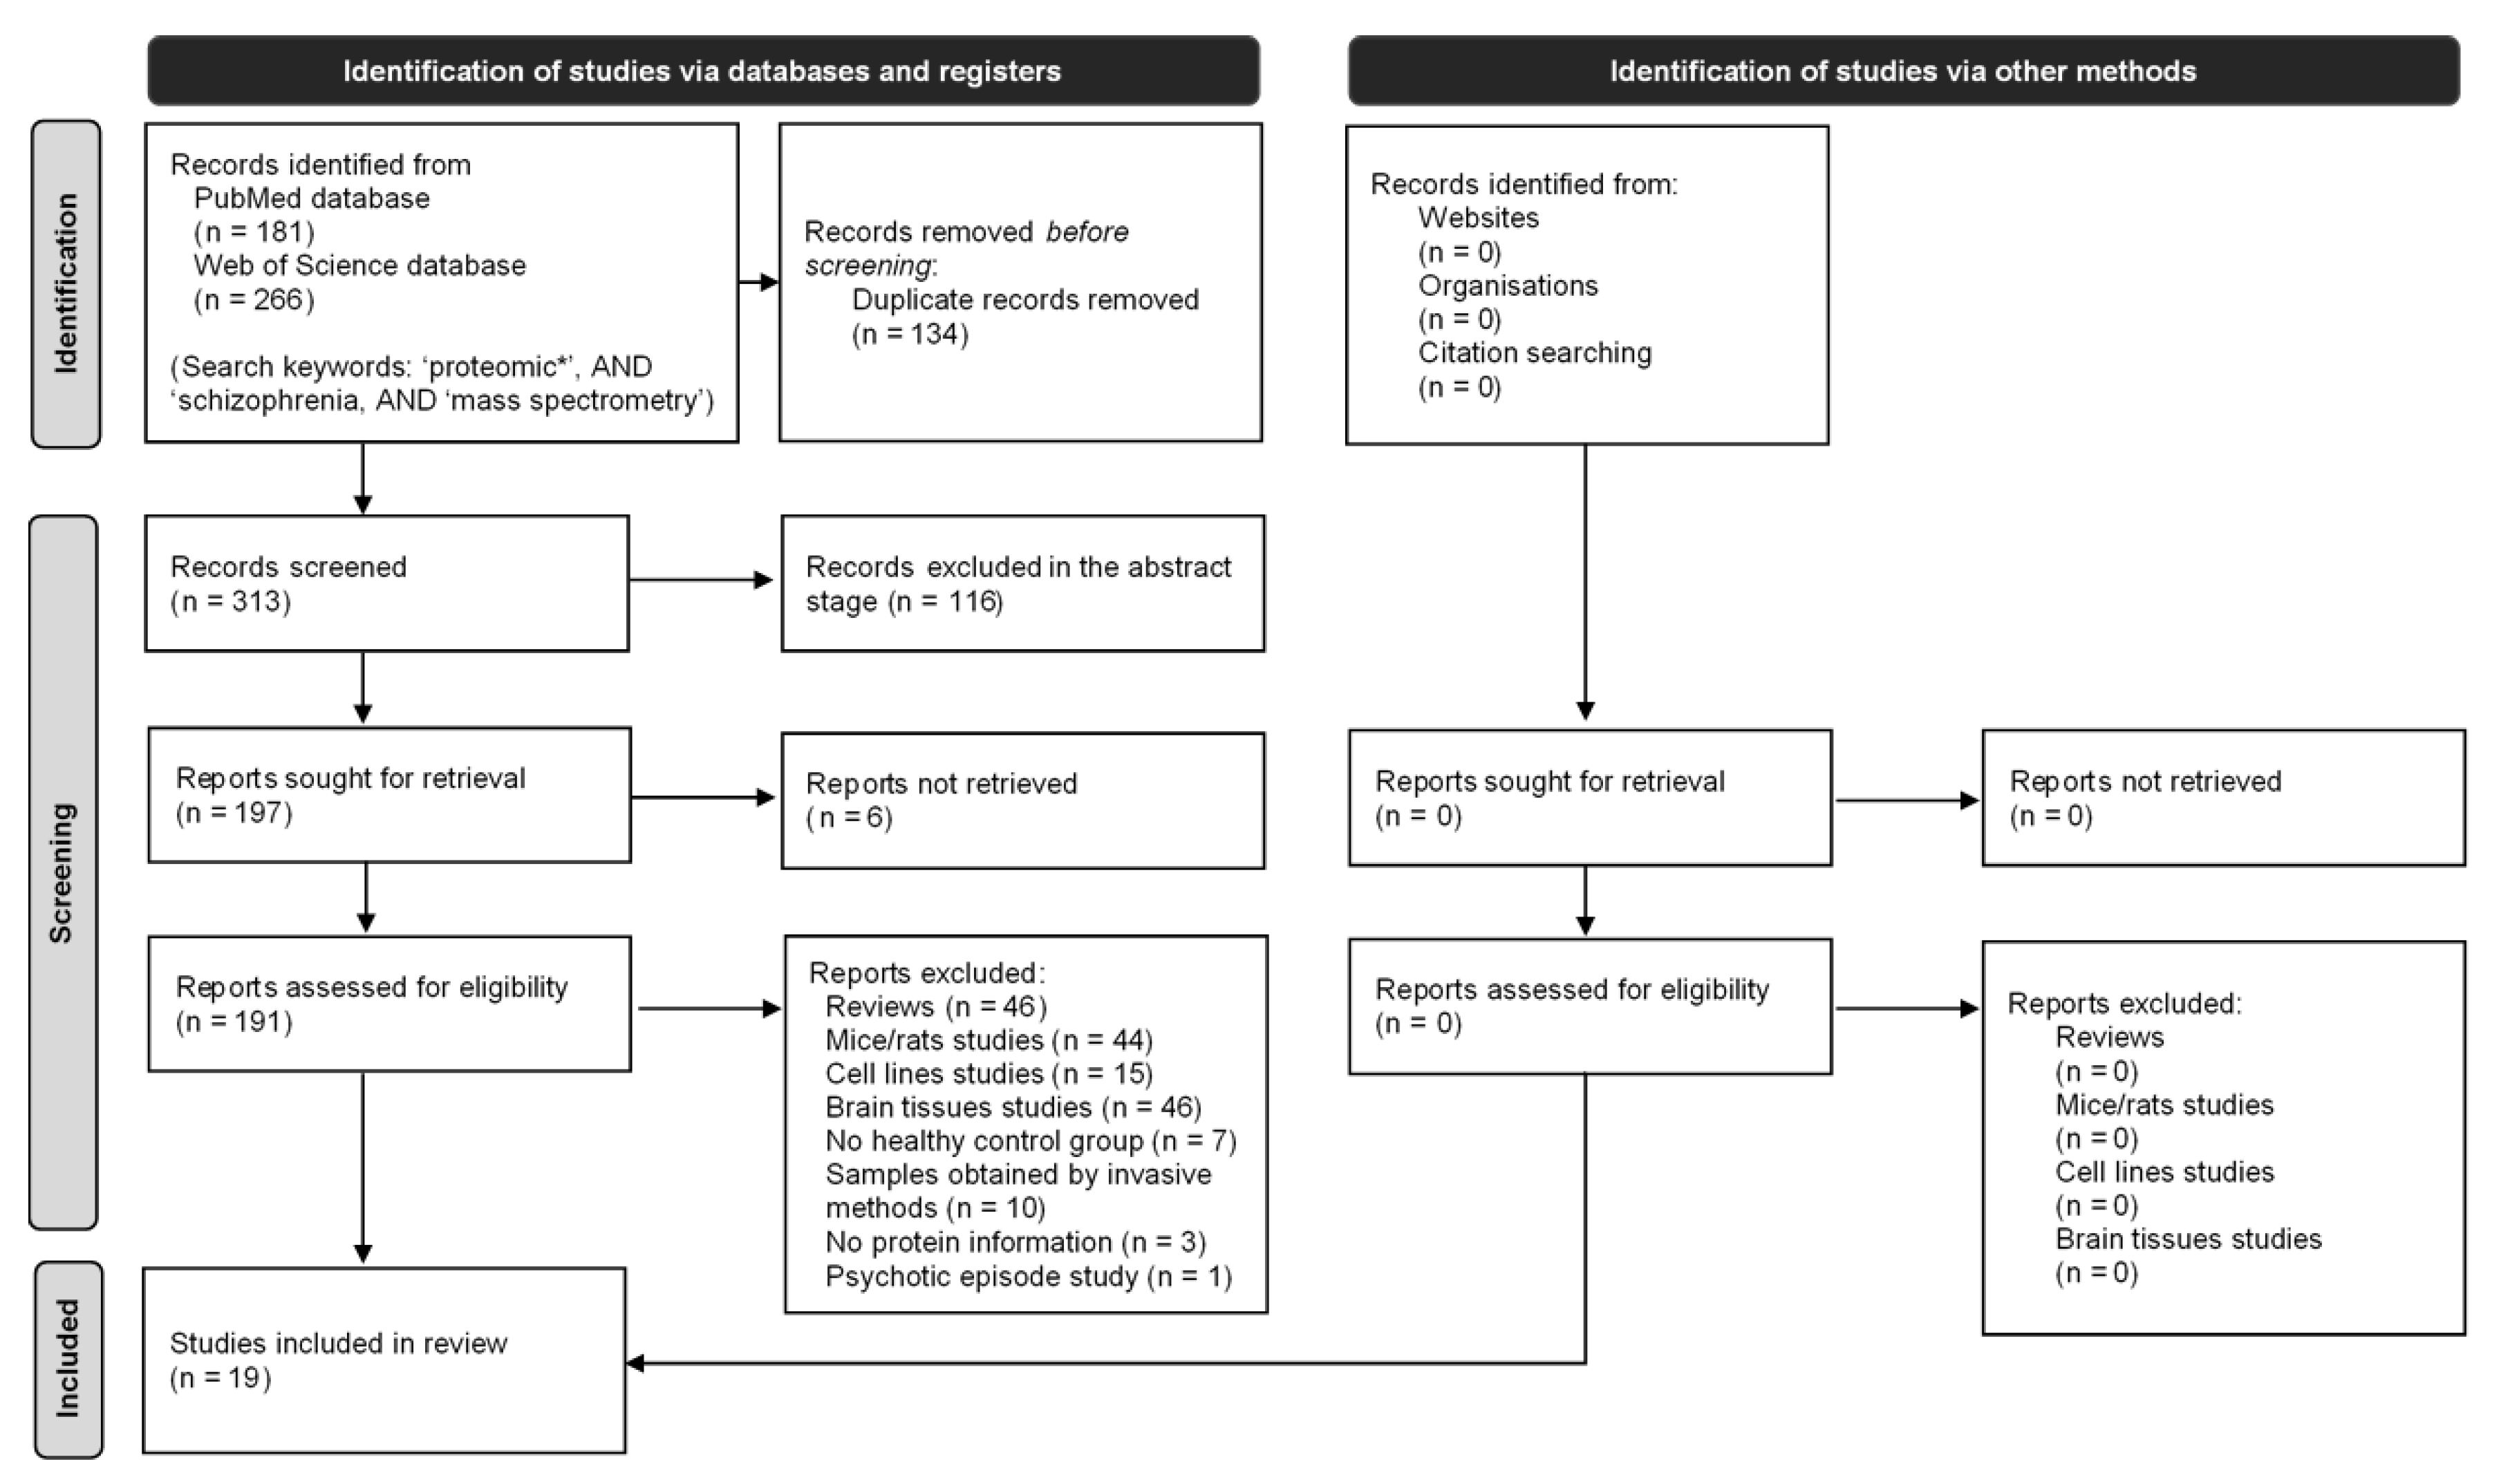
2. Method
2.1. Search Strategy
2.2. Eligibility Criteria
2.3. Data Extraction
2.4. Quality of Evidence
2.5. Statistical Analysis and Gene Ontology Analysis
3. Results
3.1. Characteristics of Included Articles
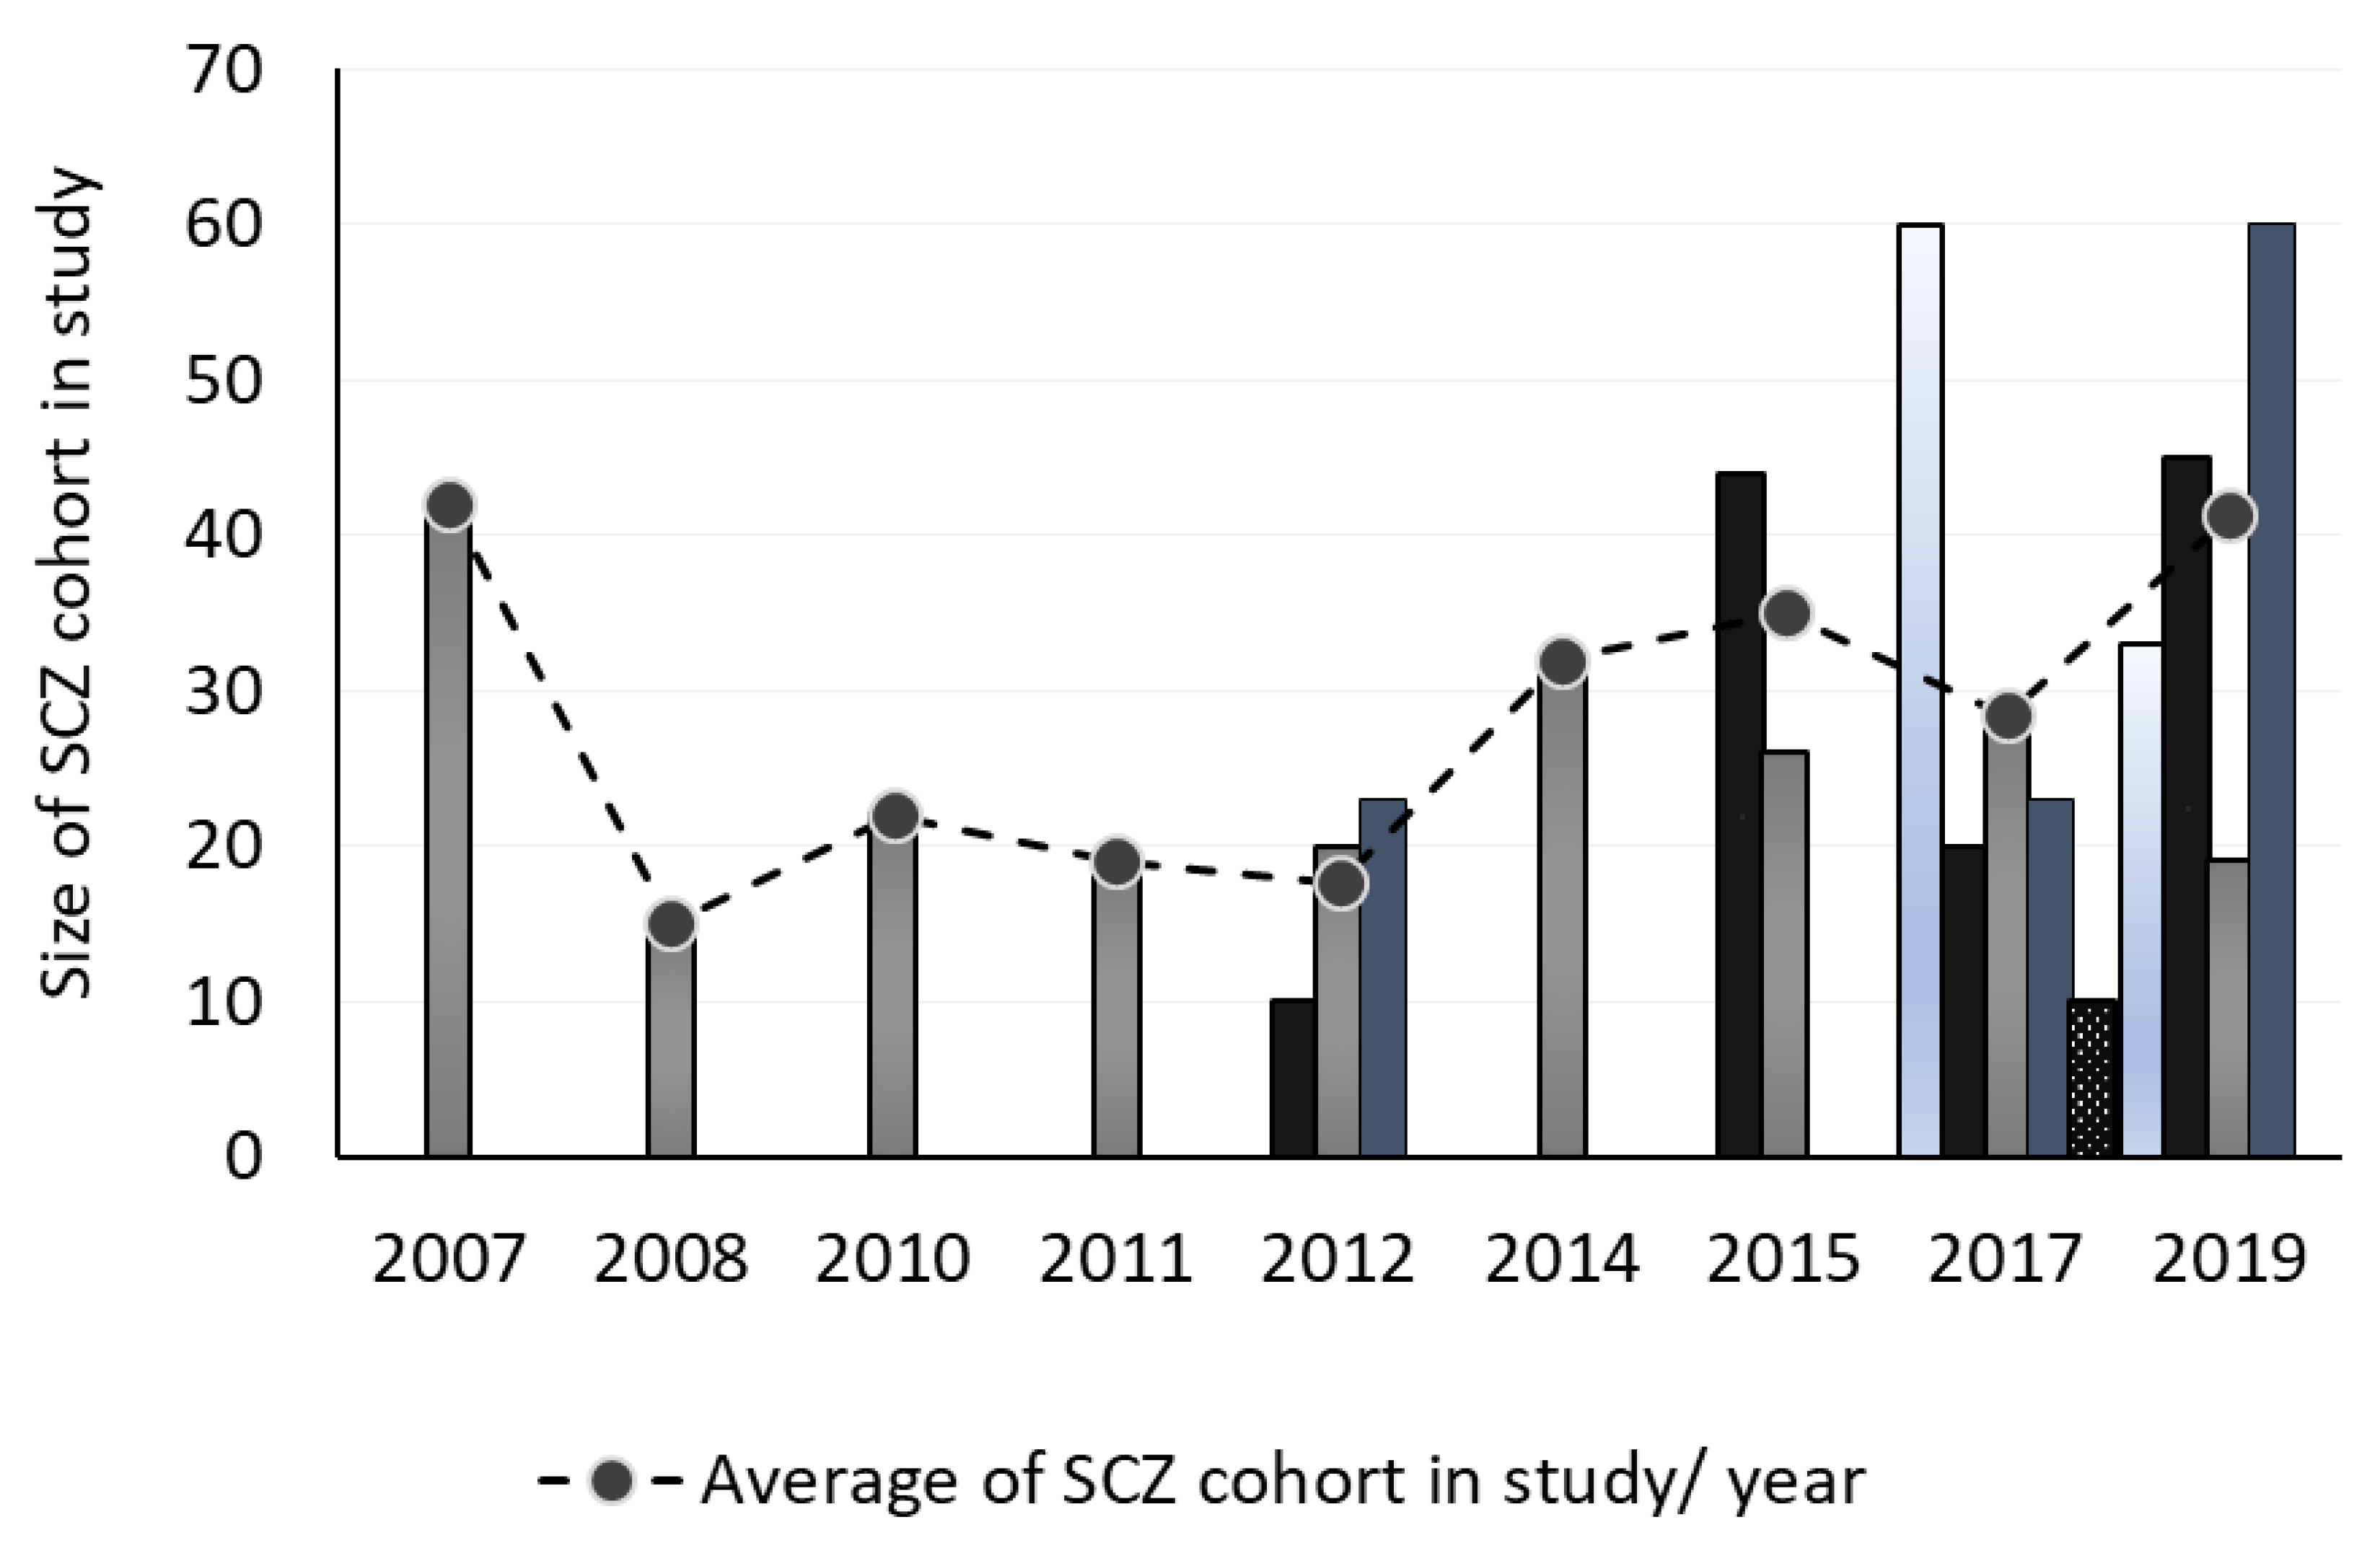
3.2. Cohort Information
3.3. Number of Samples
3.4. Diagnosis Criteria
3.5. Age
3.6. Gender
3.7. Illness Duration
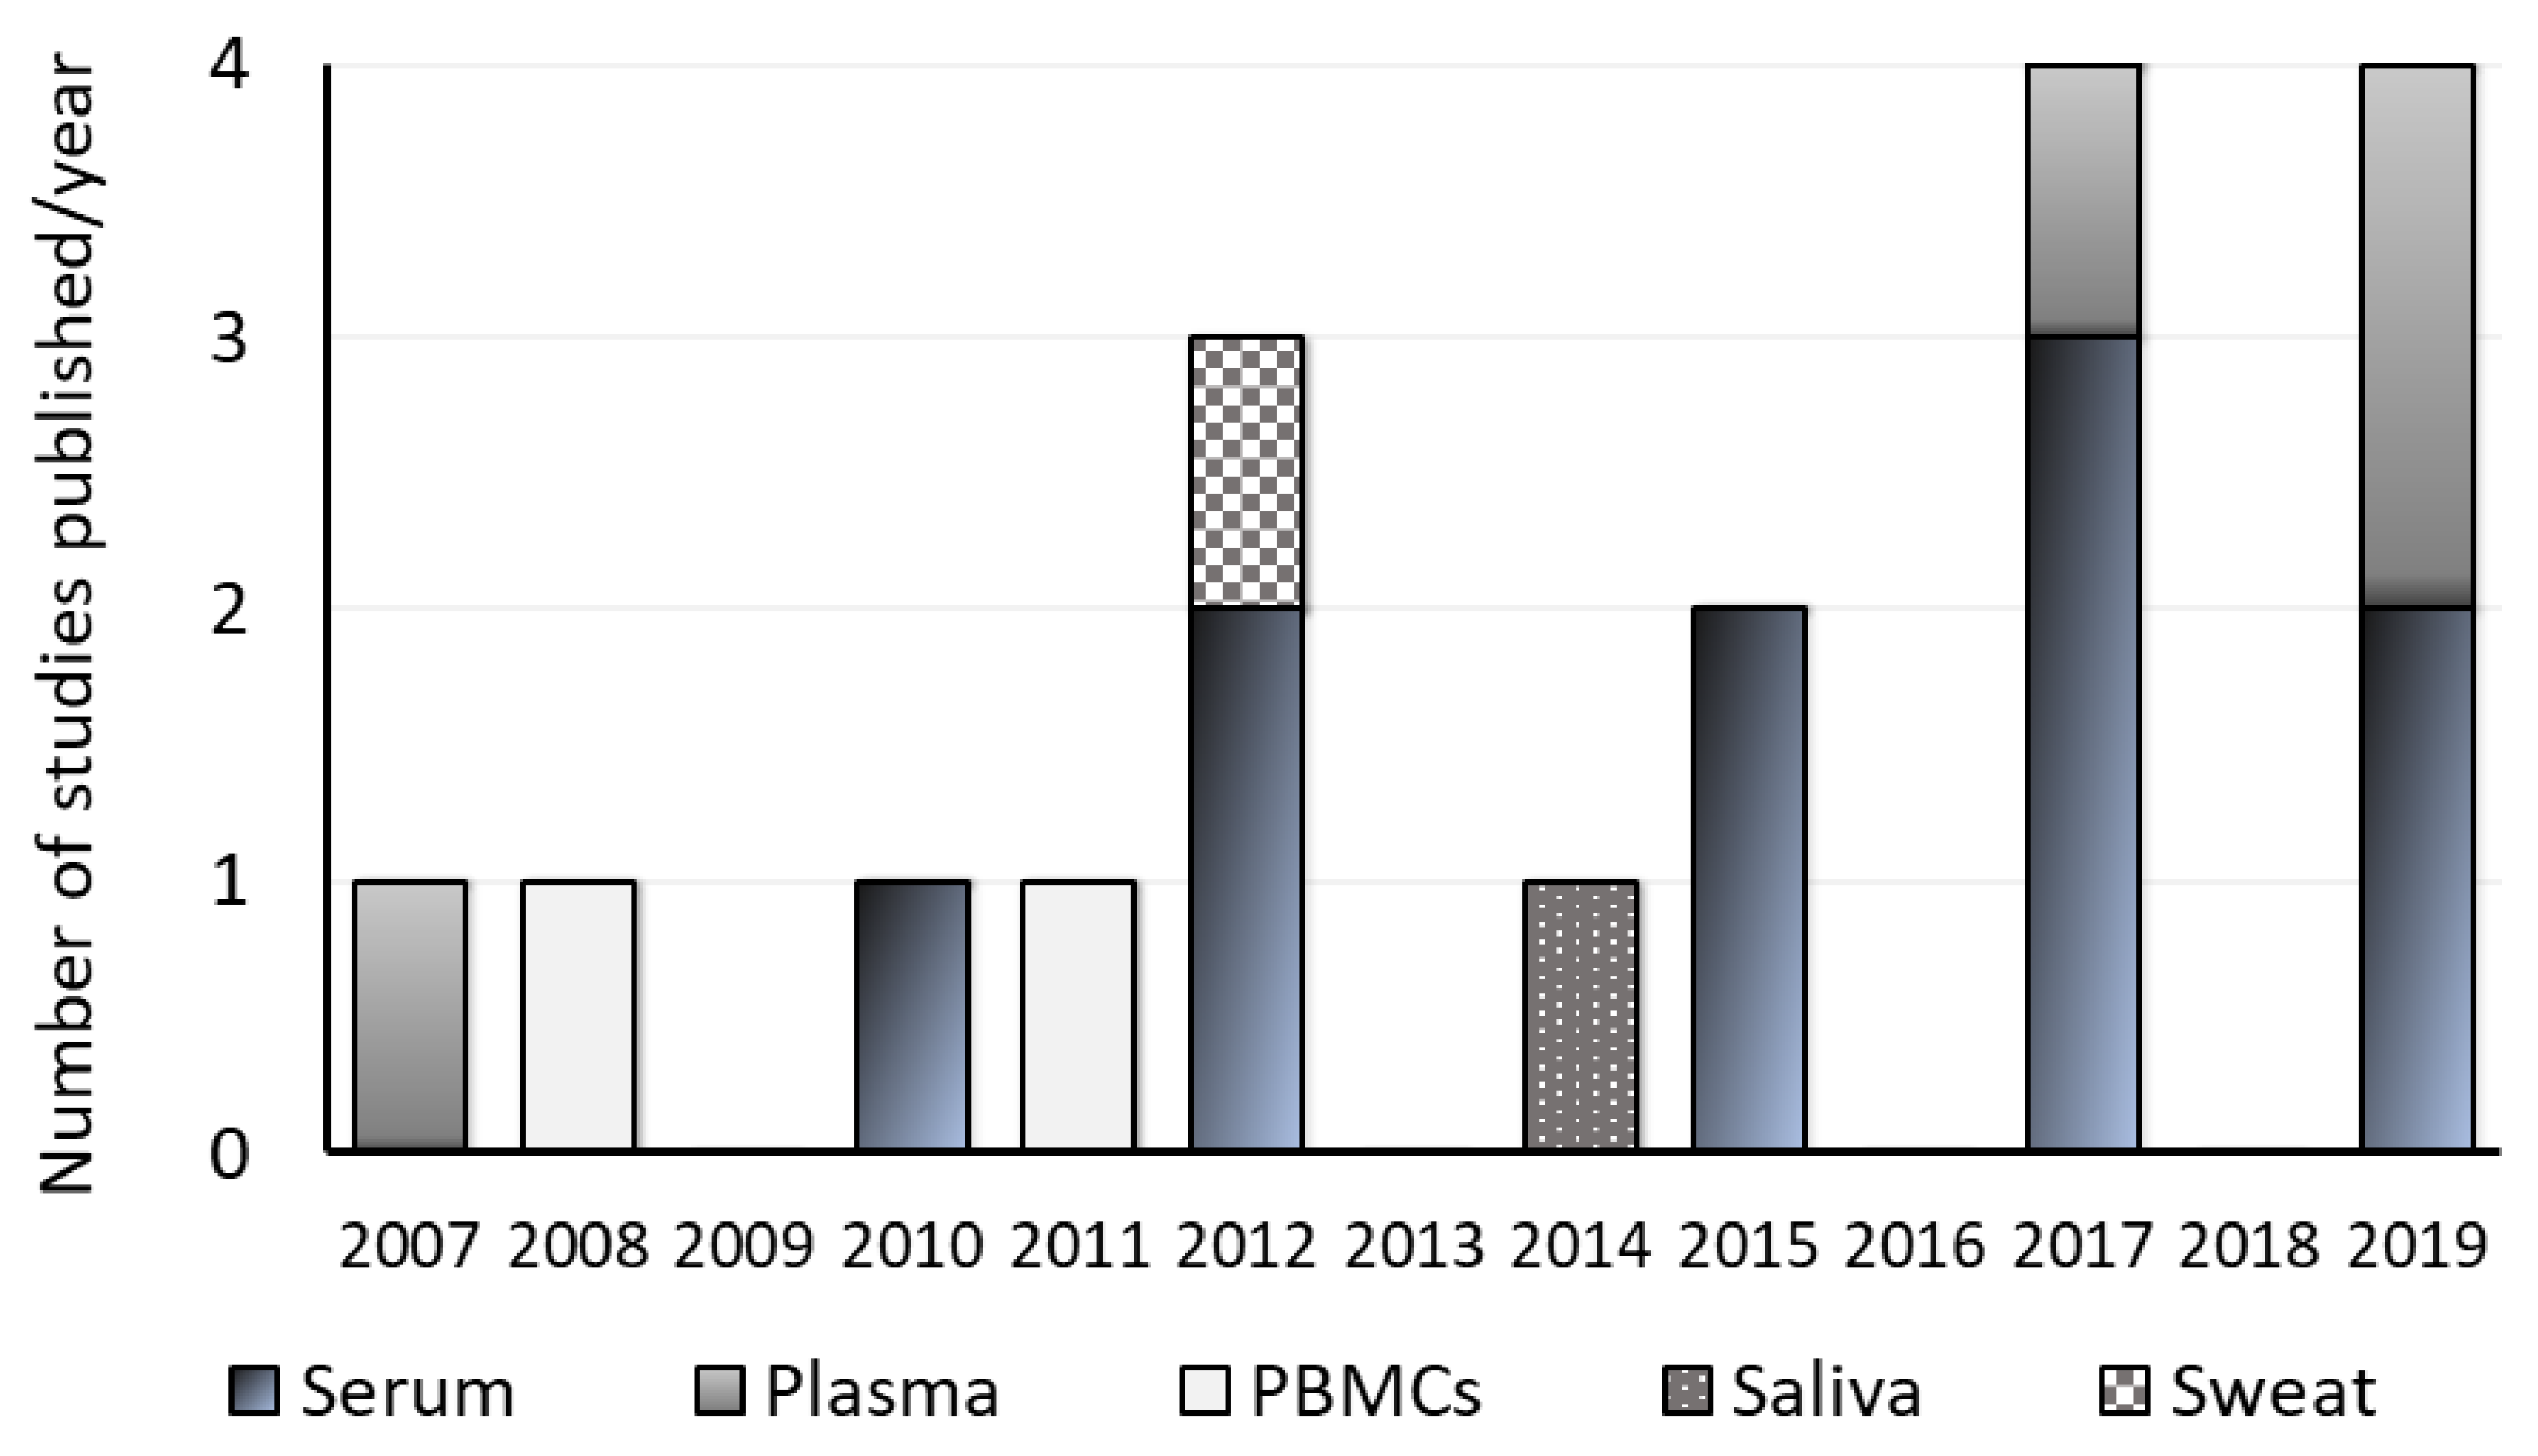
3.8. Frequency of the Publication
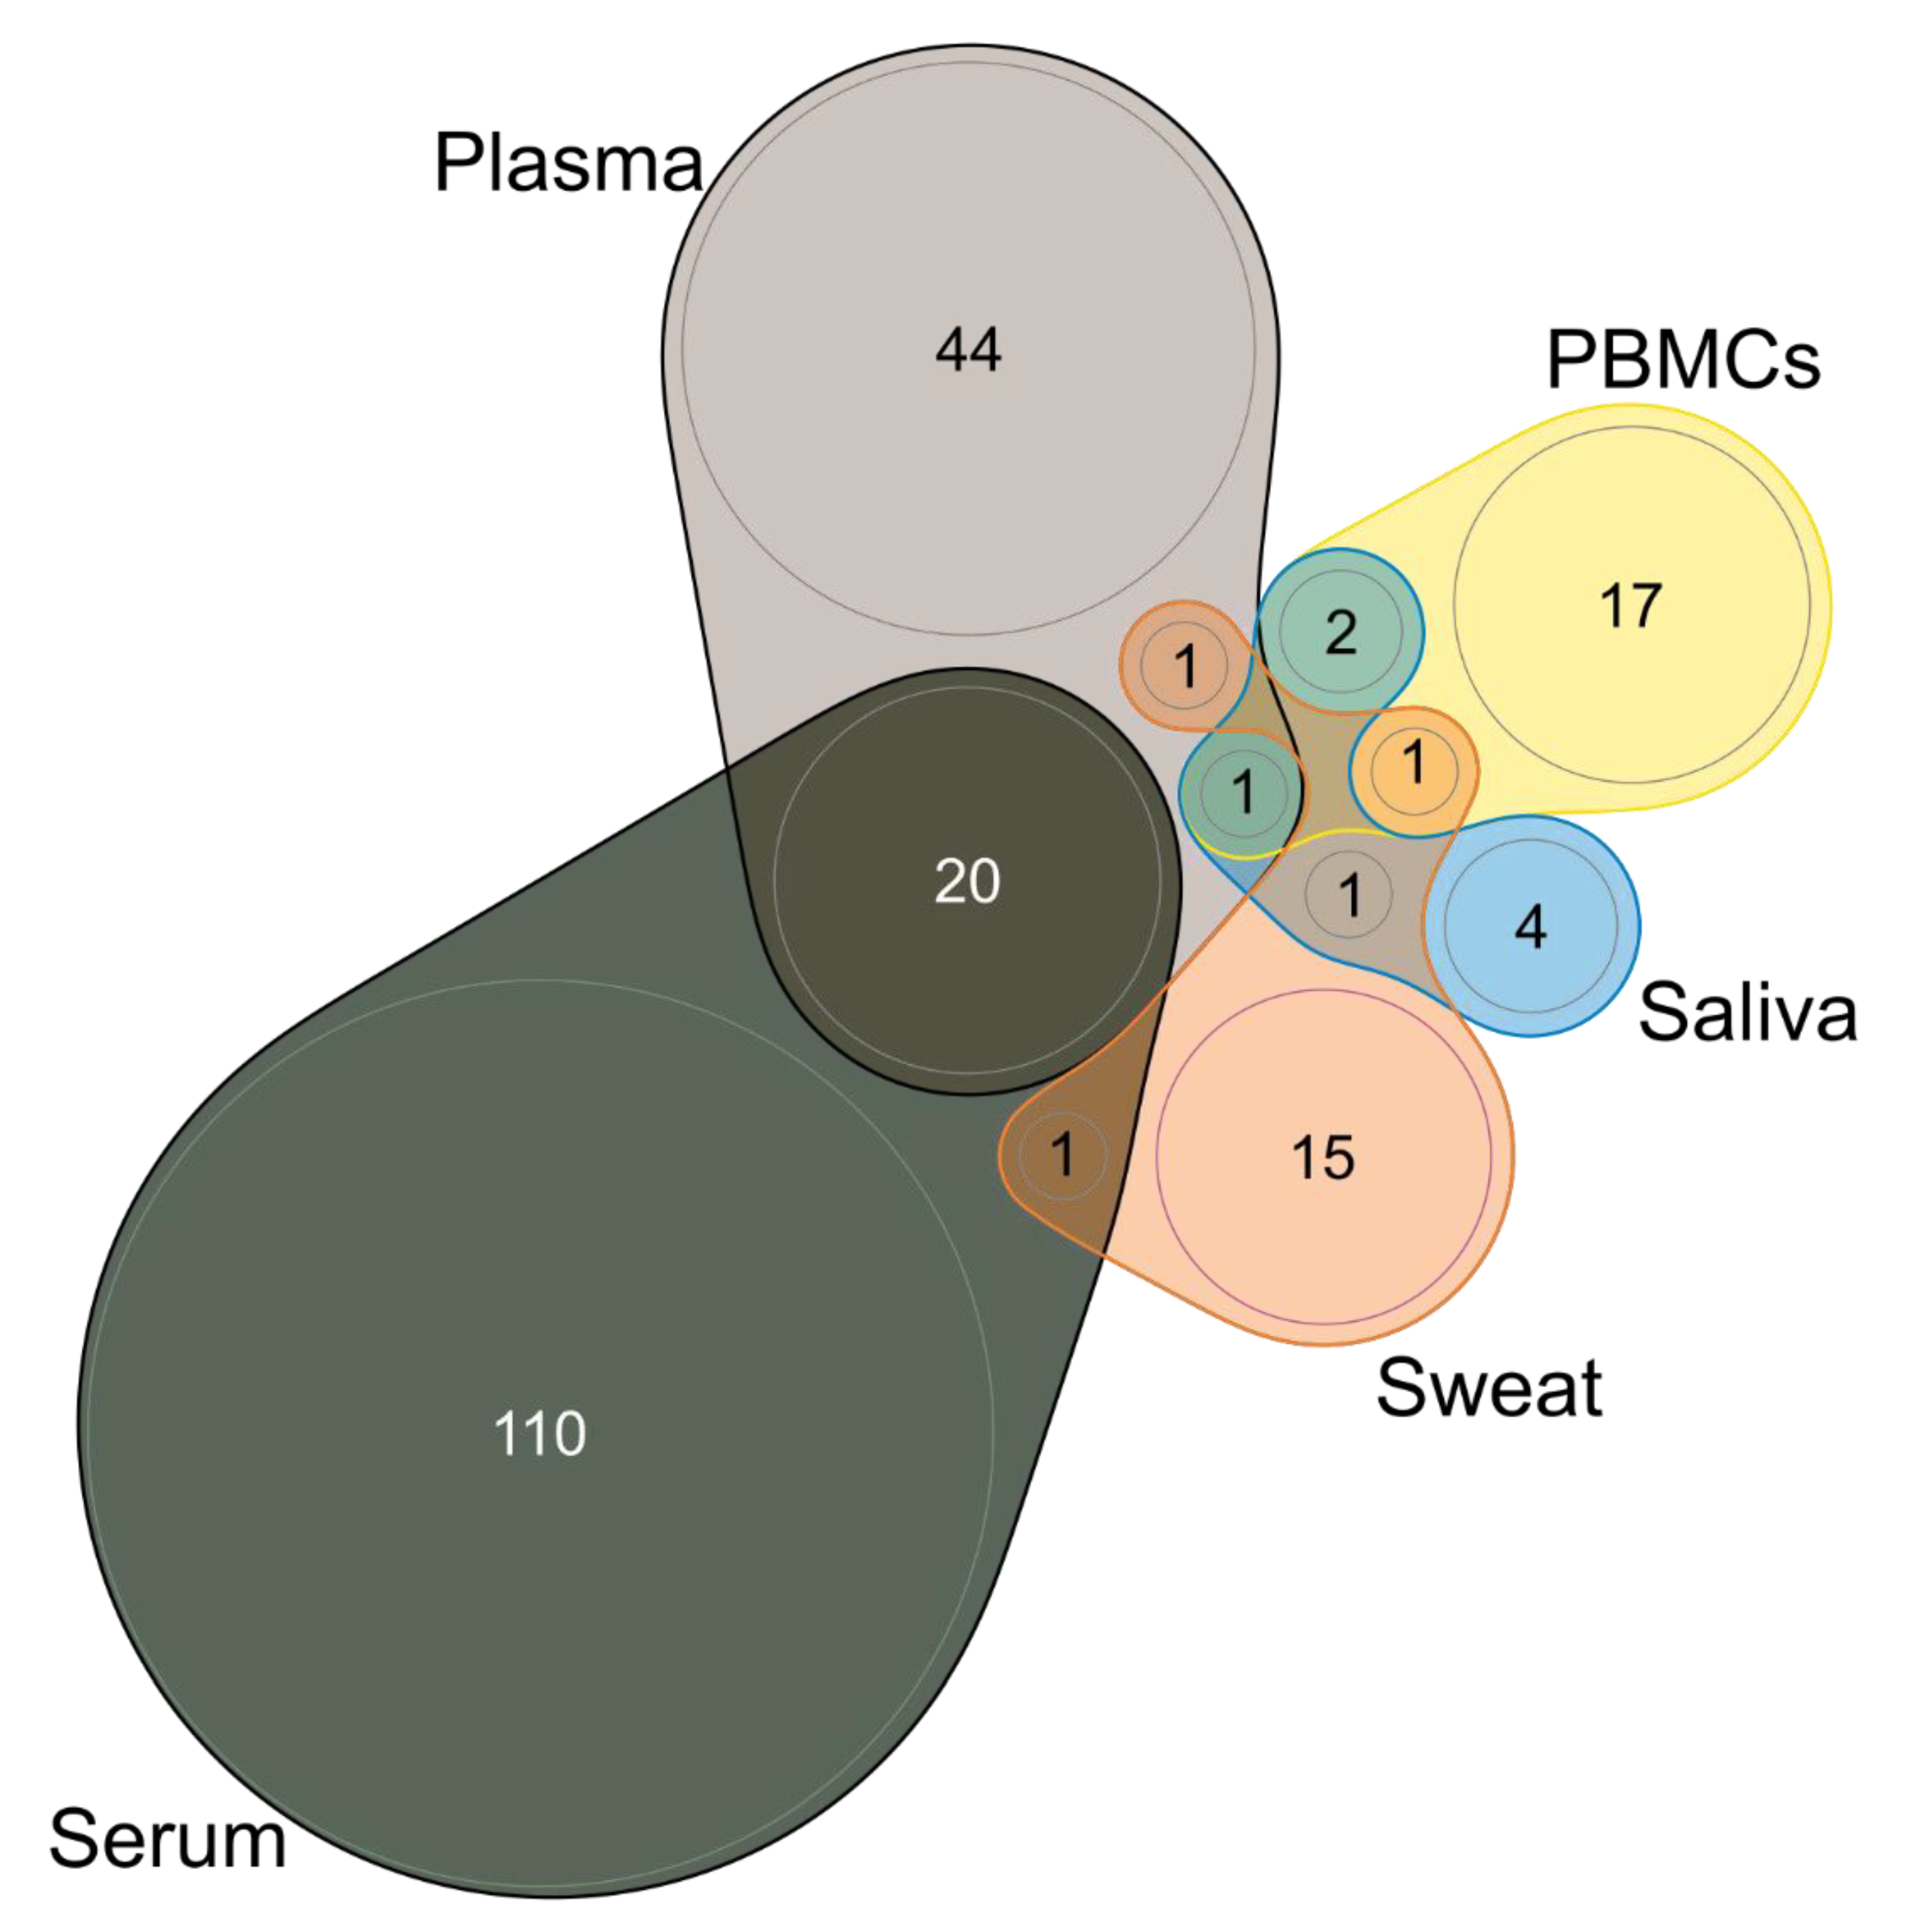
3.9. Type of Sample and Sampling
3.10. Drug Naïve or Minimally Medicated
3.11. MS-Based Methods
3.12. Validation and Other Techniques
4. Main Studies Performed
4.1. Schizophrenia vs. Healthy Control (n = 19)
4.2. Schizophrenia vs. Bipolar Disorder (n = 5)
4.3. Drug Naive vs. Treated (n = 2)
4.4. Bias Analysis
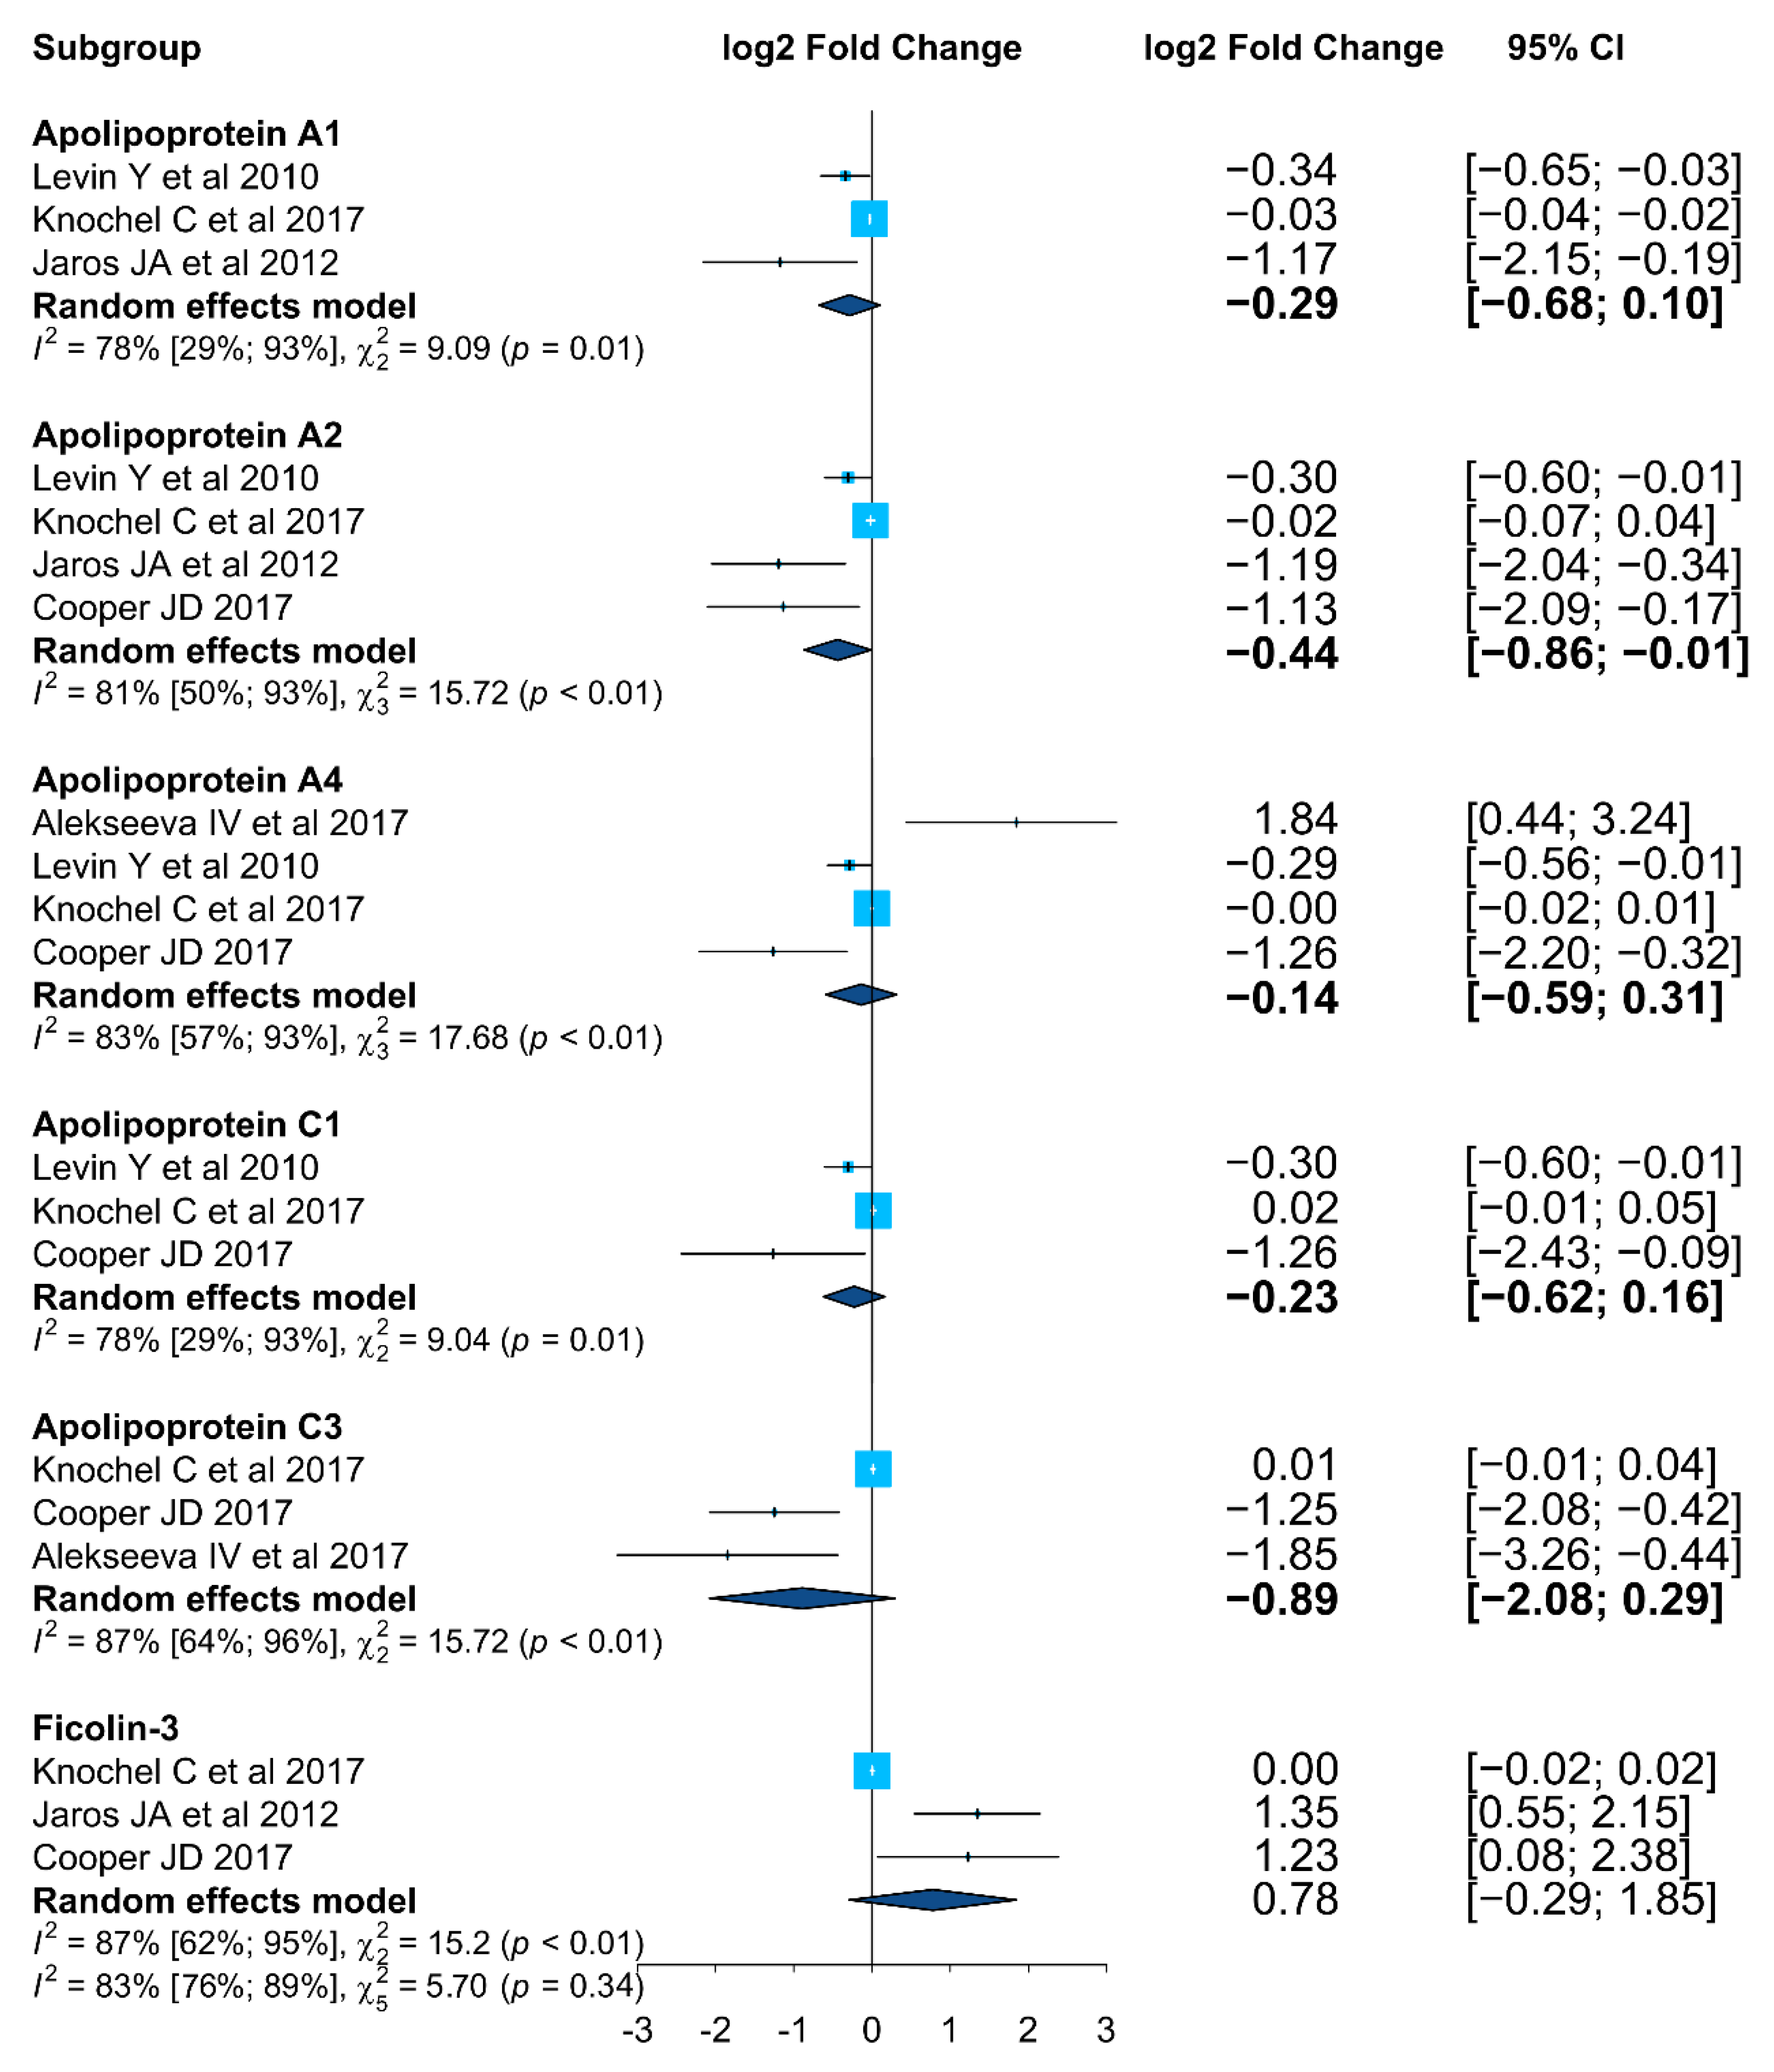
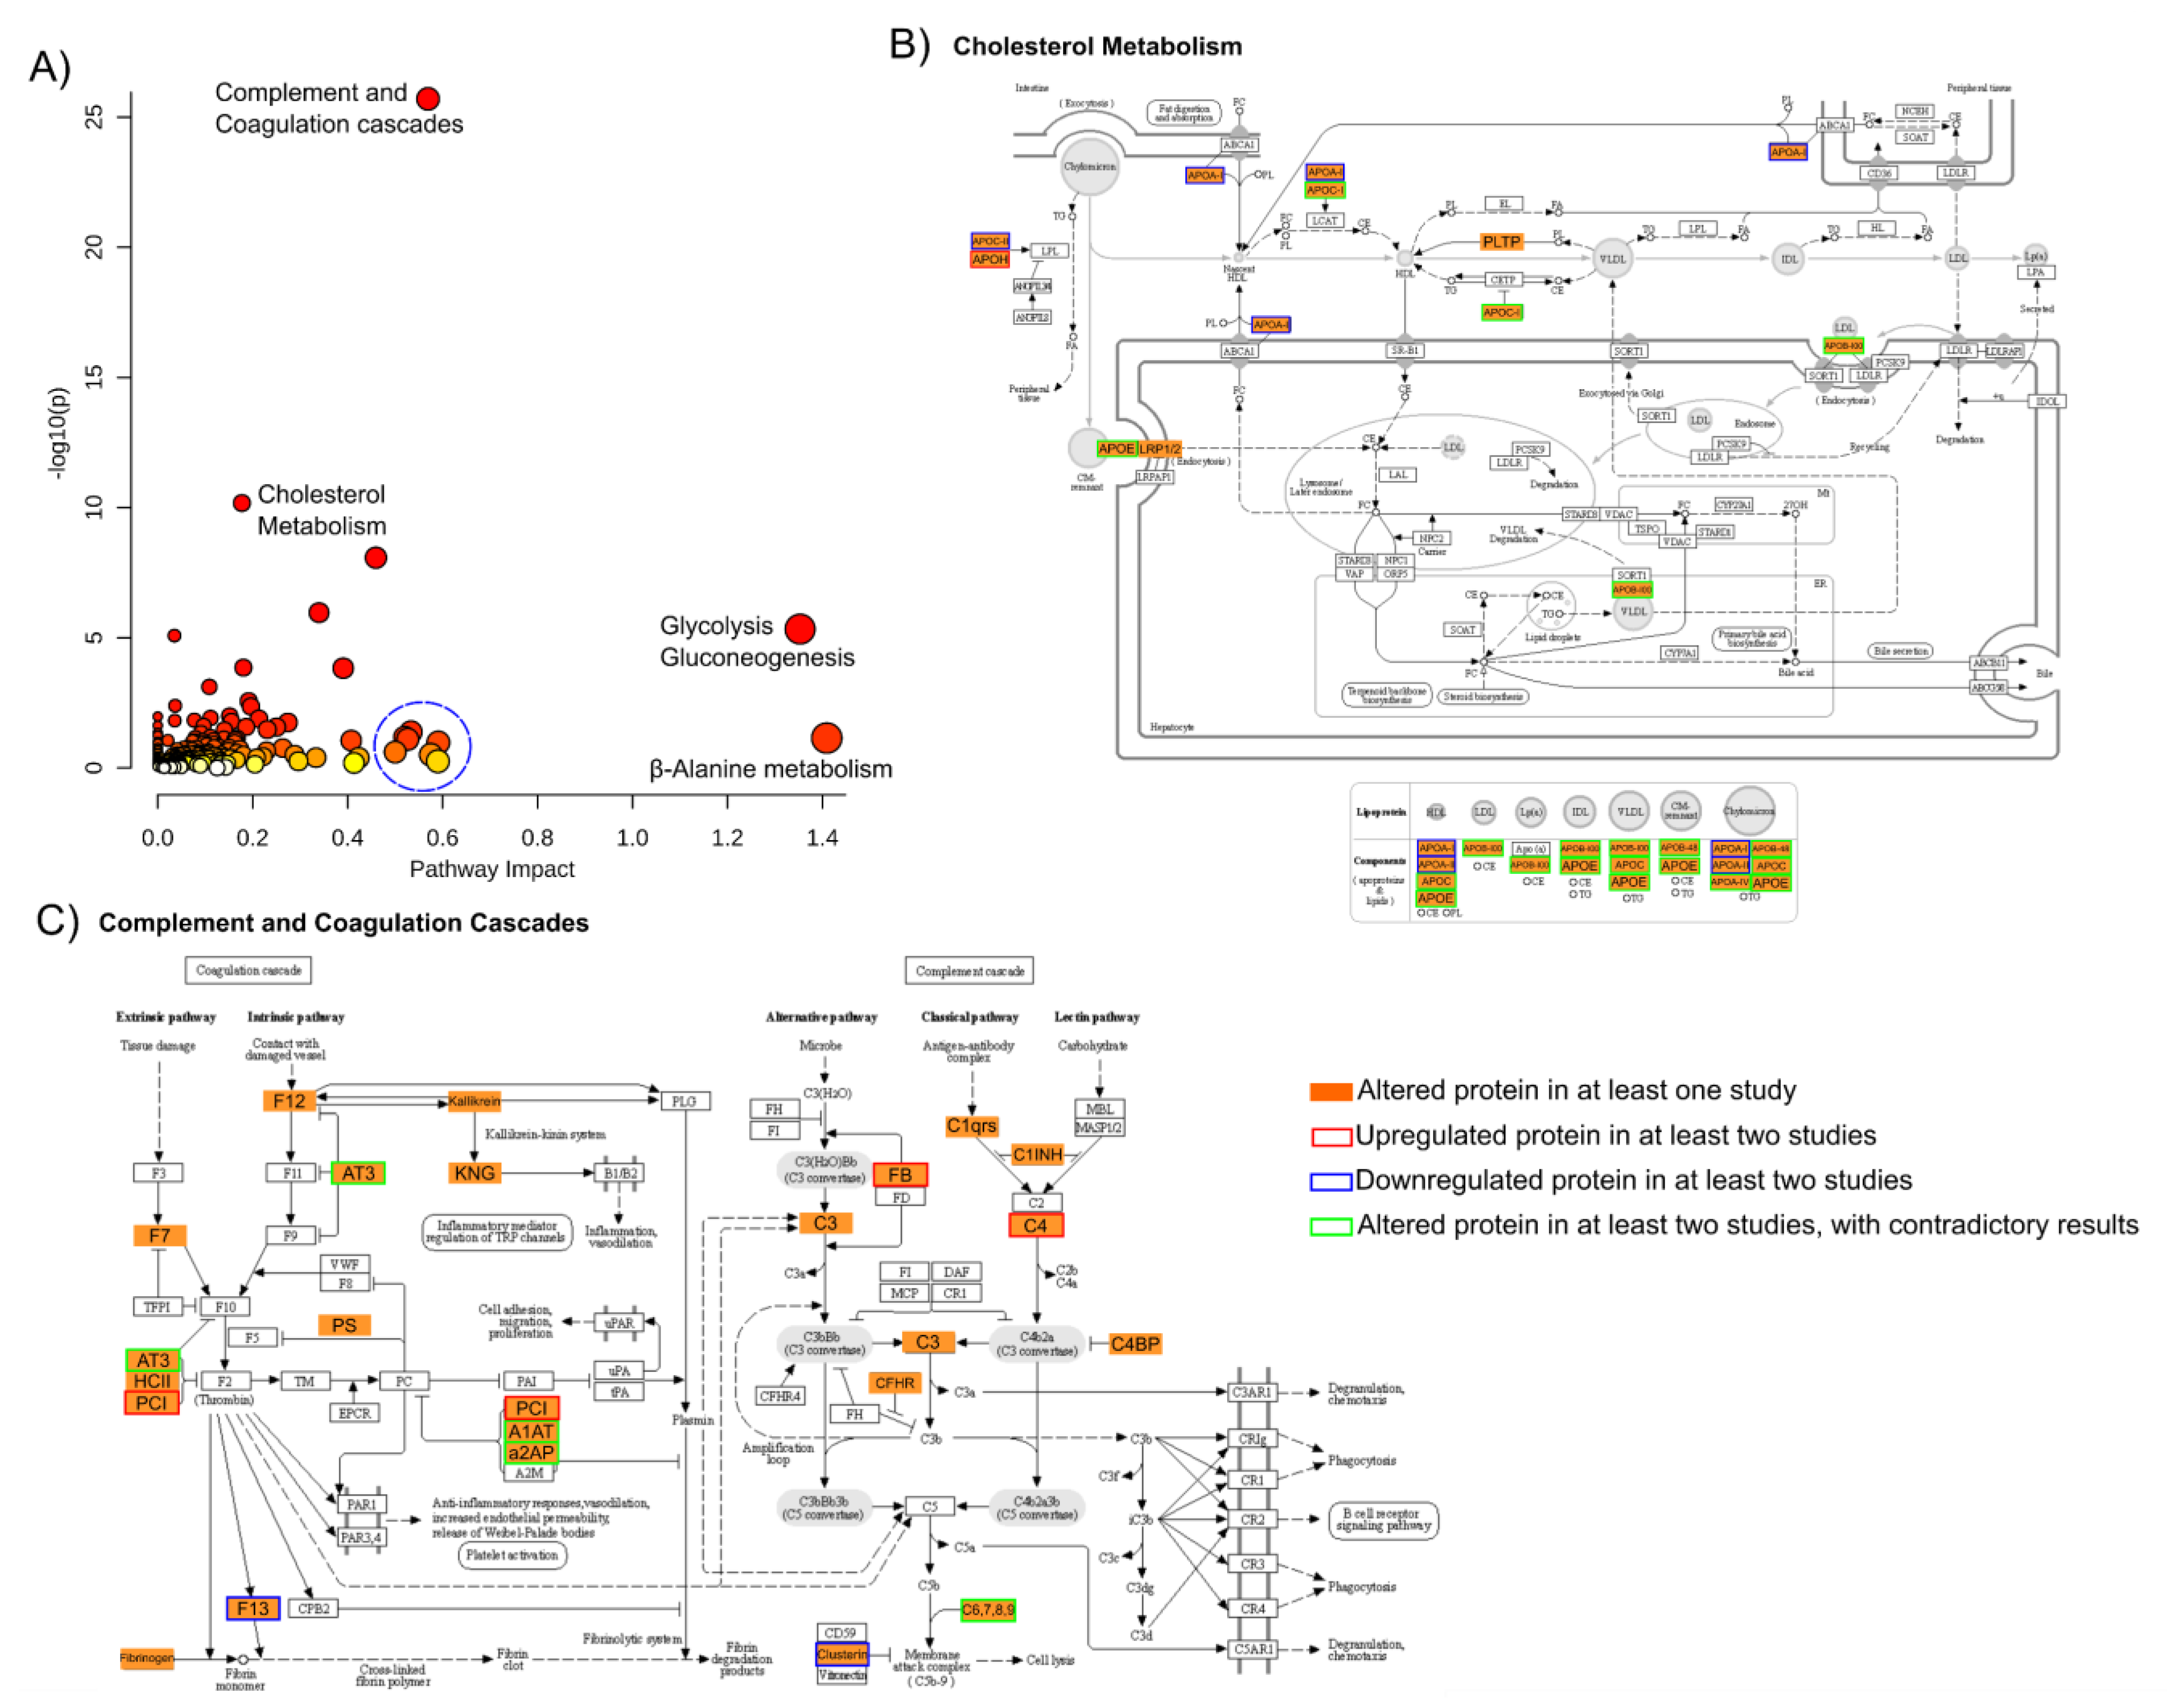
4.5. Meta-Analysis
5. Discussion
6. Strengths and Limitations
7. Directions for Future Research
8. Conclusions
Supplementary Materials
Author Contributions
Funding
Institutional Review Board Statement
Informed Consent Statement
Conflicts of Interest
References
- Hyman, S.E. A glimmer of light for neuropsychiatric disorders. Nature 2008, 455, 890–893. [Google Scholar] [CrossRef] [PubMed]
- Peedicayil, J. Identification of Biomarkers in Neuropsychiatric Disorders Based on Systems Biology and Epigenetics. Front. Genet. 2019, 2019, 985. [Google Scholar] [CrossRef]
- Guest, F.L.; Guest, P.C.; Martins-de-Souza, D. The emergence of point-of-care blood-based biomarker testing for psychiatric disorders: Enabling personalized medicine. Biomark. Med. 2016, 10, 431–443. [Google Scholar] [CrossRef] [PubMed]
- Taurines, R.; Dudley, E.; Grassl, J.; Warnke, A.; Gerlach, M.; Coogan, A.N.; Thome, J. Proteomic research in psychiatry. J. Psychopharmacol. 2011, 25, 151–196. [Google Scholar] [CrossRef] [PubMed]
- Hawton, K.; van Heeringen, K. Suicide. Lancet 2009, 373, 1372–1381. [Google Scholar] [CrossRef]
- Preece, R.L.; Han, S.Y.S.; Bahn, S. Proteomic approaches to identify blood-based biomarkers for depression and bipolar disorders. Expert Rev. Proteom. 2018, 15, 325–340. [Google Scholar] [CrossRef] [PubMed]
- Trautmann, S.; Rehm, J.; Wittchen, H.U. The economic costs of mental disorders: Do our societies react appropriately to the burden of mental disorders? EMBO Rep. 2016, 17, 1245–1249. [Google Scholar] [CrossRef]
- Zuccoli, G.S.; Saia-Cereda, V.M.; Nascimento, J.M.; Martins-de-Souza, D. The Energy Metabolism Dysfunction in Psychiatric Disorders Postmortem Brains: Focus on Proteomic Evidence. Front. Neurosci.-Switz. 2017, 11, 14. [Google Scholar] [CrossRef]
- Nestler, E.J.; Hyman, S.E. Animal models of neuropsychiatric disorders. Nat. Neurosci. 2010, 13, 1161–1169. [Google Scholar] [CrossRef]
- Schizophrenia Working Group of the Psychiatric Genomics Consortium. Biological insights from 108 schizophrenia-associated genetic loci. Nature 2014, 511, 421–427. [Google Scholar] [CrossRef]
- Gulsuner, S.; Stein, D.J.; Zingela, Z.; Willoughby, E.; Majara, L.; Mndini, M.M.; Mqulwana, S.G.; Ntola, O.A.; Casadei, S.; Ngqengelele, L.L.; et al. Genetics of schizophrenia in the South African Xhosa. Sci. Adv. 2020, 367, 569–573. [Google Scholar] [CrossRef] [PubMed]
- Charlson, F.J.; Ferrari, A.J.; Santomauro, D.F.; Diminic, S.; Stockings, E.; Scott, J.G.; McGrath, J.J.; Whiteford, H.A. Global Epidemiology and Burden of Schizophrenia: Findings From the Global Burden of Disease Study 2016. Schizophr. Bull. 2018, 44, 1195–1203. [Google Scholar] [CrossRef] [PubMed]
- Giusti, L.; Ciregia, F.; Mazzoni, M.R.; Lucacchini, A. Proteomics insight into psychiatric disorders: An update on biological fluid biomarkers. Expert Rev. Proteom. 2016, 13, 941–950. [Google Scholar] [CrossRef] [PubMed]
- Alawam, K. Application of proteomics in diagnosis of ADHD, schizophrenia, major depression, and suicidal behavior. Adv. Protein Chem. Struct. Biol. 2014, 95, 283–315. [Google Scholar] [CrossRef]
- Clark, L.A.; Cuthbert, B.; Lewis-Fernández, R.; Narrow, W.E.; Reed, G.M. Three Approaches to Understanding and Classifying Mental Disorder: ICD-11, DSM-5, and the National Institute of Mental Health’s Research Domain Criteria (RDoC). Psychol. Sci. Public Interest 2017, 18, 72–145. [Google Scholar] [CrossRef]
- Santesteban-Echarri, O.; Paino, M.; Rice, S.; González-Blanch, C.; McGorry, P.; Gleeson, J.; Alvarez-Jimenez, M. Predictors of functional recovery in first-episode psychosis: A systematic review and meta-analysis of longitudinal studies. Clin. Psychol. Rev. 2017, 58, 59–75. [Google Scholar] [CrossRef]
- Oliver, D.; Davies, C.; Crossland, G.; Lim, S.; Gifford, G.; McGuire, P.; Fusar-Poli, P. Can We Reduce the Duration of Untreated Psychosis? A Systematic Review and Meta-Analysis of Controlled Interventional Studies. Schizophr. Bull. 2018, 44, 1362–1372. [Google Scholar] [CrossRef]
- Cohen, C.I.; Meesters, P.D.; Zhao, J. New perspectives on schizophrenia in later life: Implications for treatment, policy, and research. Lancet Psychiatry 2015, 2, 340–350. [Google Scholar] [CrossRef]
- Aricioglu, F.; Ozkartal, C.S.; Unal, G.; Dursun, S.; Cetin, M.; Müller, N. Neuroinflammation in Schizophrenia: A Critical Review and The Future. Klin. Psikofarmakol. Bülteni-Bull. Clin. Psychopharmacol. 2017, 26, 429–437. [Google Scholar] [CrossRef]
- Davison, J.; O’Gorman, A.; Brennan, L.; Cotter, D.R. A systematic review of metabolite biomarkers of schizophrenia. Schizophr. Res. 2018, 195, 32–50. [Google Scholar] [CrossRef]
- Galderisi, S.; Kaiser, S.; Bitter, I.; Nordentoft, M.; Mucci, A.; Sabé, M.; Giordano, G.M.; Nielsen, M.Ø.; Glenthøj, L.B.; Pezzella, P.; et al. EPA guidance on treatment of negative symptoms in schizophrenia. Eur. Psychiatry 2021, 64, e21. [Google Scholar] [CrossRef] [PubMed]
- Vita, A.; Barlati, S.; Ceraso, A.; Nibbio, G.; Ariu, C.; Deste, G.; Wykes, T. Effectiveness, Core Elements, and Moderators of Response of Cognitive Remediation for Schizophrenia: A Systematic Review and Meta-analysis of Randomized Clinical Trials. JAMA Psychiatry 2021, 78, 848–858. [Google Scholar] [CrossRef] [PubMed]
- Santa, C.; Coelho, J.F.; Madeira, N.; Manadas, B. Circulating biomarkers in schizophrenia: A proteomics perspective. Int. J. Clin. Neurosci. Ment. Health 2017, 4, S05. [Google Scholar] [CrossRef]
- Taber, K.H.; Hurley, R.A.; Yudofsky, S.C. Diagnosis and treatment of neuropsychiatric disorders. Annu. Rev. Med. 2010, 61, 121–133. [Google Scholar] [CrossRef] [PubMed]
- McGorry, P.D.; Yung, A.R.; Bechdolf, A.; Amminger, P. Back to the future: Predicting and reshaping the course of psychotic disorder. Arch. Gen. Psychiatry 2008, 65, 25–27. [Google Scholar] [CrossRef]
- Owen, M.J.; Sawa, A.; Mortensen, P.B. Schizophrenia. Lancet 2016, 388, 86–97. [Google Scholar] [CrossRef]
- Kumar, A.A.; Yadav, M.; Parle, M.; Dhingra, S.; Dhull, D.K. Potential drug targets and treatment of schizophrenia. Inflammopharmacology 2017, 25, 277–292. [Google Scholar] [CrossRef]
- Lally, J.; MacCabe, J.H. Antipsychotic medication in schizophrenia: A review. Br. Med. Bull. 2015, 114, 169–179. [Google Scholar] [CrossRef]
- Nascimento, J.M.; Garcia, S.; Saia-Cereda, V.M.; Santana, A.G.; Brandao-Teles, C.; Zuccoli, G.S.; Junqueira, D.G.; Reis-de-Oliveira, G.; Baldasso, P.A.; Cassoli, J.S.; et al. Proteomics and molecular tools for unveiling missing links in the biochemical understanding of schizophrenia. Proteom. Clin. Appl. 2016, 10, 1148–1158. [Google Scholar] [CrossRef]
- Ramos Ferreira, S.; Moura, D.; Oliveira, P.; Santos, V.; Bajouco, M.; Morais, S.; Coroa, M.; Manadas, B.; Madeira, N. Metabolic parameters as possible diagnostic predictors in first-episode psychosis: An exploratory retrospective cohort study. Early Interv. Psychiatry 2021, 1–4. [Google Scholar] [CrossRef]
- Howes, O.D.; McCutcheon, R.; Owen, M.J.; Murray, R.M. The Role of Genes, Stress, and Dopamine in the Development of Schizophrenia. Biol. Psychiatry 2017, 81, 9–20. [Google Scholar] [CrossRef] [PubMed]
- Brisch, R.; Saniotis, A.; Wolf, R.; Bielau, H.; Bernstein, H.G.; Steiner, J.; Bogerts, B.; Braun, K.; Jankowski, Z.; Kumaratilake, J.; et al. The role of dopamine in schizophrenia from a neurobiological and evolutionary perspective: Old fashioned, but still in vogue. Front. Psychiatry 2014, 5, 47. [Google Scholar] [CrossRef] [PubMed]
- Girgis, R.R.; Kumar, S.S.; Brown, A.S. The cytokine model of schizophrenia: Emerging therapeutic strategies. Biol. Psychiatry 2014, 75, 292–299. [Google Scholar] [CrossRef] [PubMed]
- Pantelis, C.; Yucel, M.; Wood, S.J.; Velakoulis, D.; Sun, D.; Berger, G.; Stuart, G.W.; Yung, A.; Phillips, L.; McGorry, P.D. Structural brain imaging evidence for multiple pathological processes at different stages of brain development in schizophrenia. Schizophr. Bull. 2005, 31, 672–696. [Google Scholar] [CrossRef]
- Filiou, M.D.; Turck, C.W. General overview: Biomarkers in neuroscience research. Int. Rev. Neurobiol. 2011, 101, 1–17. [Google Scholar] [CrossRef]
- Canuel, V.; Rance, B.; Avillach, P.; Degoulet, P.; Burgun, A. Translational research platforms integrating clinical and omics data: A review of publicly available solutions. Brief. Bioinform. 2015, 16, 280–290. [Google Scholar] [CrossRef]
- McShane, L.M.; Cavenagh, M.M.; Lively, T.G.; Eberhard, D.A.; Bigbee, W.L.; Williams, P.M.; Mesirov, J.P.; Polley, M.Y.; Kim, K.Y.; Tricoli, J.V.; et al. Criteria for the use of omics-based predictors in clinical trials. Nature 2013, 502, 317–320. [Google Scholar] [CrossRef]
- Biomarkers Definitions Working, G. Biomarkers and surrogate endpoints: Preferred definitions and conceptual framework. Clin. Pharmacol. Ther. 2001, 69, 89–95. [Google Scholar] [CrossRef]
- Bayes, A.; Grant, S.G. Neuroproteomics: Understanding the molecular organization and complexity of the brain. Nat. Rev. Neurosci. 2009, 10, 635–646. [Google Scholar] [CrossRef]
- Kitchen, R.R.; Rozowsky, J.S.; Gerstein, M.B.; Nairn, A.C. Decoding neuroproteomics: Integrating the genome, translatome and functional anatomy. Nat. Neurosci. 2014, 17, 1491–1499. [Google Scholar] [CrossRef]
- Santa, C.; Anjo, S.I.; Mendes, V.M.; Manadas, B. Neuroproteomics—LC-MS Quantitative Approaches. In Recent Advances in Proteomics Research; IntechOpen: London, UK, 2015. [Google Scholar] [CrossRef][Green Version]
- Gottschalk, M.G.; Wesseling, H.; Guest, P.C.; Bahn, S. Proteomic enrichment analysis of psychotic and affective disorders reveals common signatures in presynaptic glutamatergic signaling and energy metabolism. Int. J. Neuropsychopharmacol. 2014, 18, pyu019. [Google Scholar] [CrossRef] [PubMed]
- De Jesus, J.R.; de Campos, B.K.; Galazzi, R.M.; Martinez, J.L.; Arruda, M.A. Bipolar disorder: Recent advances and future trends in bioanalytical developments for biomarker discovery. Anal. Bioanal. Chem. 2015, 407, 661–667. [Google Scholar] [CrossRef] [PubMed]
- Chan, M.K.; Guest, P.C.; Levin, Y.; Umrania, Y.; Schwarz, E.; Bahn, S.; Rahmoune, H. Converging evidence of blood-based biomarkers for schizophrenia: An update. Int. Rev. Neurobiol. 2011, 101, 95–144. [Google Scholar] [CrossRef] [PubMed]
- Guest, P.C.; Chan, M.K.; Gottschalk, M.G.; Bahn, S. The use of proteomic biomarkers for improved diagnosis and stratification of schizophrenia patients. Biomark. Med. 2014, 8, 15–27. [Google Scholar] [CrossRef]
- Cunningham, R.; Ma, D.; Li, L. Mass Spectrometry-based Proteomics and Peptidomics for Systems Biology and Biomarker Discovery. Front Biol 2012, 7, 313–335. [Google Scholar] [CrossRef]
- Wei, X.; Li, L. Mass spectrometry-based proteomics and peptidomics for biomarker discovery in neurodegenerative diseases. Int J Clin Exp Pathol 2009, 2, 132–148. [Google Scholar]
- Chandramouli, K.; Qian, P.Y. Proteomics: Challenges, techniques and possibilities to overcome biological sample complexity. Hum. Genom. Proteom. 2009, 2009, 239204. [Google Scholar] [CrossRef]
- Tuli, L.; Ressom, H.W. LC-MS Based Detection of Differential Protein Expression. J. Proteom. Bioinform. 2009, 2, 416–438. [Google Scholar] [CrossRef]
- Walker, S.J.; Xu, A. Biomarker discovery using molecular profiling approaches. In International Review of Neurobiology; Elsevier: Amsterdam, The Netherlands, 2004; Volume 61, pp. 1–30. [Google Scholar]
- Neilson, K.A.; Ali, N.A.; Muralidharan, S.; Mirzaei, M.; Mariani, M.; Assadourian, G.; Lee, A.; van Sluyter, S.C.; Haynes, P.A. Less label, more free: Approaches in label-free quantitative mass spectrometry. Proteomics 2011, 11, 535–553. [Google Scholar] [CrossRef]
- Anand, S.; Samuel, M.; Ang, C.S.; Keerthikumar, S.; Mathivanan, S. Label-Based and Label-Free Strategies for Protein Quantitation. Methods Mol. Biol. 2017, 1549, 31–43. [Google Scholar] [CrossRef]
- Craft, G.E.; Chen, A.; Nairn, A.C. Recent advances in quantitative neuroproteomics. Methods 2013, 61, 186–218. [Google Scholar] [CrossRef] [PubMed]
- Page, M.J.; McKenzie, J.E.; Bossuyt, P.M.; Boutron, I.; Hoffmann, T.C.; Mulrow, C.D.; Shamseer, L.; Tetzlaff, J.M.; Akl, E.A.; Brennan, S.E.; et al. The PRISMA 2020 statement: An updated guideline for reporting systematic reviews. BMJ 2021, 372, n71. [Google Scholar] [CrossRef] [PubMed]
- Lumbreras, B.; Porta, M.; Márquez, S.; Pollán, M.; Parker, L.A.; Hernández-Aguado, I. QUADOMICS: An adaptation of the Quality Assessment of Diagnostic Accuracy Assessment (QUADAS) for the evaluation of the methodological quality of studies on the diagnostic accuracy of ‘-omics’-based technologies. Clin. Biochem. 2008, 41, 1316–1325. [Google Scholar] [CrossRef] [PubMed]
- Parker, L.A.; Gómez Saez, N.; Lumbreras, B.; Porta, M.; Hernández-Aguado, I. Methodological deficits in diagnostic research using ‘-omics’ technologies: Evaluation of the QUADOMICS tool and quality of recently published studies. PLoS ONE 2010, 5, e11419. [Google Scholar] [CrossRef]
- Balduzzi, S.; Rücker, G.; Schwarzer, G. How to perform a meta-analysis with R: A practical tutorial. Evid.-Based Ment. Health 2019, 22, 153–160. [Google Scholar] [CrossRef]
- Viechtbauer, W. Conducting Meta-Analyses in R with the metafor Package. J. Stat. Softw. 2010, 36, 48. [Google Scholar] [CrossRef]
- Harrer, M.; Cuijpers, P.; Furukawa, T.A.; Ebert, D.D. Doing Meta-Analysis in R: A Hands-on Guide; Chapmann & Hall/CRC Press: Boca Raton, FL, USA; London, UK, 2019. [Google Scholar]
- Pang, Z.; Chong, J.; Zhou, G.; de Lima Morais, D.A.; Chang, L.; Barrette, M.; Gauthier, C.; Jacques, P.-É.; Li, S.; Xia, J. MetaboAnalyst 5.0: Narrowing the gap between raw spectra and functional insights. Nucleic Acids Res. 2021, 49, W388–W396. [Google Scholar] [CrossRef]
- Kanehisa, M.; Sato, Y. KEGG Mapper for inferring cellular functions from protein sequences. Protein Sci. 2020, 29, 28–35. [Google Scholar] [CrossRef]
- Kanehisa, M.; Sato, Y.; Kawashima, M. KEGG mapping tools for uncovering hidden features in biological data. Protein Sci. 2022, 31, 47–53. [Google Scholar] [CrossRef]
- Smirnova, L.; Seregin, A.; Boksha, I.; Dmitrieva, E.; Simutkin, G.; Kornetova, E.; Savushkina, O.; Letova, A.; Bokhan, N.; Ivanova, S.; et al. The difference in serum proteomes in schizophrenia and bipolar disorder. BMC Genom. 2019, 20, 14. [Google Scholar] [CrossRef]
- Rodrigues-Amorim, D.; Rivera-Baltanas, T.; Vallejo-Curto, M.D.; Rodriguez-Jamardo, C.; de las Heras, E.; Barreiro-Villar, C.; Blanco-Formoso, M.; Fernandez-Palleiro, P.; Alvarez-Ariza, M.; Lopez, M.; et al. Proteomics in Schizophrenia: A Gateway to Discover Potential Biomarkers of Psychoneuroimmune Pathways. Front. Psychiatry 2019, 10, 885. [Google Scholar] [CrossRef] [PubMed]
- Pessoa, G.D.; de Jesus, J.R.; Balbuena, T.S.; Arruda, M.A.Z. Metallomics-based platforms for comparing the human blood serum profiles between bipolar disorder and schizophrenia patients. Rapid Commun. Mass Spectrom. 2019, 34, e8698. [Google Scholar] [CrossRef]
- Walss-Bass, C.; Lokesh, G.L.R.; Dyukova, E.; Gorenstein, D.G.; Roberts, D.L.; Velligan, D.; Volk, D.E. X-Aptamer Technology Identifies C4A and ApoB in Blood as Potential Markers for Schizophrenia. Mol. Neuropsychiatry 2019, 5, 52–59. [Google Scholar] [CrossRef] [PubMed]
- Cooper, J.D.; Ozcan, S.; Gardner, R.M.; Rustogi, N.; Wicks, S.; van Rees, G.F.; Leweke, F.M.; Dalman, C.; Karlsson, H.; Bahn, S. Schizophrenia-risk and urban birth are associated with proteomic changes in neonatal dried blood spots. Transl. Psychiatry 2017, 7, 1290. [Google Scholar] [CrossRef] [PubMed]
- Huang, T.L.; Lo, L.H.; Shiea, J.; Su, H. Rapid and simple analysis of disease-associated biomarkers of Taiwanese patients with schizophrenia using matrix-assisted laser desorption ionization mass spectrometry. Clin. Chim. Acta 2017, 473, 75–81. [Google Scholar] [CrossRef]
- Knochel, C.; Kniep, J.; Cooper, J.D.; Stablein, M.; Wenzler, S.; Sarlon, J.; Prvulovic, D.; Linden, D.E.; Bahn, S.; Stocki, P.; et al. Altered apolipoprotein C expression in association with cognition impairments and hippocampus volume in schizophrenia and bipolar disorder. Eur. Arch. Psychiatry Clin. Neurosci. 2017, 267, 199–212. [Google Scholar] [CrossRef] [PubMed]
- De Jesus, J.R.; Galazzi, R.M.; de Lima, T.B.; Banzato, C.E.M.; de Almeida Lima, E.S.L.F.; de Rosalmeida Dantas, C.; Gozzo, F.C.; Arruda, M.A.Z. Simplifying the human serum proteome for discriminating patients with bipolar disorder of other psychiatry conditions. Clin. Biochem. 2017, 50, 1118–1125. [Google Scholar] [CrossRef]
- Alekseeva, I.V.; Timofeyeva, N.A.; Ivanova, S.A.; Simutkin, G.G.; Semke, A.V.; Losenkov, I.S.; Bokhan, N.A.; Fedorova, O.S.; Chernonosov, A.A. A distinct serum protein pattern in patients with paranoid schizophrenia. Physiol. Pharmacol. 2017, 21, 304–311. [Google Scholar]
- Ding, Y.H.; Guo, J.H.; Hu, Q.Y.; Jiang, W.; Wang, K.Z. Protein Biomarkers in Serum of Patients with Schizophrenia. Cell Biochem. Biophys. 2015, 72, 799–805. [Google Scholar] [CrossRef]
- Al Awam, K.; Haussleiter, I.S.; Dudley, E.; Donev, R.; Brune, M.; Juckel, G.; Thome, J. Multiplatform metabolome and proteome profiling identifies serum metabolite and protein signatures as prospective biomarkers for schizophrenia. J. Neural Transm. 2015, 122, 111–122. [Google Scholar] [CrossRef]
- Iavarone, F.; Melis, M.; Platania, G.; Cabras, T.; Manconi, B.; Petruzzelli, R.; Cordaro, M.; Siracusano, A.; Faa, G.; Messana, I.; et al. Characterization of salivary proteins of schizophrenic and bipolar disorder patients by top-down proteomics. J. Proteom. 2014, 103, 15–22. [Google Scholar] [CrossRef] [PubMed]
- Li, Y.; Zhou, K.; Zhang, Z.; Sun, L.; Yang, J.; Zhang, M.; Ji, B.; Tang, K.; Wei, Z.; He, G.; et al. Label-free quantitative proteomic analysis reveals dysfunction of complement pathway in peripheral blood of schizophrenia patients: Evidence for the immune hypothesis of schizophrenia. Mol. Biosyst. 2012, 8, 2664–2671. [Google Scholar] [CrossRef] [PubMed]
- Jaros, J.A.; Martins-de-Souza, D.; Rahmoune, H.; Rothermundt, M.; Leweke, F.M.; Guest, P.C.; Bahn, S. Protein phosphorylation patterns in serum from schizophrenia patients and healthy controls. J. Proteom. 2012, 76, 43–55. [Google Scholar] [CrossRef] [PubMed]
- Raiszadeh, M.M.; Ross, M.M.; Russo, P.S.; Schaepper, M.A.; Zhou, W.; Deng, J.; Ng, D.; Dickson, A.; Dickson, C.; Strom, M.; et al. Proteomic analysis of eccrine sweat: Implications for the discovery of schizophrenia biomarker proteins. J. Proteome Res. 2012, 11, 2127–2139. [Google Scholar] [CrossRef]
- Herberth, M.; Koethe, D.; Cheng, T.M.; Krzyszton, N.D.; Schoeffmann, S.; Guest, P.C.; Rahmoune, H.; Harris, L.W.; Kranaster, L.; Leweke, F.M.; et al. Impaired glycolytic response in peripheral blood mononuclear cells of first-onset antipsychotic-naive schizophrenia patients. Mol. Psychiatry 2011, 16, 848–859. [Google Scholar] [CrossRef]
- Levin, Y.; Wang, L.; Schwarz, E.; Koethe, D.; Leweke, F.M.; Bahn, S. Global proteomic profiling reveals altered proteomic signature in schizophrenia serum. Mol. Psychiatry 2010, 15, 1088–1100. [Google Scholar] [CrossRef][Green Version]
- Craddock, M.; Huang, J.T.; Jackson, E.; Harris, N.; Torrey, E.F.; Herberth, M.; Bahn, S. Increased alpha-defensins as a blood marker for schizophrenia susceptibility. Mol. Cell Proteom. 2008, 7, 1204–1213. [Google Scholar] [CrossRef]
- Wan, C.; La, Y.; Zhu, H.; Yang, Y.; Jiang, L.; Chen, Y.; Feng, G.; Li, H.; Sang, H.; Hao, X.; et al. Abnormal changes of plasma acute phase proteins in schizophrenia and the relation between schizophrenia and haptoglobin (Hp) gene. Amino Acids 2007, 32, 101–108. [Google Scholar] [CrossRef]
- Song, X.X.; Li, X.; Gao, J.; Zhao, J.; Li, Y.; Fan, X.; Lv, L. APOA-I: A possible novel biomarker for metabolic side effects in first episode schizophrenia. PLoS ONE 2014, 9, e93902. [Google Scholar] [CrossRef]
- Martins-de-Souza, D.; Solari, F.A.; Guest, P.C.; Zahedi, R.P.; Steiner, J. Biological pathways modulated by antipsychotics in the blood plasma of schizophrenia patients and their association to a clinical response. NPJ Schizophr. 2015, 1, 15050. [Google Scholar] [CrossRef]
- Butkova, T.V.; Kopylov, A.T.; Stepanov, A.A.; Malsagova, K.A.; Kostyuk, G.P.; Zakharova, N.V.; Bravve, L.V.; Sinicyna, A.A.; Kaysheva, A.L. Proteome data of serum samples from patients with schizophrenia. Data Brief 2020, 29, 105338. [Google Scholar] [CrossRef] [PubMed]
- Levin, Y.Y.; Schwarz, E.; Wang, L.; Leweke, F.M.; Bahn, S. Label-free LC-MS/MS quantitative proteomics for large-scale biomarker discovery in complex samples. J. Sep. Sci. 2007, 30, 2198–2203. [Google Scholar] [CrossRef] [PubMed]
- Schwarz, E.; Levin, Y.; Wang, L.; Leweke, F.M.; Bahn, S. Peptide correlation: A means to identify high quality quantitative information in large-scale proteomic studies. J. Sep. Sci. 2007, 30, 2190–2197. [Google Scholar] [CrossRef] [PubMed]
- Davalieva, K.; Kostovska, I.M.; Dwork, A.J. Proteomics Research in Schizophrenia. Front. Cell Neurosci. 2016, 10, 18. [Google Scholar] [CrossRef] [PubMed]
- Schwarz, E.; Bahn, S. Biomarker discovery in psychiatric disorders. Electrophoresis 2008, 29, 2884–2890. [Google Scholar] [CrossRef] [PubMed]
- Guest, P.C.; Guest, F.L.; Martins-de Souza, D. Making Sense of Blood-Based Proteomics and Metabolomics in Psychiatric Research. Int. J. Neuropsychopharmacol. 2016, 19, pyv138. [Google Scholar] [CrossRef] [PubMed]
- Lee, P.Y.; Osman, J.; Low, T.Y.; Jamal, R. Plasma/serum proteomics: Depletion strategies for reducing high-abundance proteins for biomarker discovery. Bioanalysis 2019, 11, 1799–1812. [Google Scholar] [CrossRef]
- Georgila, K.; Vyrla, D.; Drakos, E. Apolipoprotein A-I (ApoA-I), Immunity, Inflammation and Cancer. Cancers 2019, 11, 1097. [Google Scholar] [CrossRef]
- Woods, A.G.; Sokolowska, I.; Taurines, R.; Gerlach, M.; Dudley, E.; Thome, J.; Darie, C.C. Potential biomarkers in psychiatry: Focus on the cholesterol system. J. Cell. Mol. Med. 2012, 16, 1184–1195. [Google Scholar] [CrossRef]
- Comes, A.L.; Papiol, S.; Mueller, T.; Geyer, P.E.; Mann, M.; Schulze, T.G. Proteomics for blood biomarker exploration of severe mental illness: Pitfalls of the past and potential for the future. Transl. Psychiatry 2018, 8, 160. [Google Scholar] [CrossRef]
- Dean, B.; Digney, A.; Sundram, S.; Thomas, E.; Scarr, E. Plasma apolipoprotein E is decreased in schizophrenia spectrum and bipolar disorder. Psychiatry Res. 2008, 158, 75–78. [Google Scholar] [CrossRef] [PubMed]
- Boiko, A.S.; Mednova, I.A.; Kornetova, E.G.; Semke, A.V.; Bokhan, N.A.; Loonen, A.J.M.; Ivanova, S.A. Apolipoprotein serum levels related to metabolic syndrome in patients with schizophrenia. Heliyon 2019, 5, e02033. [Google Scholar] [CrossRef] [PubMed]
- Yang, M.; Liu, Y.; Dai, J.; Li, L.; Ding, X.; Xu, Z.; Mori, M.; Miyahara, H.; Sawashita, J.; Higuchi, K. Apolipoprotein A-II induces acute-phase response associated AA amyloidosis in mice through conformational changes of plasma lipoprotein structure. Sci. Rep. 2018, 8, 5620. [Google Scholar] [CrossRef] [PubMed]
- Qu, J.; Ko, C.W.; Tso, P.; Bhargava, A. Apolipoprotein A-IV: A Multifunctional Protein Involved in Protection against Atherosclerosis and Diabetes. Cells 2019, 8, 319. [Google Scholar] [CrossRef]
- Dassati, S.; Waldner, A.; Schweigreiter, R. Apolipoprotein D takes center stage in the stress response of the aging and degenerative brain. Neurobiol. Aging 2014, 35, 1632–1642. [Google Scholar] [CrossRef] [PubMed]
- Frye, M.A.; Nassan, M.; Jenkins, G.D.; Kung, S.; Veldic, M.; Palmer, B.A.; Feeder, S.E.; Tye, S.J.; Choi, D.S.; Biernacka, J.M. Feasibility of investigating differential proteomic expression in depression: Implications for biomarker development in mood disorders. Transl. Psychiatry 2015, 5, e689. [Google Scholar] [CrossRef]
- Reay, W.R.; Cairns, M.J. The role of the retinoids in schizophrenia: Genomic and clinical perspectives. Mol. Psychiatr. 2020, 25, 706–718. [Google Scholar] [CrossRef]
- Maes, M.; Delanghe, J.; Bocchio Chiavetto, L.; Bignotti, S.; Tura, G.-B.; Pioli, R.; Zanardini, R.; Altamura, A.C. Haptoglobin polymorphism and schizophrenia: Genetic variation on chromosome 16. Psychiatry Res. 2001, 104, 1–9. [Google Scholar] [CrossRef]
- Song, R.; Shi, Y.; Li, X.; Zhu, J.; Zhang, H.; Li, K.; Wang, B.; Zhang, H.; Yang, Y.; Gao, L.; et al. Potential of Antithrombin III as a Biomarker of Antidepressive Effect in Major Depressive Disorder. Front. Psychiatry 2021, 12, 678384. [Google Scholar] [CrossRef]
- Howard, M.; Farrar, C.A.; Sacks, S.H. Structural and functional diversity of collectins and ficolins and their relationship to disease. Semin. Immunopathol. 2018, 40, 75–85. [Google Scholar] [CrossRef]
- Gracia, D.D.F.K.; Gomes, E.M.P.; Coelho, T.A.; Carriello, M.; de Andrade, F.A.; Bavia, L.; Messias-Reason, I.J.; Massuda, R. Ficolin activation as a potential biomarker of the severity of schizophrenia. Psychiatry Res. 2021, 304, 114122. [Google Scholar] [CrossRef] [PubMed]
- Lehrer, R.I.; Lu, W. α-Defensins in human innate immunity. Immunol. Rev. 2012, 245, 84–112. [Google Scholar] [CrossRef] [PubMed]
- Khandaker, G.M.; Cousins, L.; Deakin, J.; Lennox, B.R.; Yolken, R.; Jones, P.B. Inflammation and immunity in schizophrenia: Implications for pathophysiology and treatment. Lancet Psychiatry 2015, 2, 258–270. [Google Scholar] [CrossRef]
- Müller, N.; Weidinger, E.; Leitner, B.; Schwarz, M.J. The role of inflammation in schizophrenia. Front. Neurosci.-Switz. 2015, 9, 372. [Google Scholar] [CrossRef] [PubMed]
- Smigielski, L.L.; Jagannath, V.; Rössler, W.; Walitza, S.; Grünblatt, E. Epigenetic mechanisms in schizophrenia and other psychotic disorders: A systematic review of empirical human findings. Mol. Psychiatry 2020, 25, 1718–1748. [Google Scholar] [CrossRef] [PubMed]
- Huang, L.; Shao, D.; Wang, Y.; Cui, X.; Li, Y.; Chen, Q.; Cui, J. Human body-fluid proteome: Quantitative profiling and computational prediction. Brief. Bioinform. 2020, 22, 315–333. [Google Scholar] [CrossRef]
- Rodrigues, J.E.; Martinho, A.; Santos, V.; Santa, C.; Madeira, N.; Martins, M.J.; Pato, C.N.; Macedo, A.; Manadas, B. Systematic review and meta-analysis on MS-based proteomics applied to human peripheral fluids to assess potential biomarkers of bipolar disorder. Int. J. Mol. Sci. 2022. submitted. [Google Scholar]
- Ochoa, S.; Usall, J.; Cobo, J.; Labad, X.; Kulkarni, J. Gender differences in schizophrenia and first-episode psychosis: A comprehensive literature review. Schizophr. Res. Treat. 2012, 2012, 916198. [Google Scholar] [CrossRef]
- Riecher-Rössler, A.A.; Butler, S.; Kulkarni, J. Sex and gender differences in schizophrenic psychoses—A critical review. Arch. Women’s Ment. Health 2018, 21, 627–648. [Google Scholar] [CrossRef]
- Giordano, G.M.; Bucci, P.; Mucci, A.; Pezzella, P.; Galderisi, S. Gender Differences in Clinical and Psychosocial Features Among Persons with Schizophrenia: A Mini Review. Front. Psychiatry 2021, 12, 789179. [Google Scholar] [CrossRef]
- Fulone, I.; Silva, M.T.; Lopes, L.C. Gender differences in the use of atypical antipsychotics in early-onset schizophrenia: A nationwide population-based study in Brazil. BMC Psychiatry 2021, 21, 320. [Google Scholar] [CrossRef] [PubMed]


| First Author | Year | Schizophrenia (SCZ) | Controls (CTR) | Other Disorders (OD) | Clinical Criteria | Ref. | ||||||||
|---|---|---|---|---|---|---|---|---|---|---|---|---|---|---|
| n | Age | Illness Duration | Gender (m/f) | n | Age | Gender (m/f) | n | Age | Illness Duration | Gender (m/f) | ||||
| L. Smirnova | 2019 | 33 | 34 (28–40) | 7 (4–16) | 11/22 | 24 | 28 (21–55) | 6/18 | 23 (BD) | 32 (21–52) | 8 (5–11) | 14/9 | ICD-10 | [63] |
| Rodrigues-Amorim | 2019 | 45 | 41 ± 15 | 12 ± 11 | 28/17 | 43 | 44 ± 14 | 26/17 | --- | --- | --- | --- | DSM-V | [64] |
| G.S. Pessoa | 2019 | 19 | 37 ± 11 | 7.6 ± 5.4 | 13/6 | 13 | 38 ± 16 | 3/10 | 19 (BD) | 41 ± 17 | 6.4 ± 6.1 | 7/12 | ICD-10 | [65] |
| C. Walss-Bass | 2019 | 60 | 43 ± 1.4 | --- | 46/14 | 20 | 41 ± 2.6 | 14/6 | --- | --- | --- | --- | DSM-IV | [66] |
| J. D. Cooper | 2017 | 60 | 31 ± 10 | --- | 31/29 | 76 | 32 ± 9.0 | 43/36 | --- | --- | --- | --- | ICD-9 and ICD-10 | [67] |
| T. L. Huang | 2017 | 20 | 38 ± 11 | --- | 9/11 | 20 | 39 ± 6.5 | 7/13 | --- | --- | --- | --- | DSM-IV | [68] |
| C. Knochel | 2017 | 29 | 37 ± 11 | 12 ± 7.8 | 21/8 | 93 | 34 ± 11 | 44/39 | 25 (BD) | 38 ± 10 | 8.9 ± 5.5 | 19/6 | DSM-IV | [69] |
| J.R. De Jesus | 2017 | 23 | 34 ± 9 | 8.7 ± 7.5 | 17/6 | 12 (3 HCF; 9 HCNF) | 39 ± 9 (HCF); 35 ± 8 (HCNF) | 1/2 (HCF); 2/7 (HCNF) | 14 (BD); 4 (OD) | 36 ± 9 (BD); 31 ± 5 (OD) | 4.5 ± 4.3 (BD); 4.5 ± 2.9 (OD) | 5/9 (BD); 3/1 (OD) | ICD-10 | [70] |
| I. V. Alekseeva | 2017 | 10 | 35 ± 13 | --- | 6/4 | 10 | 39 ± 11 | 3/7 | --- | --- | --- | ICD-10 | [71] | |
| Y. H. Ding | 2015 | 44 | 33 ± 8.4 | --- | 20/24 | 40 | 34 ± 9.2 | 18/22 | 26 (DP) | 33 ± 8.6 | --- | 11/15 | ICD-10 | [72] |
| K. Al Awam | 2015 | 26 | 37 ± 12 | 12 ± 12 | 20/6 | 26 | 37 ± 11 | 20/6 | --- | --- | --- | --- | DSM-IV | [73] |
| J. Iavarone | 2014 | 32 | --- | --- | --- | 31 | --- | --- | 17 (BD) | --- | --- | --- | DSM-IV and ICD-10 | [74] |
| Y. Li | 2012 | 10 | 52 ± 6.4 | --- | 5/5 | 10 | 53 ± 6.2 | 5/5 | --- | --- | --- | --- | DSM-IV | [75] |
| J. Jaros | 2012 | 20 | 31 ± 9.4 | --- | 10/10 | 20 | 32 ± 9.3 | 10/10 | --- | --- | --- | --- | ICD-10 | [76] |
| M. M. Raiszadeh | 2012 | 8 | 16 ± 9.7 | --- | 6/2 | 4 | 22 | --- | --- | --- | --- | --- | DSM-IV | [77] |
| M. Herberth | 2011 | 19 | 30 ± 8.9 | --- | 14/5 | 19 | 35 ± 7.2 | 12/7 | --- | --- | --- | --- | DSM-IV | [78] |
| Y. Levin | 2010 | 22 | 29 ± 11 | --- | 15/7 | 33 | 28 ± 7.0 | 18/15 | --- | --- | --- | --- | DSM-IV | [79] |
| R. M. Craddock | 2008 | 15 | 36 ± 15 | --- | 11/4 | 15 | 34 ± 9.6 | 11/4 | --- | --- | --- | --- | DSM-IV | [80] |
| C. Wan | 2007 | 42 | 34 ± 20 | --- | 26/16 | 46 | 39 ± 12 | 22/24 | --- | --- | --- | --- | DSM-III | [81] |
| Author (Year) | Cohort Information | Sample | Type of Sampling | Drug Naive | MS-Based Method | Other Techniques | Quantification Method | Depletion/Enrichment | Altered Proteins | Altered Pathways | Ref. |
|---|---|---|---|---|---|---|---|---|---|---|---|
| Smirnova (2019) | 33 SCZ; 23 BD; 24 CT | Serum | Individual | Yes | 1DE-LC-MS/MS | ELISA (Q6UB98; P33151) | MS | Yes/No | SCZ vs. CTR vs. BD:↑ (A2ML1; ZN189; SMC2; FA12; AACT; APOE; A2GL; IPSP; DMD; CPN2; ABL2; ACTB; ACTG; PRKDC; DCD; RL19; LRP2; LG3BP; ITSN1; ECM1; ARMX4; ANR12; DHX29; DYH5; PINX1; CNDP1; FETUB); ↓ (TNRC18; APOM; CASB; C1QA; RET4; APOD; TETN; CO8G; CO6; DESP; VGFR1; EST1; CADH5; KI67; MYT1; HORN; MAGE1; GULP1) | SCZ: immune response, cell communication, cell growth and maintenance, protein metabolism, and regulation of nucleic acid metabolism. BD: immune response, regulating transport processes across the cell membrane and cell communication, development of neurons and oligodendrocytes, and cell growth. | [63] |
| Rodrigues-Amorim (2019) | 45 SCZ (10 FEP; 35 chronic); 43 CT | Plasma | Individual | No | 1DE-LC-MS/MS | WB (drebrin, GMFB, BDNF, RAB3GAP1, attractin) | MS | No/Yes | 1302 proteins screened and 34 selected (specific funccctions at CNS level). 5 proteins analyzed. SCZ vs. CT: ↓ (BDNF; GMFB; RB3GAP1) | Psychoneuroimmune signaling. The available evidence suggests that SCZ causes dysfunction in synaptic, neurotransmission, and neuronal patterns. | [64] |
| Pessoa (2019) | 19 SCZ; 19 BD; 13 CT | Serum | Pooled | No | LC-MS/MS and LC/ICP-MS | --- | MS | No/No | SCZ vs. CT:↑ (IGHG1; KV320); ↓ (IGKC; IGLC2; TRFE; J3QRN2; IGHG3; KVD28; S4R460; LV325; IGHG2) | Imbalance in the homeostasis of important micronutrients. | [65] |
| Walss-Bass (2019) | 60 SCZ; 20 CT | Plasma | Pooled | No | 1DE-LC-MS/MS | ELISA (C4A; APOB) | MS | Yes/Yes | Total ID: 10. SCZ vs. CT: ↑ (C4; APOB) | C4 levels in patients are likely due to the presence of the illness itself, while APOB may be a marker of antipsychotic-induced alterations. | [66] |
| Cooper (2017) | 60 SCZ; 77 CT (Cologne study) | Serum | Individual | Yes | LC-MS/MS (MRM mode) | --- | MS | No/No | 77 proteins (68 analyzed after QC) were quantified of a total of 101 selected proteins. SCZ vs. CT: ↑ (HPT; ICI; ANT3; CO4A; AACT; ITIH4; CO9; FCN3; A2AP;APOH); ↓ (APOA2; APOC3; APOA4; APOC1) | Coagulation, metabolism, and inflammation pathways. Suggest that an increased oxidative stress response may represent an inherent SCZ vulnerability. | [67] |
| Huang (2017) | 20 SCZ; 20 CT | PBMCs | Individual | No | MALDI-TOF MS | --- | MS | No/No | SCZ vs. CT:↑ (Alpha defensins) | Suggested the activation of immune pathway of PBMCs. | [68] |
| Knochel (2017) | 29 SCZ; 25 BD; 93 CT | Plasma | Individual | No | LC-MS/MS (MRM mode) | MRI | MS | No/No | SCZ vs. CT:↑ (APOC1, APOC2, APOC3, APOC4, CFAB, CO3, FCN3, KLKB1, MMP9, PEDF); ↓ (A2AP, ANT3, APOA1, APOA2, APOA4, APOB, APOD, APOE, APOF, APOL1, C1QC, F13B, HEP2, HRG, RET4) SCZ vs. BD: ↑ (APOC2; APOC4; C1QC; CO3; F13B; KLKB1; MMP9); ↓ (A2AP; ANT3; APOA1; APOA2; APOA4; APOB; APOC1; APOC3; APOD; APOE; APOF; APOL1; CFAB; FCN3; HEP2; HRG; PEDF; RET4) | Altered APOC expression in SCZ and BD was linked to cognitive decline and underlying morphological changes in both disorders. | [69] |
| De Jesus (2017) | 23 SCZ; 14 BD; 4 OD; 12 CT (3 HCF; 9 HCNF) | Serum | Pooled | No | LC-MS/MS | --- | 2D DIGE | Yes/No | SCZ vs. BD:↑ (C4A; C4B; SAMP) | Altered proteins are associated with an inflammatory response. | [70] |
| Alekseeva (2017) | 10 SCZ; 10 CT | Serum | Individual | No | 2DE MALDI-TOF/TOF | --- | 2DE | Yes/No | SCZ vs. CT:↑ (APOA4; HPT); ↓ (APOC2; APOC3; SAA1; CLUS; TTHY; ALBU; A1AT; Haptoglobin hp2α (protein ID)) | Altered proteins are associated to lipid homeostasis deregulation, and inflammatory response | [71] |
| Ding (2015) | 44 SCZ; 26 DP; 40 CT | Serum | Individual | No | SELDI-TOF-MS and MALDI-TOF MS | --- | MS | No/Yes | SCZ:↓ (N-terminal fragment of fibrinogen) | --- | [72] |
| Al Awam (2015) | 26 SCZ; 26 CT | Serum | Individual | No | MALDI-TOF-MS | GC-MS, FTIR | MS | No/Yes | Total Detected: 94; Significantly different: 11 protein ions. SCZ: ↓ (suggested to be a fragment of APOA1) | --- | [73] |
| Iavarone (2014) | 32 SCZ; 17 BD; 31 CT | Saliva | Individual | No | LC-MS/MS | --- | MS | No/No | SCZ vs. CT:↑ (α-defensins 1–4, S100A12, cystatin A and S-derivatives of cystatin B) | SCZ-associated dysregulation of the immune pathway of peripheral white blood cells. Suggested that the dysregulation of the BD group could involve the activation of a more specific cell type than that of the SCZ group. | [74] |
| Li (2012) | 10 SCZ; 10 CT | Serum | Individual | Yes | LC-MS/MS | ELISA | MS | Yes/No | Total ID: 1344. SCZ vs. CT: ↑ (CO8B; CD5L; DOPO; IGHG4; IGHM; KNG1; PI16; PGRP2; ITIH4; PLTP; IPSP; IGK@ protein; IGL@ protein); ↓ (AMPN; APOC2; APOF; C4BPB; APOL1; FA7; GGH; ICAM2; ALS; isoforms 2 of ITIH4; LBP; PROS; ZNF57) | Dysregulation of the alternative complement pathway in SCZ patients. | [75] |
| Jaros (2012) | 20 SCZ; 20 CT | Serum | Individual | Yes | LC-MS/MS | ELISA (RET4; FCN3) | MS | Yes/Yes ⁑ | Total ID: 312. Significantly different: 35. Phospho altered: 72. SCZ vs. CT: ↑ (K2C6B; FCN3; SRBS1; NUCB1; K1C9; NUDT6; ALS2; IBP3; MAST1; CFAB; C4BPA; FHR3; ITIH3; CO6; AGRE1); ↓ (CAH1; RET4; LRRC7; FR1L6; KI21B; TETN; KIF27; APOA1; APOA2; MYOF; FIBA; CCD57; SMC1A; K1C14; PHLD; LIFR; XIRP1 ↓; WDR19; SMC4; SAGE1) | Acute phase; Complement and coagulation system; Immune Response. | [76] |
| Raiszadeh (2012) | 23 SCZ; 55 CT For analysis: 4 SCZ; 4 CT (2nd pool) | Sweat | Pooled | No | LC-MS/MS and LC-MS/MS-MRM | --- | MS | No/No | 1st set Total ID: 150; 2nd set Total ID: 185; MRM: 30. SCZ vs. CT: ↑ (ZA2G; ANXA5; ARG2; BLMH; CALL5; CASPE; CDSN; CSTA; DCD; Desmoglein; DJ-;G3PDH; KLK11; KRT10; PRDX1; PEBP1; S100A7; THIO); ↓ (PIP) | Metabolic process. | [77] |
| Herberth (2011) | 19 SCZ; 19 CT | PBMCs | Individual | Drug naïve/ treated | LC-MS/MS | WB (ALDOC, GAPDH, LDHB, PGK1, TPIS) | MS | No/Yes | Unstimulated PBMCs:↑ (CNDP2; Uncharacterized protein KIAA0423; LDHB); ↓ (COTL1; GPI; HSP72). Stimulated PBMCs: ↑ (ALDOC; GAPDH; HNRPK; LDHB; MYH14; MYH15; NAMPT; PGK1; PPIA; TPIS; PKLR; PGAMA4); ↓ (CH60). | Glycolytic pathway, Immune response. | [78] |
| Levin (2010) | 22 SCZ; 33 CT | Serum | Individual | No | LC-MS/MS | ELISA (APOA1; APOA2; APOA4; FETUA) | MS | Yes/No | Total ID: 1411. Significantly different: 10. SCZ vs. CT: ↑ (CD5L; IGHM; F13B; TRFE; APOD; APOA1; FETUA; APOA4; APOA2; APOC1) | Lipid metabolism; molecular transport; Immune response. | [79] |
| Craddock (2008) | 15 SCZ; 15 CT | PBMCs | Individual | Yes | SELDI-TOF-MS | ELISA (α-defensins) | MS | No/Yes | SCZ:↑ (α-defensins) | Immune alteration. | [80] |
| Wan (2007) | 42 SCZ; 46 CT | Plasma | Individual | No | MALDI-TOF MS | --- | 2-DE | No/No | SCZ vs. CT:↑ (Haptoglobin a; a1-Antitrypsin; a1-Microglobulin; SAMP; ANT3; VTDB); | Evidence indicates that chronic systemic inflammation may be an aetiological agent of the pathophysiology of SCZ. | [81] |
Publisher’s Note: MDPI stays neutral with regard to jurisdictional claims in published maps and institutional affiliations. |
© 2022 by the authors. Licensee MDPI, Basel, Switzerland. This article is an open access article distributed under the terms and conditions of the Creative Commons Attribution (CC BY) license (https://creativecommons.org/licenses/by/4.0/).
Share and Cite
Rodrigues, J.E.; Martinho, A.; Santa, C.; Madeira, N.; Coroa, M.; Santos, V.; Martins, M.J.; Pato, C.N.; Macedo, A.; Manadas, B. Systematic Review and Meta-Analysis of Mass Spectrometry Proteomics Applied to Human Peripheral Fluids to Assess Potential Biomarkers of Schizophrenia. Int. J. Mol. Sci. 2022, 23, 4917. https://doi.org/10.3390/ijms23094917
Rodrigues JE, Martinho A, Santa C, Madeira N, Coroa M, Santos V, Martins MJ, Pato CN, Macedo A, Manadas B. Systematic Review and Meta-Analysis of Mass Spectrometry Proteomics Applied to Human Peripheral Fluids to Assess Potential Biomarkers of Schizophrenia. International Journal of Molecular Sciences. 2022; 23(9):4917. https://doi.org/10.3390/ijms23094917
Chicago/Turabian StyleRodrigues, João E., Ana Martinho, Catia Santa, Nuno Madeira, Manuel Coroa, Vítor Santos, Maria J. Martins, Carlos N. Pato, Antonio Macedo, and Bruno Manadas. 2022. "Systematic Review and Meta-Analysis of Mass Spectrometry Proteomics Applied to Human Peripheral Fluids to Assess Potential Biomarkers of Schizophrenia" International Journal of Molecular Sciences 23, no. 9: 4917. https://doi.org/10.3390/ijms23094917
APA StyleRodrigues, J. E., Martinho, A., Santa, C., Madeira, N., Coroa, M., Santos, V., Martins, M. J., Pato, C. N., Macedo, A., & Manadas, B. (2022). Systematic Review and Meta-Analysis of Mass Spectrometry Proteomics Applied to Human Peripheral Fluids to Assess Potential Biomarkers of Schizophrenia. International Journal of Molecular Sciences, 23(9), 4917. https://doi.org/10.3390/ijms23094917