
The Conformation of the N-Terminal Tails of Deinococcus grandis Dps Is Modulated by the Ionic Strength

 , , , , and
Abstract
:1. Introduction
2. Results
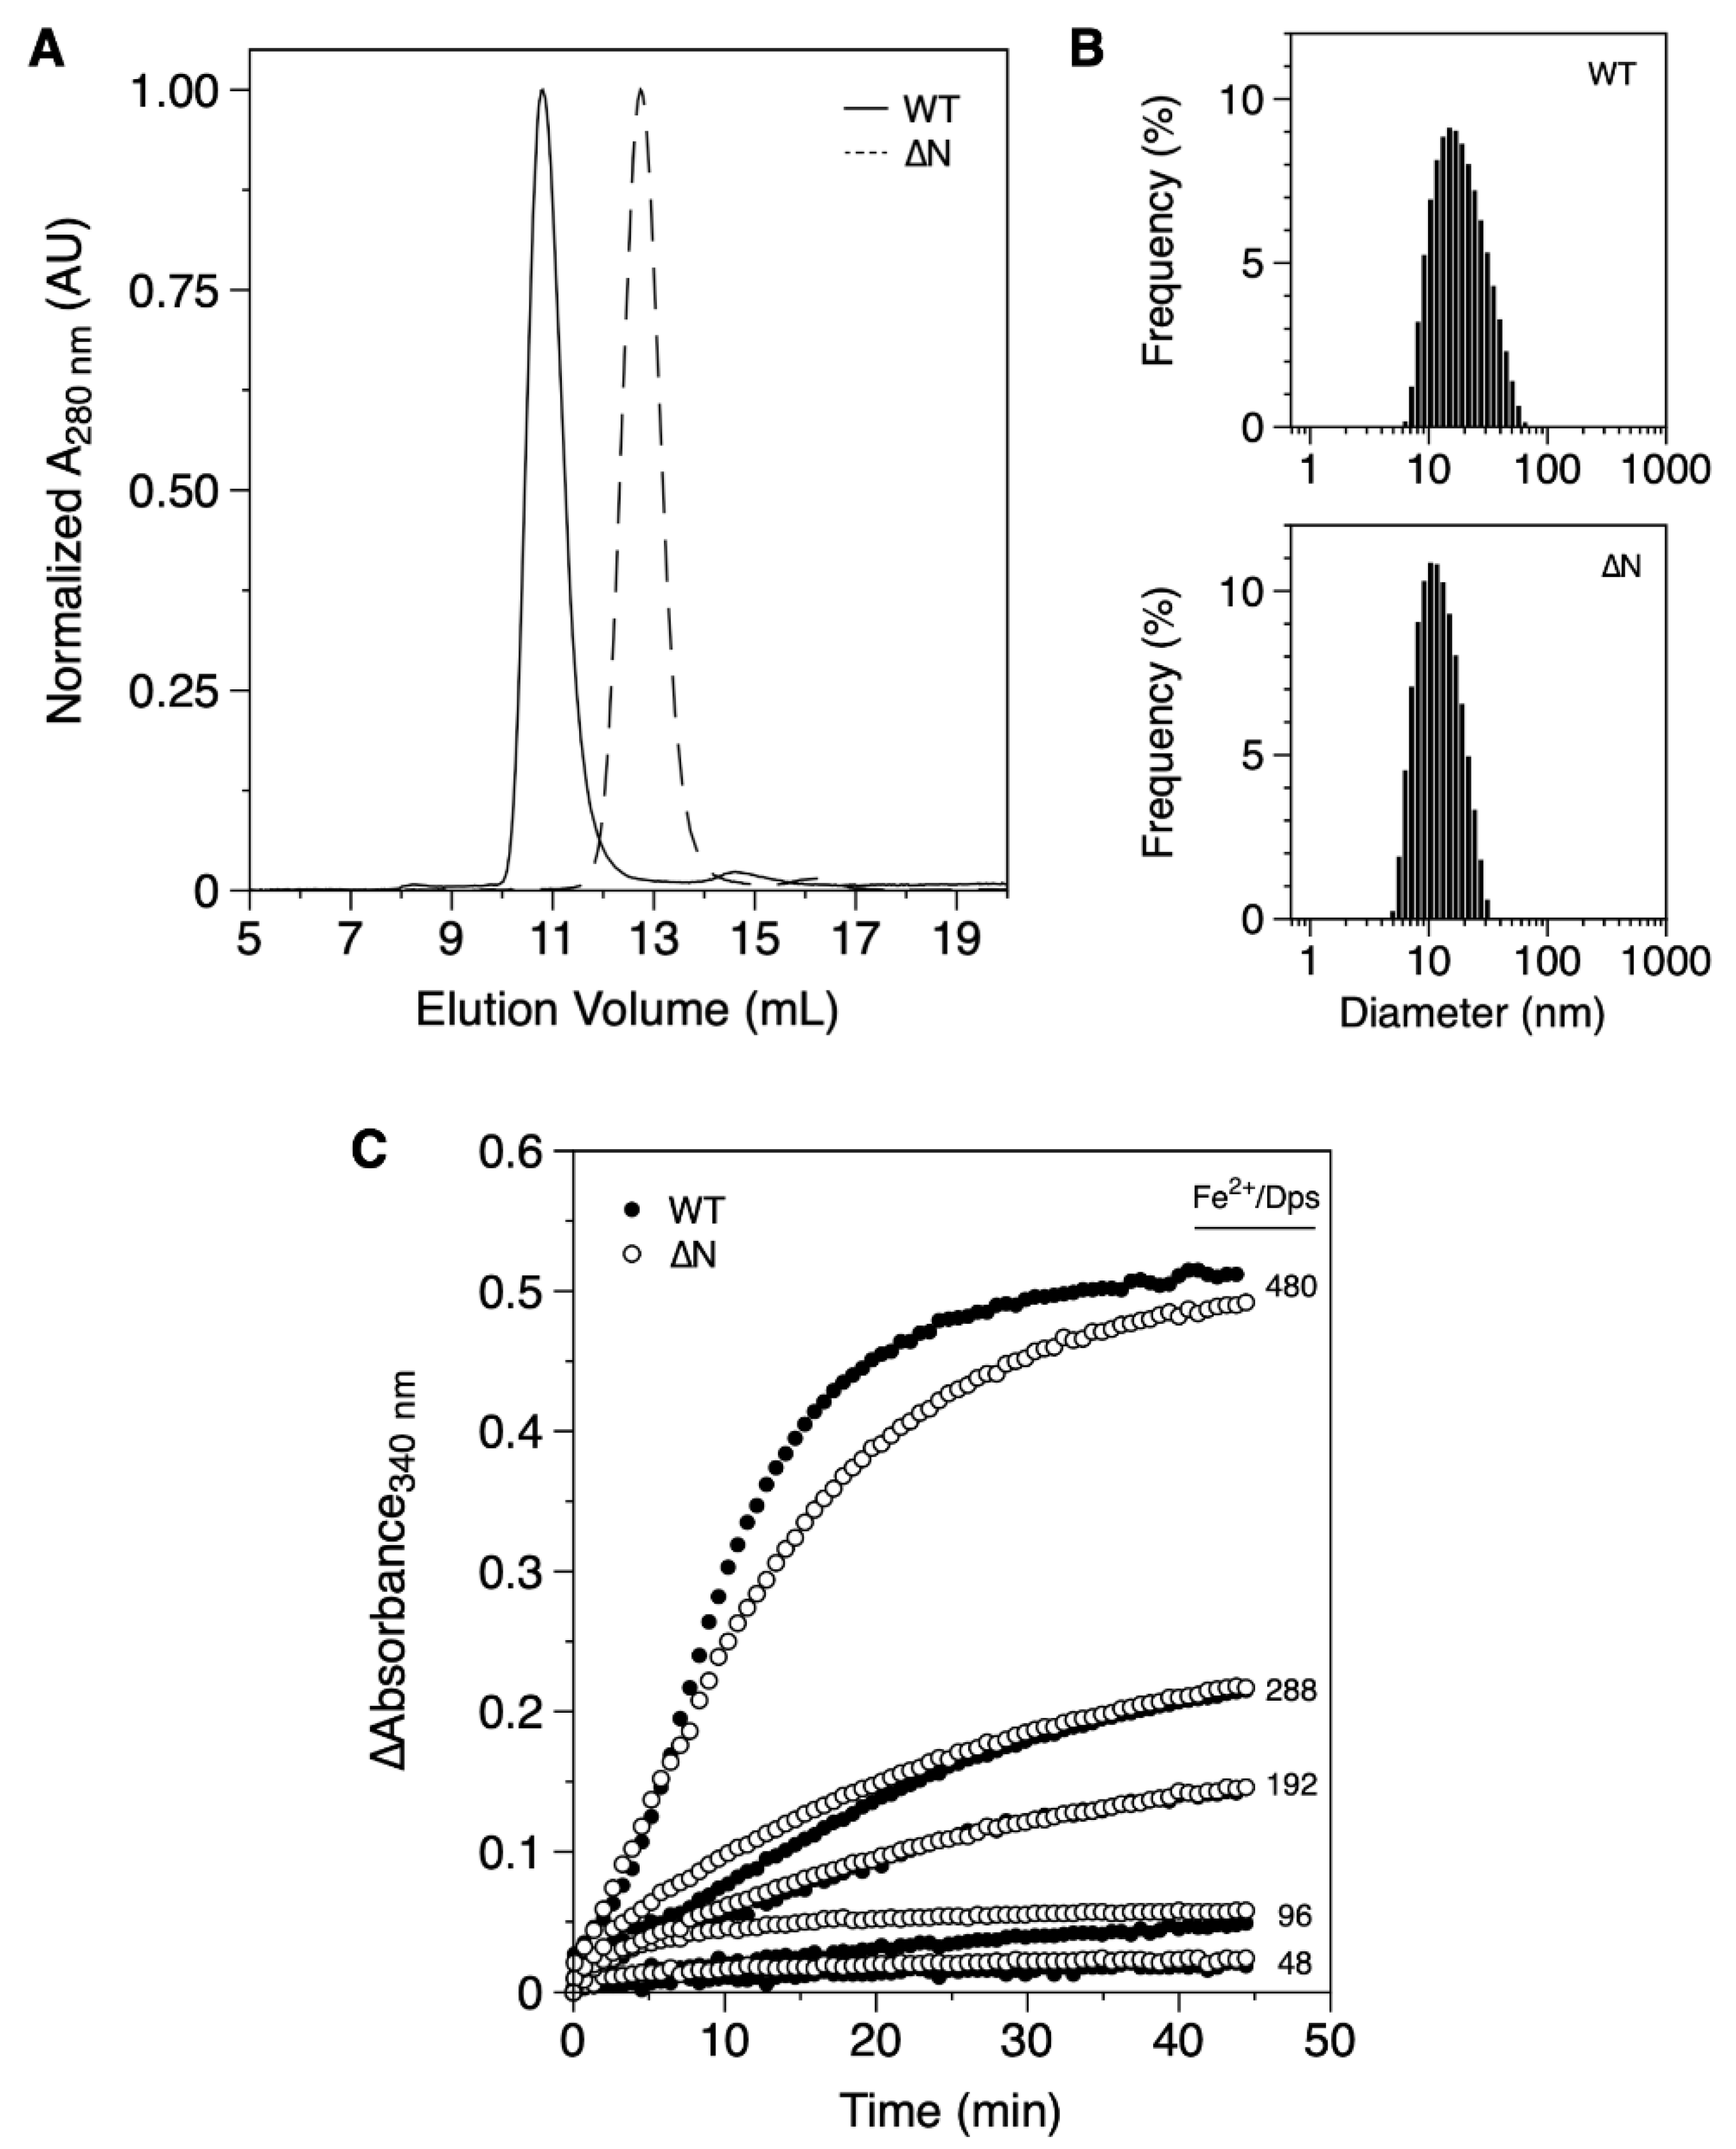
2.1. Expression and Characterization of Proteins
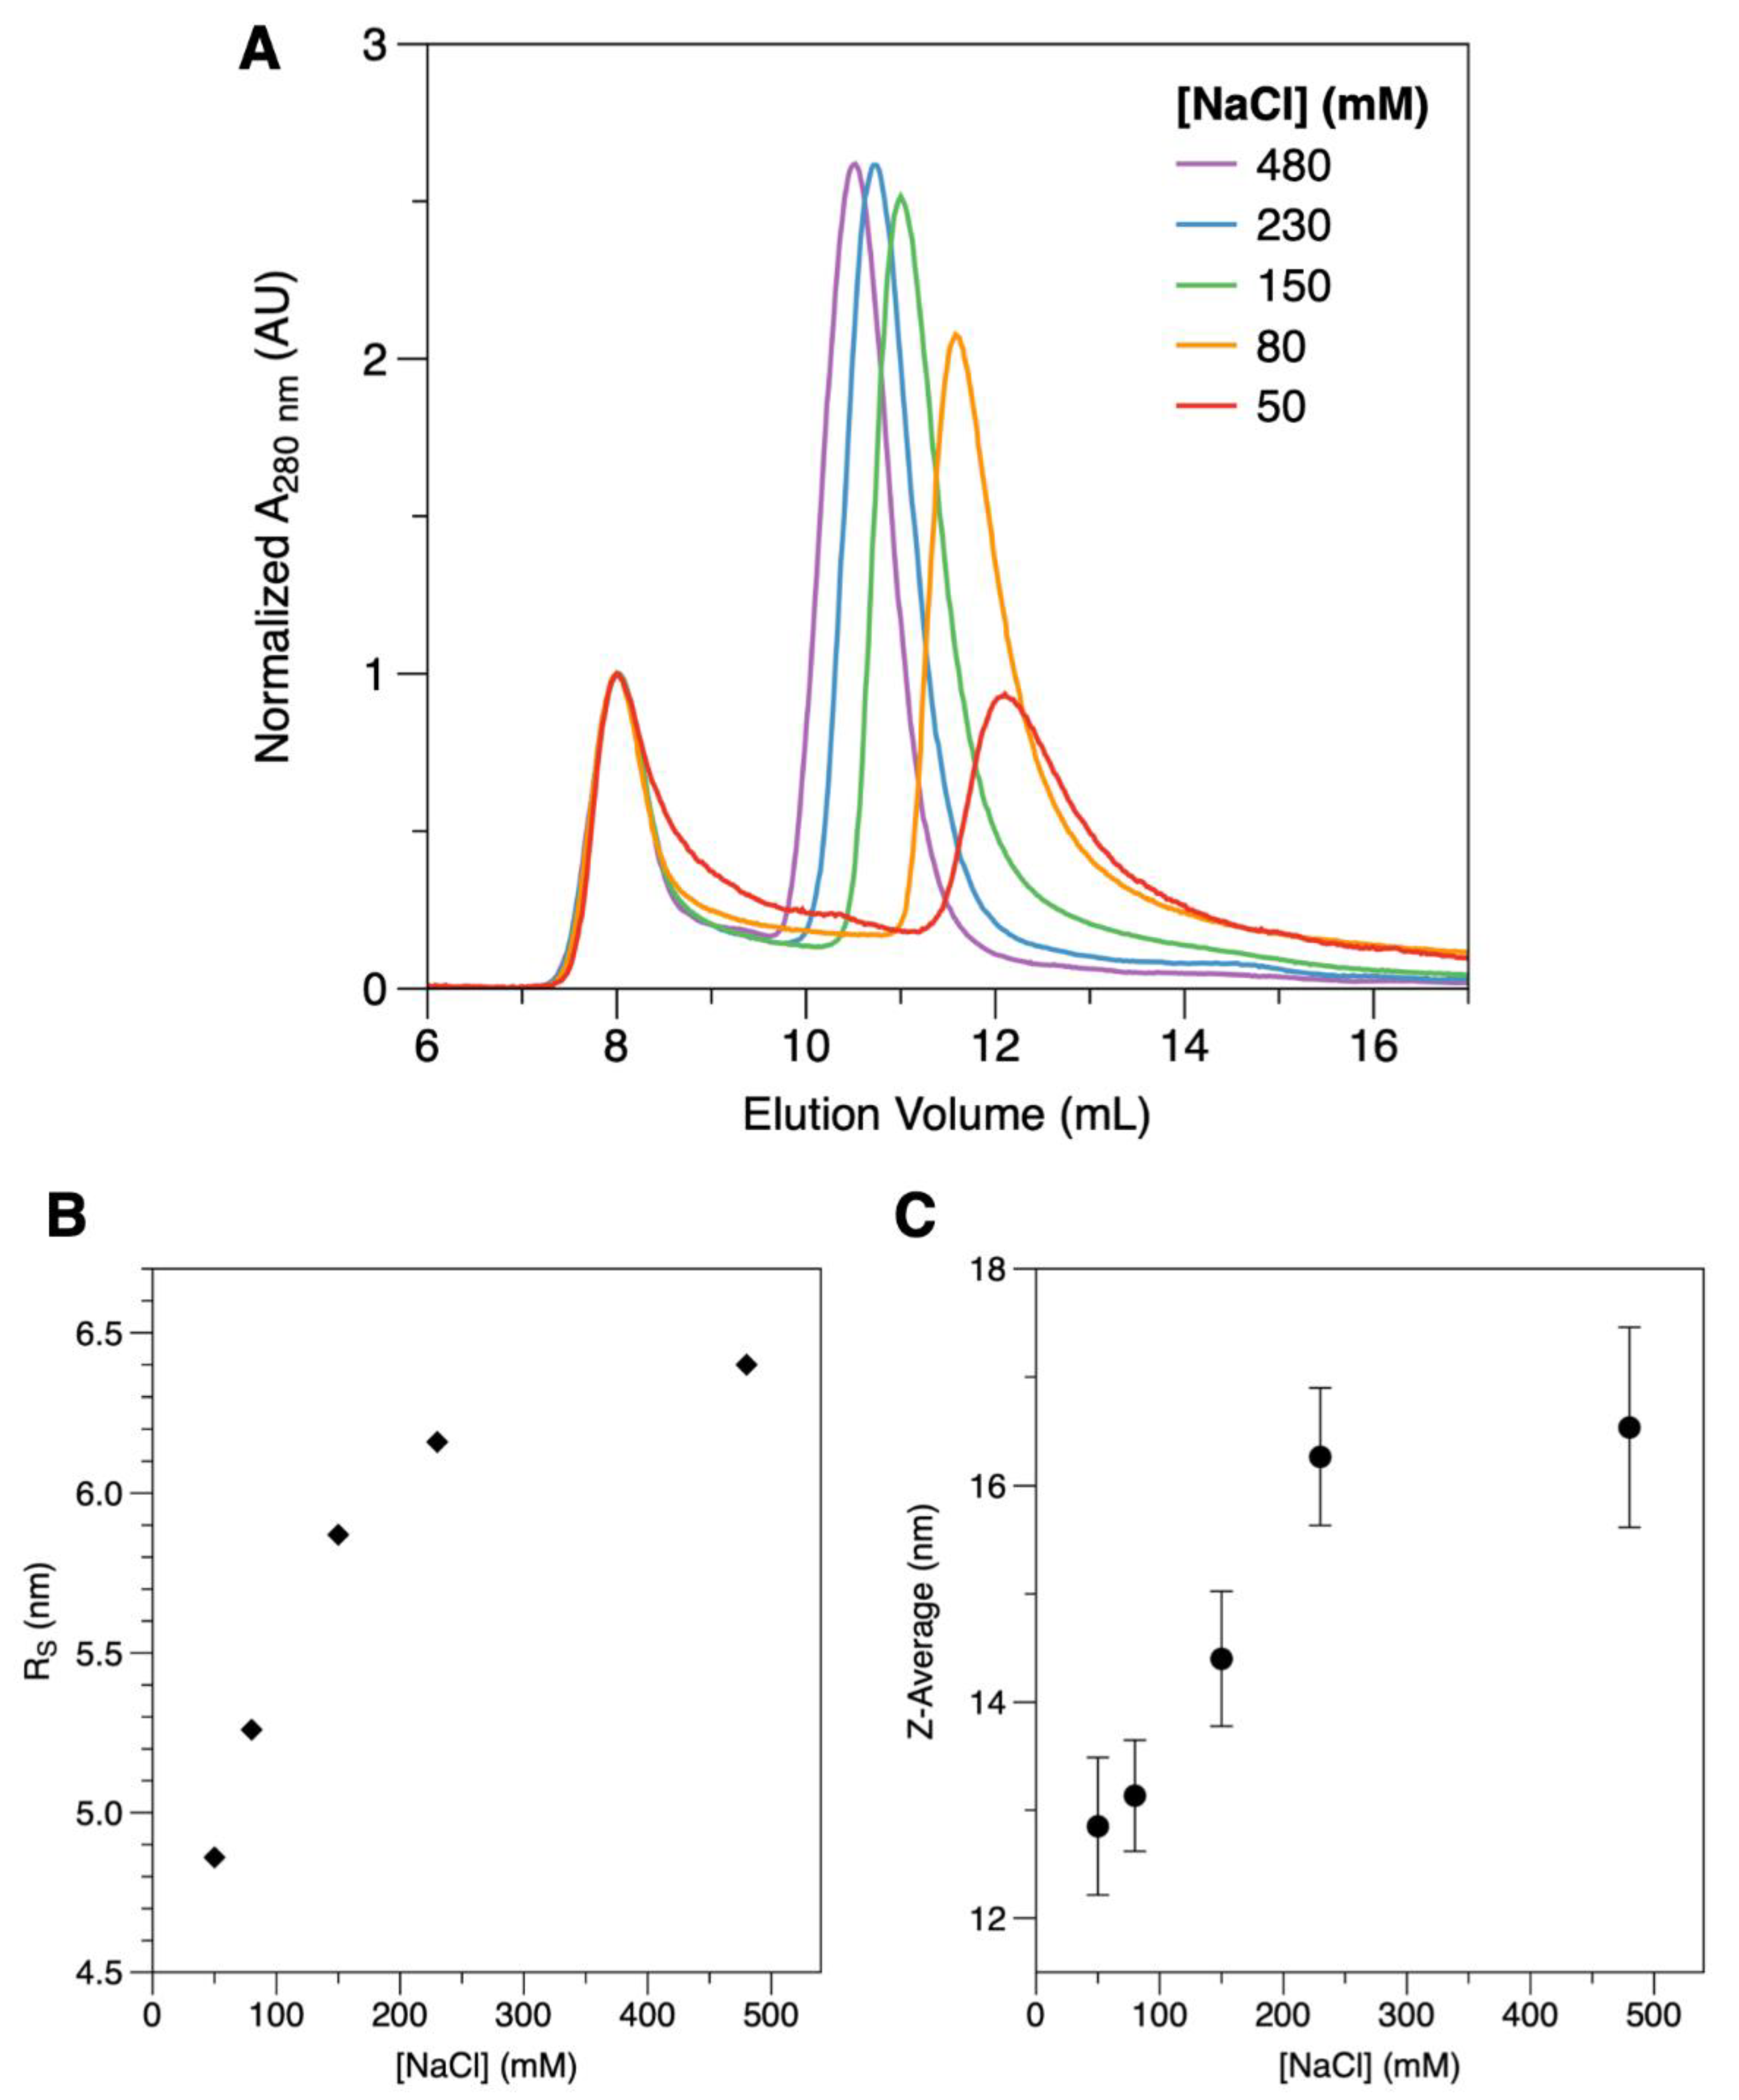
2.2. Conformational Dynamics
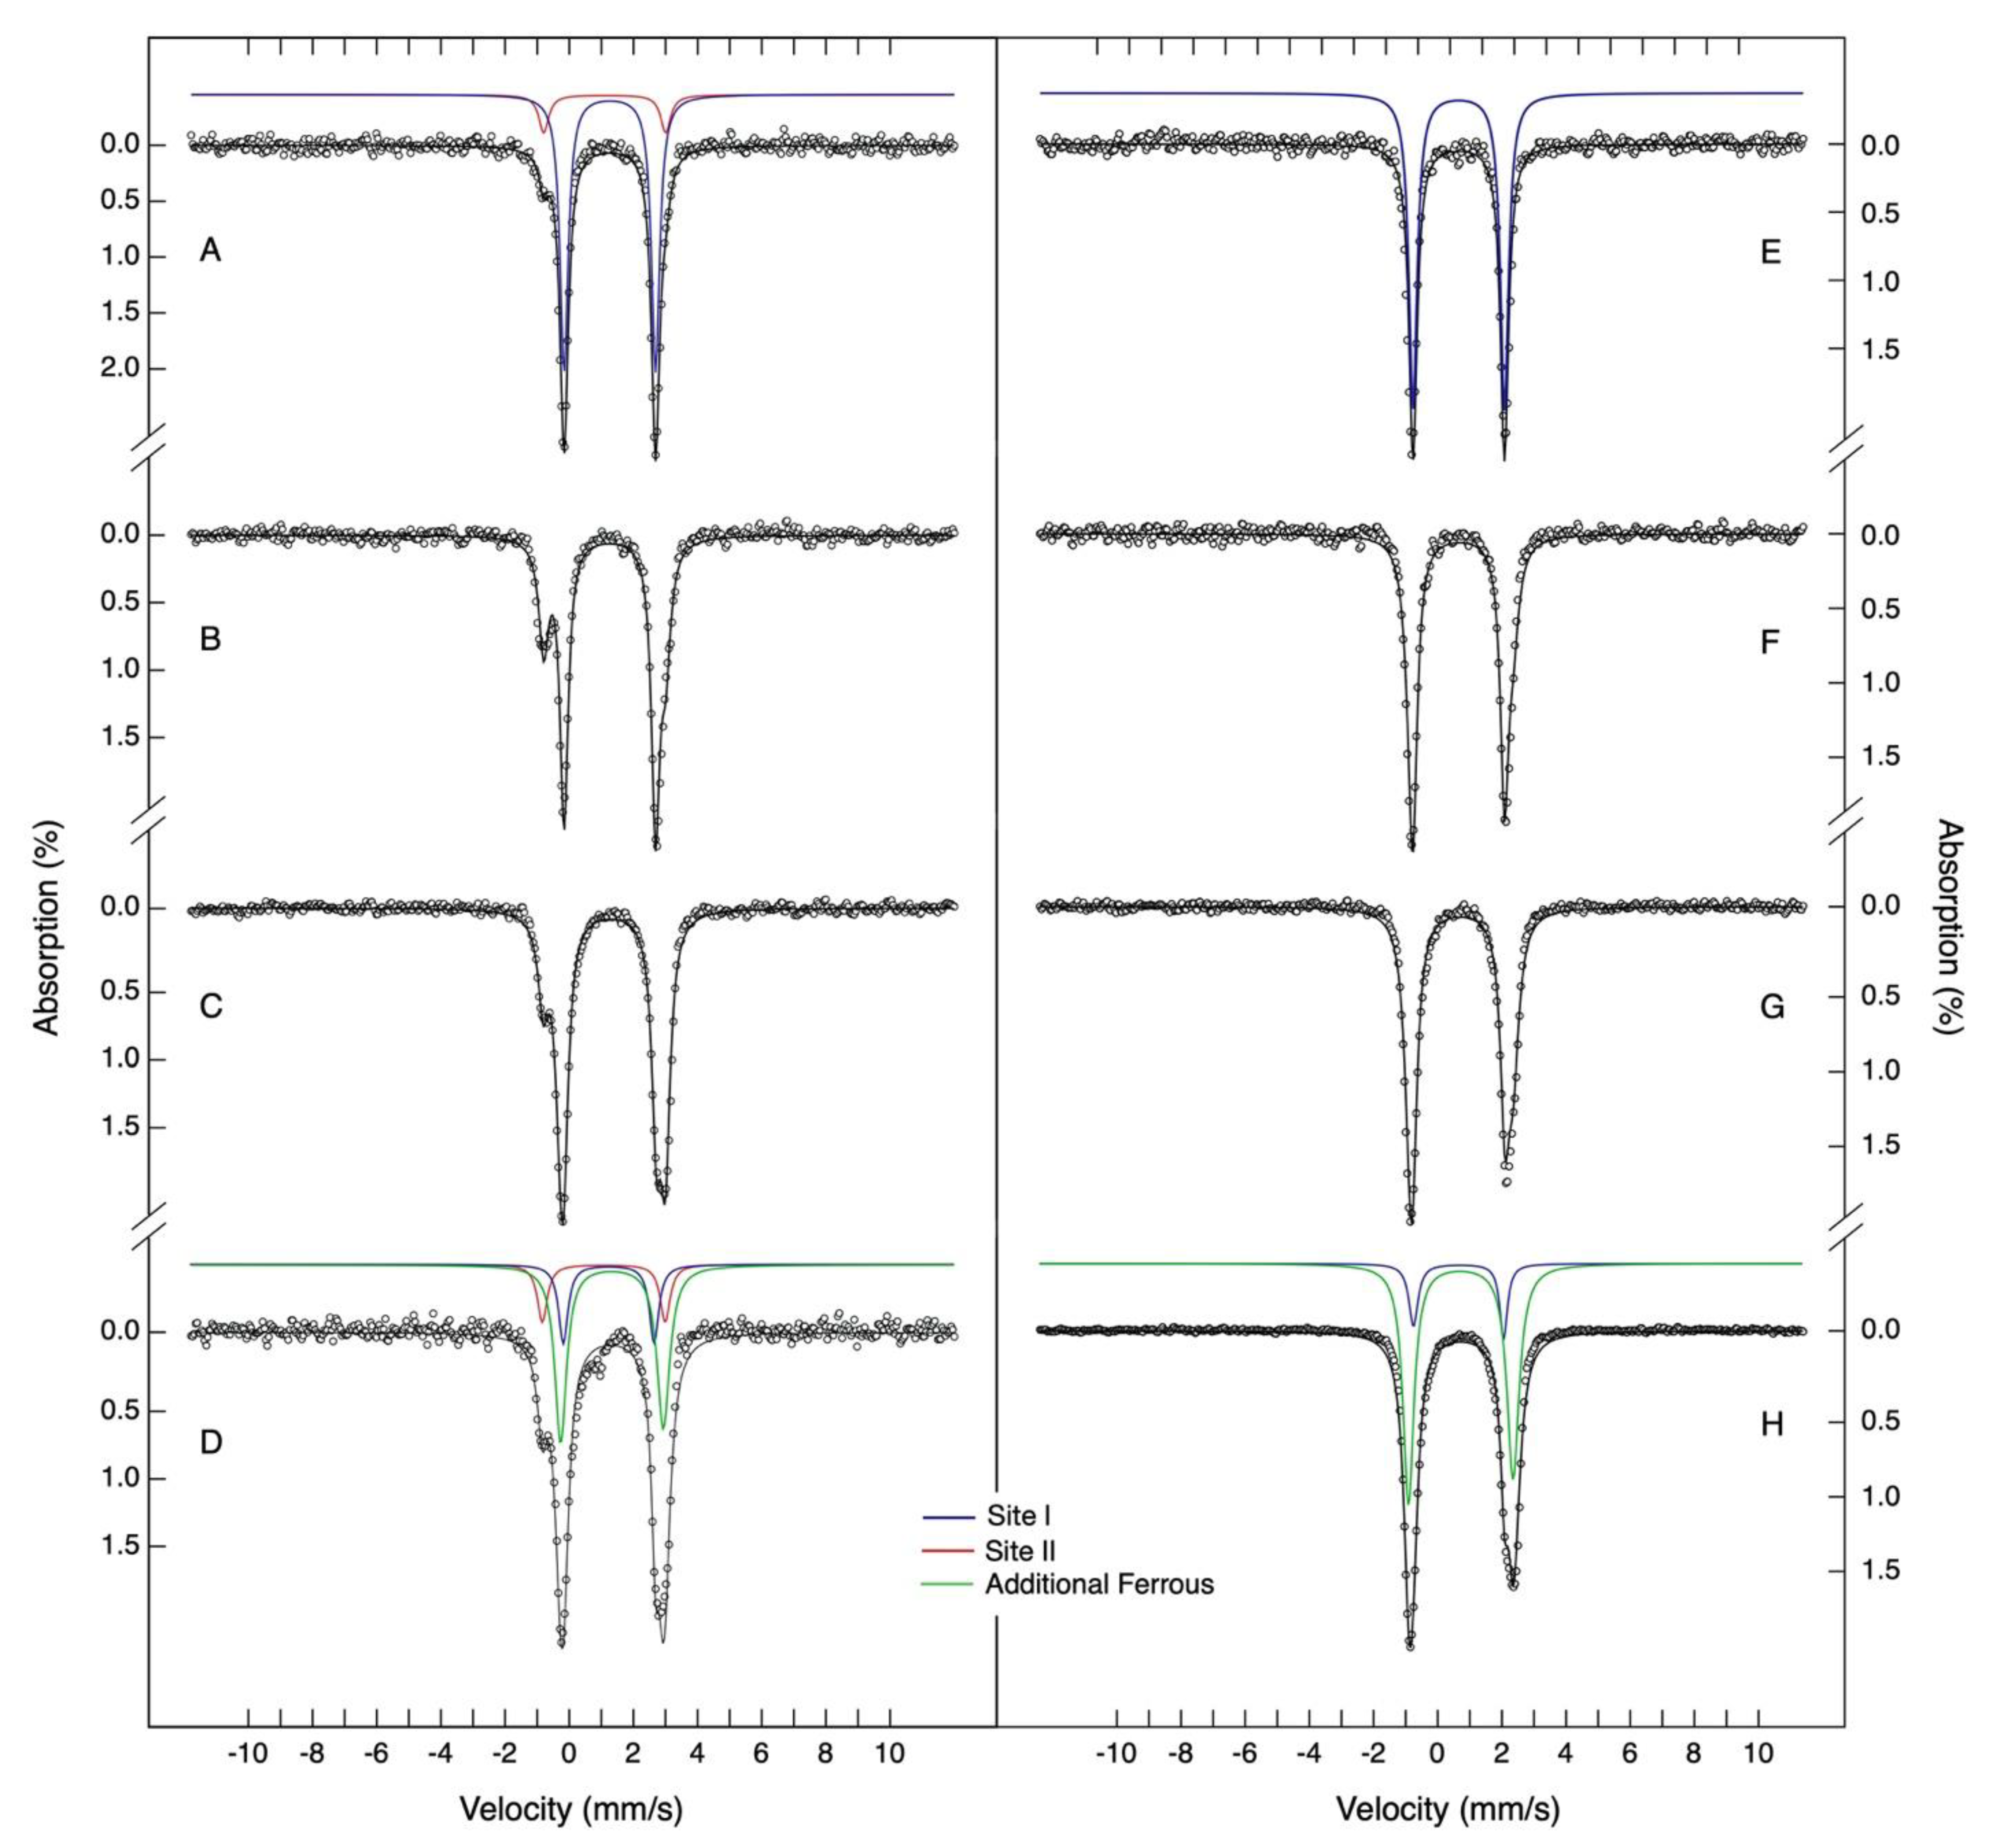
2.3. Detection of a Novel Iron-Binding Site in the N-Terminal Tail
3. Discussion
4. Materials and Methods
4.1. Gene Cloning, Protein Production and Purification
4.2. Analytical Size-Exclusion Chromatography
4.3. Dynamic Light Scattering
4.4. Circular Dichroism Spectroscopy
4.5. Iron Oxidation Activity Assays
4.6. Small-Angle X-ray Scattering Data Acquisition and Analysis
4.7. Mössbauer Spectroscopy
Supplementary Materials
Author Contributions
Funding
Institutional Review Board Statement
Informed Consent Statement
Data Availability Statement
Conflicts of Interest
References
- Williams, S.M.; Chatterji, D. An Overview of Dps: Dual Acting Nanovehicles in Prokaryotes with DNA Binding and Ferroxidation Properties. In Subcellular Biochemistry; Harris, J.R., Marles-Wright, J., Eds.; Subcellular Biochemistry; Springer International Publishing: Cham, Switzerland, 2021; Volume 96, pp. 177–216. ISBN 978-3-030-28150-2. [Google Scholar]
- Guerra, J.P.L.; Jacinto, J.P.; Tavares, P. Miniferritins: Small multifunctional protein cages. Coord. Chem. Rev. 2021, 449, 214187. [Google Scholar] [CrossRef]
- Ceci, P.; Cellai, S.; Falvo, E.; Rivetti, C.; Rossi, G.L.; Chiancone, E. DNA condensation and self-aggregation of Escherichia coli Dps are coupled phenomena related to the properties of the N-terminus. Nucleic Acids Res. 2004, 32, 5935–5944. [Google Scholar] [CrossRef] [PubMed] [Green Version]
- Zhao, G.; Ceci, P.; Ilari, A.; Giangiacomo, L.; Laue, T.M.; Chiancone, E.; Chasteen, N.D. Iron and Hydrogen Peroxide Detoxification Properties of DNA-binding Protein from Starved Cells. J. Biol. Chem. 2002, 277, 27689–27696. [Google Scholar] [CrossRef] [PubMed] [Green Version]
- Altuvia, S.; Almiron, M.; Huisman, G.; Kolter, R.; Storz, G. The dps promoter is activated by OxyR during growth and by IHF and σ s in stationary phase. Mol. Microbiol. 1994, 13, 265–272. [Google Scholar] [CrossRef]
- Ali Azam, T.; Iwata, A.; Nishimura, A.; Ueda, S.; Ishihama, A. Growth Phase-Dependent Variation in Protein Composition of the Escherichia coli Nucleoid. J. Bacteriol. 1999, 181, 6361–6370. [Google Scholar] [CrossRef] [Green Version]
- Grant, R.A.; Filman, D.J.; Finkel, S.E.; Kolter, R.; Hogle, J.M. The crystal structure of Dps, a ferritin homolog that binds and protects DNA. Nat. Struct. Biol. 1998, 5, 294–303. [Google Scholar] [CrossRef]
- Yang, X.; Chiancone, E.; Stefanini, S.; Ilari, A.; Chasteen, D.N. Iron oxidation and hydrolysis reactions of a novel ferritin from Listeria innocua. Biochem. J. 2000, 349, 783–786. [Google Scholar] [CrossRef] [Green Version]
- Roy, S.; Saraswathi, R.; Gupta, S.; Sekar, K.; Chatterji, D.; Vijayan, M. Role of N and C-terminal Tails in DNA Binding and Assembly in Dps: Structural Studies of Mycobacterium smegmatis Dps Deletion Mutants. J. Mol. Biol. 2007, 370, 752–767. [Google Scholar] [CrossRef]
- Bhattacharyya, G.; Grove, A. The N-terminal Extensions of Deinococcus radiodurans Dps-1 Mediate DNA Major Groove Interactions as well as Assembly of the Dodecamer. J. Biol. Chem. 2007, 282, 11921–11930. [Google Scholar] [CrossRef] [Green Version]
- Karas, V.O.; Westerlaken, I.; Meyer, A.S. The DNA-Binding Protein from Starved Cells (Dps) Utilizes Dual Functions To Defend Cells against Multiple Stresses. J. Bacteriol. 2015, 197, 3206–3215. [Google Scholar] [CrossRef] [Green Version]
- Ushijima, Y.; Yoshida, O.; Villanueva, M.J.A.; Ohniwa, R.L.; Morikawa, K. Nucleoid clumping is dispensable for the Dps-dependent hydrogen peroxide resistance in Staphylococcus aureus. Microbiology 2016, 162, 1822–1828. [Google Scholar] [CrossRef]
- Ceci, P.; Ilari, A.; Falvo, E.; Giangiacomo, L.; Chiancone, E. Reassessment of Protein Stability, DNA Binding, and Protection of Mycobacterium smegmatis Dps. J. Biol. Chem. 2005, 280, 34776–34785. [Google Scholar] [CrossRef] [Green Version]
- Roy, S.; Gupta, S.; Das, S.; Sekar, K.; Chatterji, D.; Vijayan, M. X-ray Analysis of Mycobacterium smegmatis Dps and a Comparative Study Involving Other Dps and Dps-like Molecules. J. Mol. Biol. 2004, 339, 1103–1113. [Google Scholar] [CrossRef]
- Roy, S.; Saraswathi, R.; Chatterji, D.; Vijayan, M. Structural Studies on the Second Mycobacterium smegmatis Dps: Invariant and Variable Features of Structure, Assembly and Function. J. Mol. Biol. 2008, 375, 948–959. [Google Scholar] [CrossRef]
- Stillman, T.J.; Upadhyay, M.; Norte, V.A.; Sedelnikova, S.E.; Carradus, M.; Tzokov, S.; Bullough, P.A.; Shearman, C.A.; Gasson, M.J.; Williams, C.H.; et al. The crystal structures of Lactococcus lactis MG1363 Dps proteins reveal the presence of an N-terminal helix that is required for DNA binding. Mol. Microbiol. 2005, 57, 1101–1112. [Google Scholar] [CrossRef]
- Jacinto, J.P.; Penas, D.; Guerra, J.P.L.; Almeida, A.V.; Jones, N.C.; Hoffmann, S.V.; Tavares, P.; Pereira, A.S. Dps–DNA interaction in Marinobacter hydrocarbonoclasticus protein: Effect of a single-charge alteration. Eur. Biophys. J. 2021, 50, 513–521. [Google Scholar] [CrossRef]
- Santos, S.P.; Mitchell, E.P.; Franquelim, H.G.; Castanho, M.A.R.B.; Abreu, I.A.; Romão, C.V. Dps from Deinococcus radiodurans: Oligomeric forms of Dps1 with distinct cellular functions and Dps2 involved in metal storage. FEBS J. 2015, 282, 4307–4327. [Google Scholar] [CrossRef] [Green Version]
- Kim, S.-G.; Bhattacharyya, G.; Grove, A.; Lee, Y.-H. Crystal Structure of Dps-1, a Functionally Distinct Dps Protein from Deinococcus radiodurans. J. Mol. Biol. 2006, 361, 105–114. [Google Scholar] [CrossRef]
- Reon, B.J.; Nguyen, K.H.; Bhattacharyya, G.; Grove, A. Functional comparison of Deinococcus radiodurans Dps proteins suggests distinct in vivo roles. Biochem. J. 2012, 447, 381–391. [Google Scholar] [CrossRef]
- Romão, C.V.; Mitchell, E.P.; McSweeney, S. The crystal structure of Deinococcus radiodurans Dps protein (DR2263) reveals the presence of a novel metal centre in the N terminus. JBIC J. Biol. Inorg. Chem. 2006, 11, 891–902. [Google Scholar] [CrossRef]
- Nguyen, K.H.; Grove, A. Metal Binding at the Deinococcus radiodurans Dps-1 N-Terminal Metal Site Controls Dodecameric Assembly and DNA Binding. Biochemistry 2012, 51, 6679–6689. [Google Scholar] [CrossRef] [PubMed]
- Santos, S.P.; Cuypers, M.G.; Round, A.; Finet, S.; Narayanan, T.; Mitchell, E.P.; Romão, C.V. SAXS Structural Studies of Dps from Deinococcus radiodurans Highlights the Conformation of the Mobile N-Terminal Extensions. J. Mol. Biol. 2017, 429, 667–687. [Google Scholar] [CrossRef] [PubMed]
- Dadinova, L.; Kamyshinsky, R.; Chesnokov, Y.; Mozhaev, A.; Matveev, V.; Gruzinov, A.; Vasiliev, A.; Shtykova, E. Structural Rearrangement of Dps-DNA Complex Caused by Divalent Mg and Fe Cations. Int. J. Mol. Sci. 2021, 22, 6056. [Google Scholar] [CrossRef] [PubMed]
- Soshinskaya, E.Y.; Dadinova, L.A.; Mozhaev, A.A.; Shtykova, E.V. Effect of Buffer Composition on Conformational Flexibility of N-Terminal Fragments of Dps and the Nature of Interactions with DNA. Small-Angle X-Ray Scattering Study. Crystallogr. Reports 2020, 65, 891–899. [Google Scholar] [CrossRef]
- Madeira, F.; Park, Y.M.; Lee, J.; Buso, N.; Gur, T.; Madhusoodanan, N.; Basutkar, P.; Tivey, A.R.N.; Potter, S.C.; Finn, R.D.; et al. The EMBL-EBI search and sequence analysis tools APIs in 2019. Nucleic Acids Res. 2019, 47, W636–W641. [Google Scholar] [CrossRef] [Green Version]
- Buchan, D.W.A.; Jones, D.T. The PSIPRED Protein Analysis Workbench: 20 years on. Nucleic Acids Res. 2019, 47, W402–W407. [Google Scholar] [CrossRef] [Green Version]
- Waterhouse, A.; Bertoni, M.; Bienert, S.; Studer, G.; Tauriello, G.; Gumienny, R.; Heer, F.T.; De Beer, T.A.P.; Rempfer, C.; Bordoli, L.; et al. SWISS-MODEL: Homology modelling of protein structures and complexes. Nucleic Acids Res. 2018, 46, W296–W303. [Google Scholar] [CrossRef] [Green Version]
- Stetefeld, J.; McKenna, S.A.; Patel, T.R. Dynamic light scattering: A practical guide and applications in biomedical sciences. Biophys. Rev. 2016, 8, 409–427. [Google Scholar] [CrossRef]
- Blanchet, C.E.; Spilotros, A.; Schwemmer, F.; Graewert, M.A.; Kikhney, A.; Jeffries, C.M.; Franke, D.; Mark, D.; Zengerle, R.; Cipriani, F.; et al. Versatile sample environments and automation for biological solution X-ray scattering experiments at the P12 beamline (PETRA III, DESY). J. Appl. Crystallogr. 2015, 48, 431–443. [Google Scholar] [CrossRef] [Green Version]
- Svergun, D.I.; Koch, M.H.J. Small-angle scattering studies of biological macromolecules in solution. Reports Prog. Phys. 2003, 66, 1735–1782. [Google Scholar] [CrossRef]
- Svergun, D.I. Determination of the regularization parameter in indirect-transform methods using perceptual criteria. J. Appl. Crystallogr. 1992, 25, 495–503. [Google Scholar] [CrossRef]
- Penas, D.; Pereira, A.S.; Tavares, P. Direct Evidence for Ferrous Ion Oxidation and Incorporation in the Absence of Oxidants by Dps from Marinobacter hydrocarbonoclasticus. Angew. Chemie Int. Ed. 2019, 58, 1013–1018. [Google Scholar] [CrossRef] [PubMed]
- Arciero, D.M.; Lipscomb, J.D.; Huynh, B.H.; Kent, T.A.; Münck, E. EPR and Mössbauer studies of protocatechuate 4,5-dioxygenase. Characterization of a new Fe2+ environment. J. Biol. Chem. 1983, 258, 14981–14991. [Google Scholar] [CrossRef]
- Ohlendorf, D.H.; Orville, A.M.; Lipscomb, J.D. Structure of Protocatechuate 3,4-Dioxygenase from Pseudomonas aeruginosa at 2.15 Å Resolution. J. Mol. Biol. 1994, 244, 586–608. [Google Scholar] [CrossRef]
- Tavares, P.; Ravi, N.; Moura, J.J.G.; LeGall, J.; Huang, Y.H.; Crouse, B.R.; Johnson, M.K.; Huynh, B.H.; Moura, I. Spectroscopic properties of desulfoferrodoxin from Desulfovibrio desulfuricans (ATCC 27774). J. Biol. Chem. 1994, 269, 10504–10510. [Google Scholar] [CrossRef]
- Dunham, W.R.; Carroll, R.T.; Thompson, J.F.; Sands, R.H.; Funk, M.O. The initial characterization of the iron environment in lipoxygenase by Mossbauer spectroscopy. Eur. J. Biochem. 1990, 190, 611–617. [Google Scholar] [CrossRef] [Green Version]
- Huergo, L.F.; Rahman, H.; Ibrahimovic, A.; Day, C.J.; Korolik, V. Campylobacter jejuni Dps Protein Binds DNA in the Presence of Iron or Hydrogen Peroxide. J. Bacteriol. 2013, 195, 1970–1978. [Google Scholar] [CrossRef] [Green Version]
- Lee, S.Y.; Lim, C.J.; Dröge, P.; Yan, J. Regulation of Bacterial DNA Packaging in Early Stationary Phase by Competitive DNA Binding of Dps and IHF. Sci. Rep. 2015, 5, 1–10. [Google Scholar] [CrossRef] [Green Version]
- Moiseenko, A.; Loiko, N.; Tereshkina, K.; Danilova, Y.; Kovalenko, V.; Chertkov, O.; Feofanov, A.V.; Krupyanskii, Y.F.; Sokolova, O.S. Projection structures reveal the position of the DNA within DNA-Dps Co-crystals. Biochem. Biophys. Res. Commun. 2019, 517, 463–469. [Google Scholar] [CrossRef]
- Yang, J.; Yan, R.; Roy, A.; Xu, D.; Poisson, J.; Zhang, Y. The I-TASSER suite: Protein structure and function prediction. Nat. Methods 2014, 12, 7–8. [Google Scholar] [CrossRef] [Green Version]
- La Verde, V.; Dominici, P.; Astegno, A. Determination of Hydrodynamic Radius of Proteins by Size Exclusion Chromatography. Bio-Protocol 2017, 7, 1–14. [Google Scholar] [CrossRef] [Green Version]
- Hoffmann, S.V.; Fano, M.; van de Weert, M. Circular Dichroism Spectroscopy for Structural Characterization of Proteins. In Analytical Techniques in the Pharmaceutical Sciences. Advances in Delivery Science and Technology; Müllertz, A., Perrie, Y., Rades, T., Eds.; Springer: New York, NY, USA, 2016; pp. 223–251. [Google Scholar]
- Anthis, N.J.; Clore, G.M. Sequence-specific determination of protein and peptide concentrations by absorbance at 205 nm. Protein Sci. 2013, 22, 851–858. [Google Scholar] [CrossRef] [Green Version]
- Miles, A.J.; Ramalli, S.G.; Wallace, B.A. DichroWeb, a website for calculating protein secondary structure from circular dichroism spectroscopic data. Protein Sci. 2022, 31, 37–46. [Google Scholar] [CrossRef]
- Besada, A. A facile and sensitive spectrophotometric determination of ascorbic acid. Talanta 1987, 34, 731–732. [Google Scholar] [CrossRef]
- Round, A.; Felisaz, F.; Fodinger, L.; Gobbo, A.; Huet, J.; Villard, C.; Blanchet, C.E.; Pernot, P.; McSweeney, S.; Roessle, M.; et al. BioSAXS Sample Changer: A robotic sample changer for rapid and reliable high-throughput X-ray solution scattering experiments. Acta Crystallogr. Sect. D Biol. Crystallogr. 2015, 71, 67–75. [Google Scholar] [CrossRef] [Green Version]
- Graewert, M.A.; Franke, D.; Jeffries, C.M.; Blanchet, C.E.; Ruskule, D.; Kuhle, K.; Flieger, A.; Schäfer, B.; Tartsch, B.; Meijers, R.; et al. Automated pipeline for purification, biophysical and X-ray analysis of biomacromolecular solutions. Sci. Rep. 2015, 5, 1–8. [Google Scholar] [CrossRef]
- Franke, D.; Kikhney, A.G.; Svergun, D.I. Automated acquisition and analysis of small angle X-ray scattering data. Nucl. Instruments Methods Phys. Res. Sect. A Accel. Spectrometers Detect. Assoc. Equip. 2012, 689, 52–59. [Google Scholar] [CrossRef]
- Panjkovich, A.; Svergun, D.I. CHROMIXS: Automatic and interactive analysis of chromatography-coupled small-angle X-ray scattering data. Bioinformatics 2018, 34, 1944–1946. [Google Scholar] [CrossRef]
- Manalastas-Cantos, K.; Konarev, P.V.; Hajizadeh, N.R.; Kikhney, A.G.; Petoukhov, M.V.; Molodenskiy, D.S.; Panjkovich, A.; Mertens, H.D.T.; Gruzinov, A.; Borges, C.; et al. ATSAS 3.0: Expanded functionality and new tools for small-angle scattering data analysis. J. Appl. Crystallogr. 2021, 54, 343–355. [Google Scholar] [CrossRef]
- Svergun, D.I.; Petoukhov, M.V.; Koch, M.H.J. Determination of domain structure of proteins from X-ray solution scattering. Biophys. J. 2001, 80, 2946–2953. [Google Scholar] [CrossRef] [Green Version]
- Svergun, D. Restoring Low Resolution Structure of Biological Macromolecules from Solution Scattering Using Simulated Annealing. Biophys. J. 1999, 76, 2879–2886. [Google Scholar] [CrossRef] [Green Version]
- Pettersen, E.F.; Goddard, T.D.; Huang, C.C.; Meng, E.C.; Couch, G.S.; Croll, T.I.; Morris, J.H.; Ferrin, T.E. UCSF ChimeraX: Structure visualization for researchers, educators, and developers. Protein Sci. 2021, 30, 70–82. [Google Scholar] [CrossRef] [PubMed]
- Ravi, N.; Huynh, B.H.; Edmondson, D.E.; Bollinger, J.M.; Stubbe, J.A. Mechanism of Assembly of the Tyrosyl Radical-Diiron(III) Cofactor of E. Coli Ribonucleotide Reductase. 1. Mössbauer Characterization of the Diferric Radical Precursor. J. Am. Chem. Soc. 1994, 116, 8007–8014. [Google Scholar] [CrossRef]


| [NaCl] (mM) | Ve (mL) | Apparent RS (nm) | Apparent MM (kDa) | |
| SEC | 50 | 12.2 | 4.9 | 222 |
| 80 | 11.9 | 5.3 | 290 | |
| 150 | 11.1 | 5.9 | 359 | |
| 230 | 10.8 | 6.2 | 405 | |
| 480 | 10.5 | 6.4 | 446 | |
| [NaCl] (mM) | Z-Average (nm) | SD | PI | |
| DLS | 50 | 12.9 | 0.63 | 0.205 |
| 80 | 13.1 | 0.51 | 0.312 | |
| 150 | 14.4 | 0.62 | 0.187 | |
| 230 | 16.3 | 0.63 | 0.275 | |
| 480 | 16.5 | 0.92 | 0.281 | |
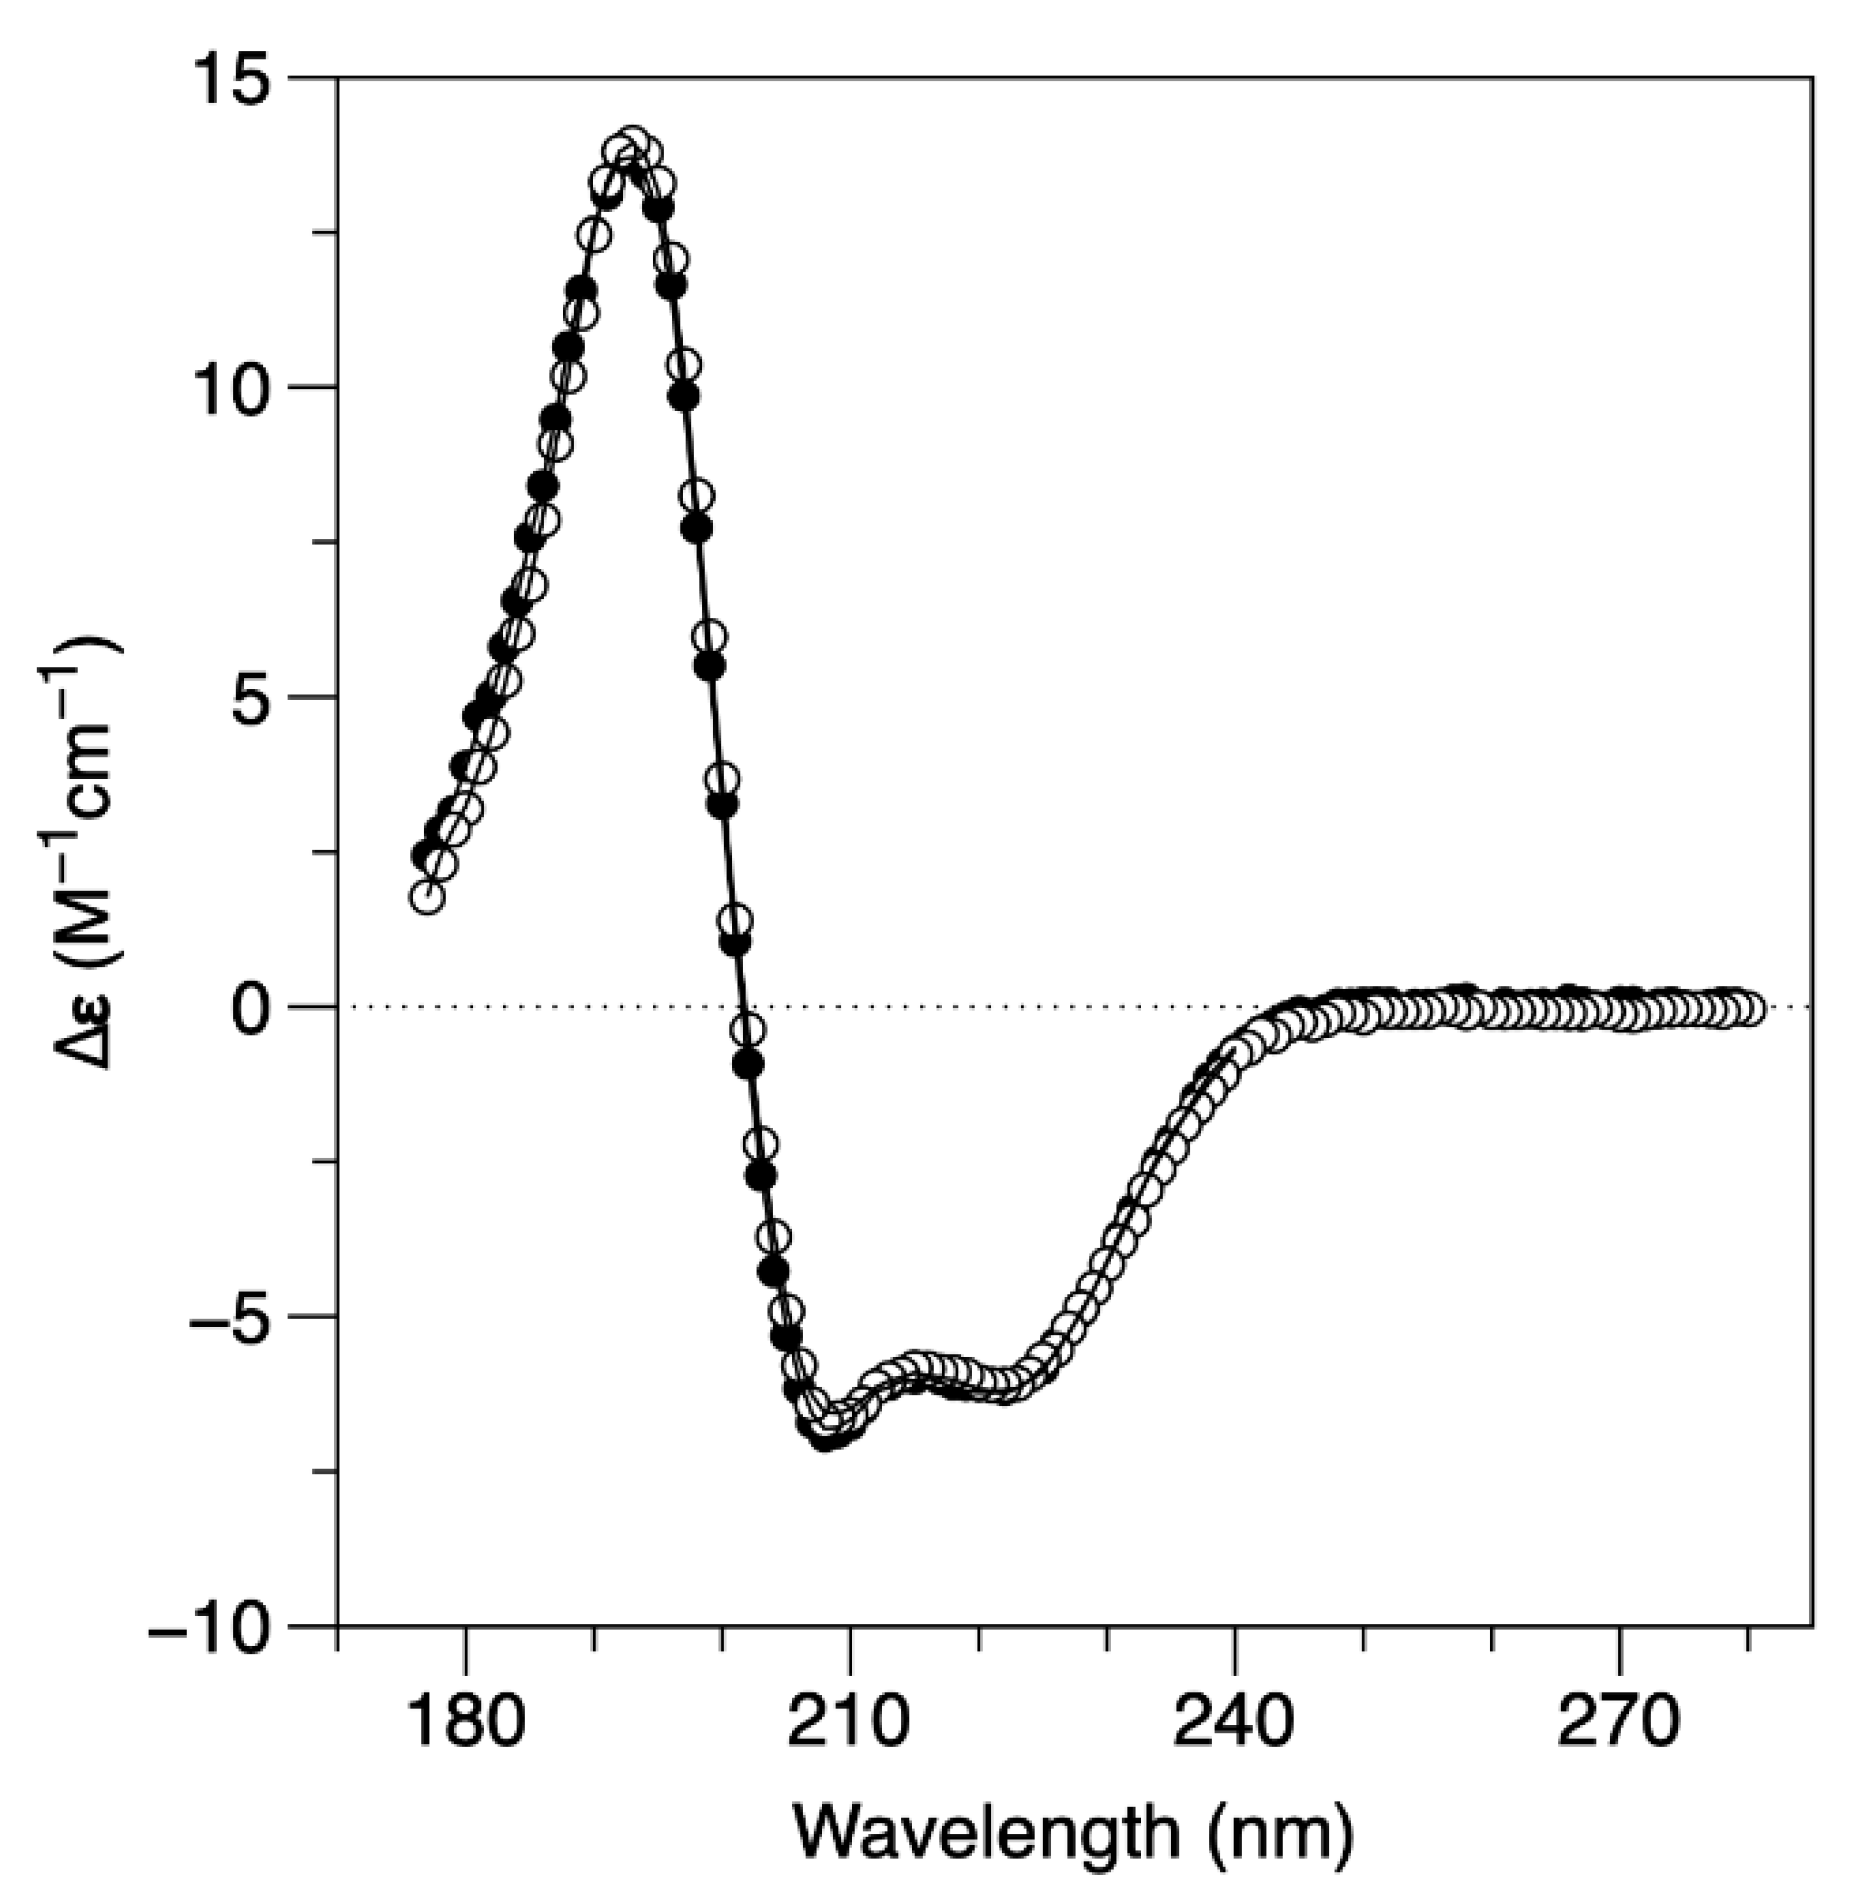
| [NaF] (mM) | α-Helix (%) | β-Sheet (%) | Unordered (%) | |
| SRCD | 60 | 64 | 5 | 31 |
| 240 | 63 | 5 | 32 |
| WT | ∆N | |||||
|---|---|---|---|---|---|---|
| [NaCl] | 50 | 80 | 230 | 480 | 50 | 230 |
| Data Collection | ||||||
| Beamline | P12, PETRAIII | |||||
| Beam dimensions (mm) | 0.2 × 0.05 | |||||
| Detector | Pilatus 6M | |||||
| Wavelength (Å) | 1.24 | |||||
| q range (nm−1) | 0.02–7.0 | |||||
| Concentration (mg/mL, batch) | 1–10 | |||||
| Concentration (mg/mL, SEC) | 8 | 9 | 10 | 10 | 10 | |
| Exposure time per frame (s) | 1 | 1 | 1 | 0.1 | 1 | 1 |
| Structural Parameters | ||||||
| I(0) from Guinier | 11,800 | 20,311 | 74,700 | 0.19 | 50,671 | 46,710 |
| Rg from Guinier (nm) | 4.38 | 4.47 | 4.45 | 4.67 | 3.75 | 3.75 |
| I(0) from P(r) | 11,840 | 20,310 | 75,070 | 0.17 | 50,870 | 46,840 |
| Rg from P(r) | 4.43 | 4.52 | 4.54 | 4.87 | 3.72 | 3.72 |
| Dmax from P(r) | 16.09 | 17.10 | 20.63 | 20.46 | 9.10 | 8.80 |
| Porod volume (AutoRG) (nm3) | 335.9 | 436.7 | 427.3 | 418.4 | 290.7 | 296.6 |
| Porod volume (GNOM) (nm3) | 418.5 | 475.0 | 438.2 | 430.3 | 288.0 | 291.2 |
| Molecular Mass | ||||||
| Estimation from data (kDa) | 208.0 | 242.0 | 318.5 | 318.5 | 208.0 | 208.0 |
| Theoretical dodecamer (kDa) | 270.4 | - | - | - | 216.5 | - |
| Model χ2 | ||||||
| DAMMIN | 1.99 | 3.33 | 2.09 | 2.65 | 2.86 | 6.66 |
| GASBOR | 3.63 | 4.91 | 4.32 | 3.34 | 97.49 | 47.02 |
| Model diameter (nm) | 14.05 | 17.1 | 17.5 | 18.0 | 9.0 | 8.8 |
| Software | ||||||
| 1D data processing | PRIMUS | |||||
| P(r) analysis | GNOM | |||||
| Ab initio methods | GASBOR | DAMMIN | ||||
| 3D model visualization | ChimeraX | |||||
| Spectroscopic Parameters for the Ferrous Species in Iron Loaded DgrDps WT and ∆N Variant | |||||||
| Site I | Site II | Additional Ferrous | |||||
| δ (mm/s) | 1.27 (2) | 1.10 (2) | 1.35 (2) | ||||
| ∆EQ (mm/s) | 2.85 (3) | 3.82 (2) | 3.23 (3) | ||||
| Linewidth (mm/s) | 0.32 (2) | 0.37 (2) | 0.42 (4) | ||||
| Percentages of the Iron Absorption of the Ferrous Species | |||||||
| Iron Ratio | % | Occupancy | % | Occupancy | % | Occupancy | |
| WT | 6 | 88 (2) | 5 (0) | 12 (2) | 1 (1) | ||
| 12 | 67 (2) | 8 (1) | 33 (2) | 4 (1) | |||
| 24 | 44 (2) | 10 (1) | 21 (2) | 5 (1) | 35 (5) | 8 (1) | |
| 36 | 32 (2) | 12 (1) | 17 (2) | 6 (1) | 51 (5) | 18 (2) | |
| 48 | 25 (2) | 12 (1) | 19 (2) | 9 (2) | 56 (5) | 27 (2) | |
| ∆N | 6 | 100 | 6 (0) | ||||
| 12 | 68 (2) | 8 (1) | 32 (5) | 4 (1) | |||
| 24 | 50 (2) | 12 (1) | 50 (5) | 12 (1) | |||
| 36 | 31(2) | 11 (1) | 69 (5) | 25 (2) | |||
| 48 | 23 (2) | 11 (1) | 76 (5) | 37 (2) | |||
Publisher’s Note: MDPI stays neutral with regard to jurisdictional claims in published maps and institutional affiliations. |
© 2022 by the authors. Licensee MDPI, Basel, Switzerland. This article is an open access article distributed under the terms and conditions of the Creative Commons Attribution (CC BY) license (https://creativecommons.org/licenses/by/4.0/).
Share and Cite
Guerra, J.P.L.; Blanchet, C.E.; Vieira, B.J.C.; Almeida, A.V.; Waerenborgh, J.C.; Jones, N.C.; Hoffmann, S.V.; Tavares, P.; Pereira, A.S. The Conformation of the N-Terminal Tails of Deinococcus grandis Dps Is Modulated by the Ionic Strength. Int. J. Mol. Sci. 2022, 23, 4871. https://doi.org/10.3390/ijms23094871
Guerra JPL, Blanchet CE, Vieira BJC, Almeida AV, Waerenborgh JC, Jones NC, Hoffmann SV, Tavares P, Pereira AS. The Conformation of the N-Terminal Tails of Deinococcus grandis Dps Is Modulated by the Ionic Strength. International Journal of Molecular Sciences. 2022; 23(9):4871. https://doi.org/10.3390/ijms23094871
Chicago/Turabian StyleGuerra, João P. L., Clement E. Blanchet, Bruno J. C. Vieira, Ana V. Almeida, João C. Waerenborgh, Nykola C. Jones, Søren V. Hoffmann, Pedro Tavares, and Alice S. Pereira. 2022. "The Conformation of the N-Terminal Tails of Deinococcus grandis Dps Is Modulated by the Ionic Strength" International Journal of Molecular Sciences 23, no. 9: 4871. https://doi.org/10.3390/ijms23094871
APA StyleGuerra, J. P. L., Blanchet, C. E., Vieira, B. J. C., Almeida, A. V., Waerenborgh, J. C., Jones, N. C., Hoffmann, S. V., Tavares, P., & Pereira, A. S. (2022). The Conformation of the N-Terminal Tails of Deinococcus grandis Dps Is Modulated by the Ionic Strength. International Journal of Molecular Sciences, 23(9), 4871. https://doi.org/10.3390/ijms23094871