
In Vitro Effects of Papaverine on Cell Migration and Vascular Endothelial Growth Factor in Cancer Cell Lines


Abstract
:1. Introduction
2. Results
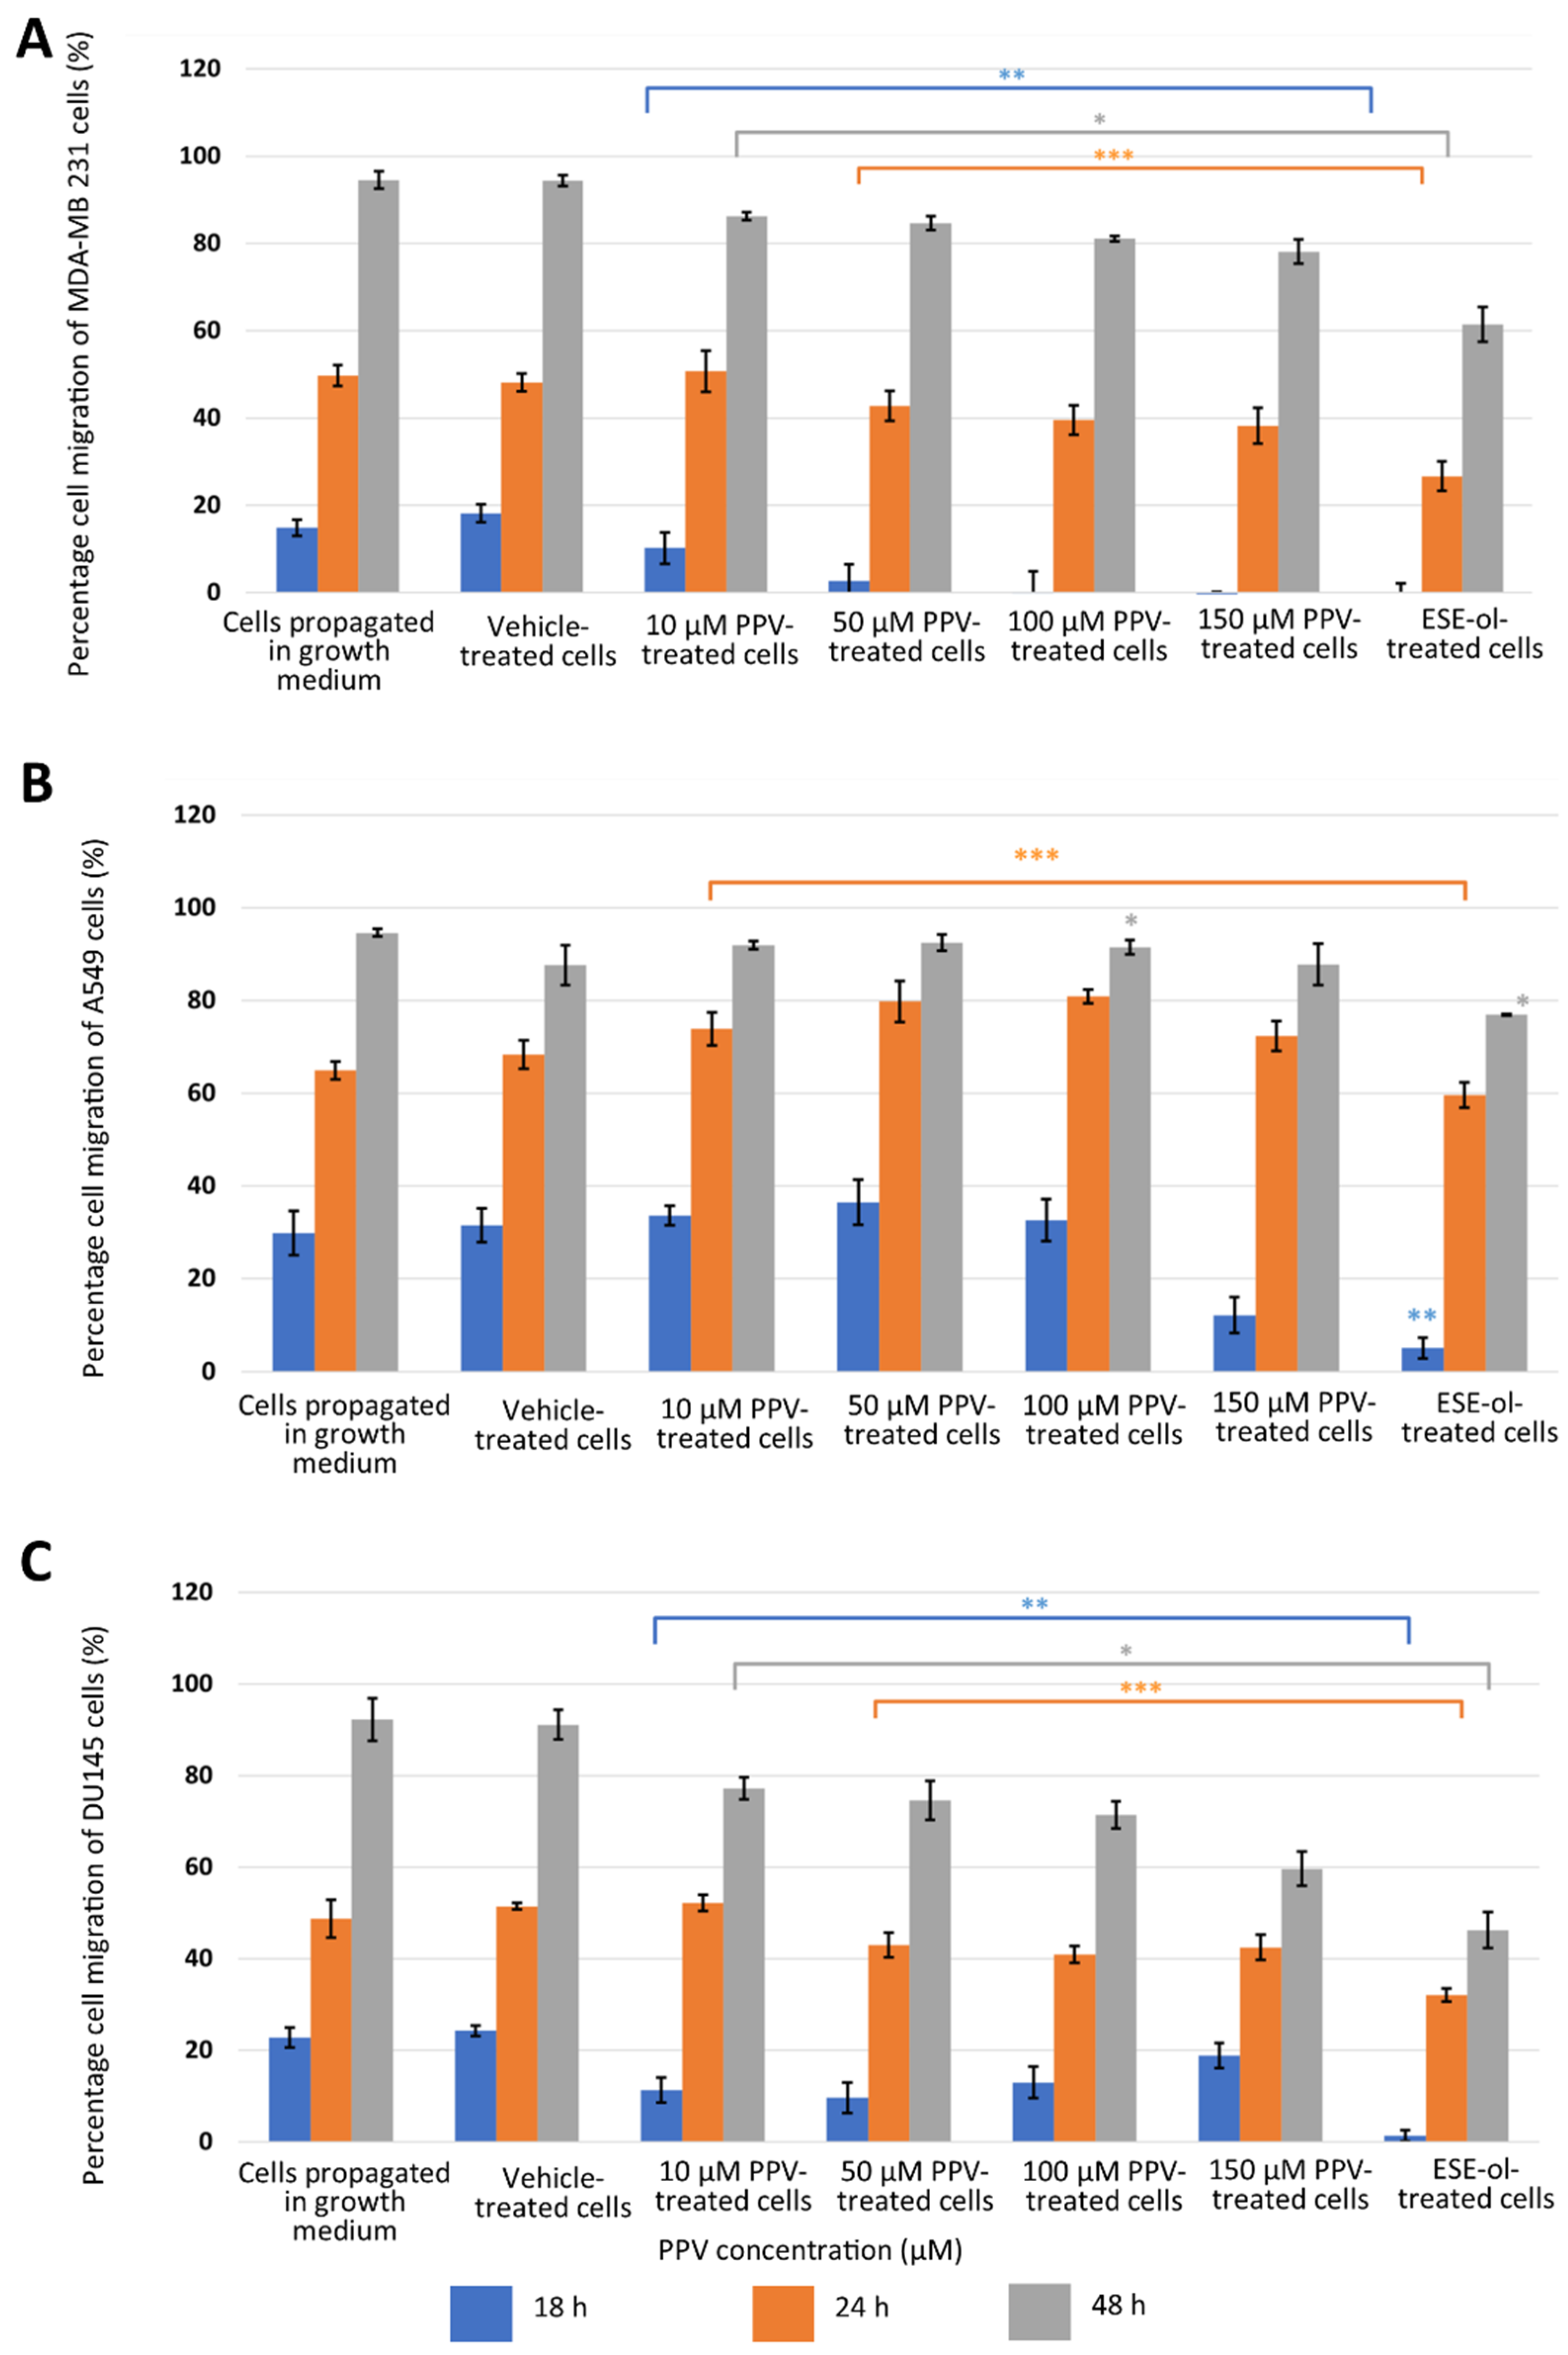
2.1. Cell Migration Using Scratch Assay (Light Microscopy)
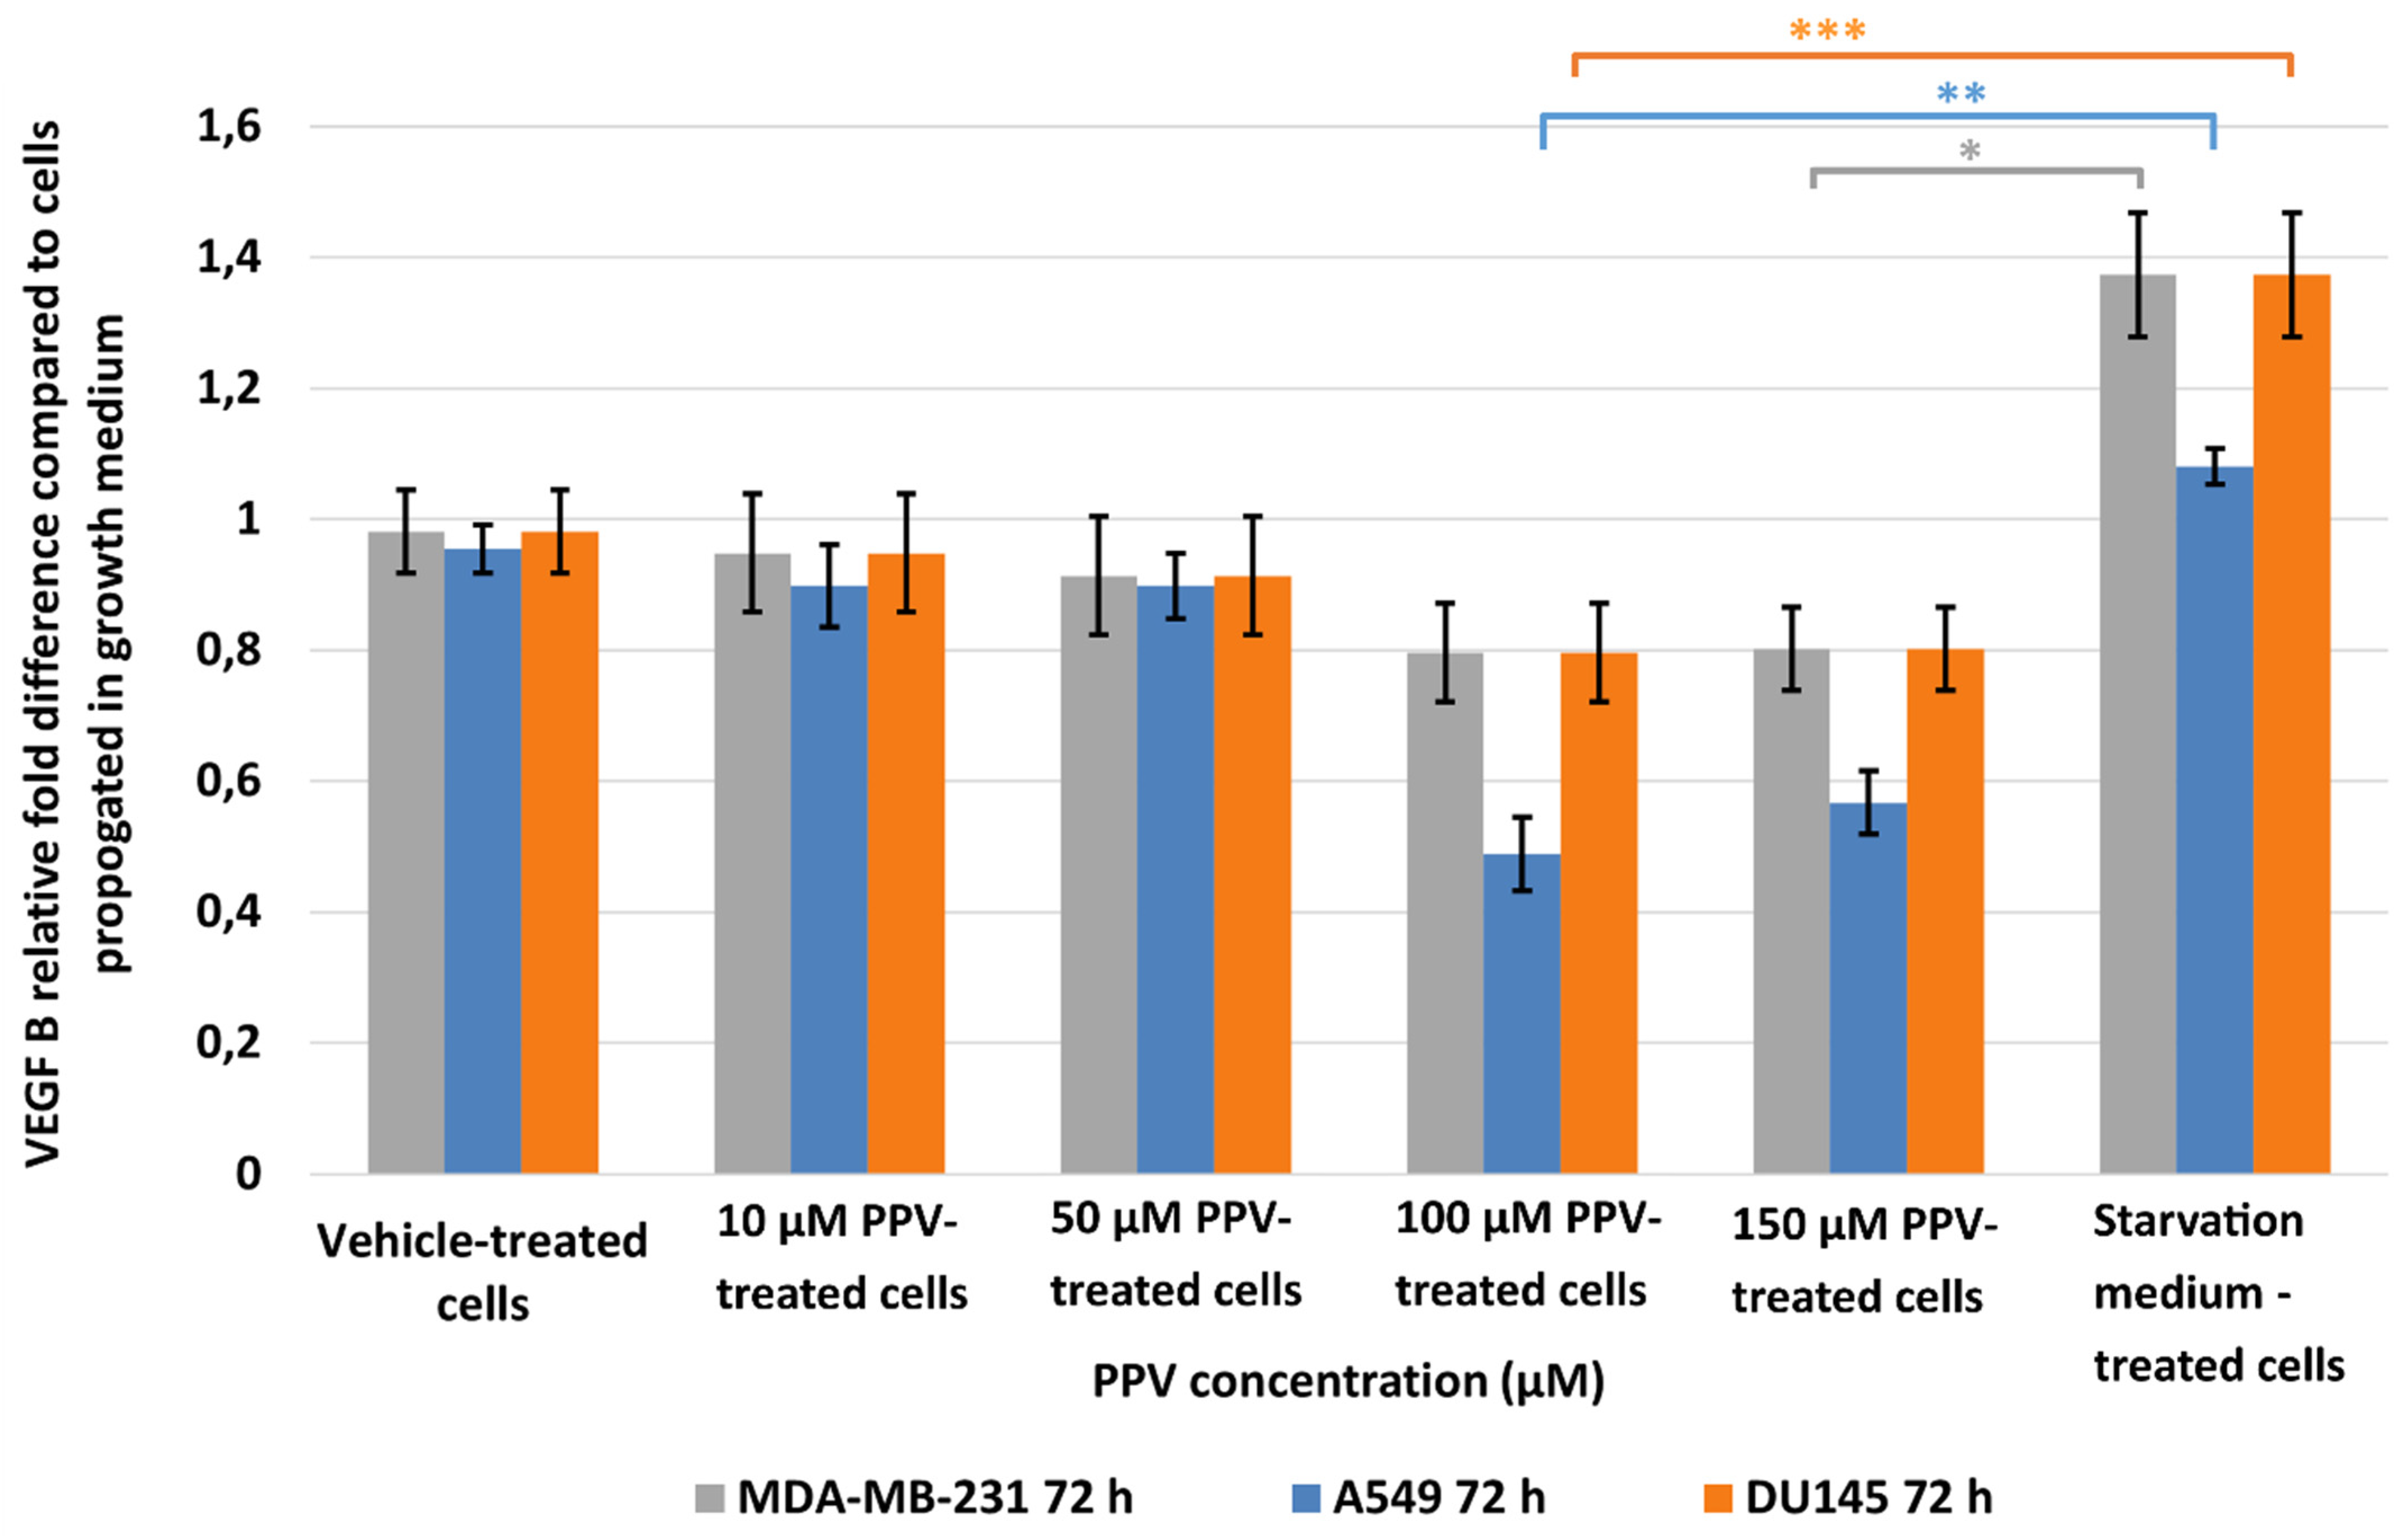
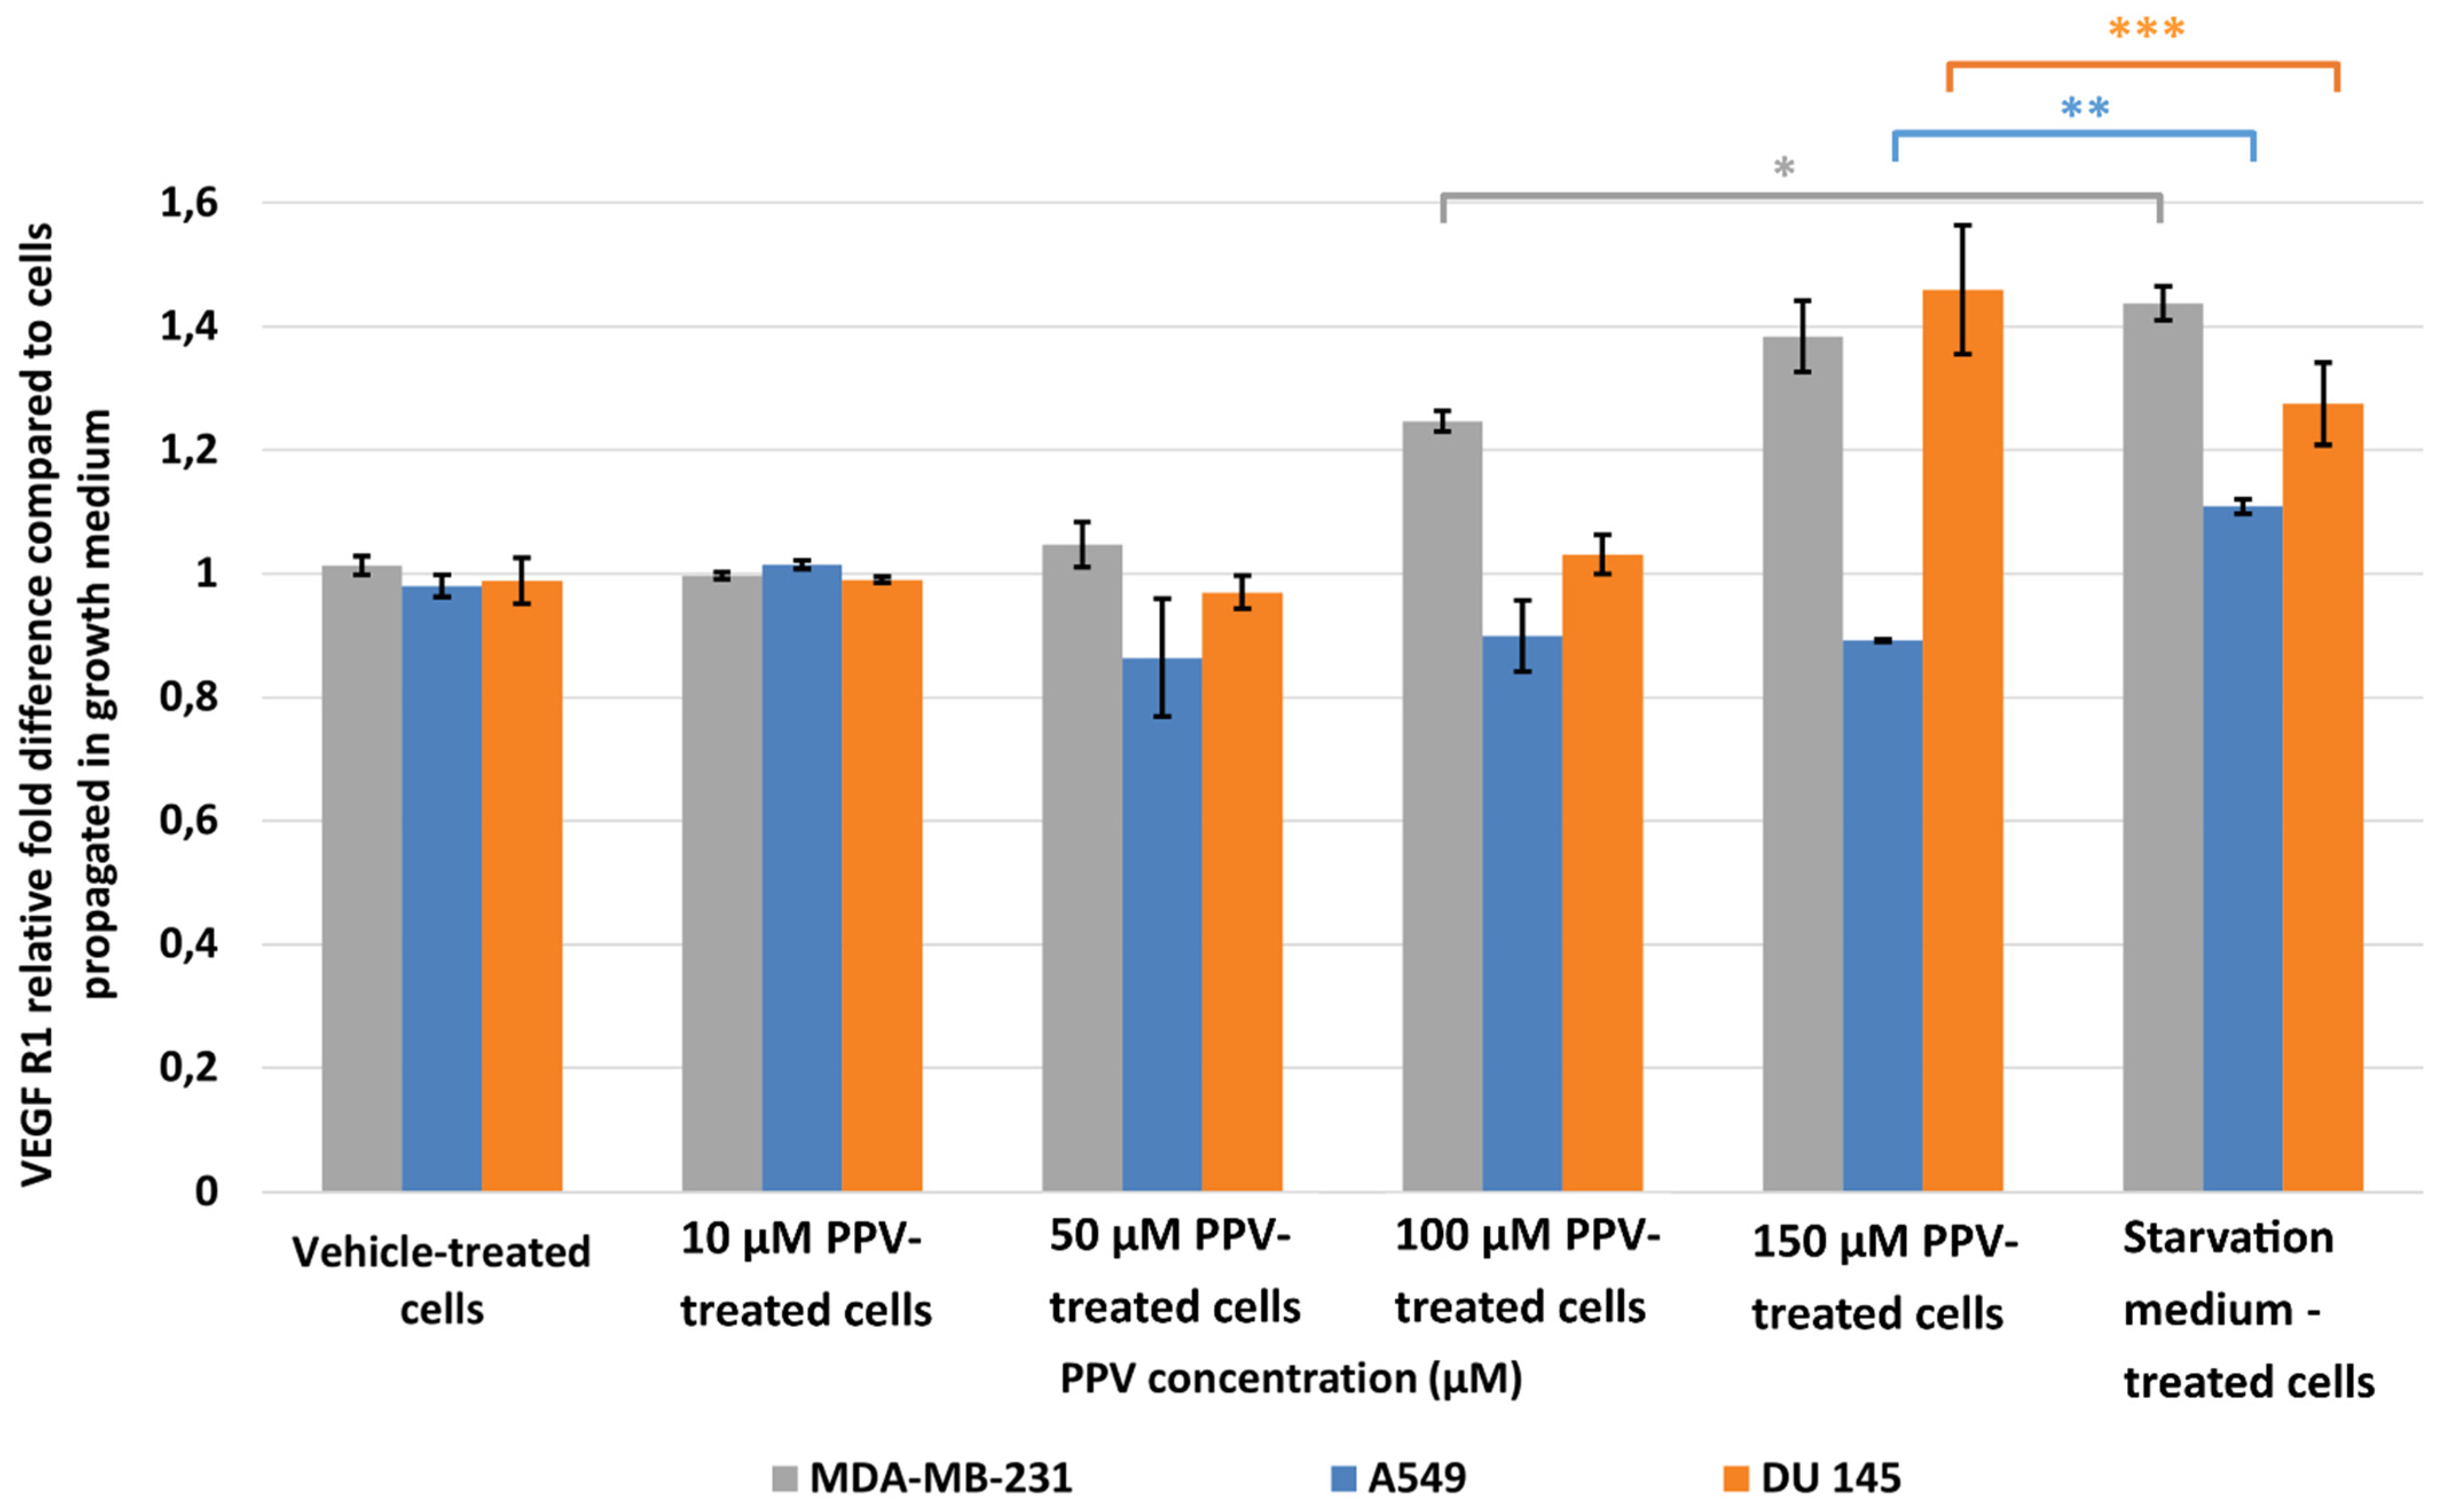
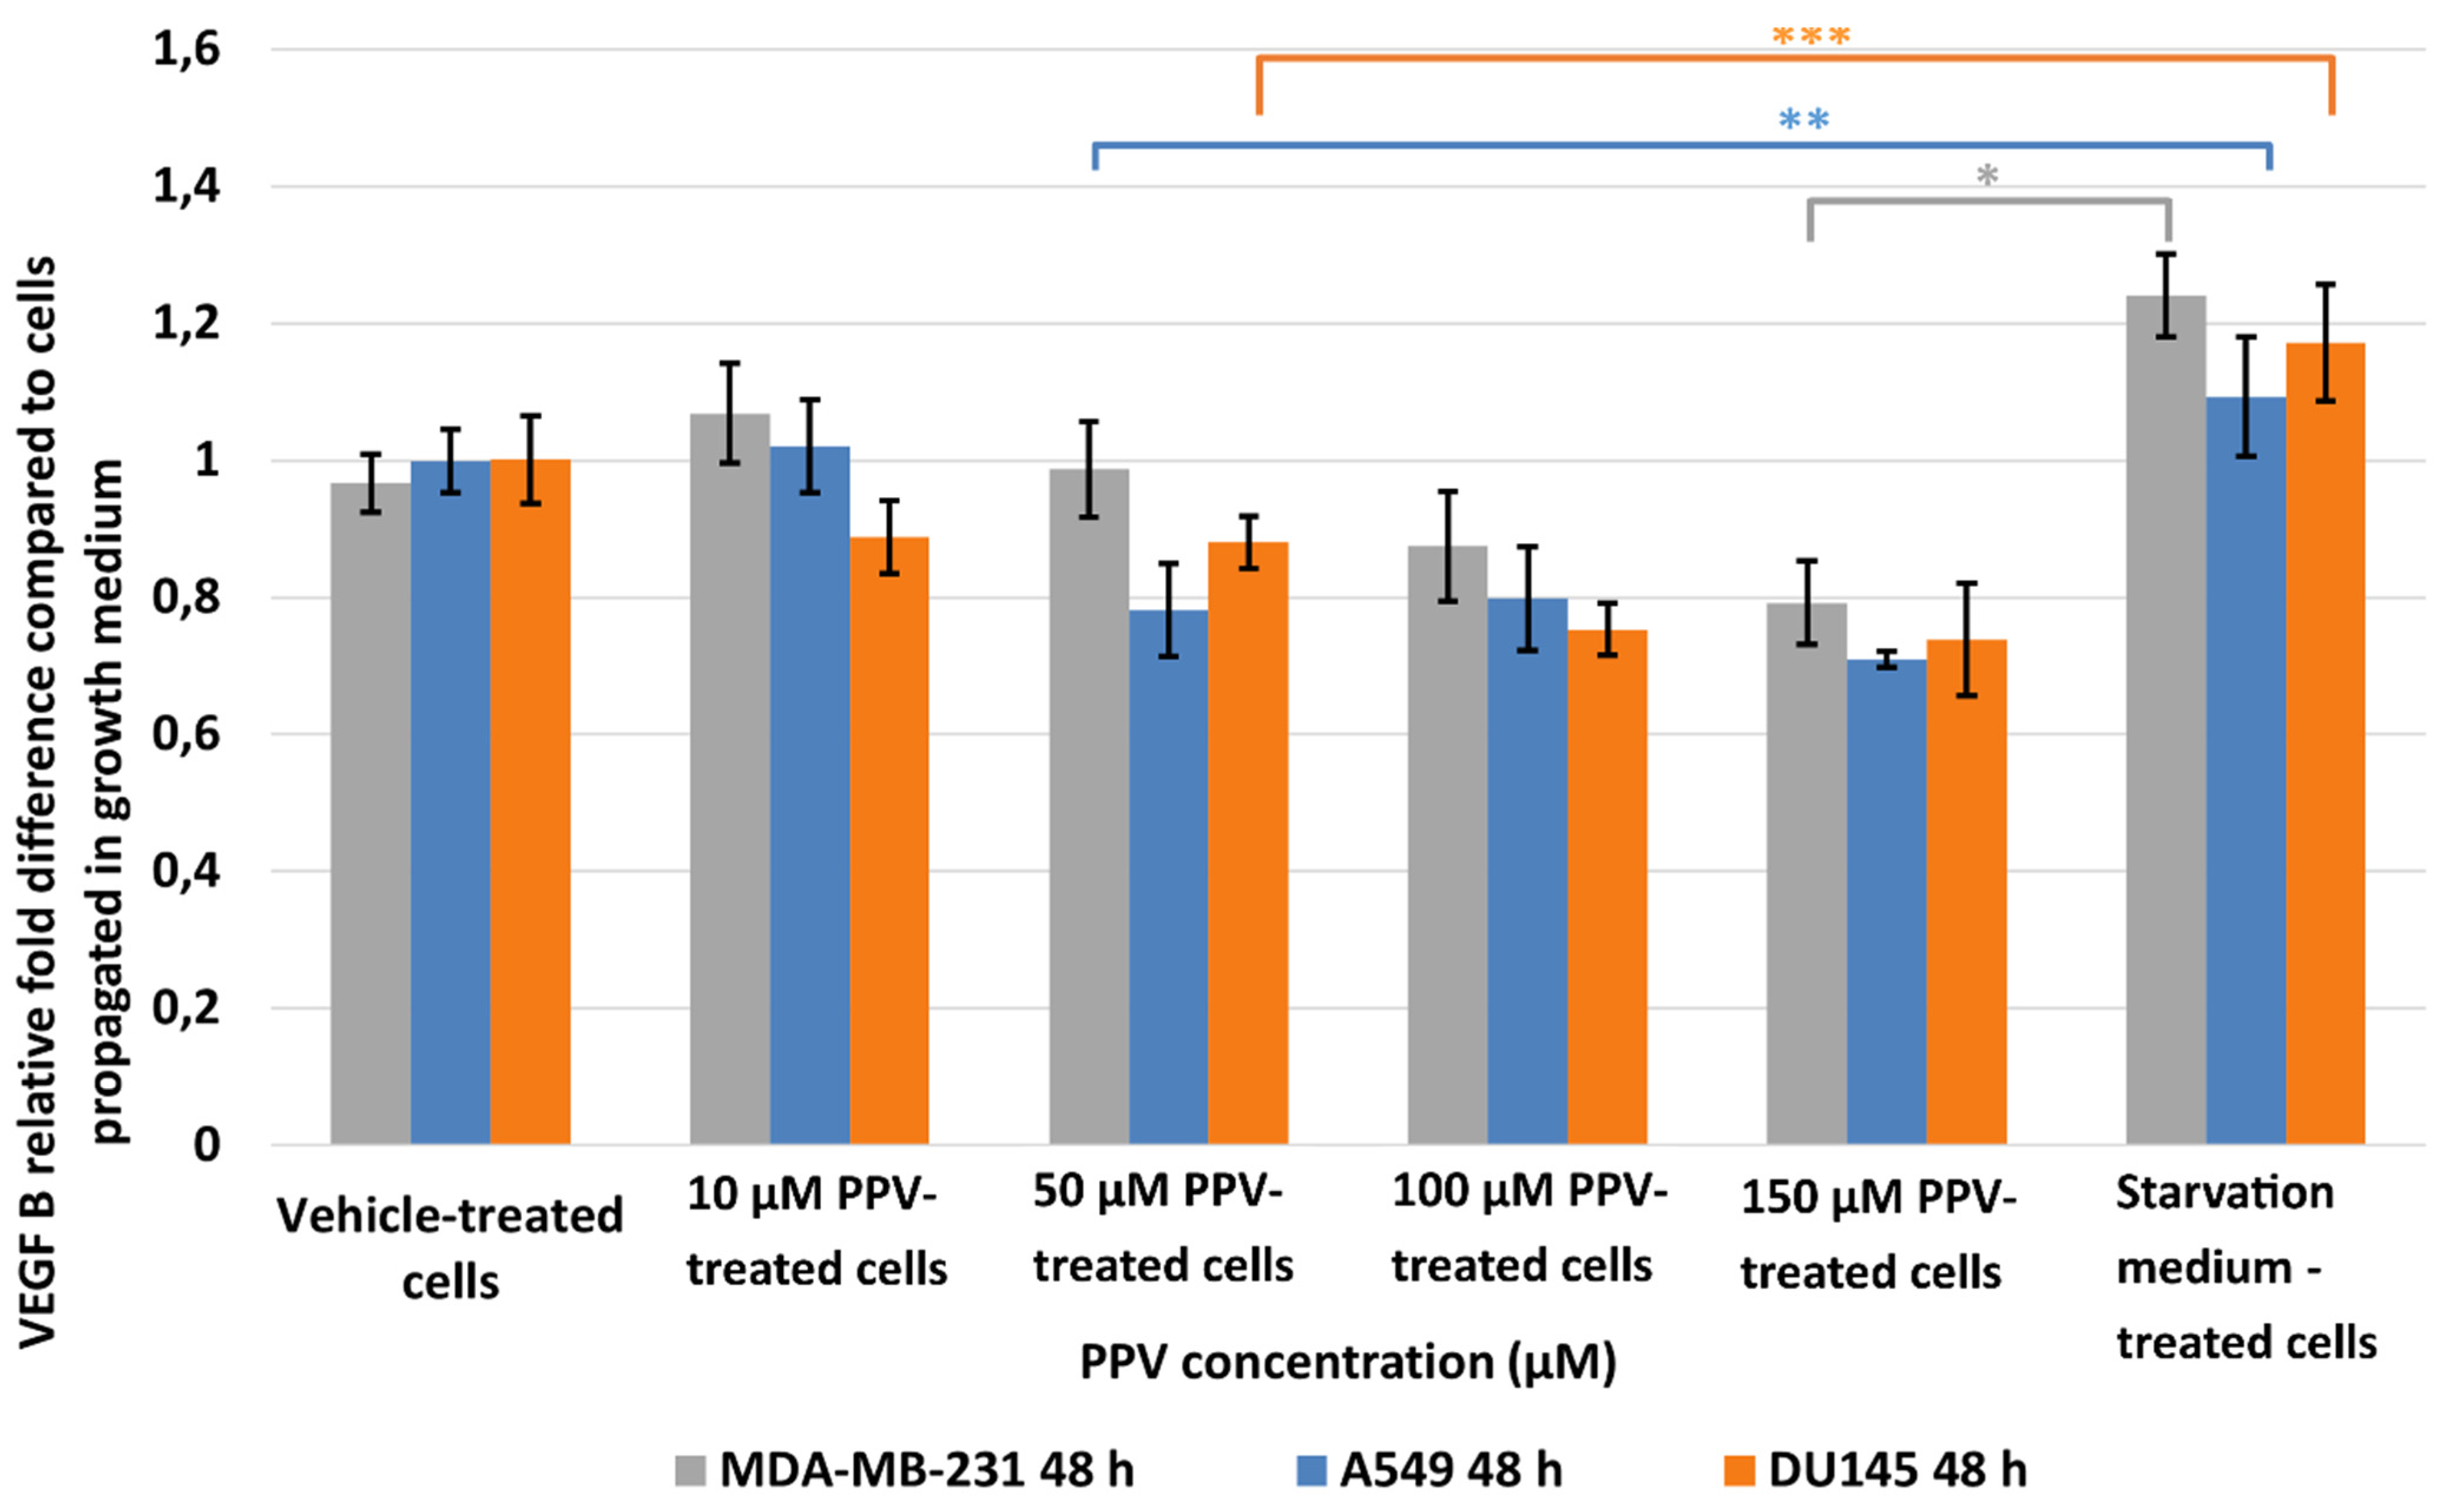
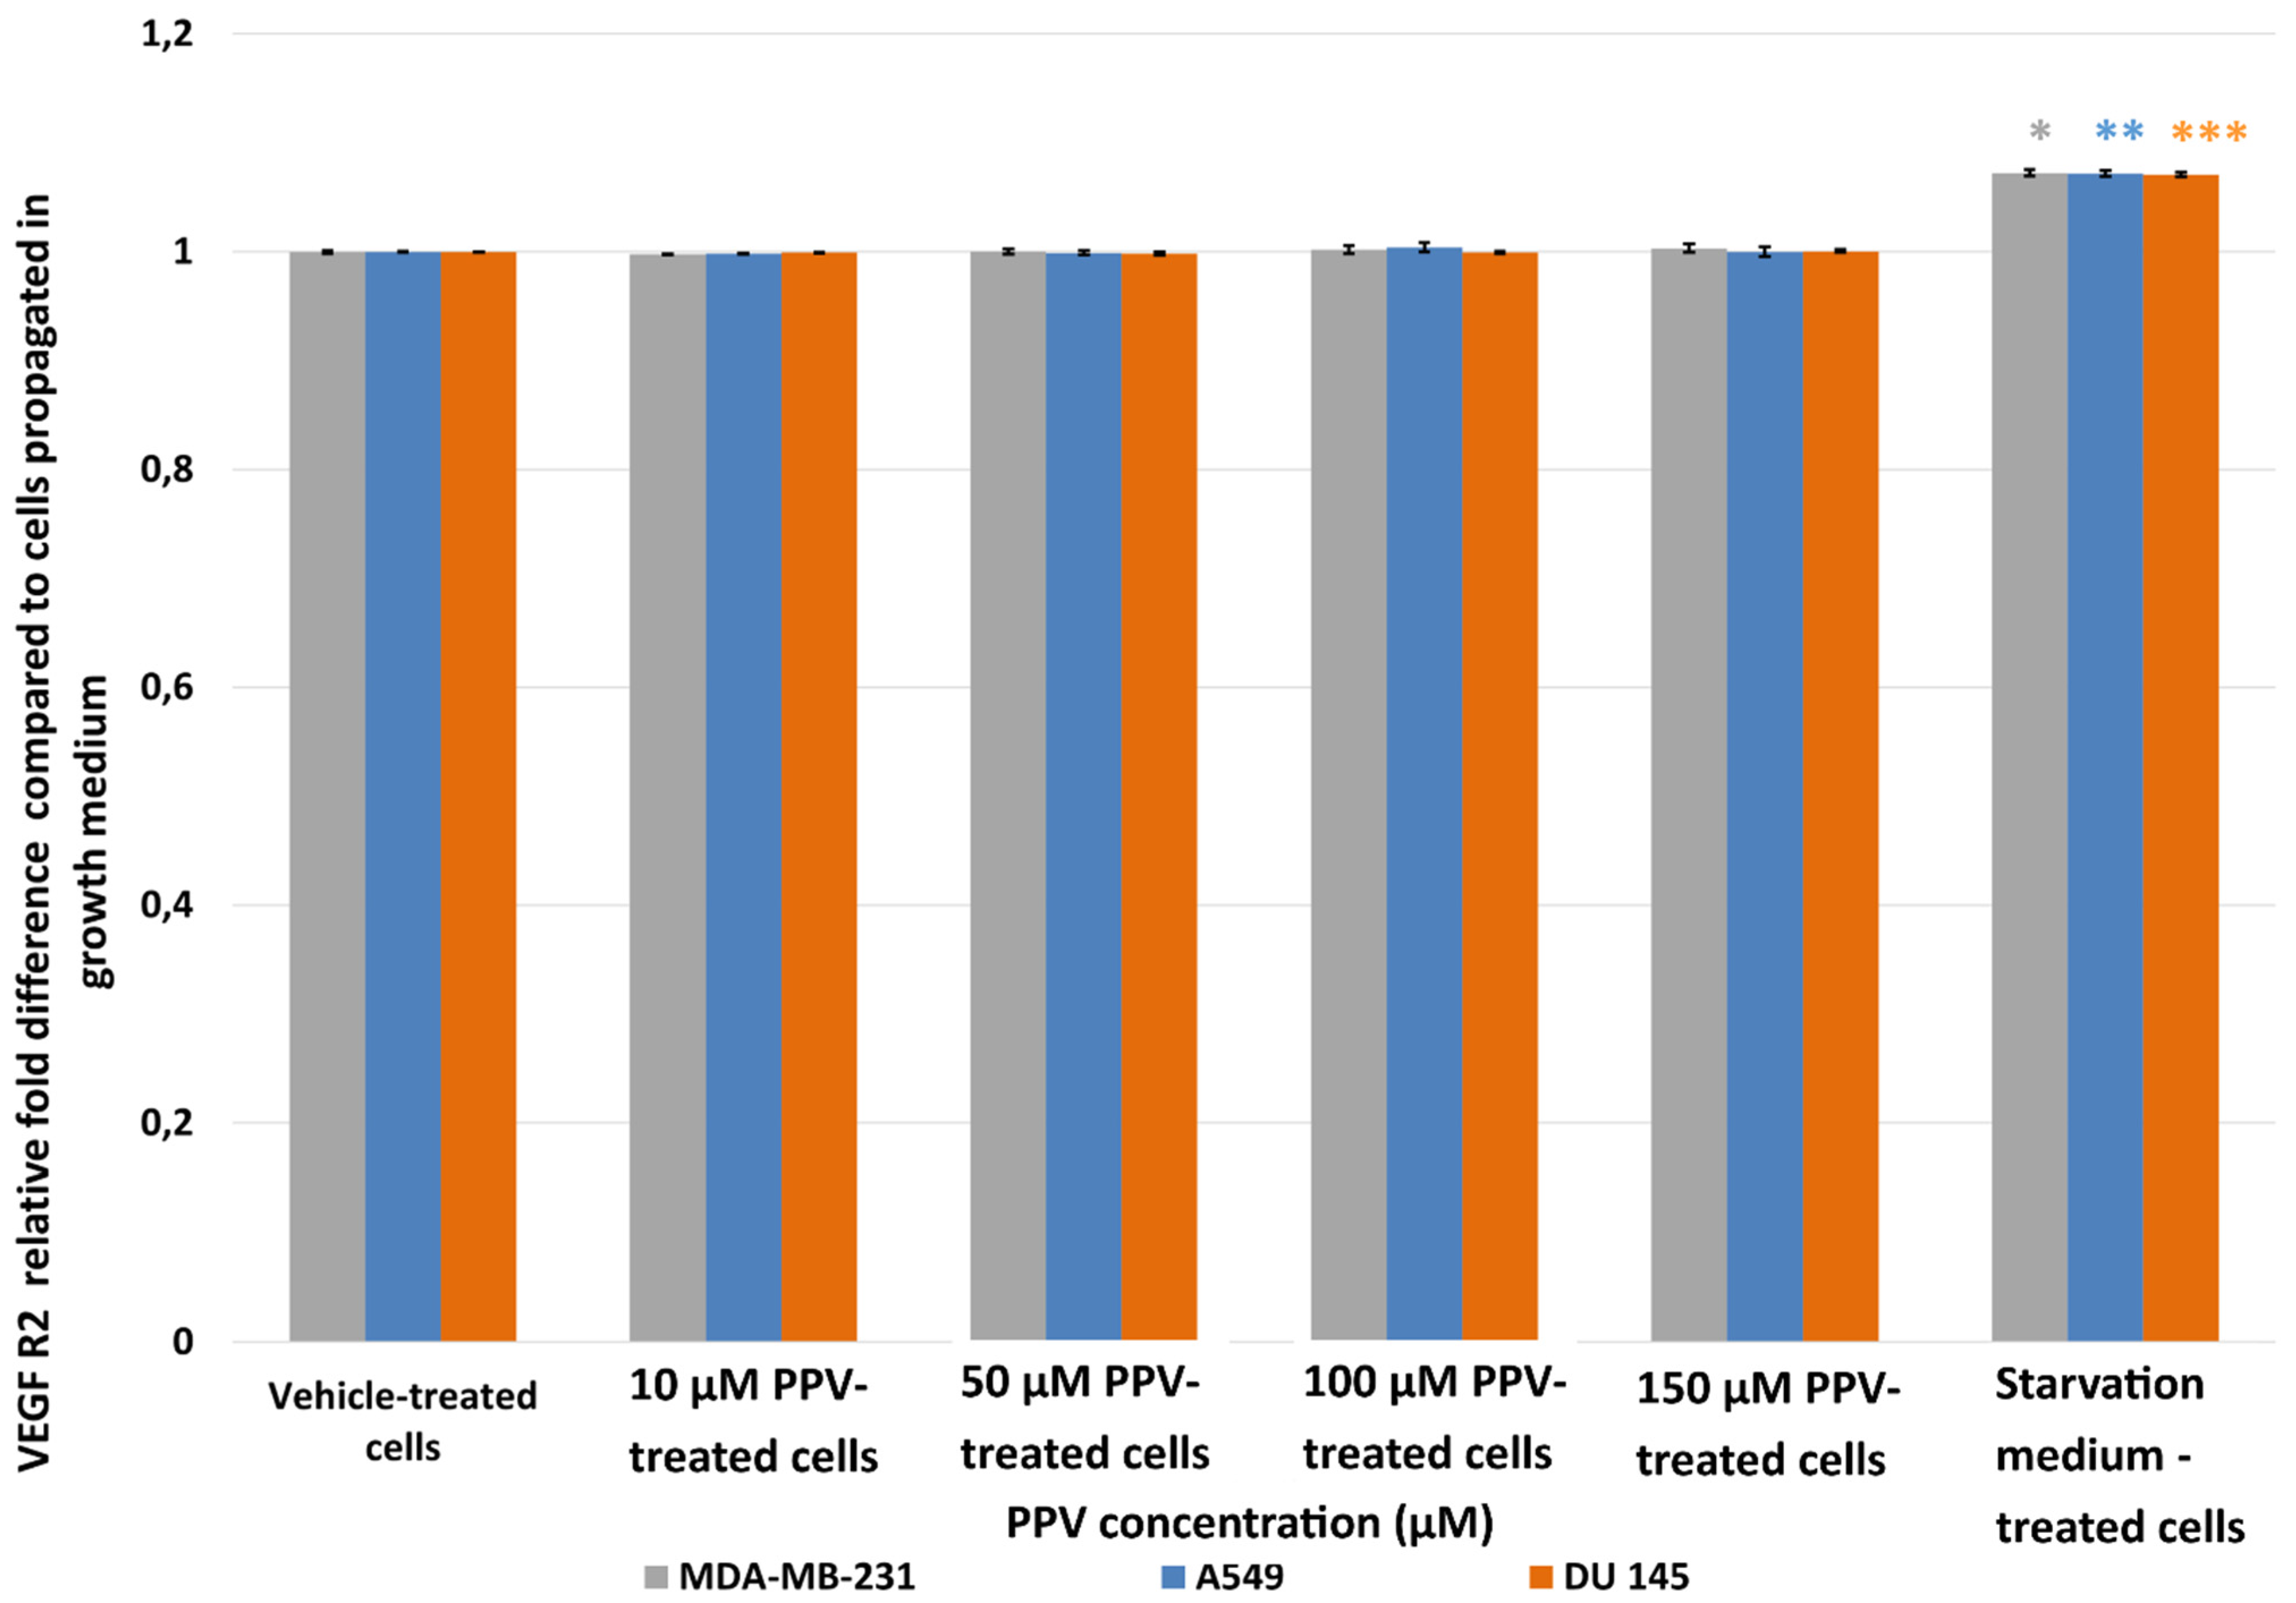
2.2. Detection of Vascular Endothelial Growth Factor Using ELISA (Spectrophotometry)
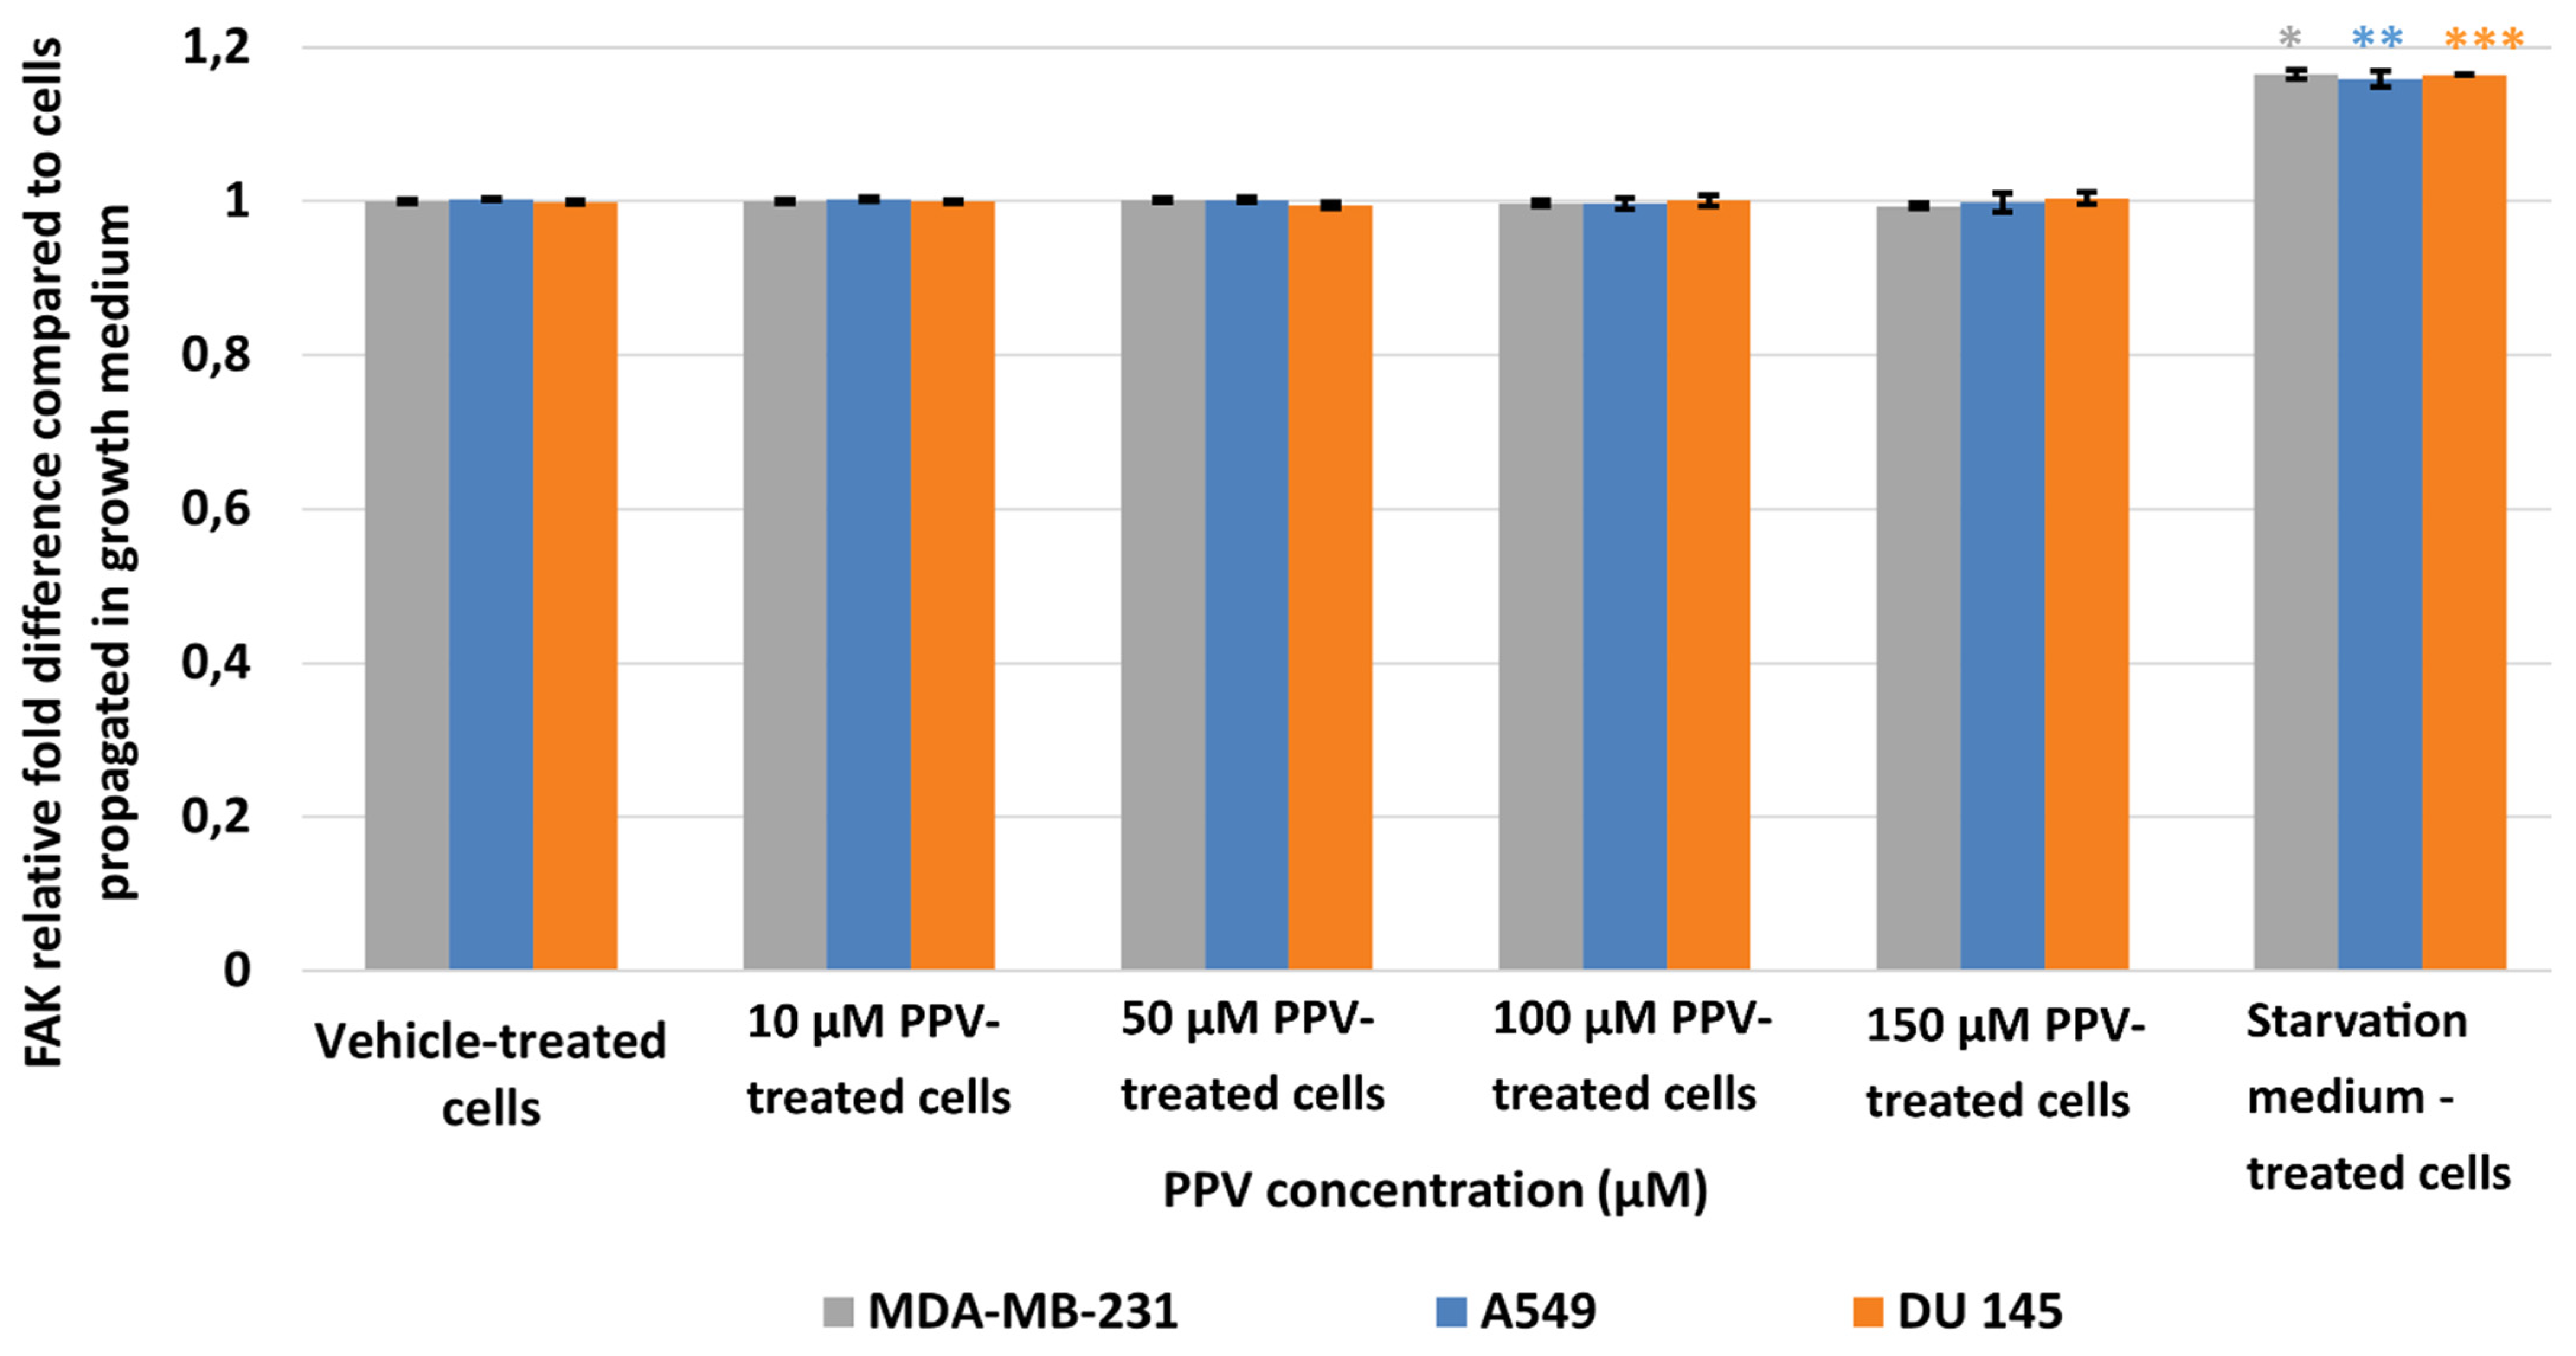
2.3. Determination of FAK (Phospho) [pY397] Using ELISA (Spectrophotometry)
3. Discussion
4. Materials and Methods
4.1. Materials
4.1.1. Cell Lines
4.1.2. Chemicals and Reagents
4.2. Methods
4.2.1. Cell Migration Using Scratch Assay (Light Microscopy)
4.2.2. Detection of Vascular Endothelial Growth Factor Using ELISA (Spectrophotometry)
4.2.3. Determination of FAK (Phospho) [pY397] Using ELISA (Spectrophotometry)
4.2.4. Statistical Considerations
5. Conclusions
Author Contributions
Funding
Institutional Review Board Statement
Informed Consent Statement
Data Availability Statement
Acknowledgments
Conflicts of Interest
References
- Mukeshwar, P.; Debnath, M.; Gupta, S.; Chikara, S.K. Phytomedicine: An ancient approach turning into future potential source of therapeutics. J. Pharmacogn. Phytother. 2011, 3, 27–37. [Google Scholar]
- Kassell, N.F.; Helm, G.; Simmons, N.; Phillips, C.D.; Cail, W.S. Treatment of cerebral vasospasm with intra-arterial papaverine. J. Neurosurg. 1992, 77, 848–852. [Google Scholar] [CrossRef] [PubMed]
- WILSON, R.F.; WHITE, C.W. Intracoronary papaverine: An ideal coronary vasodilator for studies of the coronary circulation in conscious humans. Circulation 1986, 73, 444–451. [Google Scholar] [CrossRef] [PubMed] [Green Version]
- Virag, R.; Frydman, D.; Legman, M.; Virag, H. Intracavernous Injection of Papaverine as a Diagnostic and Therapeutic Method in Erectile Failure. Angiology 1984, 35, 79–87. [Google Scholar] [CrossRef] [PubMed]
- Clouston, J.E.; Numaguchi, Y.; Zoarski, G.H.; Aldrich, E.F.; Simard, J.M.; Zitnay, K.M. Intraarterial papaverine infusion for cerebral vasospasm after subarachnoid hemorrhage. Am. J. Neuroradiol. 1995, 16, 27–38. [Google Scholar]
- Benej, M.; Hong, X.; Vibhute, S.; Scott, S.; Wu, J.; Graves, E.; Le, Q.-T.; Koong, A.C.; Giaccia, A.J.; Yu, B. Papaverine and its derivatives radiosensitize solid tumors by inhibiting mitochondrial metabolism. Proc. Natl. Acad. Sci. USA 2018, 115, 10756–10761. [Google Scholar] [CrossRef] [Green Version]
- Afzali, M.; Ghaeli, P.; Khanavi, M.; Parsa, M.; Montazeri, H.; Ghahremani, M.H.; Ostad, S.N. Non-addictive opium alkaloids selectively induce apoptosis in cancer cells compared to normal cells. DARU J. Pharm. Sci. 2015, 23, 16. [Google Scholar] [CrossRef] [Green Version]
- Hagel, J.M.; Facchini, P.J. Benzylisoquinoline Alkaloid Metabolism: A Century of Discovery and a Brave New World. Plant Cell Physiol. 2013, 54, 647–672. [Google Scholar] [CrossRef] [Green Version]
- Huang, H.; Li, L.-J.; Zhang, H.-B.; Wei, A.-Y. Papaverine selectively inhibits human prostate cancer cell (PC-3) growth by inducing mitochondrial mediated apoptosis, cell cycle arrest and downregulation of NF-κB/PI3K/Akt signalling pathway. J. BUON Off. J. Balk. Union Oncol. 2017, 22, 112–118. [Google Scholar]
- Sajadian, S.; Vatankhah, M.; Majdzadeh, M.; Kouhsari, S.M.; Ghahremani, M.H. Cell cycle arrest and apoptogenic properties of opium alkaloids noscapine and papaverine on breast cancer stem cells. Toxicol. Mech. Methods 2015, 25, 388–395. [Google Scholar] [CrossRef]
- Inada, M.; Shindo, M.; Kobayashi, K.; Sato, A.; Yamamoto, Y.; Akasaki, Y.; Ichimura, K.; Tanuma, S.-I. Anticancer effects of a non-narcotic opium alkaloid medicine, papaverine, in human glioblastoma cells. PLoS ONE 2019, 14, e0216358. [Google Scholar] [CrossRef] [PubMed] [Green Version]
- Gomes, D.A.; Joubert, A.M.; Visagie, M.H. In Vitro Effects of Papaverine on Cell Proliferation, Reactive Oxygen Species, and Cell Cycle Progression in Cancer Cells. Molecules 2021, 26, 6388. [Google Scholar] [CrossRef] [PubMed]
- Goto, T.; Matsushima, H.; Kasuya, Y.; Hosaka, Y.; Kitamura, T.; Kawabe, K.; Hida, A.; Ohta, Y.; Simizu, T.; Takeda, K. The effect of papaverine on morphologic differentiation, proliferation and invasive potential of human prostatic cancer LNCaP cells. Int. J. Urol. 1999, 6, 314–319. [Google Scholar] [CrossRef] [PubMed]
- Noureini, S.; Wink, M. Antiproliferative effect of the isoquinoline alkaloid papaverine in hepatocarcinoma HepG-2 cells—Inhibition of telomerase and induction of senescence. Molecules 2014, 19, 11846–11859. [Google Scholar] [CrossRef]
- Pöch, G.; Kukovetz, W. Papaverine-induced inhibition of phosphodiesterase activity in various mammalian tissues. Life Sci. 1971, 10, 133–144. [Google Scholar] [CrossRef]
- Foster, K.A.; Oster, C.G.; Mayer, M.M.; Avery, M.L.; Audus, K.L. Characterization of the A549 Cell Line as a Type II Pulmonary Epithelial Cell Model for Drug Metabolism. Exp. Cell Res. 1998, 243, 359–366. [Google Scholar] [CrossRef]
- Triner, L.; Vulliemoz, Y.; Schwartz, I.; Nahas, G.G. Cyclic phosphodiesterase activity and the action of papaverine. Biochem. Biophys. Res. Commun. 1970, 40, 64–69. [Google Scholar] [CrossRef]
- Hebb, A.L.O.; Robertson, H.A.; Denovan-Wright, E.M. Phosphodiesterase 10A inhibition is associated with locomotor and cognitive deficits and increased anxiety in mice. Eur. Neuropsychopharmacol. 2008, 18, 339–363. [Google Scholar] [CrossRef]
- Fujishige, K.; Kotera, J.; Michibata, H.; Yuasa, K.; Takebayashi, S.-i.; Okumura, K.; Omori, K. Cloning and characterization of a novel human phosphodiesterase that hydrolyzes both cAMP and cGMP (PDE10A). J. Biol. Chem. 1999, 274, 18438–18445. [Google Scholar] [CrossRef] [Green Version]
- Beavo, J.A. Cyclic nucleotide phosphodiesterases: Functional implications of multiple isoforms. Physiol. Rev. 1995, 75, 725–748. [Google Scholar] [CrossRef]
- Handa, N.; Mizohata, E.; Kishishita, S.; Toyama, M.; Morita, S.; Uchikubo-Kamo, T.; Akasaka, R.; Omori, K.; Kotera, J.; Terada, T. Crystal structure of the GAF-B domain from human phosphodiesterase 10A complexed with its ligand, cAMP. J. Biol. Chem. 2008, 283, 19657–19664. [Google Scholar] [CrossRef] [PubMed] [Green Version]
- Fajardo, A.M.; Piazza, G.A.; Tinsley, H.N. The role of cyclic nucleotide signaling pathways in cancer: Targets for prevention and treatment. Cancers 2014, 6, 436–458. [Google Scholar] [CrossRef] [PubMed] [Green Version]
- Lee, K.; Lindsey, A.; Li, N.; Gary, B.; Andrews, J.; Keeton, A.; Piazza, G. β-catenin nuclear translocation in colorectal cancer cells is suppressed by PDE10A inhibition, cGMP elevation, and activation of PKG. Oncotarget 2015, 7, 5353–5365. [Google Scholar] [CrossRef] [PubMed] [Green Version]
- Coskran, T.M.; Morton, D.; Menniti, F.S.; Adamowicz, W.O.; Kleiman, R.J.; Ryan, A.M.; Strick, C.A.; Schmidt, C.J.; Stephenson, D.T. Immunohistochemical localization of phosphodiesterase 10A in multiple mammalian species. J. Histochem. Cytochem. 2006, 54, 1205–1213. [Google Scholar] [CrossRef]
- Gross-Langenhoff, M.; Hofbauer, K.; Weber, J.; Schultz, A.; Schultz, J.E. cAMP is a ligand for the tandem GAF domain of human phosphodiesterase 10 and cGMP for the tandem GAF domain of phosphodiesterase 11. J. Biol. Chem. 2006, 281, 2841–2846. [Google Scholar] [CrossRef] [PubMed] [Green Version]
- Friedman, D.L. Role of cyclic nucleotides in cell growth and differentiation. Physiol. Rev. 1976, 56, 652–708. [Google Scholar] [CrossRef]
- New, D.; Wong, Y. Molecular mechanisms mediating the G protein-coupled regulation of cell cycle progression. J. Mol. Signal. 2007, 2, 2. [Google Scholar] [CrossRef] [Green Version]
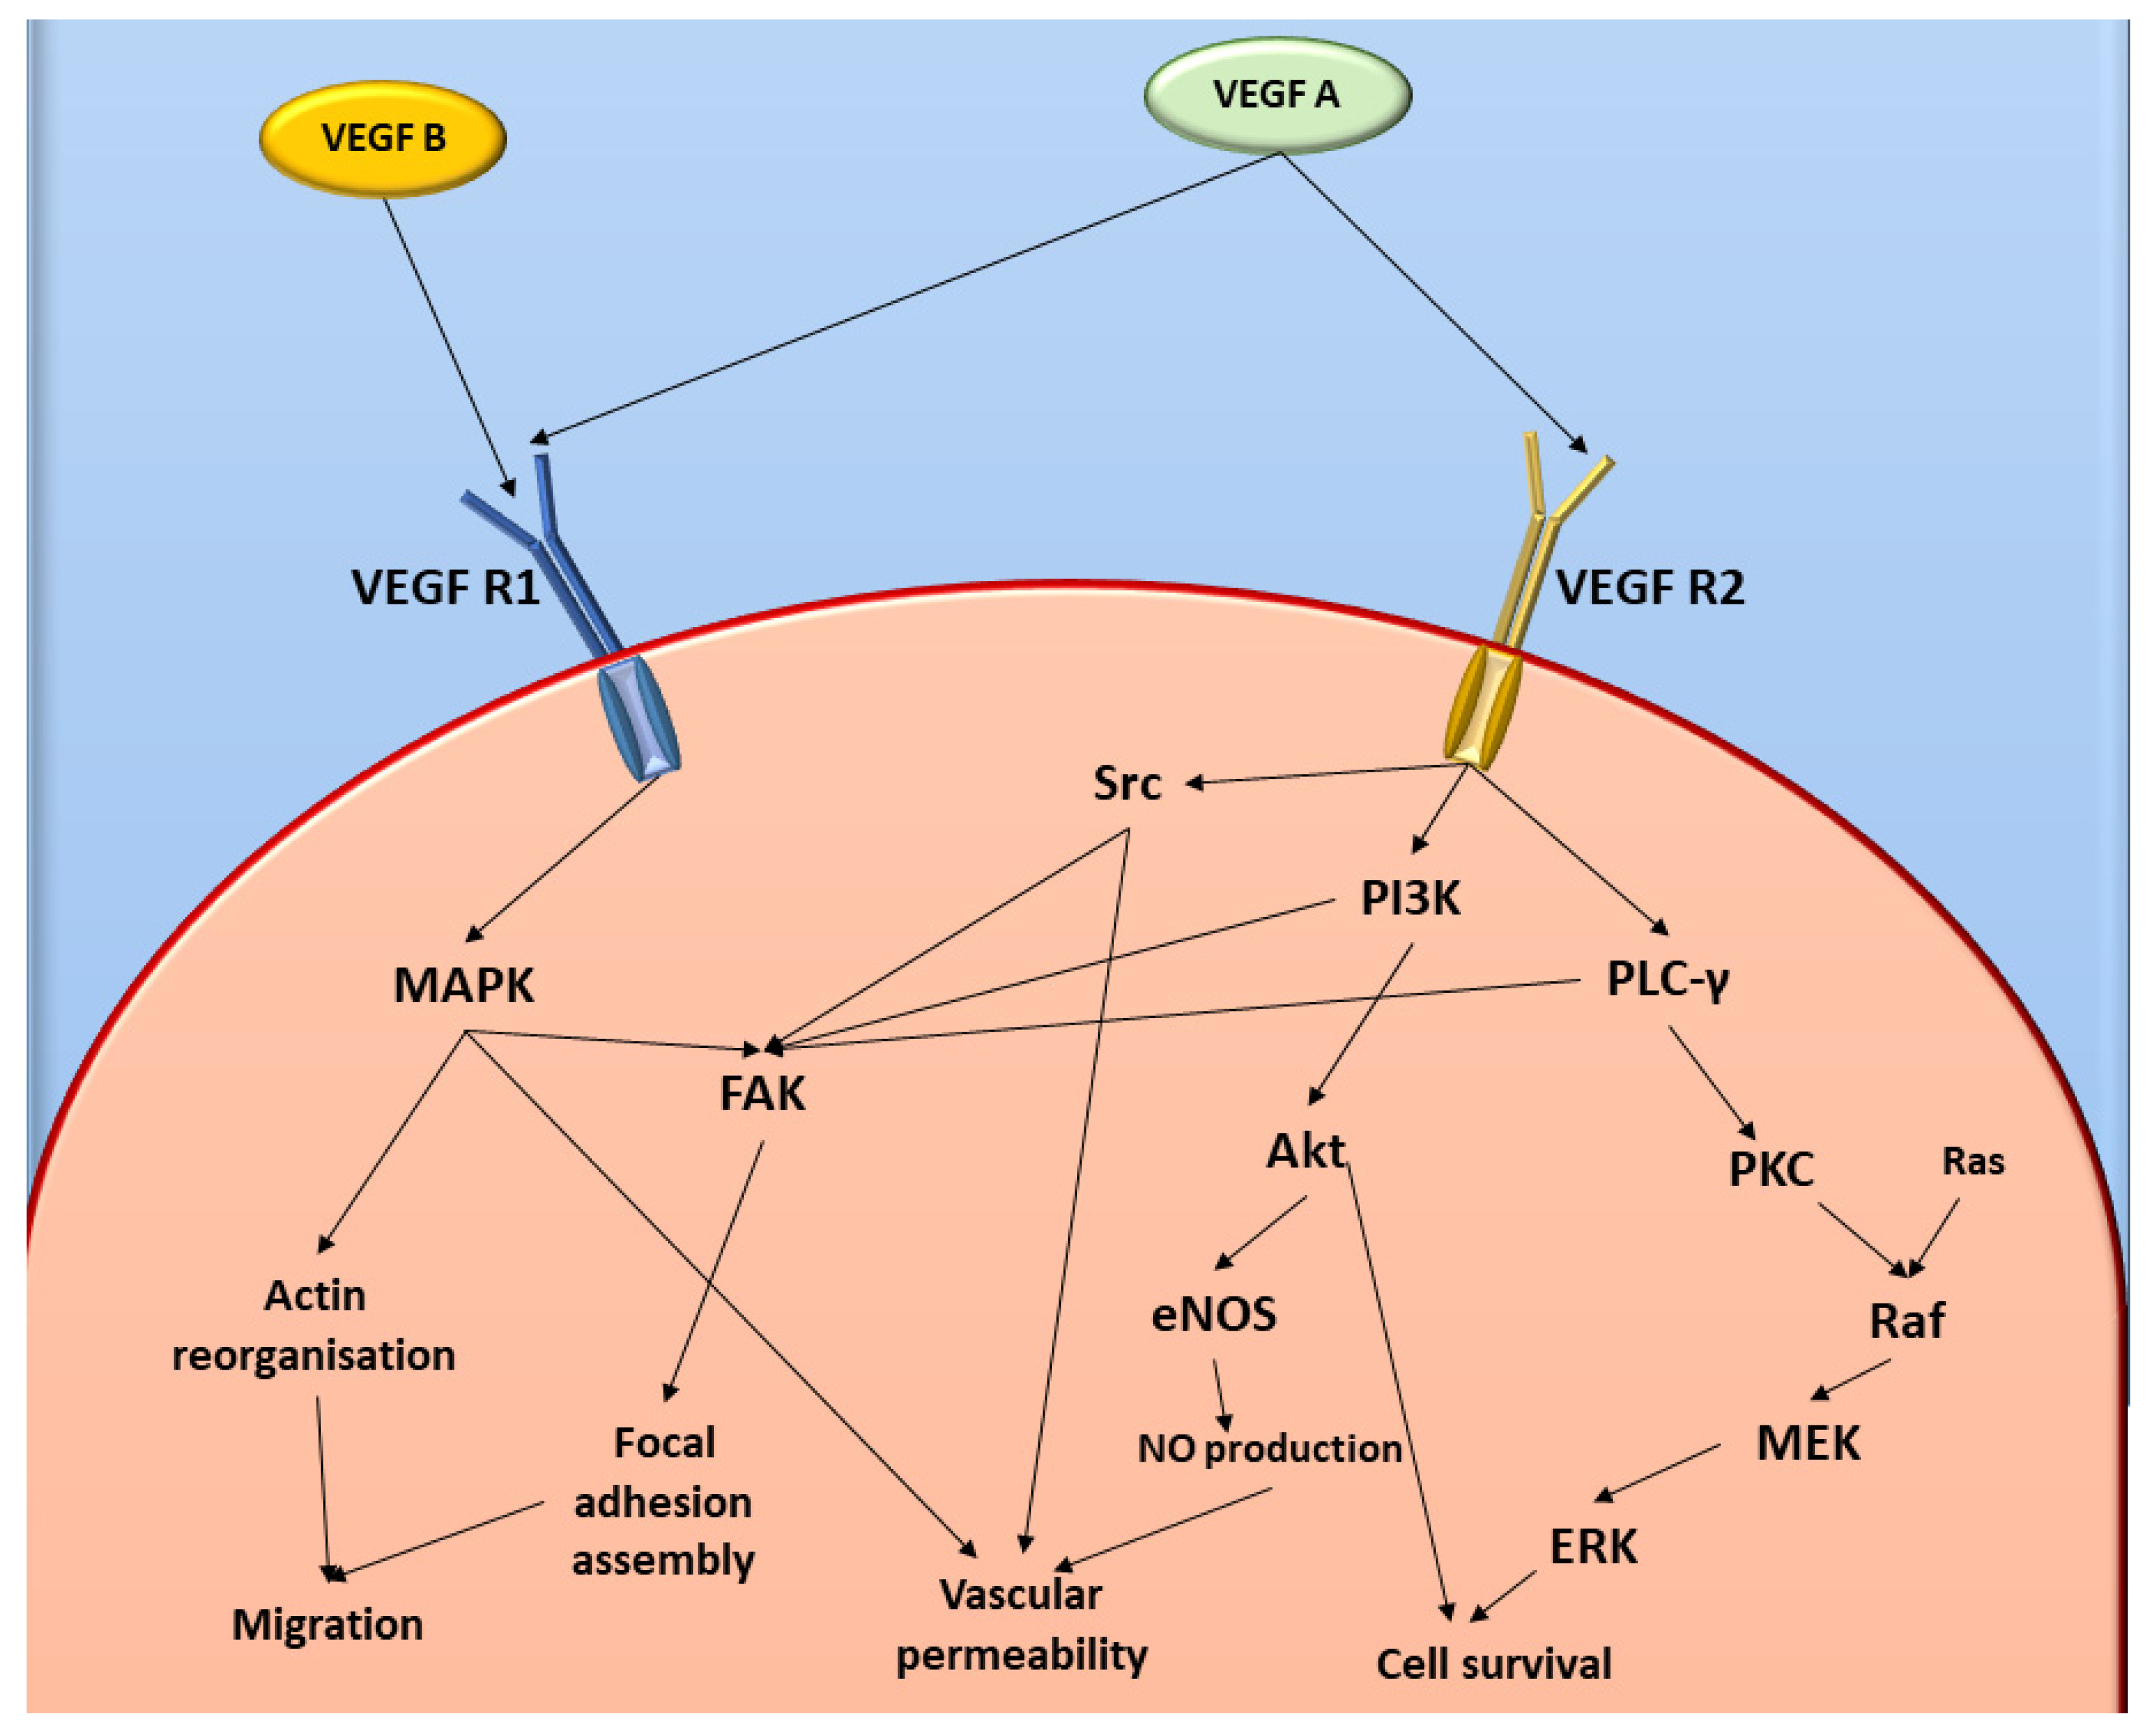
- Takahashi, H.; Shibuya, M. The vascular endothelial growth factor (VEGF)/VEGF receptor system and its role under physiological and pathological conditions. Clin. Sci. 2005, 109, 227–241. [Google Scholar] [CrossRef] [Green Version]
- Li, X.; Lee, C.; Tang, Z.; Zhang, F.; Arjunan, P.; Li, Y.; Hou, X.; Kumar, A.; Dong, L. VEGF-B: A survival, or an angiogenic factor? Cell Adhes. Migr. 2009, 3, 322–327. [Google Scholar] [CrossRef] [Green Version]
- Falcon, B.L.; Chintharlapalli, S.; Uhlik, M.T.; Pytowski, B. Antagonist antibodies to vascular endothelial growth factor receptor 2 (VEGFR-2) as anti-angiogenic agents. Pharmacol. Ther. 2016, 164, 204–225. [Google Scholar] [CrossRef] [Green Version]
- Alasvand, M.; Assadollahi, V.; Ambra, R.; Hedayati, E.; Kooti, W.; Peluso, I. Antiangiogenic Effect of Alkaloids. Oxidative Med. Cell. Longev. 2019, 2019, 9475908. [Google Scholar] [CrossRef] [PubMed]
- Ferrer, F.A.; Miller, L.J.; Andrawis, R.I.; Kurtzman, S.H.; Albertsen, P.C.; Laudone, V.P.; Kreutzer, D.L. Vascular endothelial growth factor (VEGF) expression in human prostate cancer: In situ and in vitro expression of VEGF by human prostate cancer cells. J. Urol. 1997, 157, 2329–2333. [Google Scholar] [CrossRef]
- Yoshiji, H.; Gomez, D.E.; Shibuya, M.; Thorgeirsson, U.P. Expression of vascular endothelial growth factor, its receptor, and other angiogenic factors in human breast cancer. Cancer Res. 1996, 56, 2013–2016. [Google Scholar] [PubMed]
- Koukourakis, M.I.; Papazoglou, D.; Giatromanolaki, A.; Bougioukas, G.; Maltezos, E.; Siviridis, E. VEGF gene sequence variation defines VEGF gene expression status and angiogenic activity in non-small cell lung cancer. Lung Cancer 2004, 46, 293–298. [Google Scholar] [CrossRef]
- Chen, X.L.; Nam, J.-O.; Jean, C.; Lawson, C.; Walsh, C.T.; Goka, E.; Lim, S.-T.; Tomar, A.; Tancioni, I.; Uryu, S.; et al. VEGF-induced vascular permeability is mediated by FAK. Dev. Cell 2012, 22, 146–157. [Google Scholar] [CrossRef] [Green Version]
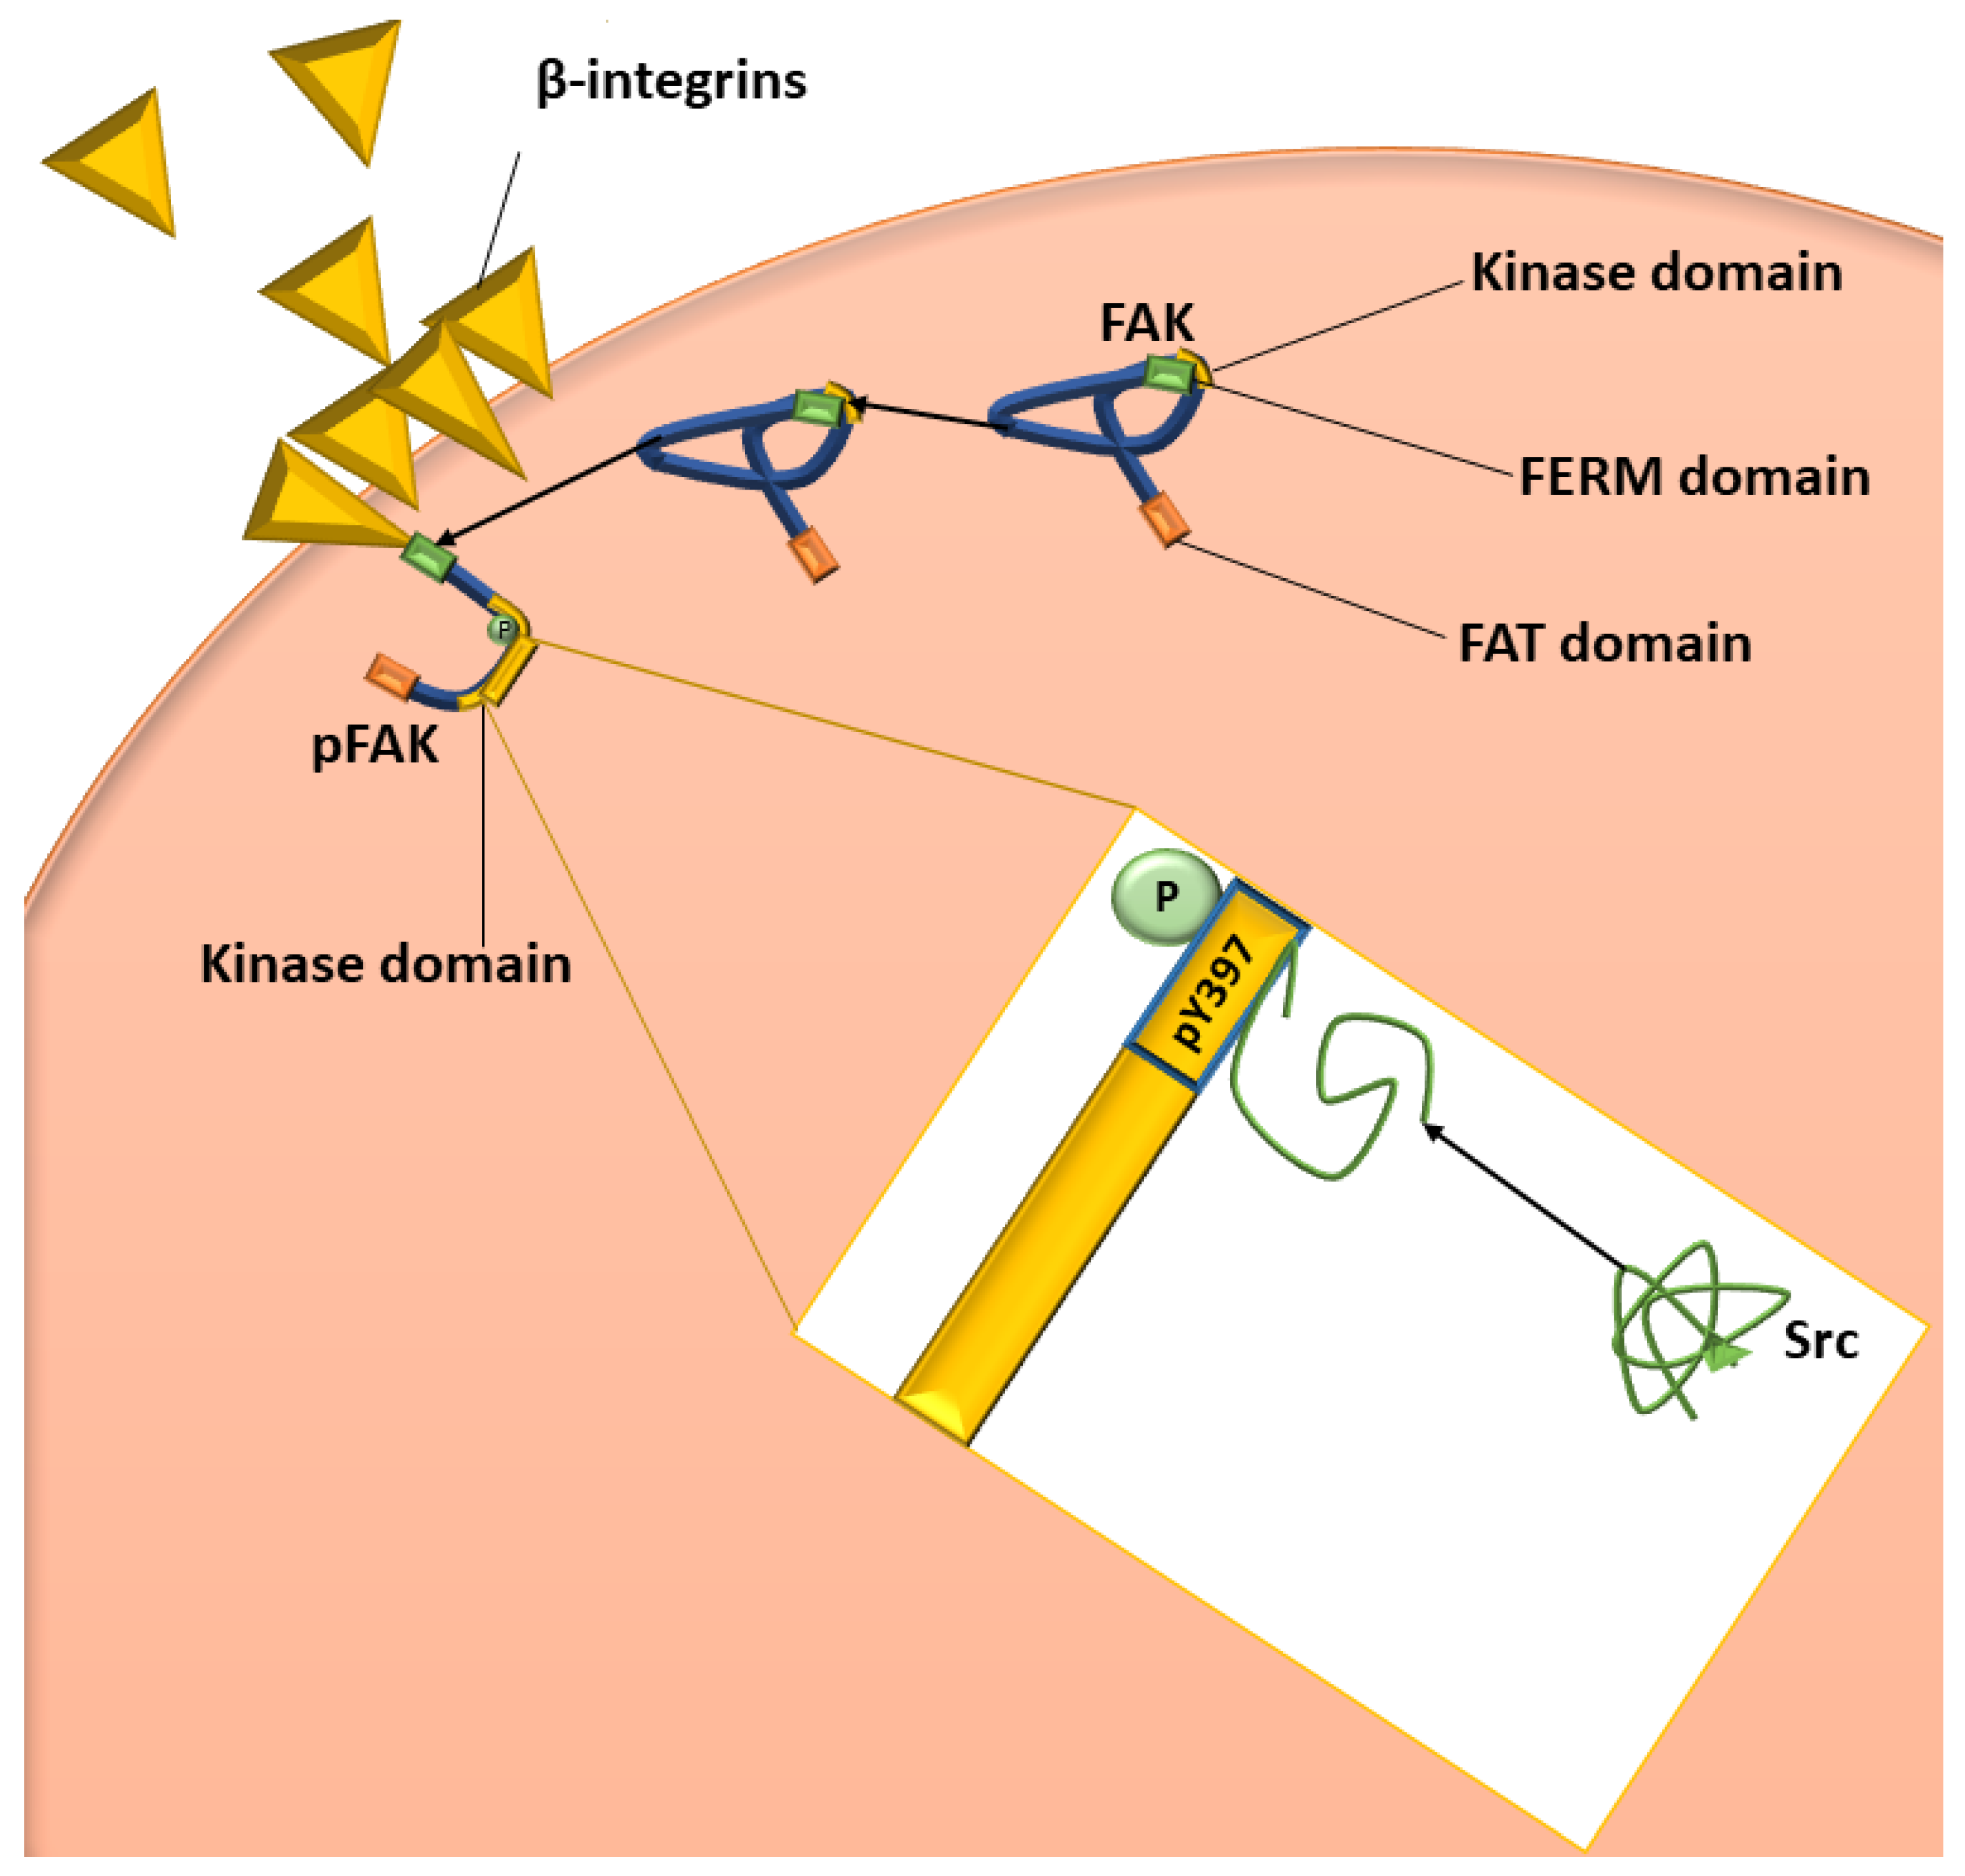
- Schaller, M.D. Biochemical signals and biological responses elicited by the focal adhesion kinase. Biochim. Biophys. Acta-Mol. Cell Res. 2001, 1540, 1–21. [Google Scholar] [CrossRef] [Green Version]
- Schlaepfer, D.D.; Mitra, S.K.; Ilic, D. Control of motile and invasive cell phenotypes by focal adhesion kinase. Biochim. Biophys. Acta-Mol. Cell Res. 2004, 1692, 77–102. [Google Scholar] [CrossRef]
- Lee, S.H.; Lee, Y.J.; Song, C.H.; Ahn, Y.K.; Han, H.J. Role of FAK phosphorylation in hypoxia-induced hMSCS migration: Involvement of VEGF as well as MAPKS and eNOS pathways. Am. J. Physiol.-Cell Physiol. 2010, 298, C847–C856. [Google Scholar] [CrossRef]
- Xu, L.; Owens, L.V.; Sturge, G.C.; Yang, X.; Liu, E.T.; Craven, R.J.; Cance, W.G. Attenuation of the expression of the focal adhesion kinase induces apoptosis in tumor cells. Cell Growth Differ.-Publ. Am. Assoc. Cancer Res. 1996, 7, 413–418. [Google Scholar]
- Frisch, S.M.; Vuori, K.; Ruoslahti, E.; Chan-Hui, P.-Y. Control of Adhesion-dependent Cell Survival by Focal Adhesion Kinase. J. Cell Biol. 1996, 134, 793–799. [Google Scholar] [CrossRef] [Green Version]
- Li, Z.; Rich, J.N. Hypoxia and hypoxia inducible factors in cancer stem cell maintenance. Divers. Eff. Hypoxia Tumor Progress. 2010, 345, 21–30. [Google Scholar]
- Hanahan, D.; Weinberg, R.A. The hallmarks of cancer. Cell 2000, 100, 57–70. [Google Scholar] [CrossRef] [Green Version]
- Van Nimwegen, M.J.; van de Water, B. Focal adhesion kinase: A potential target in cancer therapy. Biochem. Pharmacol. 2007, 73, 597–609. [Google Scholar] [CrossRef] [PubMed]
- Hanks, S.K.; Ryzhova, L.; Shin, N.-Y.; Brábek, J. Focal adhesion kinase signaling activities and their implications in the control of cell survival and motility. Front. Biosci. 2003, 8, d982–d996. [Google Scholar] [CrossRef] [Green Version]
- Tonini, T.; Rossi, F.; Claudio, P.P. Molecular basis of angiogenesis and cancer. Oncogene 2003, 22, 6549–6556. [Google Scholar] [CrossRef] [PubMed] [Green Version]
- Carmeliet, P.; Jain, R.K. Angiogenesis in cancer and other diseases. Nature 2000, 407, 249–257. [Google Scholar] [CrossRef]
- McMahon, G. VEGF receptor signaling in tumor angiogenesis. Oncologist 2000, 5, 3–10. [Google Scholar] [CrossRef]
- Li, X.; Kumar, A.; Zhang, F.; Lee, C.; Tang, Z. Complicated life, complicated VEGF-B. Trends Mol. Med. 2012, 18, 119–127. [Google Scholar] [CrossRef]
- Perona, R. Cell signalling: Growth factors and tyrosine kinase receptors. Clin. Transl. Oncol. 2006, 8, 77–82. [Google Scholar] [CrossRef]
- Li, X. VEGF-B: A thing of beauty. Cell Res. 2010, 20, 741–744. [Google Scholar] [CrossRef]
- Bergers, G.; Benjamin, L.E. Tumorigenesis and the angiogenic switch. Nat. Rev. Cancer 2003, 3, 401–410. [Google Scholar] [CrossRef] [PubMed]
- Falk, T.; Gonzalez, R.T.; Sherman, S.J. The Yin and Yang of VEGF and PEDF: Multifaceted Neurotrophic Factors and Their Potential in the Treatment of Parkinson’s Disease. Int. J. Mol. Sci. 2010, 11, 2875–2900. [Google Scholar] [CrossRef] [PubMed] [Green Version]
- Yuan, S.; Liu, Z.; Xu, Z.; Liu, J.; Zhang, J. High mobility group box 1 (HMGB1): A pivotal regulator of hematopoietic malignancies. J. Hematol. Oncol. 2020, 13, 91. [Google Scholar] [CrossRef] [PubMed]
- Manning, B.D.; Cantley, L.C. AKT/PKB signaling: Navigating downstream. Cell 2007, 129, 1261–1274. [Google Scholar] [CrossRef] [Green Version]
- Sarbassov, D.D.; Ali, S.M.; Sabatini, D.M. Growing roles for the mTOR pathway. Curr. Opin. Cell Biol. 2005, 17, 596–603. [Google Scholar] [CrossRef]
- Xie, J.; Ponuwei, G.A.; Moore, C.E.; Willars, G.B.; Tee, A.R.; Herbert, T.P. cAMP inhibits mammalian target of rapamycin complex-1 and -2 (mTORC1 and 2) by promoting complex dissociation and inhibiting mTOR kinase activity. Cell. Signal. 2011, 23, 1927–1935. [Google Scholar] [CrossRef] [Green Version]
- Valsecchi, F.; Ramos-Espiritu, L.S.; Buck, J.; Levin, L.R.; Manfredi, G. cAMP and Mitochondria. Physiology 2013, 28, 199–209. [Google Scholar] [CrossRef]
- Hulkower, K.I.; Herber, R.L. Cell migration and invasion assays as tools for drug discovery. Pharmaceutics 2011, 3, 107–124. [Google Scholar] [CrossRef] [Green Version]
- Chen, Y. Scratch Wound Healing Assay. Bio-Protocol 2012, 2, e100. [Google Scholar] [CrossRef] [Green Version]
- Botes, M.; Jurgens, T.; Riahi, Z.; Visagie, M.; Janse van Vuuren, R.; Joubert, A.M.; van den Bout, I. A novel non-sulphamoylated 2-methoxyestradiol derivative causes detachment of breast cancer cells by rapid disassembly of focal adhesions. Cancer Cell Int. 2018, 18, 188. [Google Scholar] [CrossRef]


Publisher’s Note: MDPI stays neutral with regard to jurisdictional claims in published maps and institutional affiliations. |
© 2022 by the authors. Licensee MDPI, Basel, Switzerland. This article is an open access article distributed under the terms and conditions of the Creative Commons Attribution (CC BY) license (https://creativecommons.org/licenses/by/4.0/).
Share and Cite
Gomes, D.A.; Joubert, A.M.; Visagie, M.H. In Vitro Effects of Papaverine on Cell Migration and Vascular Endothelial Growth Factor in Cancer Cell Lines. Int. J. Mol. Sci. 2022, 23, 4654. https://doi.org/10.3390/ijms23094654
Gomes DA, Joubert AM, Visagie MH. In Vitro Effects of Papaverine on Cell Migration and Vascular Endothelial Growth Factor in Cancer Cell Lines. International Journal of Molecular Sciences. 2022; 23(9):4654. https://doi.org/10.3390/ijms23094654
Chicago/Turabian StyleGomes, Daniella Anthea, Anna Margaretha Joubert, and Michelle Helen Visagie. 2022. "In Vitro Effects of Papaverine on Cell Migration and Vascular Endothelial Growth Factor in Cancer Cell Lines" International Journal of Molecular Sciences 23, no. 9: 4654. https://doi.org/10.3390/ijms23094654
APA StyleGomes, D. A., Joubert, A. M., & Visagie, M. H. (2022). In Vitro Effects of Papaverine on Cell Migration and Vascular Endothelial Growth Factor in Cancer Cell Lines. International Journal of Molecular Sciences, 23(9), 4654. https://doi.org/10.3390/ijms23094654