Abstract
Being an invasive plant, Polygonum cuspidatum is highly resilient and can survive in unfavorable environments for long periods; however, its molecular mechanisms associated with such environmental resistance are largely unknown. In this study, a WRKY transcription factor (TF) gene, PcWRKY11, was identified from P. cuspidatum by analyzing methyl jasmonate (MeJA)-treated transcriptome data. It showed a high degree of homology with WRKY11 from Arabidopsis thaliana, containing a WRKY domain and a zinc finger structure and II-d WRKY characteristic domains of HARF, a calmodulin-binding domain (C-motif), and a putative nuclear localization signal (NLS) through sequence alignment and functional element mining. qPCR analysis showed that the expression of PcWRKY11 can be induced by NaCl, osmotic stress, and UV-C. In this study, we also found that overexpression of PcWRKY11 in A. thaliana could significantly increase salt tolerance. To explore its possible molecular mechanism, further investigations showed that compared with the wild type (WT), under salt stress, the transgenic plants showed a lower malondialdehyde (MDA) content, higher expression of ascorbate peroxidase (APX) and superoxide dismutase (SOD), and higher enzyme activity of peroxidase (POD), superoxide dismutase (SOD), and catalase (CAT). Moreover, the transgenic plants also showed higher expression of Δ1-pyrroline-5-carboxylate synthase (AtP5CS), and higher contents of proline and soluble sugar. Taken together, these results indicate that PcWRKY11 may have a positive role in plants’ adaptation to salinity conditions by reducing reactive oxygen species (ROS) levels and increasing osmosis substance synthesis.
1. Introduction
Soil salinization is a serious unfavorable environmental factor that hinders plant seed germination, growth, and fruiting. Currently, more than 800 million hectares of land are affected by soil salinization worldwide, and the ratio is still increasing [1]. Excessive soil salinity causes plants to be subjected to osmotic and ionic toxicity stress, leading to growth inhibition, development changes, and severely hindered metabolism. Osmotic and ion stress can also cause secondary stress to plants, including the accumulation of toxic compounds and the destruction of nutrient balance. ROS, such as hydroxyl radicals, hydrogen peroxide, and superoxide anions, accumulate in plant cells, which can severely damage cell structures and macromolecules, such as enzymes, DNA, and lipids, which in turn affect plant growth and even cause death [2,3].
To adapt to such challenges, plant respond to salt stress through gene expression, transcriptional regulation, and signal transduction [4]. Among them, transcriptional regulation is the most important regulation part of plants’ tolerance against salt stress. TFs are integral in linking salt-sensory pathways to many tolerance responses. Core sets of TF family genes are differentially expressed in response to elevated external salinity [5], including the WRKY [6], MYB [7], basic helix-loop-helix (bHLH) [8], basic leucine zipper (bZIP) [9], and NAC [10] families. These TFs in turn regulate the expression levels of various genes that may ultimately affect the level of salt tolerance in plants [11].
The WRKY TF family is one of the largest TF families in higher plants. WRKY is named after the conserved WRKYGQK sequence, which contains about 60 amino acid residues at the N-terminus. The members of this family contain one or two WRKY domains at the N-terminus and a zinc finger motif at the C-terminus and are divided into three categories, namely groups I, II, and III. The first one contains two WRKY domains and a C2H2 zinc finger motif, the second one includes a WRKY domain and a C2H2 zinc finger motif, and the third one contains a WRKY domain and a C2HC zinc finger motif [12]. Phylogenetic tree analysis of AtWRKY based on their WRKY domains showed that group II can be further divided into five distinct subgroups (II a–e). The II-d subgroup possesses two domains in common in addition to the WRKY domain and the zinc finger motif: the so-called HARF domain of unknown function, and the C domain, which was shown to mediate calcium-dependent interaction with calmodulin. Calcium is an important second messenger in plant signal transduction pathways, including the response to abiotic stress. This suggests that the II-d group WRKY may also be involved in plant response to abiotic stresses [13].
In recent years, increasingly more research reports have pointed out that WRKY plays an important role in a variety of stress response processes in plants, especially in responses to salt stresses [14,15]. For example, land cotton GhWRKY17 and Arachis hypogaea AhWRKY75 improved salt tolerance in transgenic plants by upregulating several genes related to the ROS scavenging system [16,17]. Likewise, Ipomoea batatas IbWRKY2 overexpression improved transgenic A. thaliana proline contents and SOD activity after salt treatments [18]. Wheat TaWRKY13 enhanced salt tolerance in transgenic Arabidopsis and after salt treatment, TaWRKY13 overexpressing A. thaliana lines had a longer root and a larger root surface area than the control [19].
P. cuspidatum is regarded as an invasive plant in Europe and North America because of its aggressive growth, allelopathy, and strong abiotic stress tolerance. P. cuspidatum could also cause huge ecological (biodiversity loss) and economic problems (infrastructure damage) [20,21]. Studies have shown that soil salinity plays an important role in promoting or limiting the spread of alien species [22,23,24,25,26]. P. cuspidatum exhibits tolerance to high salt treatment, which is the essential factor of being an invasive plant [27]. Therefore, it is necessary to explore the salt tolerance mechanism of P. cuspidatum. However, currently, there are only a few studies on the stress resistance mechanisms of P. cuspidatum. For example, Bao et al. (2018) reported that PcWRKY33 negatively regulates the salt tolerance of transgenic plants by downregulating the induction of stress-related genes and by increasing the level of cellular ROS [28]. Recently, a new member of the AP2/ERF TF gene, PcDREB2A, was identified through transcriptome data analysis, and it enhanced drought tolerance in transgenic plants [29].
Studies have shown that salt tolerance is critical for P. cuspidatum to be a successful invasive plant [27]. To further elucidate this salt resistance mechanism, PcWRKY11 was first identified in P. cuspidatum by analyzing MeJA-treated transcriptome data, then overexpressed in A. thaliana via Agrobacterium-mediated transformation. Our results demonstrated that PcWRKY11 plays a positive role in plant adaptation to salinity conditions by reducing ROS levels and increasing osmosis substance synthesis.
2. Results
2.1. Identification and Sequence Analysis of PcWRKY11
The transcriptome database of P. cuspidatum treated with MeJA (accession number: PRJNA626400) was constructed in our laboratory. Through association analysis, we obtained four splicing sequences annotated as MYB/WRKY related to metabolism and stress, and further studied the function of one of them in this study. According to the known sequence, specific primers were designed, and gene fragments were amplified with P. cuspidatum cDNA as a template. The full length of the cDNA was 1014 bp, encoding a WRKY domain protein of 338 amino acids.
The phylogenetic tree analysis of the protein sequence with the A. thaliana WRKY protein family showed that it presents a 42% similarity with AtWRKY11 of A. thaliana (A0A1P8B8D0), and was preliminarily classified into the II-d subfamily of the WRKY family (Figure 1A). Due to the high degree of homology with AtWRKY11, the new WRKY gene was preliminarily named PcWRKY11. To further mine useful information from the PcWRKY11 protein sequence, functional element mining was performed by comparing the PcWRKY11 protein sequence with typical ⅠⅠ-d WRKYs, AtWRKY11, AtWRKY15, and AtWRKY17 using the MEME combinatorial tool. The analysis result showed that the PcWRKY11 protein sequence contains a typical nuclear localization signal sequence (KRKRK) preceded by the WRKY domain. This protein is predicted to have a possible role in the nucleus as a TF (Figure 1B).
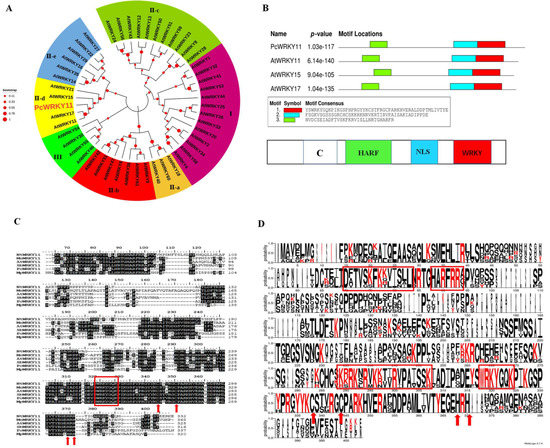
Figure 1.
Bioinformatics analysis of PcWRKY11. (A) Phylogenetic tree of the PcWRKY11 and AtWRKY protein family. The amino acid sequences were subjected to Clustal W using the neighbor-joining method in MEGA X; PcWRKY11 is marked with red enlarged font; At, Arabidopsis thaliana; Pc, Polygonum cuspidatum. (B) The schematic diagram of the II-d WRKY conserved domain. White: binding domain with calmodulin, green: II-d WRKY characteristic domain, blue: nuclear localization domain, red: WRKY characteristic domain. (C) Sequence alignment of PcWRKY11 to other plant WRKY11. Identical amino acids are shaded in color, the WRKYGQK conservative sequence is outlined by a box, and the C and H residues in the zinc-finger motif are marked by an arrow; Nt, Nicotiana tabacum; Mn, Morus notabilis; At, Arabidopsis thaliana; Sb, Soy beans; Pc, Polygonum cuspidatum; Mp, Mucuna pruriens. (D) Visualization of the result of the sequence similarity of PcWRKY11 to the other plant WRKY11. The larger the letter, the more conservative the amino acid. Shared conserved domains are boxed in red.
To further confirm the nomenclature correctness of PcWRKY11, sequence comparison with WRKY11 from other species, including NtWRKY11 (A0A1U7W174), AtWRKY11 (A0A1P8B8D0), SbWRKY11 (A0A445EXZ3), MpWRKY11 (A0A371FYH7), and MnWRKY11 (A0A1U7W174), was performed. The results showed that the gene contains a WRKY signature domain (marked by a red box) and a C2H2-type zinc finger structure (marked by red arrows), which conforms to the ⅠⅠ WRKY family characteristics (Figure 1C). Meanwhile, by visually analyzing the homology alignment results in Figure 1C, we found that the PcWRKY11 protein sequence contained a conserved C functional domain (DTVFISL) in the 65 to 100 amino acid interval, which served as the ⅠⅠ-d WRKY subfamily characteristic domain, associated with calmodulin binding (Figure 1D). In summary, PcWRKY11 was correctly named and submitted to GenBank (MZ734625).
2.2. Expression Analysis of PcWRKY11
To further investigate the expression pattern of PcWRKY11, qRT-PCR was conducted to detect the transcription levels of PcWRKY11 in different tissues and in response to various abiotic stresses. The results of the expression levels in different tissues show that the expression of PcWRKY11 is relatively high in stems and leaves, with the highest expression found in stems, which was 3-fold more than the expression in roots (Figure 2A).
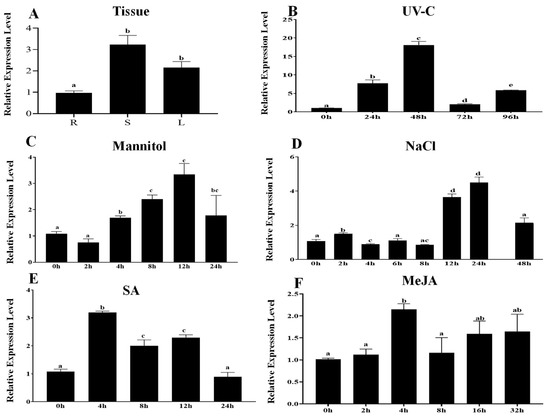
Figure 2.
Expression level of PcWRKY11 in P. cuspidatum. (A) Tissue expression. R, root; S, stem; L, leaf. (B) UV-C. (C) Mannitol. (D) NaCl. (E) SA. (F) MeJA. The plants without any treatment were used as the control, and PcNDUFA13 was the reference gene. Each column stands for a point of time after treatment, and each experiment was repeated at least twice. (B–F): The leaves of 1-month-old seedlings were used in gene expression analysis. Any two bars within the graph with a common letter mean they are not significantly different (p > 0.05).
Among the stress conditions, five stress treatments of MeJA, ultraviolet C (UV-C), high salt (NaCl), salicylic acid (SA), and mannitol were selected to analyze the expression pattern of PcWRKY11. Under different stress conditions, the expression of PcWRKY11 induced by UV-C was the most significant, and it was increased by about 18-fold within 0–48 h, reaching a peak at 48 h (Figure 2B). Under the MeJA treatment, the expression level of PcWRKY11 increased by about 2-fold at 4 h after the treatment and did not change too much in the subsequent 4–32 h (Figure 2F). Under the treatment of 300 mM mannitol, the expression of PcWRKY11 gradually increased within 2–12 h but declined within 12–24 h (Figure 2C). Under the treatment of 300 mM NaCl, the expression level of PcWRKY11 gradually increased within 2–24 h and reached a peak at 24 h at about a 4-fold increase but began to decline after 24 h (Figure 2D). Under the SA treatment, the expression of PcWRKY11 increased about 3-fold after 4 h of treatment, and then began to fall within 4–24 h (Figure 2E). In summary, under hormone treatment, the expression of PcWRKY11 reached a peak within the short time period of 4 h. Under stress treatment, the expression of this gene often required 24 h or longer to peak. The response of PcWRKY11 to the UV-C, NaCl, and mannitol treatment was more noticeable.
2.3. Characterization of PcWRKY11 as A Transcription Factor
Based on reports that WRKY TFs modulate gene expression by interacting with the cis-element W-box to regulate transcription [30], the yeast one-hybrid assay was performed to verify this characterization of PcWRKY11 protein. Two-nucleotide strands with a three-tandem repeated W-box sequence (TTGACC) and three repeated mutations on the W-box sequences (TAGACC) were synthesized, respectively (Figure 3A). Then, the two nucleotide chains were used to construct the yeast expression vectors pLacZi-W-box and pLacZi-mW-box, and used to co-transform EGY48 yeast cells with the yeast expression vector pB42AD-PcWRKY11. The defective medium SD/-Trp/-Ura was used to screen and obtain the positive strains. Then, the positive strains were scraped with a toothpick and smeared on the X-gal-containing defective medium SD/-Trp/-Ura. The results showed that only the yeast co-transformed with pLacZi-W-box and pB42AD-PcWRKY11 turned blue while the yeast co-transformed with pLacZi-mW-box and pB42AD-PcWRKY11 did not turn blue (Figure 3B). These results showed that PcWRKY11 can bind to W-box to activate the expression of the downstream LacZ gene, and this binding is specific.
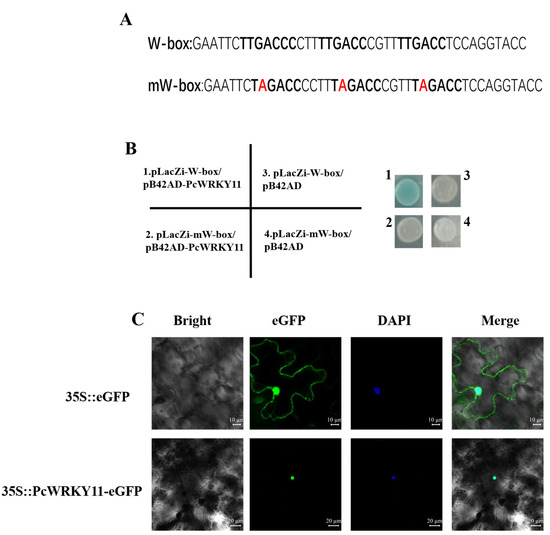
Figure 3.
Analysis of PcWRKY11 transcriptional activation activity. (A) Nucleotide sequence of W-box and mW-box. Red letters represent mutant nucleotides (B) Yeast one-hybrid assay. The chromogenic results of the yeast one-hybrid assay. 1, pLacZi-W-box/pB42AD-PcWRKY11; 2, pLacZi-mW-box/pB42AD-PcWRKY11; 3, pLacZi-W-box/pB42AD; 4, pLacZi-mW-box/pB42AD. (C) Subcellular localization of PcWRKY11 in tobacco cells. PcWRKY11-eGFP fusion protein and eGFP control were transiently expressed in N. benthamiana epidermal cells. A confocal laser scanning microscope was used for observation.
Bioinformatics analysis of the PcWRKY11 protein sequence predicted its potential location in the nucleus, similar to most other TFs. To verify the prediction, the constructed pBI121-PcWRKY11-eGFP and the control pBI121-eGFP vectors were transformed into Agrobacterium tumefaciens GV3101, respectively, using the freeze-thaw method. The transformed A. tumefaciens with the target gene and the control were separately injected into Nicotiana benthamiana leaves. Under the fluorescence confocal microscope, the green fluorescent protein (GFP) was used as a control and distributed throughout the cell while the fluorescence of the PcWRKY11-GFP fusion protein was only distributed in the nucleus similar to the nucleus after 4,6-diamidino-2-phenylindole (DAPI) staining (Figure 3C). These findings confirmed that PcWRKY11 is located in the nucleus.
2.4. PcWRKY11 Enhances Salt Tolerance of Transgenic Arabidopsis
To further investigate the function of PcWRKY11 in plants, PcWRKY11 was overexpressed in A. thaliana under the control of the CaMV35S promoter via Agrobacterium-mediated transformation. Transgenic lines were obtained by kanamycin (Kan) selection (50 mg/L) and further confirmed by PCR (data not shown). Then, semi-quantitative RT-PCR analysis was performed to detect the Kan resistance transgenic plants and WT (Supplementary Figure S1). Based on the result of RT-PCR analysis, 3 lines, namely OE1, OE4, OE8, were selected for the subsequent experiments, and these 3 lines were cultured to the T3 generation to obtain homozygous transgenic A. thaliana for the following experiments.
qPCR analysis showed that the expression of PcWRKY11 was significantly induced by salt stress (Figure 2D). In addition, PcWRKY11 belongs to the ⅠⅠ-d subfamily WRKY, which contains the conserved C motif. This motif binds to calmodulin in a Ca2+-dependent manner to regulate various biological processes, including the response to salt stress. Therefore, the salt tolerance of PcWRKY11 transgenic A. thaliana was investigated.
We conducted root length experiments on 1/2 MS solid medium containing different concentrations of NaCl (0, 150, and 200 mM). The results of the root length experiment showed that both WT and transgenic A. thaliana remained approximately the same on 1/2 MS medium without NaCl. On medium containing 150 mM NaCl, the root growth of the WT was severely inhibited compared with the transgenic lines, and this inhibition was even greater on the medium containing 200 mM NaCl (Figure 4A). The statistical results of the fresh weight showed that the fresh weight of WT was significantly reduced compared with the transgenic lines, and this difference was more significant as the concentration of NaCl increased (Figure 4B).
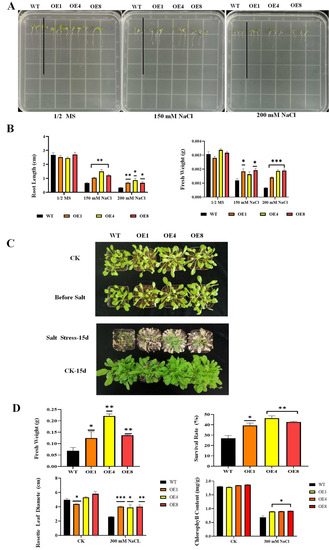
Figure 4.
Overexpression of PcWRKY11 in A. thaliana improved salt tolerance. (A) Transgenic and wild-type plants grown on 1/2× MS medium with different NaCl concentrations. (B) Graphical representation of the root length and fresh weight in (A). (C) Phenotype of 4-week-old transgenic and wild-type plants after salt treatment (300 mM NaCl, 15 days). (D) Statistical analysis of the rosette leaf diameter, fresh weight, survival rate, and chlorophyll content in (C). The mean values and standard errors were calculated with three independent experiments. *, **, and *** represent significance level of p < 0.05, p < 0.01, and p < 0.001, respectively; WT, wild-type plants; OE, overexpressed plants; CK, under normal conditions.
To further investigate the function of PcWRKY11 in plant vegetative growth, 4-week-old seedlings of WT and transgenic A. thaliana were watered with 300 mM NaCl for 15 days. Before NaCl treatment, the growth of PcWRKY11 transgenic lines and WT showed no significant difference. After NaCl treatment for 15 days, the growth of both PcWRKY11 transgenic lines and WT was significantly inhibited, but the WT plants were more severely inhibited than the transgenic lines (Figure 4C).
To further confirm the improvement of PcWRKY11 overexpression on plant growth, the fresh weight, survival rate, rosette leaf diameter, and chlorophyll content of 4-week-old PcWRKY11 transgenic lines and WT after salt stress were analyzed. The results showed that the fresh weight, rosette leaf diameter, chlorophyll content, and survival rate of transgenic lines under salt stress were all higher than that of WT plants (Figure 4D). These results indicated that PcWRKY11 overexpression improved plant growth, as indicated by the rosette leaf growth and chlorophyll synthesis, of transgenic lines, and improved survival compared to WT under salt stress. In summary, the experimental results show that overexpression of PcWRKY11 increased the salt resistance of transgenic plants.
2.5. Analysis of Oxidative Damage in PcWRKY11 Overexpressed Plants
Salt stress can cause accumulation of ROS in plants, mainly H2O2 and O2−. To further investigate the role of PcWRKY11 in response to salt stress, we detected the levels of H2O2 and O2− by 3,3′-diaminobenzidine (DAB) and nitroblue tetrazolium (NBT) staining in WT and transgenic lines after salt treatment. The results of the DAB and NBT staining on detached leaves showed that the leaves of each plant in the control group under normal growth conditions had no obvious staining while the DAB and NBT staining of the transgenic lines after salt treatment was lighter in color than WT, indicating that WT accumulated more ROS and suffered greater damage than PcWRKY11 transgenic A. thaliana under the same salt stress conditions (Figure 5A). Quantitative analysis of the staining results is shown in Supplementary Figure S2.
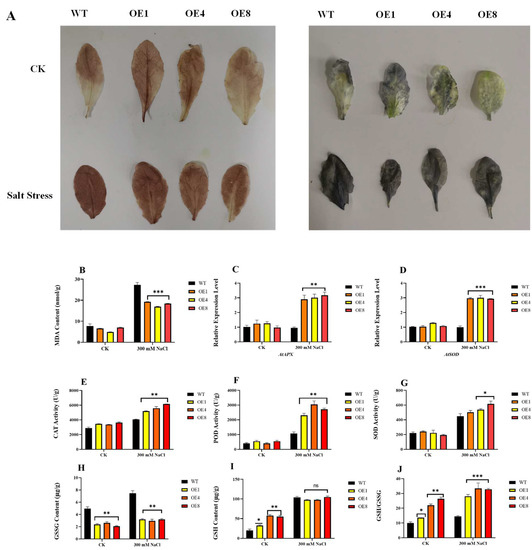
Figure 5.
Oxidative damage indexes after overexpressing PcWRKY11 A. thaliana under salt stress. (A) Staining under salt stress in overexpressed PcWRKY11 plants. Leaves of transgenic and wild-type plants after DAB staining for H2O2 detection under normal conditions and salt treatment. Leaves of transgenic and wild-type plants after NBT staining for O2− detection under normal conditions and salt treatment. (B) MDA content of transgenic and wild-type plants under normal conditions and salt treatment. (C) Relative expression analysis of AtAPX. (D) Relative expression analysis of AtSOD. (E) The enzyme activities of CAT. (F) The enzyme activities of POD. (G) The enzyme activities of SOD. (H) GSSG content of transgenic and wild-type plants under normal conditions and salt treatment. (I) GSH content of transgenic and wild-type plants under normal conditions and salt treatment. (J) GSH to GSSG ratio of transgenic and wild-type plants under normal conditions and salt treatment. The mean values and standard errors were calculated with three independent experiments. *, **, and *** represent a significance level of p < 0.05, p < 0.01, and p < 0.001 respectively; ns, p > 0.05, no significant difference; WT, wild-type plants; OE, overexpressed plants CK, under normal conditions.
Excessive ROS accumulation can cause oxidative damage to plant cells, and the concentration of MDA is an important physiological indicator of the degree of oxidative damage to cell membranes. The MDA concentration was tested, and the results showed that MDA was significantly increased in both the WT and transgenic lines after salt treatment, but the concentration increase was significantly higher in WT than in the transgenic lines (Figure 5B). To further clarify the mechanism of salt resistance in the transgenic lines, the relative expression of antioxidant enzyme genes was examined in the transgenic and WT lines after salt stress. The results showed that the expression of AtAPX and AtSOD in the transgenic lines increased by an average of 3-fold and 2-fold compared to those in the WT, respectively (Figure 5C,D). We also examined the enzyme activities of CAT, SOD, and POD, and the results show that the activities of CAT, SOD, and POD in the transgenic lines were higher than those in the WT after the same salt treatment (Figure 5E–G).
In addition, the glutathione (GSH) and oxidized glutathione (GSSG) contents of the transgenic lines and WT were examined after salt treatment. Figure 5H–J shows that the transgenic lines had a higher GSH/GSSG ratio, which indicates that the transgenic lines contain more reducing substances and can cope with salt-induced oxidative stress better. These results indicate that the transgenic lines improved salt tolerance by enhancing antioxidant enzyme-like activities and antioxidant synthesis under salt stress.
2.6. Analysis of Osmotic Stress in PcWRKY11 Overexpressed Plants
Salt stress can also cause osmotic stress to plants. Under osmotic stress, plants synthesize some osmotic-regulating substances, such as proline, betaine, soluble sugar, soluble protein, etc. Among them, the content of proline is one of the most important indicators affecting the ability of plants to tolerate salt stress.
To further elucidate the mechanism of PcWRKY11 improvement of plant salt resistance, we detected the content of proline in transgenic plants and WT plants under the 300 mM NaCl treatment. The results show that significantly more proline was produced by transgenic lines than WT lines under the same salt stress (Figure 6A). In addition, we also detected the content of soluble sugar in transgenic and WT plants at the same time. The results show that significantly more soluble sugar was produced by transgenic lines than WT lines under high salt stress (Figure 6B). To further clarify the differences between transgenic lines and WT under osmotic stress, qPCR was used to detect the gene expression of AtP5CS, which is the limiting enzyme gene in the proline synthesis process. The results showed that under high salt stress, the expression of AtP5CS in the transgenic lines increased about 8–11-fold, compared with WT (Figure 6C). These results suggest that PcWRKY11 may improve the salt tolerance of transgenic plants by increasing osmolytes in vivo.
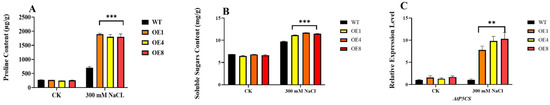
Figure 6.
Osmotic stress analysis of PcWRKY11 overexpression plants under salt stress. (A) Proline content in the wild-type and transgenic lines under normal conditions and the salt treatment condition. (B) Soluble sugar content in the wild-type and transgenic lines under normal conditions and salt treatment conditions. (C) The expression of the proline synthesis gene AtP5CS in plants. The mean values and standard errors were calculated with three independent experiments. **, and *** represent a significance level of, p < 0.01, and p < 0.001, respectively; WT, wild-type plants; OE, overexpressed plants CK, under normal conditions.
3. Discussion
P. cuspidatum is listed among the 100 worst invasive alien species in the world [27]. It shows strong adaptability and tolerance to a wide range of stresses, such as high temperature, salt, cold, drought, waterlogging, burning, heavy metals, various soil types, etc. [31,32]. However, few molecular biological studies on the identification of TFs and the possible mechanism of stress resistance in P. cuspidatum have been conducted.
MeJA is an endogenous messenger molecule that plays an important role in regulating responses to biotic and abiotic stresses in plants [33,34]. In order to investigate the stress resistance mechanism of P. cuspidatum, we established the transcriptome data of P. cuspidatum treated with MeJA and obtained a WRKY family TF, whose expression was significantly increased after MeJA treatment. According to its similarity with AtWRKY11, it was named PcWRKY11. The results of multiple sequence alignment showed that this gene contains a WRKY signature domain and a C2H2 type zinc finger structure, which conforms to the ⅠⅠ group WRKY family characteristics (Figure 1). The PcWRKY11 protein sequence also contains a conserved C functional domain of 65 to 100 amino acids, which serves as the ⅠⅠ-d WRKY subfamily signature domain and is implicated in calmodulin binding [13]. Ca2+ is an important second messenger for plants in response to external stresses, suggesting that PcWRKY11 may be involved in plants’ response to external stresses [35]. The subcellular localization assay and yeast one-hybrid analysis showed that PcWRKY11 was mainly localized in the nucleus and could bind to W-box to activate the expression of the downstream gene (Figure 3). These results suggest that PcWRKY11 is a new WRKY in P. cuspidatum.
PcWRKY11 has highly similar protein sequences with AtWRKY11 (42%), and previous studies showed that the expression of AtWRKY11 was significantly increased after the 100 mM NaCl treatment [36]. In addition, AtWRKY11 and AtWRKY17 knockout mutants (single mutant and double mutant) resulted in slower germination and root growth under salt stress compared with WT, and double mutants were more severe than single mutants. These results indicated that AtWRKY11 and AtWRKY17 were involved in plant salt stress resistance [37]. To further explore the possible functional network of this gene, we analyzed the AtWRKY11 sequence using the STRING protein database (Supplementary Figure S3. The results showed that AtWRKY11 could interact with the peroxidase superfamily protein AT1G14550, which belongs to the POD family, which is functionally annotated to remove H2O2 in response to environmental stress, such as pathogen attack and oxidative stress. Among WRKY11 of other species, OsWRKY11 transgenic rice was reported to have stronger resistance to drought and two serious diseases, thus increasing yields in stress environments [38]. Medicago sativa MsWRKY11 overexpressed in soybean was reported to increase the salt resistance of transgenic plants by increasing the contents of chlorophyll, proline, soluble sugar, SOD, and CAT, and reducing the contents of MDA, H2O2, and O2− [39].
The sequence similarity between PcWRKY11 and other plants WRKY11 suggests that this gene may play a role in plant salt tolerance. To investigate this issue, PcWRKY11 was overexpressed in the model plant Arabidopsis under the control of the CaMV35S promoter via Agrobacterium-mediated transformation. Analysis of phenotypic and physiological parameters showed that the transgenic lines had a higher root length, survival rate, fresh weight, diameter of rosette leaves, and chlorophyll content under salt stress than WT (Figure 4E). These results indicate that PcWRKY11 overexpression increased the salt tolerance of transgenic plants.
An increasing number of studies have shown that WRKYs improve plant salt tolerance by removing ROS to reduce salt-induced oxidative damage. For instance, Salix linearistipularis SlWRKY28 overexpressed in Populus davidiana × P. bolleana significantly upregulated salt resistance by increasing the APX activity of transgenic plants [40]. Overexpression of Zea mays ZmWRKY104 improved salt stress tolerance by alleviating salt-induced ROS accumulation and MDA content in transgenic plants [41]. Consistent with previous studies, the ROS levels of the PcWRKY11 transgenic lines in this study were lower than those of WT as indicated by DAB and NBT staining (Figure 6A). Generally, ROS contents in plants are maintained in a dynamic balance. However, stress disrupts this homeostasis, and causes lipid membranes to decrease or lose their original functions due to peroxidation and deacylation, which will in turn damage the membrane system and metabolic processes of plants and cause damage and destruction of biological macromolecules, such as proteins and nucleic acids, leading to cell death [42]. To decouple the injurious effects of ROS species on plant cells, plants have evolved a series of antioxidant systems to scavenge oxygen damage, which mainly includes SOD, CAT, POD, and so on. In this study, the qPCR results show that the expression of oxidative stress-related genes (AtAPX, AtPOD) in the transgenic lines was significantly higher than that in the WT lines (Figure 5C,D). In addition, the antioxidant enzyme activities of CAT, SOD, and POD of the transgenic lines were higher than those of WT (Figure 5E–G). Furthermore, the transgenic lines had a higher GSH/GSSG ratio, indicating that intracellular ROS were degraded in the transgenic lines under high salt stress (Figure 5H–J). These results suggest that PcWRKY11 can improve the salt tolerance of transgenic lines by enhancing the ROS scavenging ability.
Previous studies have also shown that plants can improve stress tolerance by accumulating osmotic substances, such as soluble sugar and free proline, to regulate the cell osmotic potential and protect the cell structure [43]. Our results indicated that both the free proline and soluble sugar contents of PcWRKY11 transgenic lines were higher than those of the WT plants under salt stress (Figure 6A,B), and qPCR revealed that the transgenic lines had higher AtP5CS expression than the WT lines (Figure 6C). This is consistent with previous studies showing that the accumulation of proline and soluble sugars could increase cellular osmolality, thereby improving plant salt tolerance [44].
In conclusion, a novel II-d WRKY TF, PcWRKY11, was identified from P. cuspidatum in this study. Overexpression of PcWRKY11 in A. thaliana significantly increased tolerance to salt stress in transgenic plants. Further investigations indicated that the transgenic plants showed a lower MDA content and higher enzyme activity of POD, SOD, and CAT than those of WT under salt stress. In addition, the transgenic plants had higher contents of proline and soluble sugar compared with WT under salt stress. The above results indicate that PcWRKY11 may play a positive role in plant adaptation to salinity conditions by reducing ROS levels and increasing osmosis substance synthesis.
4. Materials and Methods
4.1. Plant Material and Treatments
P. cuspidatum seeds were obtained from the Beijing Botanical Garden at the Institute of Botany, Chinese Academy of Sciences, Beijing, China. A. thaliana Columbia ecotype (Col-0) was used to generate transgenic plants. Seeds were surface-sterilized with 75% (v/v) ethanol for 1 min and then soaked in 10% (v/v) hydrogen peroxide or 10% (v/v) sodium hypochlorite solution for 10–20 min. The seeds were washed 3 times with sterile water and sown on Murashige and Skoog (MS) medium containing 3% (w/v) sucrose and 0.8% (w/v) agar (pH 5.8). Plants were grown in a greenhouse at 22 ± 2 °C with a 16-h light/8-h dark photoperiod and 50% relative humidity. Tobacco seeds were sown in pots containing a 1:1 (v/v) mixture of nutrient soil and vermiculite. Approximately 1-month-old tobacco plants were used in the experiments [29].
The P. cuspidatum gene expression patterns were analyzed using the leaves of 1-month-old seedlings. The roots, stems, and leaves were collected separately for the subsequent RNA isolation and tissue-specific gene expression analysis. The following treatments were used: (1) Drought treatment: Tissue culture seedlings were transferred to MS medium containing 300 mM mannitol, and treated for 0, 2, 4, 8, 12, or 24 h. Samples were then placed in liquid nitrogen; (2) high-salt treatment: tissue culture seedlings were transferred to MS medium containing 300 mM NaCl; cultured for 0, 2, 4, 6, 8, 12, 24, or 48 h; and sampled and placed in liquid nitrogen; (3) UV-C treatment: seedlings were placed under an ultraviolet lamp at a distance of about 1 m; cultured for 0, 24, 48, 72, or 96 h; and sampled and placed in liquid nitrogen; (4) MeJA treatment: The leaves of P. cuspidatum sterile seedlings were sprayed with 0.1 mM MeJA; cultured for 0, 2, 4, 8, 16, or 32 h; and sampled and placed in liquid nitrogen; (5) SA treatment: the leaves of aseptic seedlings of P. cuspidatum were sprayed with 1 mM SA; cultured for 0, 4, 8, 12, or 24 h; and sampled and placed in liquid nitrogen; control treatment: Untreated aseptic seedlings of P. cuspidatum were used as a control before treatment. All treatments were completed with three replicates. The collected samples were immediately frozen in liquid nitrogen and stored at −80 °C.
4.2. Gene Cloning and Sequence Analysis
The PcWRKY11 sequence was obtained by transcriptome analysis of P. cuspidatum under the MeJA treatment (NCBI-SRA database accession number: PRJNA626400). Total RNA was extracted from P. cuspidatum using the Plant Total RNA Purification Kit (GeneMark, Taiwan, China). Purified RNA (1 µg) was used as the template for synthesizing first-strand cDNA with the Hifair® II 1st Strand cDNA Synthesis Kit (gDNA digester plus) (Yeasen, Shanghai, China). The PcWRKY11 open reading frame was amplified using PcWRKY11-F/R primers. The PCR program was as follows: 95 °C for 3 min; 35 cycles of 95 °C for 10 s, 58 °C for 30 s, and 72 °C for 30 s; 72 °C for 10 min. The PCR products were purified and cloned into the pEASY-Blunt cloning vector (TransGen, Beijing, China) and subjected to sequencing. Primers were designed using Primer 6.0 software. All of the primers used are listed in Supplementary Table S1. PcWRKY11 sequence was aligned with its homologs using the ClustalX2 software. The neighbor-joining method (1000 bootstrap replicates) was used to construct a phylogenetic tree with the MEGA X software [45].
The amino acid sequences of the WRKY members from other species were obtained from the EMBI database (https://www.ebi.ac.uk/ebisearch/search.ebi, accessed on 18 February 2022). i-TOL (https://itol.embl.de, accessed on 18 February 2022) and WebLogo 3 (http://weblogo.threeplusone.com, accessed on 18 February 2022) were used to visualize the homologous gene alignment results [46]. STRING (https://cn.string-db.org/cgi/network, accessed on 18 February 2022) was used to identify the protein association networks [47]. WoLF PSORT (https://wolfpsort.hgc.jp, accessed on 18 February 2022) and SUBA4 (https://suba.live, accessed on 18 February 2022) were used to predict the subcellular localization of the PcWRKY11 protein.
4.3. Vector Construction and Agrobacterium-Mediated A. thaliana Transformation
To meet the different experimental needs, we designed and constructed a series of vectors. The pBI121-PcWRKY11-eGFP fusion expression vector was used to verify the subcellular localization of PcWRKY11 in plant cells; the pB42AD-PcWRKY11, pLacZi-W-box, pLacZi-mW-box yeast expression vector was used for the yeast one-hybrid experiments; the pBI121-PcWRKY11 plants expression vector was used for transformation in A. thaliana. The pBI121 vector was digested with BamHI and SacI to construct the pBI121-TF expression vector; the pB42AD vector was digested with EcoRI and XhoI to construct the pB42AD-TF expression vector. The EcoRI and KpnI double digestion pLacZi vector was used to construct the pLacZi-W-Box/mW-Box expression vector.
The PBI121-PcWRKY11 vector was transfected into A. thaliana ecotype Columbia-0 by Agrobacterium tumefaciens GV3101 transformation. A. thaliana was transformed using the floral dip method [48]. The seeds of transformants were seeded in 1/2MS medium (containing 50 mg/L Kan) to select the transformed lines until the T3 generation. Seeds of the T3 generation of transgenic plants (OE1, OE4, OE8, randomly selected) were sown and germinated in a nutrient soil to a vermiculite ratio of 1:1 in flowerpots (diameter 10 cm) with normal management in a growth chamber at 25 ± 1 °C under a 16-h light and 8-h dark regime in parallel with the WT seeds.
The sterilized WT and 3 transgenic A. thaliana seeds were spread on 1/2 MS solid medium (containing 50 mg/L Kan) for 4 days after germination and growth, and the A. thaliana seedlings were transferred to different concentrations of NaCl. Plants were grown vertically for 5 days on 1/2 MS medium in NaCl (150 mM, 200 mM). As a control, the growth state of A. thaliana seedlings was observed, and the root length and fresh weight of A. thaliana seedlings were measured and counted. The sterilized WT and 3 transgenic A. thaliana seeds were spread on 1/2 MS (containing 50 mg/L Kan) medium, vernalized at 4 °C for 2–3 days, and then placed in an incubator nourish. The 13-day-old A. thaliana seedlings were transferred to nutrient soil: vermiculite = 1:1 soil and placed in a greenhouse under the same conditions. In total, 9 small plates (36 plates in total) of 4 A. thaliana plants grown in soil for 4 weeks were placed in the same plate and watered every 3 days with 300 mM NaCl solution. After 15 days of treatment, 6 seedlings were randomly selected from each line as samples, recorded and weighed, and then quickly frozen in liquid nitrogen and stored in a −80 °C refrigerator for measurement of the physiological and biochemical indicators [49].
4.4. Subcellular Localization Analysis of PcWRKY11
To analyze the subcellular localization, the PcWRKY11 coding sequence without the termination codon and the eGFP gene sequence were amplified, respectively, by overlapping PCR. The constructed pBI121-PcWRKY11-eGFP plant expression vector and the positive control vector (pBI121-eGFP) were inserted into separate Agrobacterium tumefaciens strain GV3101 cells using the freeze-thaw method. The A. tumefaciens cells transformed with the plant expression vectors were injected into tobacco leaves for the transient expression experiments. At 48 h after the injection, the eGFP fluorescence was observed using an LSM 880 confocal laser scanning microscope (Zeiss, Germany) and the nuclei were stained with DAPI.
4.5. Yeast One-Hybrid Assay
For a yeast one-hybrid assay, the full-length PcWRKY11 coding sequence was amplified by PCR using gene-specific primers and inserted into the yeast expression vector pB42AD between the EcoRI and XhoI sites. Triple tandem repeats of the W-Box and mutant W-Box (mW-Box) sequences were inserted between the EcoRI and KpnI sites of the pLacZi vector. Yeast strain EGY48 cells were co-transformed with the pB42AD-PcWRKY11 and pLacZi-W-Box or pLacZi-mW-Box recombinant plasmids. The transformants were selected and grown on a synthetic dropout medium lacking tryptophan and uracil (SD/−Trp/−Ura). The positive yeast strains were cultured on SD/−Trp/−Ura medium containing 20 mg/mL 5-bromo-4-chloro-3-indolyl-β-D-galactopyranoside (X-gal) to analyze the color development of the strains.
4.6. Quantitative Real-Time PCR Analysis
For a quantitative real-time PCR (qRT-PCR) assay, 1 μL of cDNA was added to a solution consisting of Hieff® qPCR SYBR Green Master Mix (Yeasen), forward primer (1 μM), and reverse primer (1 μM), with a final volume of 10 μL. The qRT-PCR was performed on the Applied Biosystems® QuantStudio™ 7 Flex Real-Time PCR System (Applied Biosystems, Waltham, MA, USA), with the following program: 95 °C for 5 min; 40 cycles of 95 °C for 10 s, 60 °C for 20 s, and 72 °C for 20 s. Relative expression levels were calculated using the 2−ΔΔCt method, with PcNDUFA13 serving as an internal reference control [50]. Details regarding the qRT-PCR primers are listed in Table S1. All qRT-PCR analyses were completed with three independent biological replicates.
4.7. Determination of Related Physiological Indexes
The chlorophyll content was measured according to the method of [51]. The soluble sugar content was measured according to the method of [52]. The proline content was measured according to the method of [53]. The GSH content was measured according to the method of [54]. The GSSH content was measured according to the method of [55]. POD activity was measured using the protocols described in [56]. SOD activity was measured as in [57]. CAT activity was measured following [56]. The MDA content was measured using the protocols described in [58].
4.8. Statistical Analysis
All data are presented herein as the mean ± standard error from three independent replicates. The significance of the differences between the mean values for the control and treated samples was assessed by 1-way analysis of variance (ANOVA) (p < 0.05). Statistical differences were considered significant when * p ≤ 0.05, ** p ≤ 0.01. The GraphPad Prism 8 program was used for the data analyses. Figures were produced with the Microsoft Office 365 and Adobe Photoshop CS5 program.
Supplementary Materials
The following are available online at https://www.mdpi.com/article/10.3390/ijms23084357/s1.
Author Contributions
G.W. and X.W. designed the experiments; G.W., H.F., F.L. and J.C. performed the experiments; G.W. and H.M. analyzed the data; H.W., G.W. and T.C. wrote the manuscript. All authors have read and agreed to the published version of the manuscript.
Funding
This project was supported by National Natural Science Foundation of China (Grant No. 61972374; 61672489).
Institutional Review Board Statement
Not applicable.
Informed Consent Statement
Not applicable.
Data Availability Statement
Not applicable.
Conflicts of Interest
The authors declare no conflict of interest.
References
- Munns, R.; Tester, M. Mechanisms of salinity tolerance. Annu. Rev. Plant Biol. 2008, 59, 651–681. [Google Scholar] [CrossRef] [PubMed]
- Halliwell, B.; Gutteridge, J. Oxidative stress. In Free Radicals in Biology and Medicine, 3rd ed.; Oxford University Press: Oxford, UK, 1999. [Google Scholar]
- Sharma, P.; Dubey, R.S. Involvement of oxidative stress and role of antioxidative defense system in growing rice seedlings exposed to toxic concentrations of aluminum. Plant Cell Rep. 2007, 26, 2027–2038. [Google Scholar] [CrossRef] [PubMed]
- Liu, L.; White, M.J.; MacRae, T.H. Transcription factors and their genes in higher plants: Functional domains evolution and regulation. Eur. J. Biochem. 1999, 262, 247–257. [Google Scholar] [CrossRef] [PubMed]
- Golldack, D.; Luking, I.; Yang, O. Plant tolerance to drought and salinity: Stress regulating transcription factors and their functional significance in the cellular transcriptional network. Plant Cell Rep. 2011, 30, 1383–1391. [Google Scholar] [CrossRef]
- Jiang, Y.; Deyholos, M.K. Functional characterization of Arabidopsis NaCl-inducible WRKY25 and WRKY33 transcription factors in abiotic stresses. Plant Mol. Biol. 2009, 69, 91–105. [Google Scholar] [CrossRef]
- Cui, M.H.; Yoo, K.S.; Hyoung, S.; Nguyen, H.T.K.; Kim, Y.Y.; Kim, H.J.; Ok, S.H.; Yoo, S.D.; Shin, J.S. An Arabidopsis R2R3-MYB transcription factor, AtMYB20, negatively regulates type 2C serine/threonine protein phosphatases to enhance salt tolerance. FEBS Lett. 2013, 587, 1773–1778. [Google Scholar] [CrossRef]
- Jiang, Y.; Yang, B.; Deyholos, M.K. Functional characterization of the Arabidopsis bHLH92 transcription factor in abiotic stress. Mol. Genet. Genom. 2009, 282, 503–516. [Google Scholar] [CrossRef]
- Yang, O.; Popova, O.V.; Süthoff, U.; Lüking, I.; Dietz, K.J.; Golldack, D. The Arabidopsis basic leucine zipper transcription factor AtbZIP24 regulates complex transcriptional networks involved in abiotic stress resistance. Gene 2009, 436, 45–55. [Google Scholar] [CrossRef]
- Tran, L.S.; Nakashima, K.; Sakuma, Y.; Simpson, S.D.; Fujita, Y.; Maruyama, K.; Fujita, M.; Seki, M.; Shinozaki, K.; Yamaguchi-Shinozaki, K. Isolation and functional analysis of Arabidopsis stress-inducible NAC transcription factors that bind to a drought-responsive cis-element in the early responsive to dehydration stress 1 promoter. Plant Cell 2004, 16, 2481–2498. [Google Scholar] [CrossRef]
- Deinlein, U.; Stephan, A.B.; Horie, T.; Luo, W.; Xu, G.; Schroeder, J.I. Plant salt-tolerance mechanisms. Trends Plant Sci. 2014, 19, 371–379. [Google Scholar] [CrossRef]
- Eulgem, T.; Rushton, P.J.; Robatzek, S.; Somssich, I.E. The WRKY superfamily of plant transcription factors. Trends Plant Sci. 2000, 5, 199–206. [Google Scholar] [CrossRef]
- Park, C.Y.; Lee, J.H.; Yoo, J.H.; Moon, B.C.; Choi, M.S.; Kang, Y.H.; Lee, S.M.; Kim, H.S.; Kang, K.Y.; Chung, W.S.; et al. WRKY group II-d transcription factors interact with calmodulin. FEBS Lett. 2005, 28, 1545–1550. [Google Scholar] [CrossRef]
- Li, W.; Pang, S.; Lu, Z.; Jin, B. Function and mechanism of WRKY transcription factors in abiotic stress responses of plants. Plants 2020, 9, 1515. [Google Scholar] [CrossRef]
- Zhou, Q.Y.; Tian, A.G.; Zou, H.F.; Xie, Z.M.; Lei, G.; Huang, J.; Wang, C.M.; Wang, H.W.; Zhang, J.S.; Chen, S.Y. Soybean WRKY-type transcription factor genes, GmWRKY13, GmWRKY21, and GmWRKY54 confer differential tolerance to abiotic stresses in transgenic Arabidopsis plants. Plant Biotechnol. J. 2008, 6, 486–503. [Google Scholar] [CrossRef]
- Yan, H.; Jia, H.; Chen, X.; Hao, L.; An, H.; Guo, X. The cotton WRKY transcription factor GhWRKY17 functions in drought and salt stress in transgenic Nicotiana benthamiana through ABA signaling and the modulation of reactive oxygen species Production. Plant Cell Physiol. 2014, 55, 2060–2076. [Google Scholar] [CrossRef]
- Zhu, H.; Jiang, Y.; Guo, Y.; Huang, J.; Qiao, L. A novel salt inducible WRKY transcription factor gene, AhWRKY75, confers salt tolerance in transgenic peanut. Plant Physiol. Biochem. 2021, 160, 175–183. [Google Scholar] [CrossRef]
- Zhu, H.; Zhou, Y.; Zhai, H.; He, S.; Liu, Q. A novel sweetpotato WRKY transcription factor, IbWRKY2, positively regulates drought and salt tolerance in transgenic Arabidopsis. Biomolecules 2020, 10, 506. [Google Scholar] [CrossRef]
- Zhou, S.; Zheng, W.J.; Liu, B.H.; Zheng, J.C.; Dong, F.S.; Liu, Z.F.; Wen, Z.Y.; Yang, F.; Wang, H.B.; Xu, Z.S.; et al. Characterizing the role of TaWRKY13 in salt tolerance. Int. J. Mol. Sci. 2019, 20, 5712. [Google Scholar] [CrossRef]
- Murrell, C.; Gerber, E.; Krebs, C.; Parepa, M.; Schaffner, U.; Bossdorf, O. Invasive knotweed affects native plants through allelopathy. Am. J. Bot. 2011, 98, 38–43. [Google Scholar] [CrossRef]
- Dommanget, F.; Cavaillé, P.; Evette, A.; Martin, F. Asian knotweeds-An example of a raising threat. In Introduced Tree Species in European Forests: Opportunities and Challenges; European Forest Institute: Joensuu, Finland, 2016; pp. 202–211. [Google Scholar]
- Ayres, D.R.; Garcia-Rossi, D.; Davis, H.G.; Strong, D.R. Extent and degree of hybridization between exotic (Spartina alterniflora) and native (S. foliosa) cordgrass (Poaceae) in California, USA determined by random amplified polymorphic DNA (RAPDs). Mol. Ecol. 1999, 8, 1179–1186. [Google Scholar] [CrossRef]
- Daehler, C.C.; Strong, D.R. Status, prediction and prevention of introduced cordgrass Spartina spp. invasions in Pacific estuaries, USA. Biol. Conserv. 1996, 78, 51–55. [Google Scholar] [CrossRef]
- Miklovic, S.; Galatowitsch, S.M. Effect of NaCl and Typha angustifolia L. on marsh community establishment: A green-house study. Wetlands 2005, 25, 420–429. [Google Scholar] [CrossRef][Green Version]
- Vasquez, E.A.; Glenn, E.P.; Brown, J.J. Salt tolerance underlies the cryptic invasion of North American salt marshes by an introduced haplotype of the common reed Phragmites australis (Poaceae). Mar. Ecol. Prog. Ser. 2005, 298, 1–8. [Google Scholar] [CrossRef]
- Wang, Q.; Wang, C.H.; Zhao, B.; Ma, Z.J.; Luo, Y.Q.; Chen, J.K.; Li, B. Effects of growing conditions on the growth of and interactions between salt marsh plants: Implications for invasibility of habitats. Biol. Invasions 2006, 8, 1547–1560. [Google Scholar] [CrossRef]
- Rouifed, S.; Byczek, C.; Laffray, D. Invasive knotweeds are highly tolerant to salt stress. Environ. Manag. 2012, 50, 1027–1034. [Google Scholar] [CrossRef]
- Bao, W.; Wang, X.; Chen, M.; Chai, T.; Wang, H. A WRKY transcription factor, PcWRKY33, from Polygonum cuspidatum reduces salt tolerance in transgenic Arabidopsis thaliana. Plant Cell Rep. 2018, 37, 1033–1048. [Google Scholar] [CrossRef]
- Hu, H.; Wang, X.; Wu, Z.; Chen, M.; Chai, T.; Wang, H. Overexpression of the Polygonum cuspidatum PcDREB2A gene encoding a DRE-Binding transcription factor enhances the drought tolerance of transgenic Arabidopsis thaliana. J. Plant Biol. 2021, 1–11. [Google Scholar] [CrossRef]
- Rushton, P.J.; Torres, J.T.; Parniske, M.; Wernert, P.; Hahlbrock, K.; Somssich, I.E. Interaction of elicitor-induced DNA-binding proteins with elicitor response elements in the promoters of parsley PR1 genes. EMBO J. 1996, 15, 5690–5700. [Google Scholar] [CrossRef]
- Clements, D.R.; Ditommaso, A. Predicting weed invasion in Canada under climate change: Evaluating evolutionary potential. Can. J. Plant Sci. 2012, 92, 1013–1020. [Google Scholar] [CrossRef]
- Michalet, S.; Rouifed, S.; Pellassa-Simon, T.; Fusade-Boyer, M.; Meiffren, G.; Nazaret, S.; Piola, F. Tolerance of Japanese knotweed s.l. to soil artificial polymetallic pollution: Early metabolic responses and performance during vegetative multiplication. Environ. Sci. Pollut. Res. 2017, 24, 20897–20907. [Google Scholar] [CrossRef]
- Yue, X.; Shi, P.; Tang, Y.; Zhang, H.; Ma, X.; Ju, Y.; Zhang, Z. Effects of methyl jasmonate on the monoterpenes of Muscat Hamburg grapes and wine. J. Sci. Food Agric. 2020, 101, 3665–3675. [Google Scholar] [CrossRef]
- Ahmad, B.; Raina, A.; Naikoo, M.I.; Khan, S. Role of methyl jasmonates in salt stress tolerance in crop plants. Plant Signal. Mol. 2019, 24, 371–384. [Google Scholar]
- Knight, H.; Trewavas, A.J.; Knight, M.R. Calcium signalling in Arabidopsis thaliana responding to drought and salinity. Plant J. 1997, 12, 1067–1078. [Google Scholar] [CrossRef]
- Wu, T.Y.; Goh, H.; Azodi, C.B.; Krishnamoorthi, S.; Liu, M.J.; Urano, D. Evolutionarily conserved hierarchical gene regulatory networks for plant salt stress response. Nat. Plants 2021, 7, 787–799. [Google Scholar] [CrossRef]
- Ali, M.A.; Azeem, F.; Nawaz, M.A.; Acet, T.; Abbas, A.; Imran, Q.M.; Shah, K.H.; Rehman, H.M.; Chung, G.; Yang, S.H.; et al. Transcription factors WRKY11 and WRKY17 are involved in abiotic stress responses in Arabidopsis. J. Plant Physiol. 2018, 226, 12–21. [Google Scholar] [CrossRef]
- Lee, H.; Cha, J.; Choi, C.; Choi, N.; Ji, H.S.; Park, S.R.; Lee, S.; Hwang, D.J. Rice WRKY11 plays a role in pathogen defense and drought tolerance. Rice 2018, 11, 5. [Google Scholar] [CrossRef]
- Wang, Y.; Jiang, L.; Chen, J.; Tao, L.; An, Y.; Cai, H.; Guo, C. Overexpression of the alfalfa WRKY11 gene enhances salt tolerance in soybean. PLoS ONE 2018, 13, e0192382. [Google Scholar] [CrossRef]
- Wang, X.; Ajab, Z.; Liu, C.; Hu, S.; Liu, J.; Guan, Q. Overexpression of transcription factor SlWRKY28 improved the tolerance of Populus davidiana × P. bolleana to alkaline salt stress. BMC Genet. 2020, 21, 103. [Google Scholar] [CrossRef]
- Yan, J.; Li, J.; Zhang, H.; Liu, Y.; Zhang, A. ZmWRKY104 positively regulates salt tolerance by modulating ZmSOD4 expression in maize. Crop J. 2021, 10, 555–564. [Google Scholar] [CrossRef]
- Mittler, R. Oxidative stress, antioxidants and stress tolerance. Trends Plant Sci. 2002, 7, 405–410. [Google Scholar] [CrossRef]
- Meena, M.; Divyanshu, K.; Kumar, S.; Swapnil, P.; Zehra, A.; Shukla, V.; Yadav, M.; Upadhyay, R.S. Regulation of L-proline biosynthesis, signal transduction, transport, accumulation and its vital role in plants during variable environmental conditions. Heliyon 2019, 5, e02952. [Google Scholar] [CrossRef]
- Li, H.Y.; Li, D.H. Expression of AtP5CS1 gene enhanced drought tolerance of transgenic brassica oleracea plants. Plant Physiol. 2014, 50, 1009–1013. [Google Scholar]
- Sudhir, K.; Glen, S.; Koichiro, T. MEGA7: Molecular evolutionary genetics analysis version 7.0 for bigger datasets. Mol. Biol. Evol. 2016, 33, 1870–1874. [Google Scholar]
- Crooks, G.E. WebLogo: A sequence logo generator. Genome Res. 2004, 14, 1188–1190. [Google Scholar] [CrossRef] [PubMed]
- Szklarczyk, D.; Gable, A.L.; Nastou, K.C.; Lyon, D.; Kirsch, R.; Pyysalo, S.; Doncheva, N.T.; Legeay, M.; Fang, T.; Bork, P.; et al. The STRING database in 2021: Customizable protein-protein networks, and functional characterization of user-uploaded gene/measurement sets. Nucleic Acids Res. 2021, 49, D605–D612. [Google Scholar] [CrossRef] [PubMed]
- Clough, S.J.; Bent, A.F. Floral dip: A simplified method for Agrobacterium-mediated transformation of Arabidopsis thaliana. Plant J. 2010, 16, 735–743. [Google Scholar] [CrossRef] [PubMed]
- Julkowska, M.M.; Klei, K.; Fokkens, L.; Haring, M.A.; Schranz, M.E.; Testerink, C. Natural variation in rosette size under salt stress conditions corresponds to developmental differences between Arabidopsis accessions and allelic variation in the LRR-KISS gene. J. Exp. Bot. 2016, 67, 2127–2138. [Google Scholar] [CrossRef]
- Wang, X.; Wu, Z.; Bao, W.; Hu, H.; Chen, M.; Chai, T.; Wang, H. Identification and evaluation of reference genes for quantitative real-time PCR analysis in Polygonum cuspidatum based on transcriptome data. BMC Plant Biol. 2019, 19, 498. [Google Scholar] [CrossRef]
- Zhu, F.Y.; Chen, M.X.; Chan, W.L.; Yang, F.; Tian, Y.; Song, T.; Xie, L.J.; Zhou, Y.; Xiao, S.; Zhang, J.; et al. SWATH-MS quantitative proteomic investigation of nitrogen starvation in Arabidopsis reveals new aspects of plant nitrogen stress responses. J. Proteom. 2018, 187, 161–170. [Google Scholar] [CrossRef]
- Li, H.; Wang, L.; Luo, Y. Composition analysis by UPLC-PDA-ESI(-)-HRMS and antioxidant activity using Saccharomyces cerevisiae model of herbal teas and green teas from Hainan. Molecules 2018, 23, 2550. [Google Scholar] [CrossRef]
- Qiao, K.; Liang, S.; Wang, F.; Wang, H.; Hu, Z.; Chai, T. Effects of cadmium toxicity on diploid wheat (Triticum urartu) and the molecular mechanism of the cadmium response. J. Hazard. Mater. 2019, 374, 1–10. [Google Scholar] [CrossRef]
- Chen, F.Z.; Zhao, Y.; Chen, H.Z. MicroRNA-98 reduces amyloid β-protein production and improves oxidative stress and mitochondrial dysfunction through the Notch signaling pathway via HEY2 in Alzheimer’s disease mice. Int. J. Mol. Med. 2019, 43, 91–102. [Google Scholar] [CrossRef]
- Li, B.; Ding, Y.; Tang, X.; Wang, G.; Wu, S.; Li, X.; Huang, X.; Qu, T.; Chen, J.; Tang, X. Effect of L-arginine on maintaining storage quality of the white button mushroom (Agaricus bisporus). Food Bioprocess Technol. 2019, 12, 563–574. [Google Scholar] [CrossRef]
- Yin, Y.J.; Chen, C.J.; Guo, S.W.; Li, K.M.; Ma, Y.N.; Sun, W.M.; Xu, F.R.; Cheng, Y.X.; Dong, X. The fight against panax notoginseng root-rot disease using zingiberaceae essential oils as potential weapons. Front. Plant Sci. 2018, 9, 1346. [Google Scholar] [CrossRef]
- Wang, Q.; Xiao, G.; Chen, G.; Du, H.; Wang, L.; Guo, D.; Hu, T. Toxic effect of microcystin-LR on blood vessel development. Toxicol. Environ. Chem. 2019, 100, 737–752. [Google Scholar] [CrossRef]
- Liu, G.; Mei, H.; Chen, M.; Qin, S.; Li, K.; Zhang, W.; Chen, T. Protective effect of agmatine against hyperoxia-induced acute lung injury via regulating lncRNA gadd7. Biochem. Biophys. Res. Commun. 2019, 516, 68–74. [Google Scholar] [CrossRef]


Publisher’s Note: MDPI stays neutral with regard to jurisdictional claims in published maps and institutional affiliations. |
© 2022 by the authors. Licensee MDPI, Basel, Switzerland. This article is an open access article distributed under the terms and conditions of the Creative Commons Attribution (CC BY) license (https://creativecommons.org/licenses/by/4.0/).