
ERG and Behavioral CFF in Light-Damaged Albino Rats


Abstract
:1. Introduction
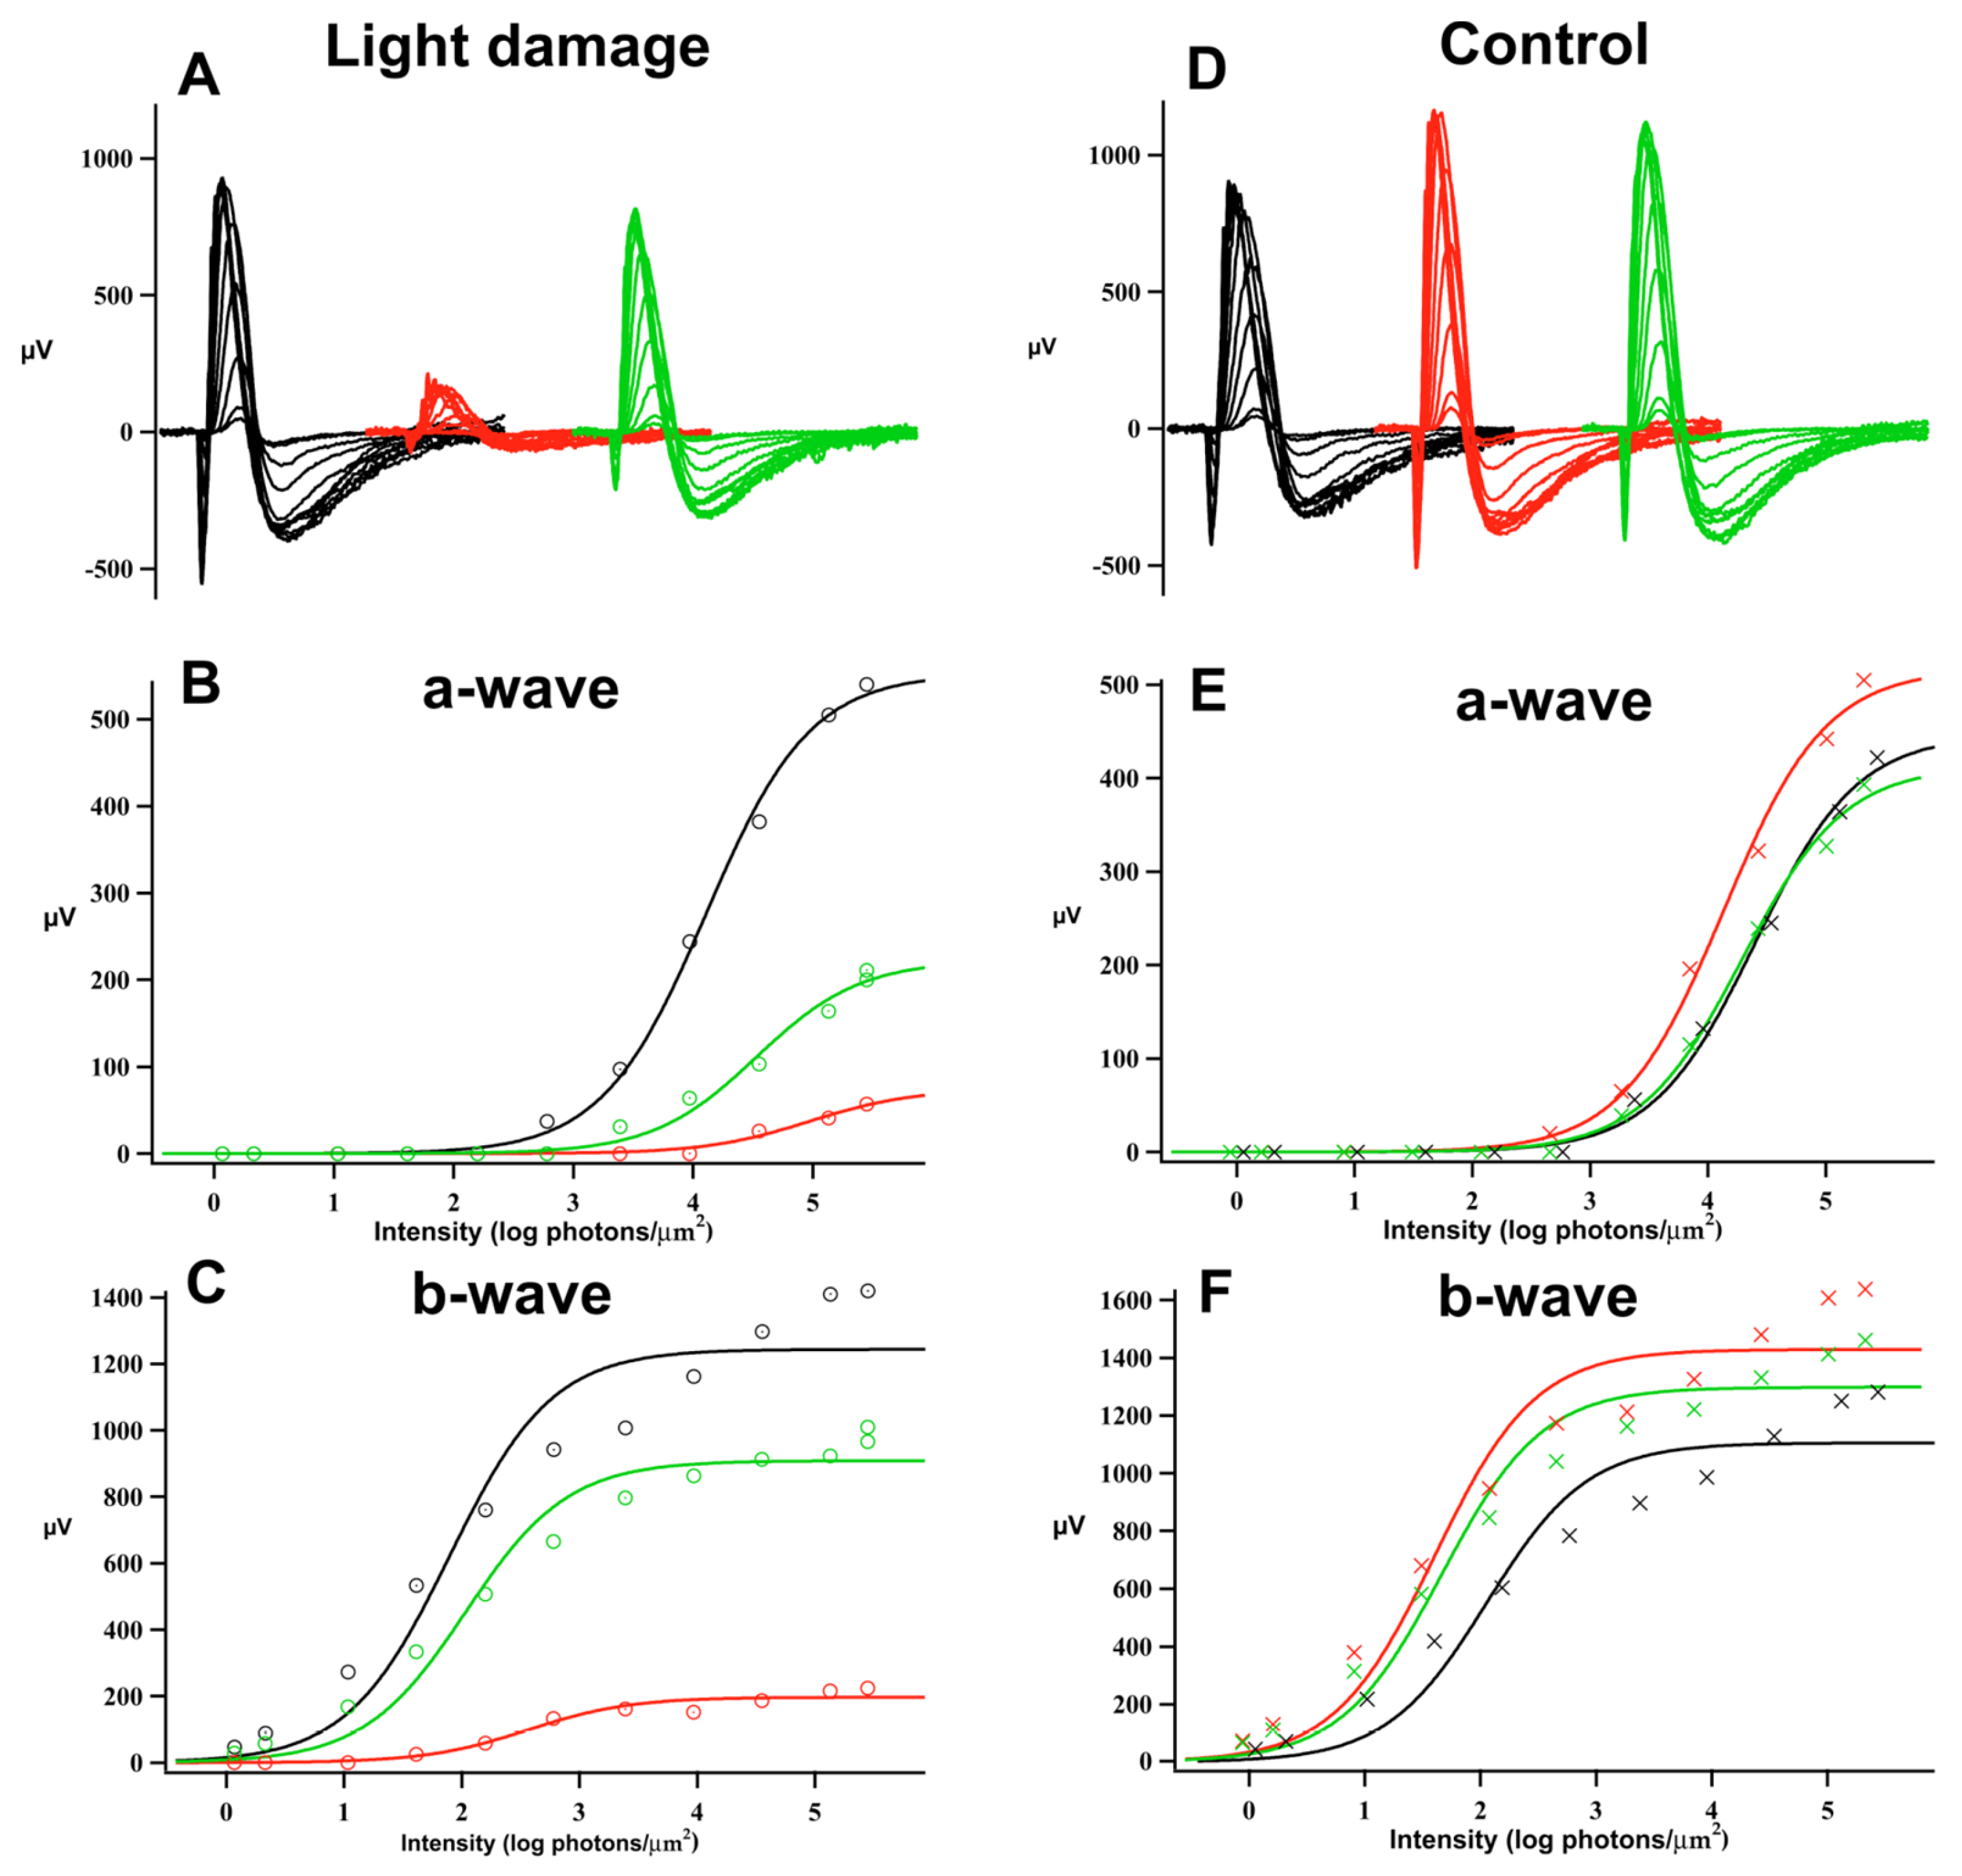
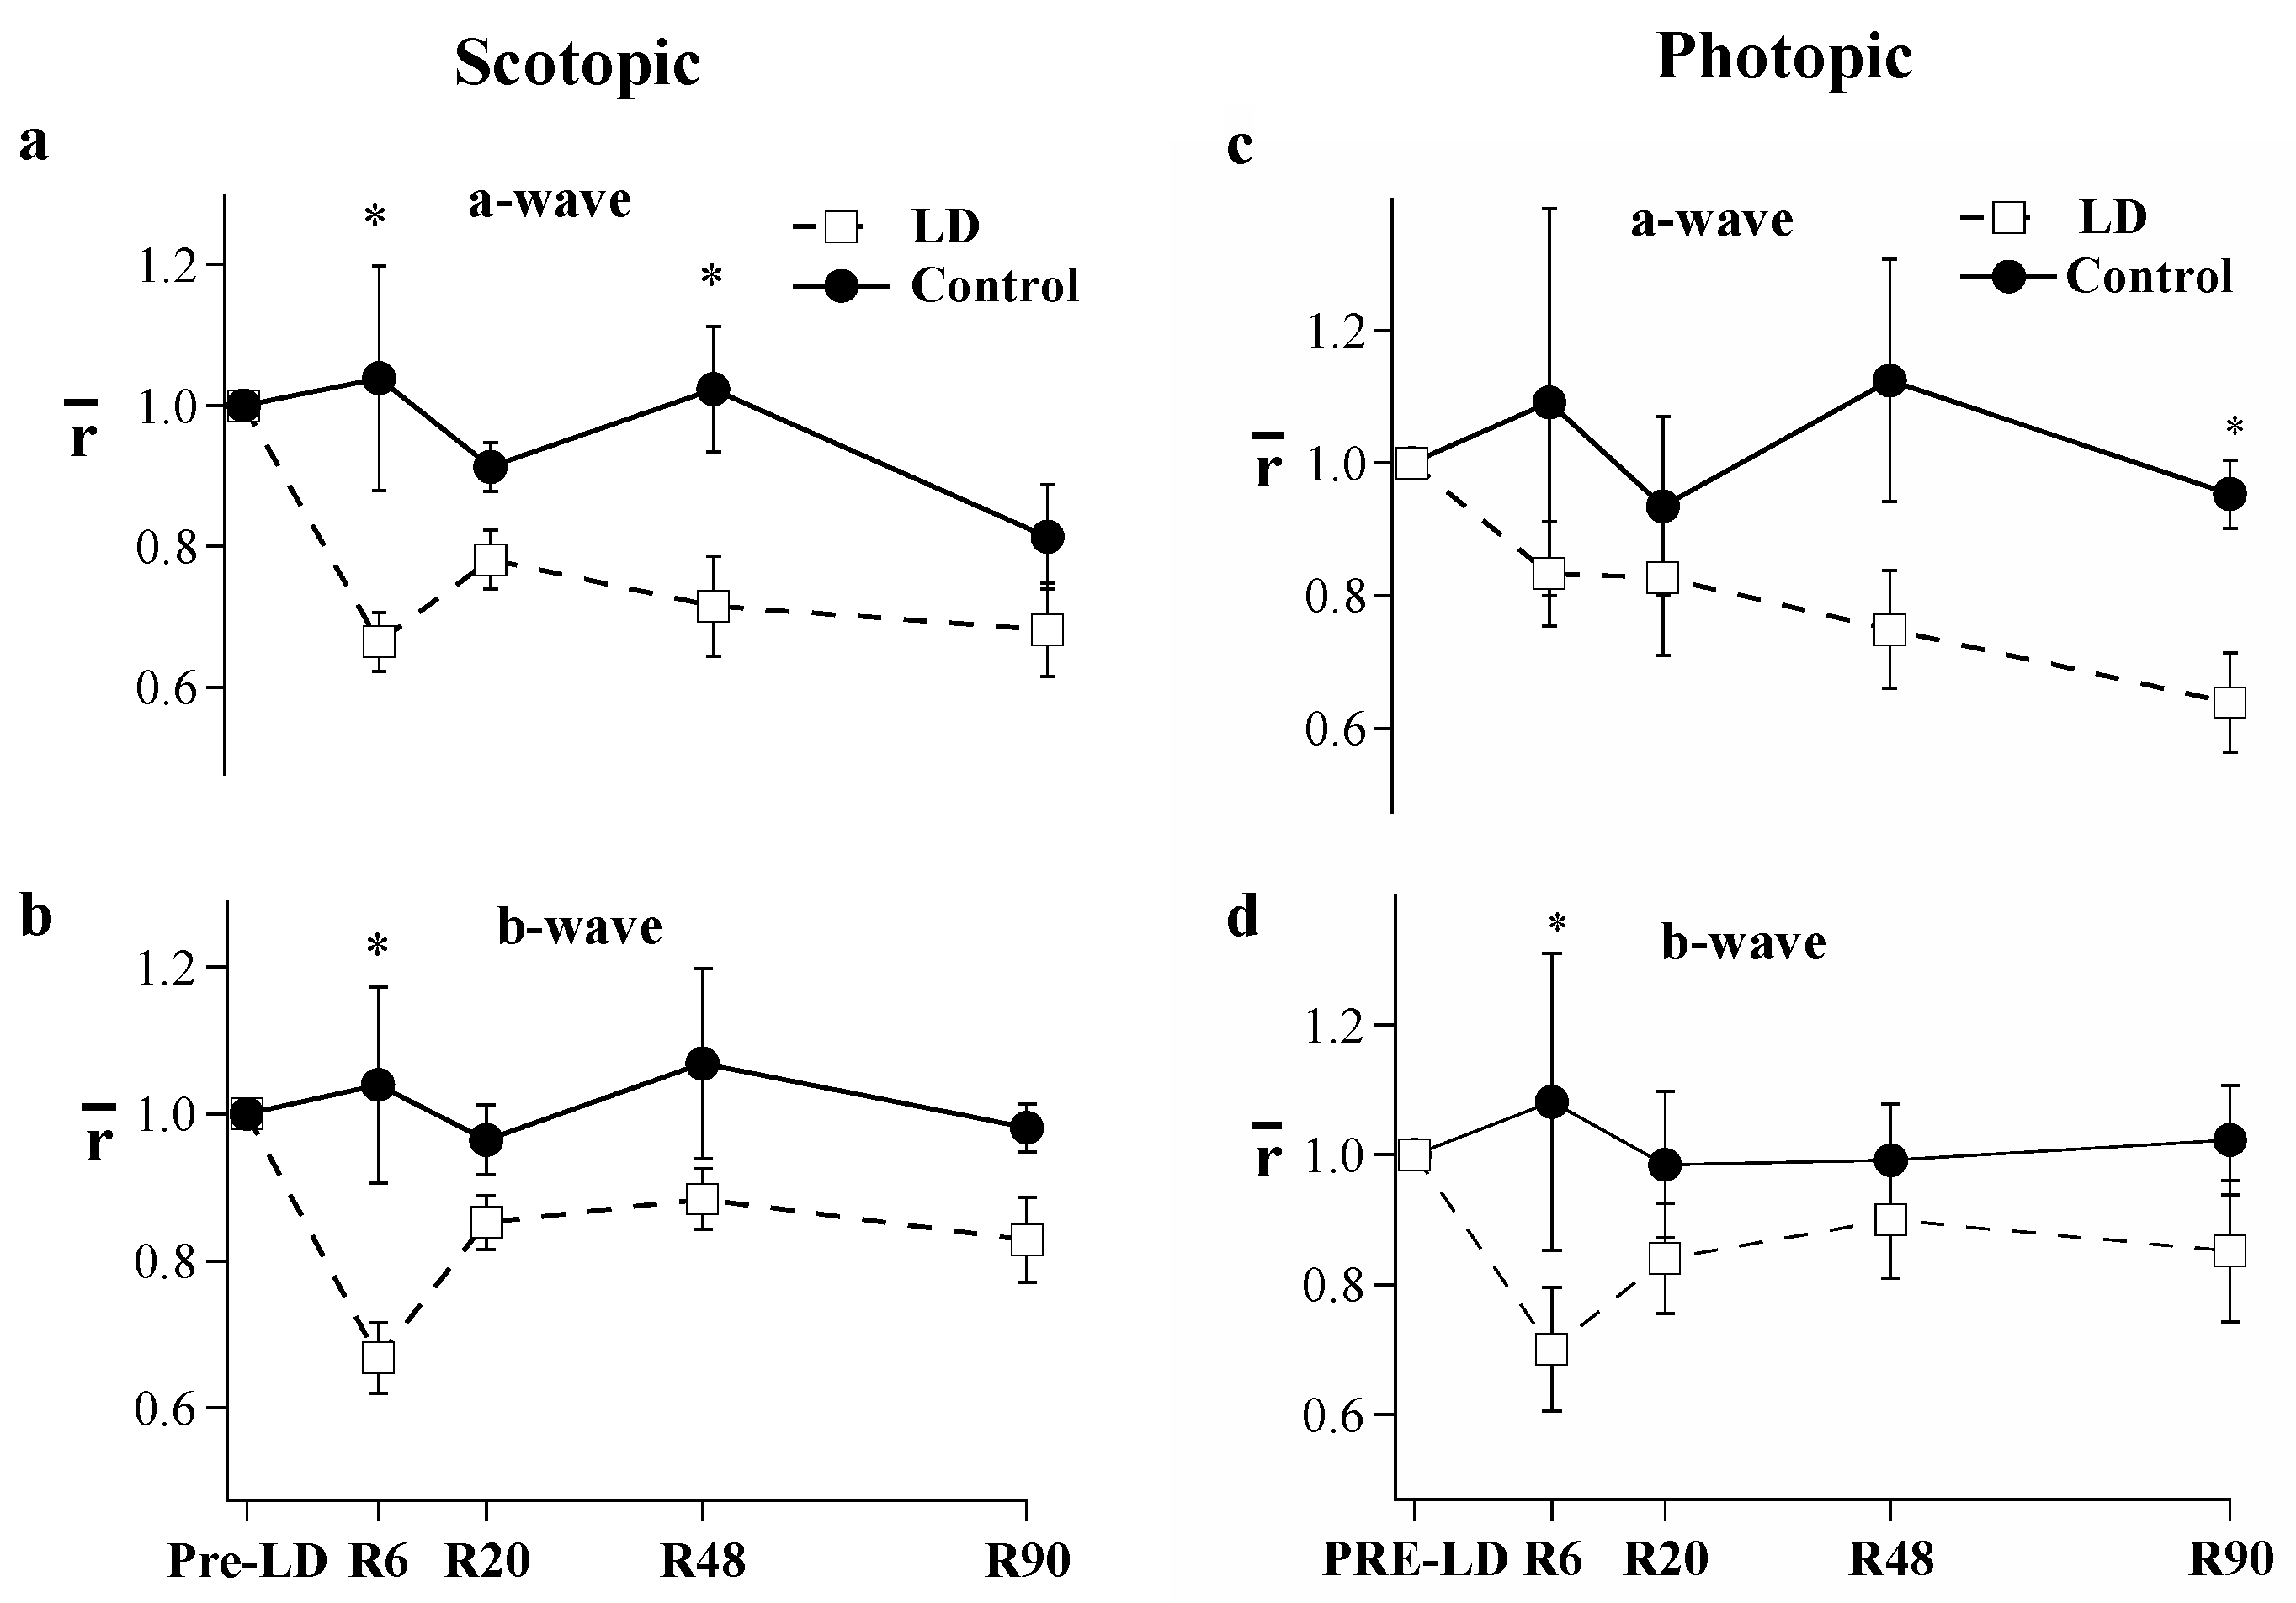
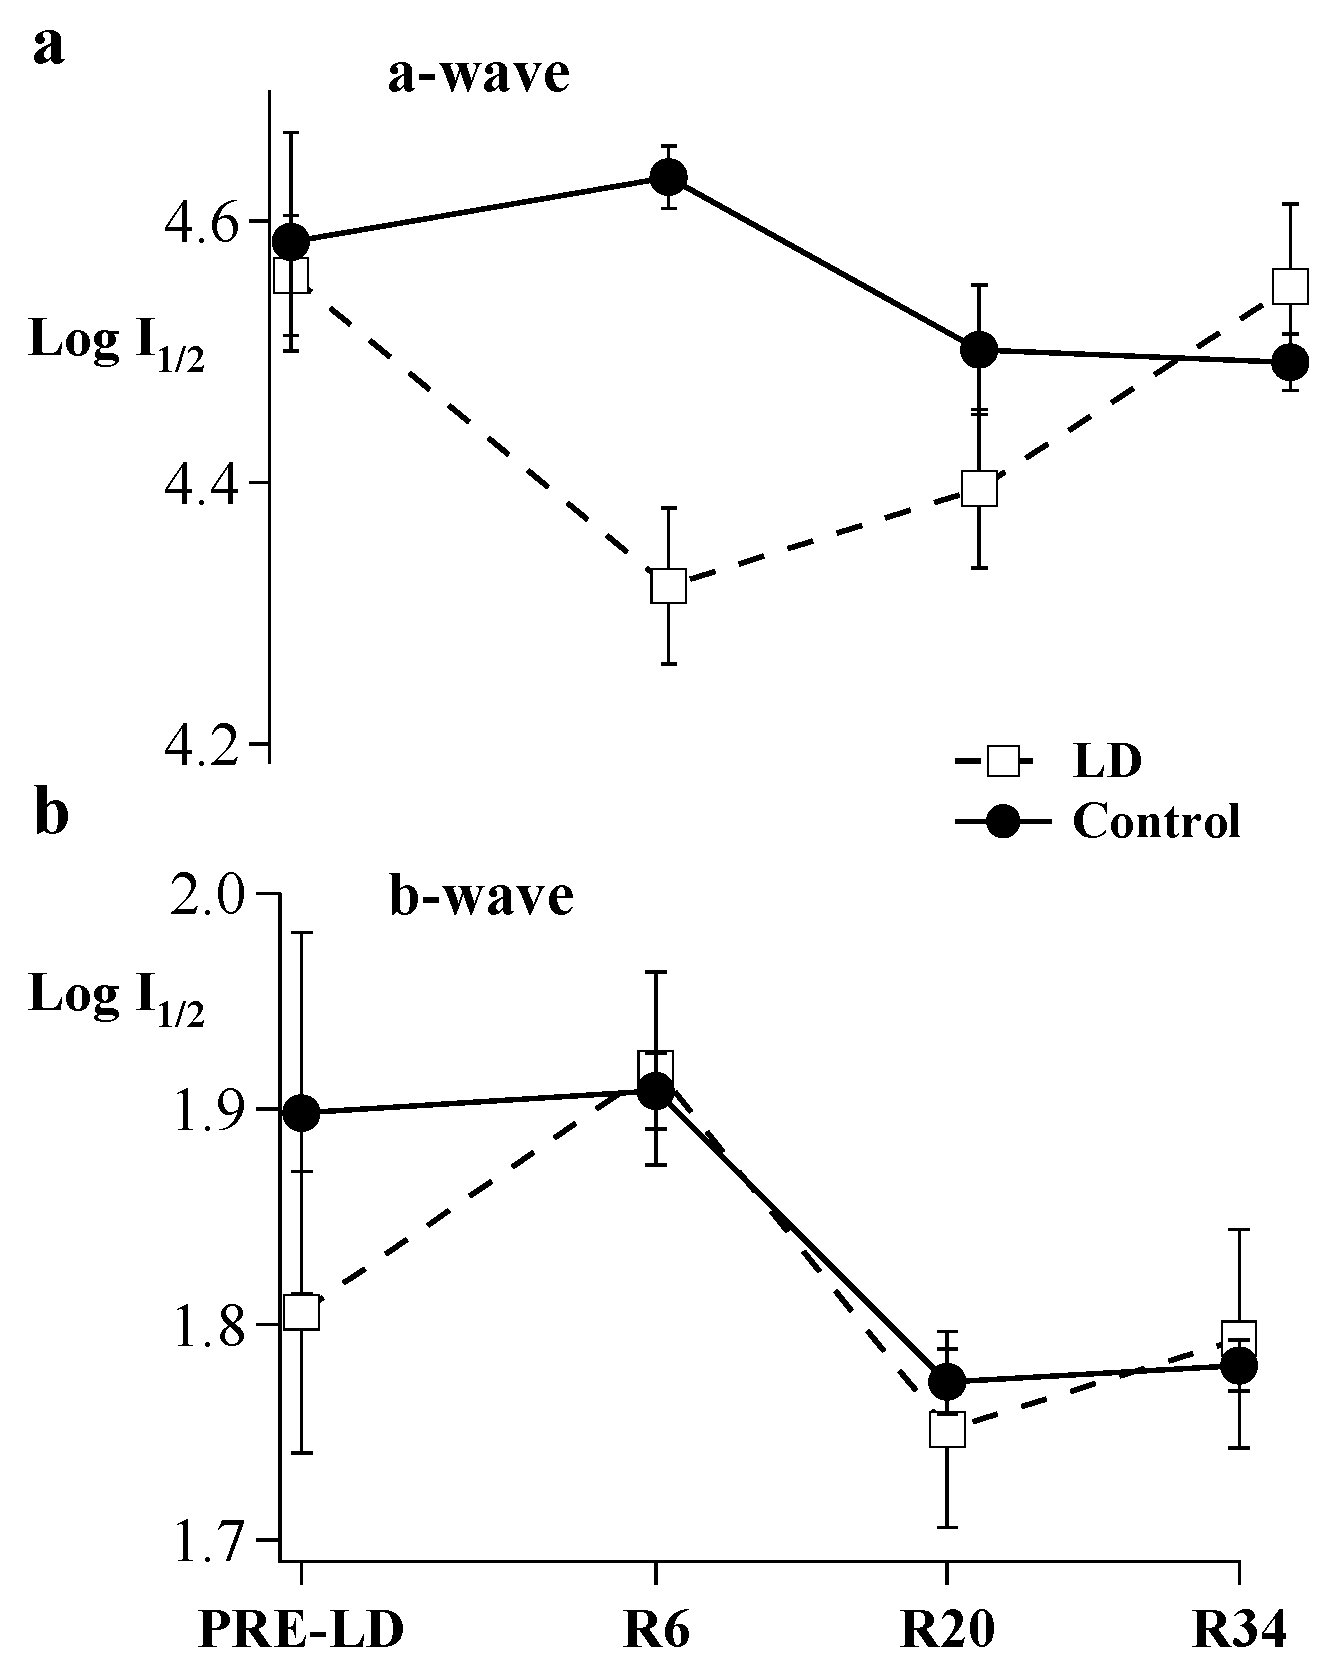
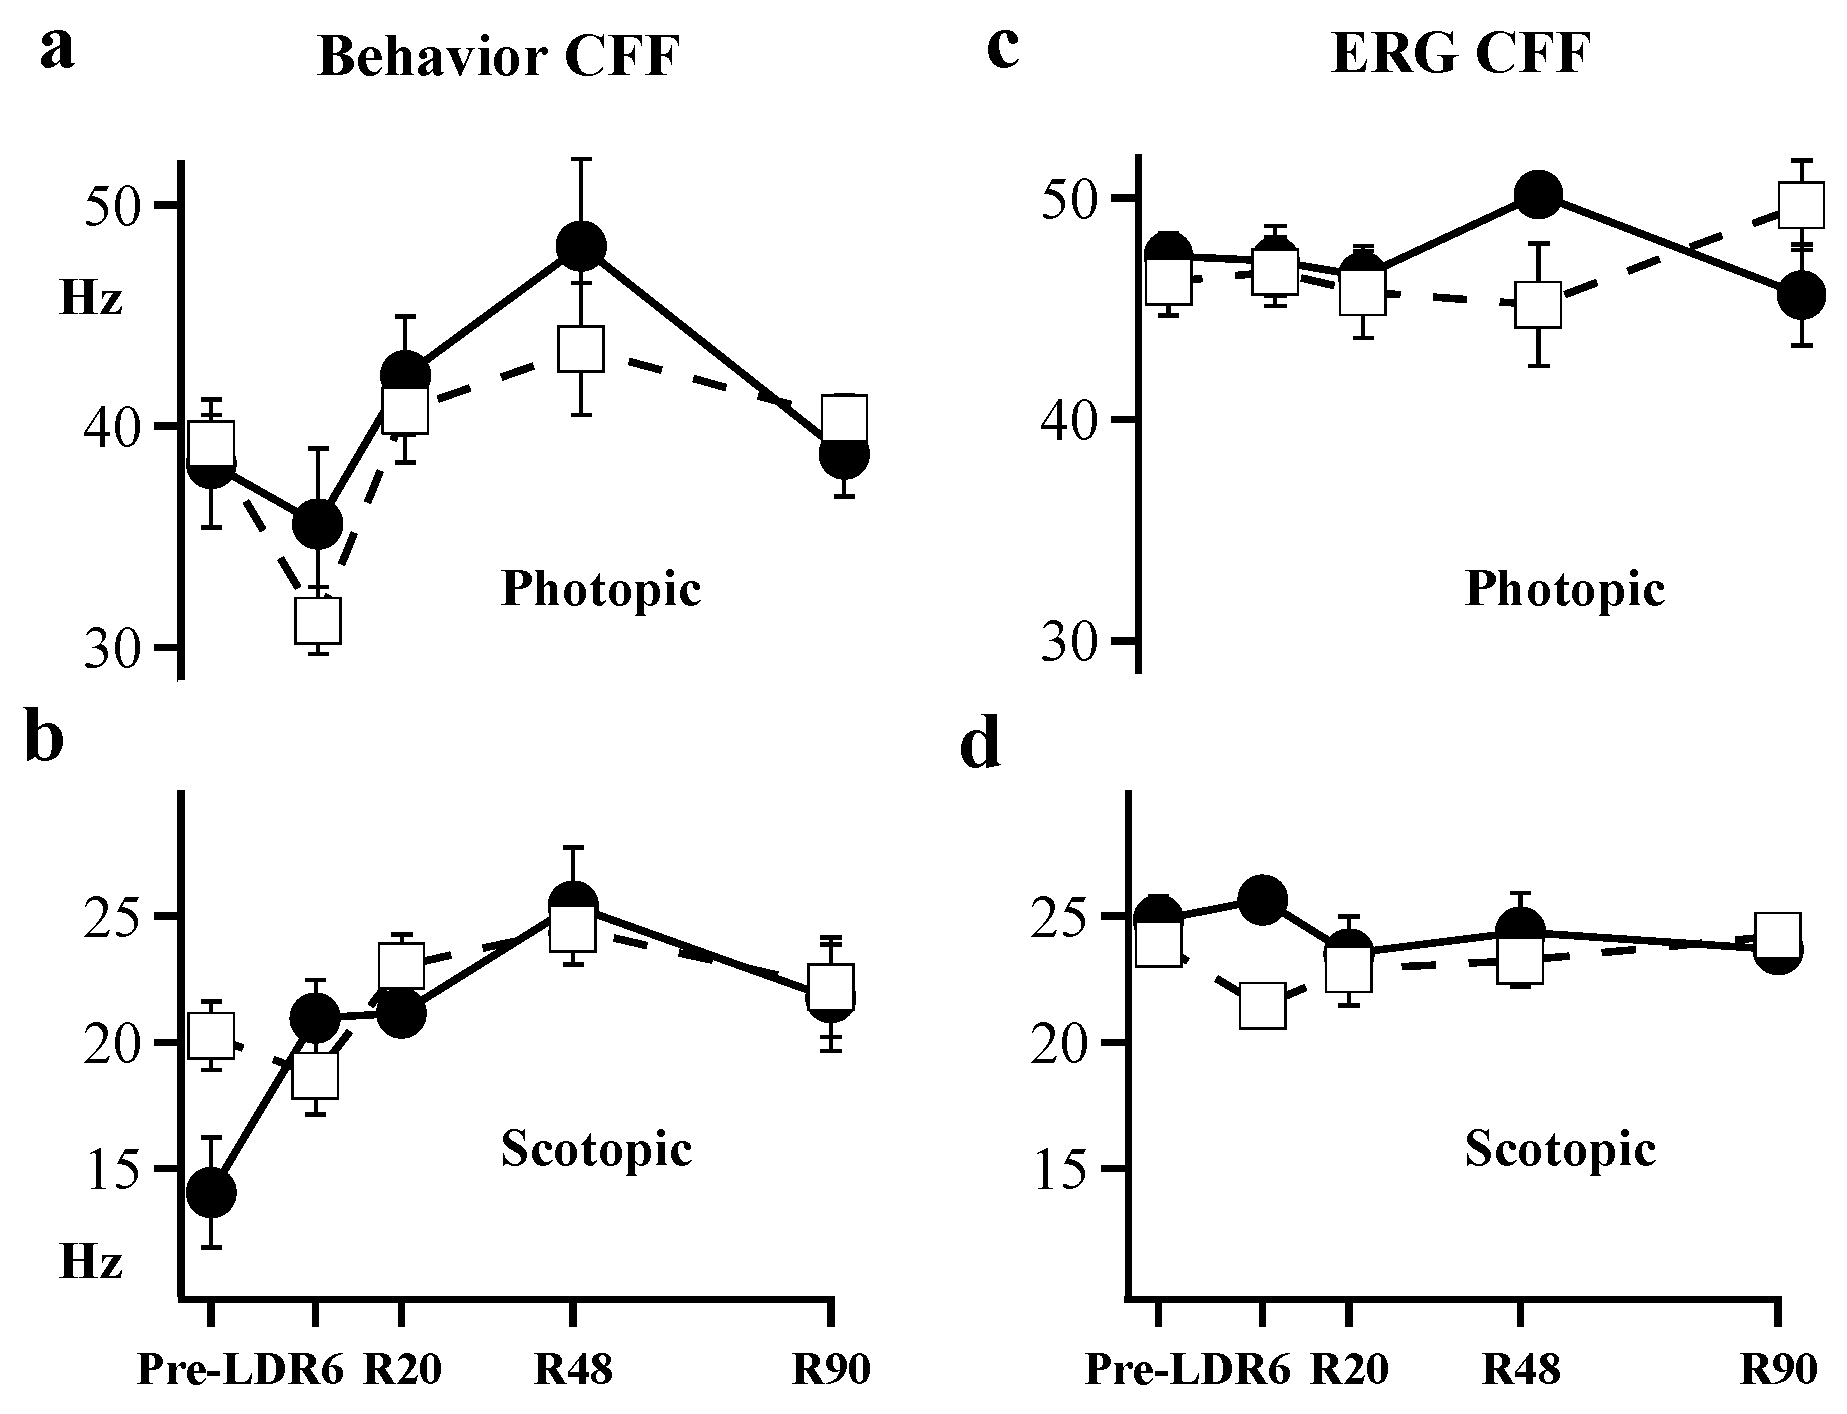
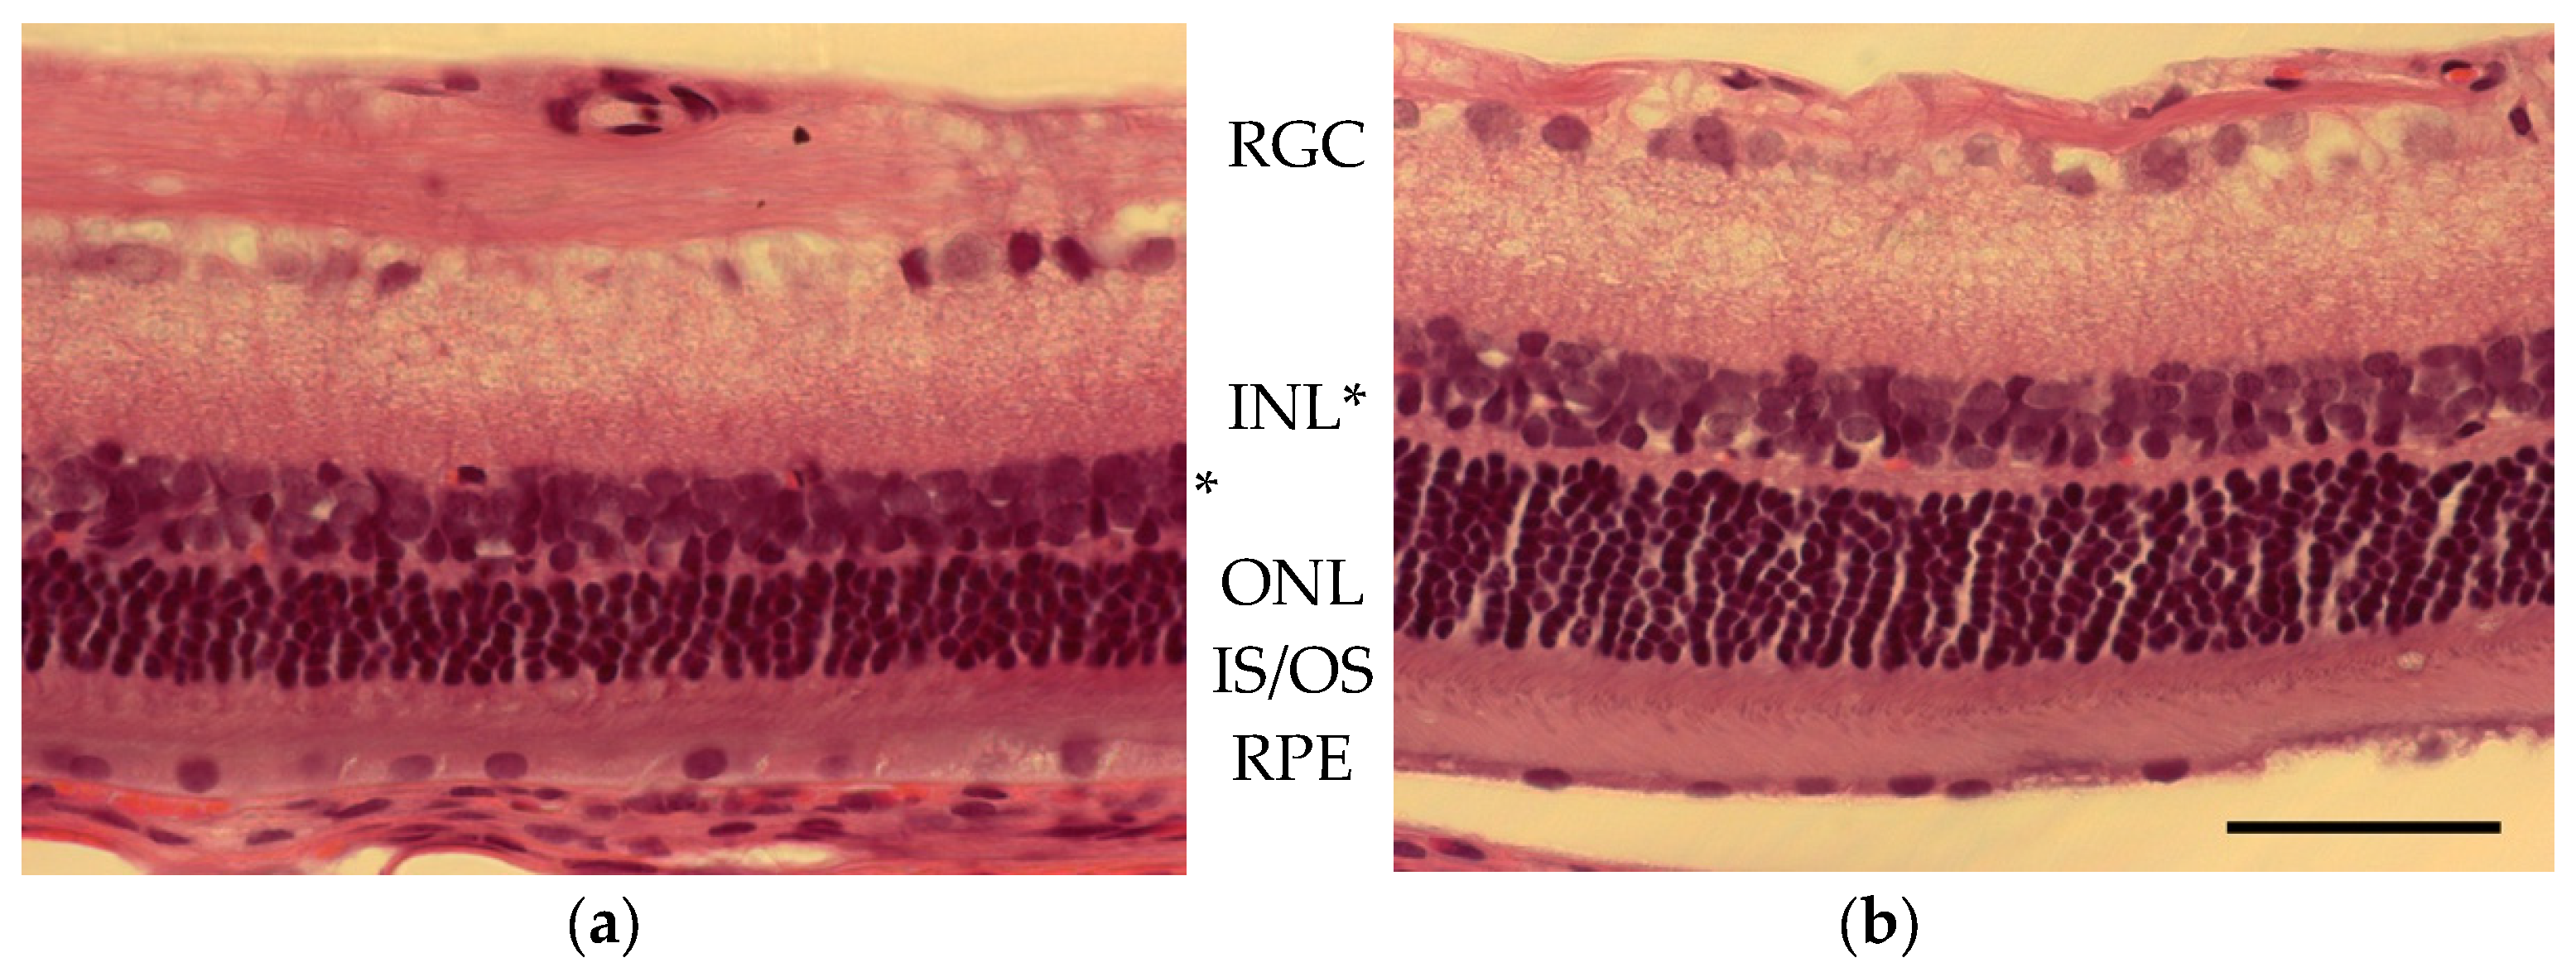
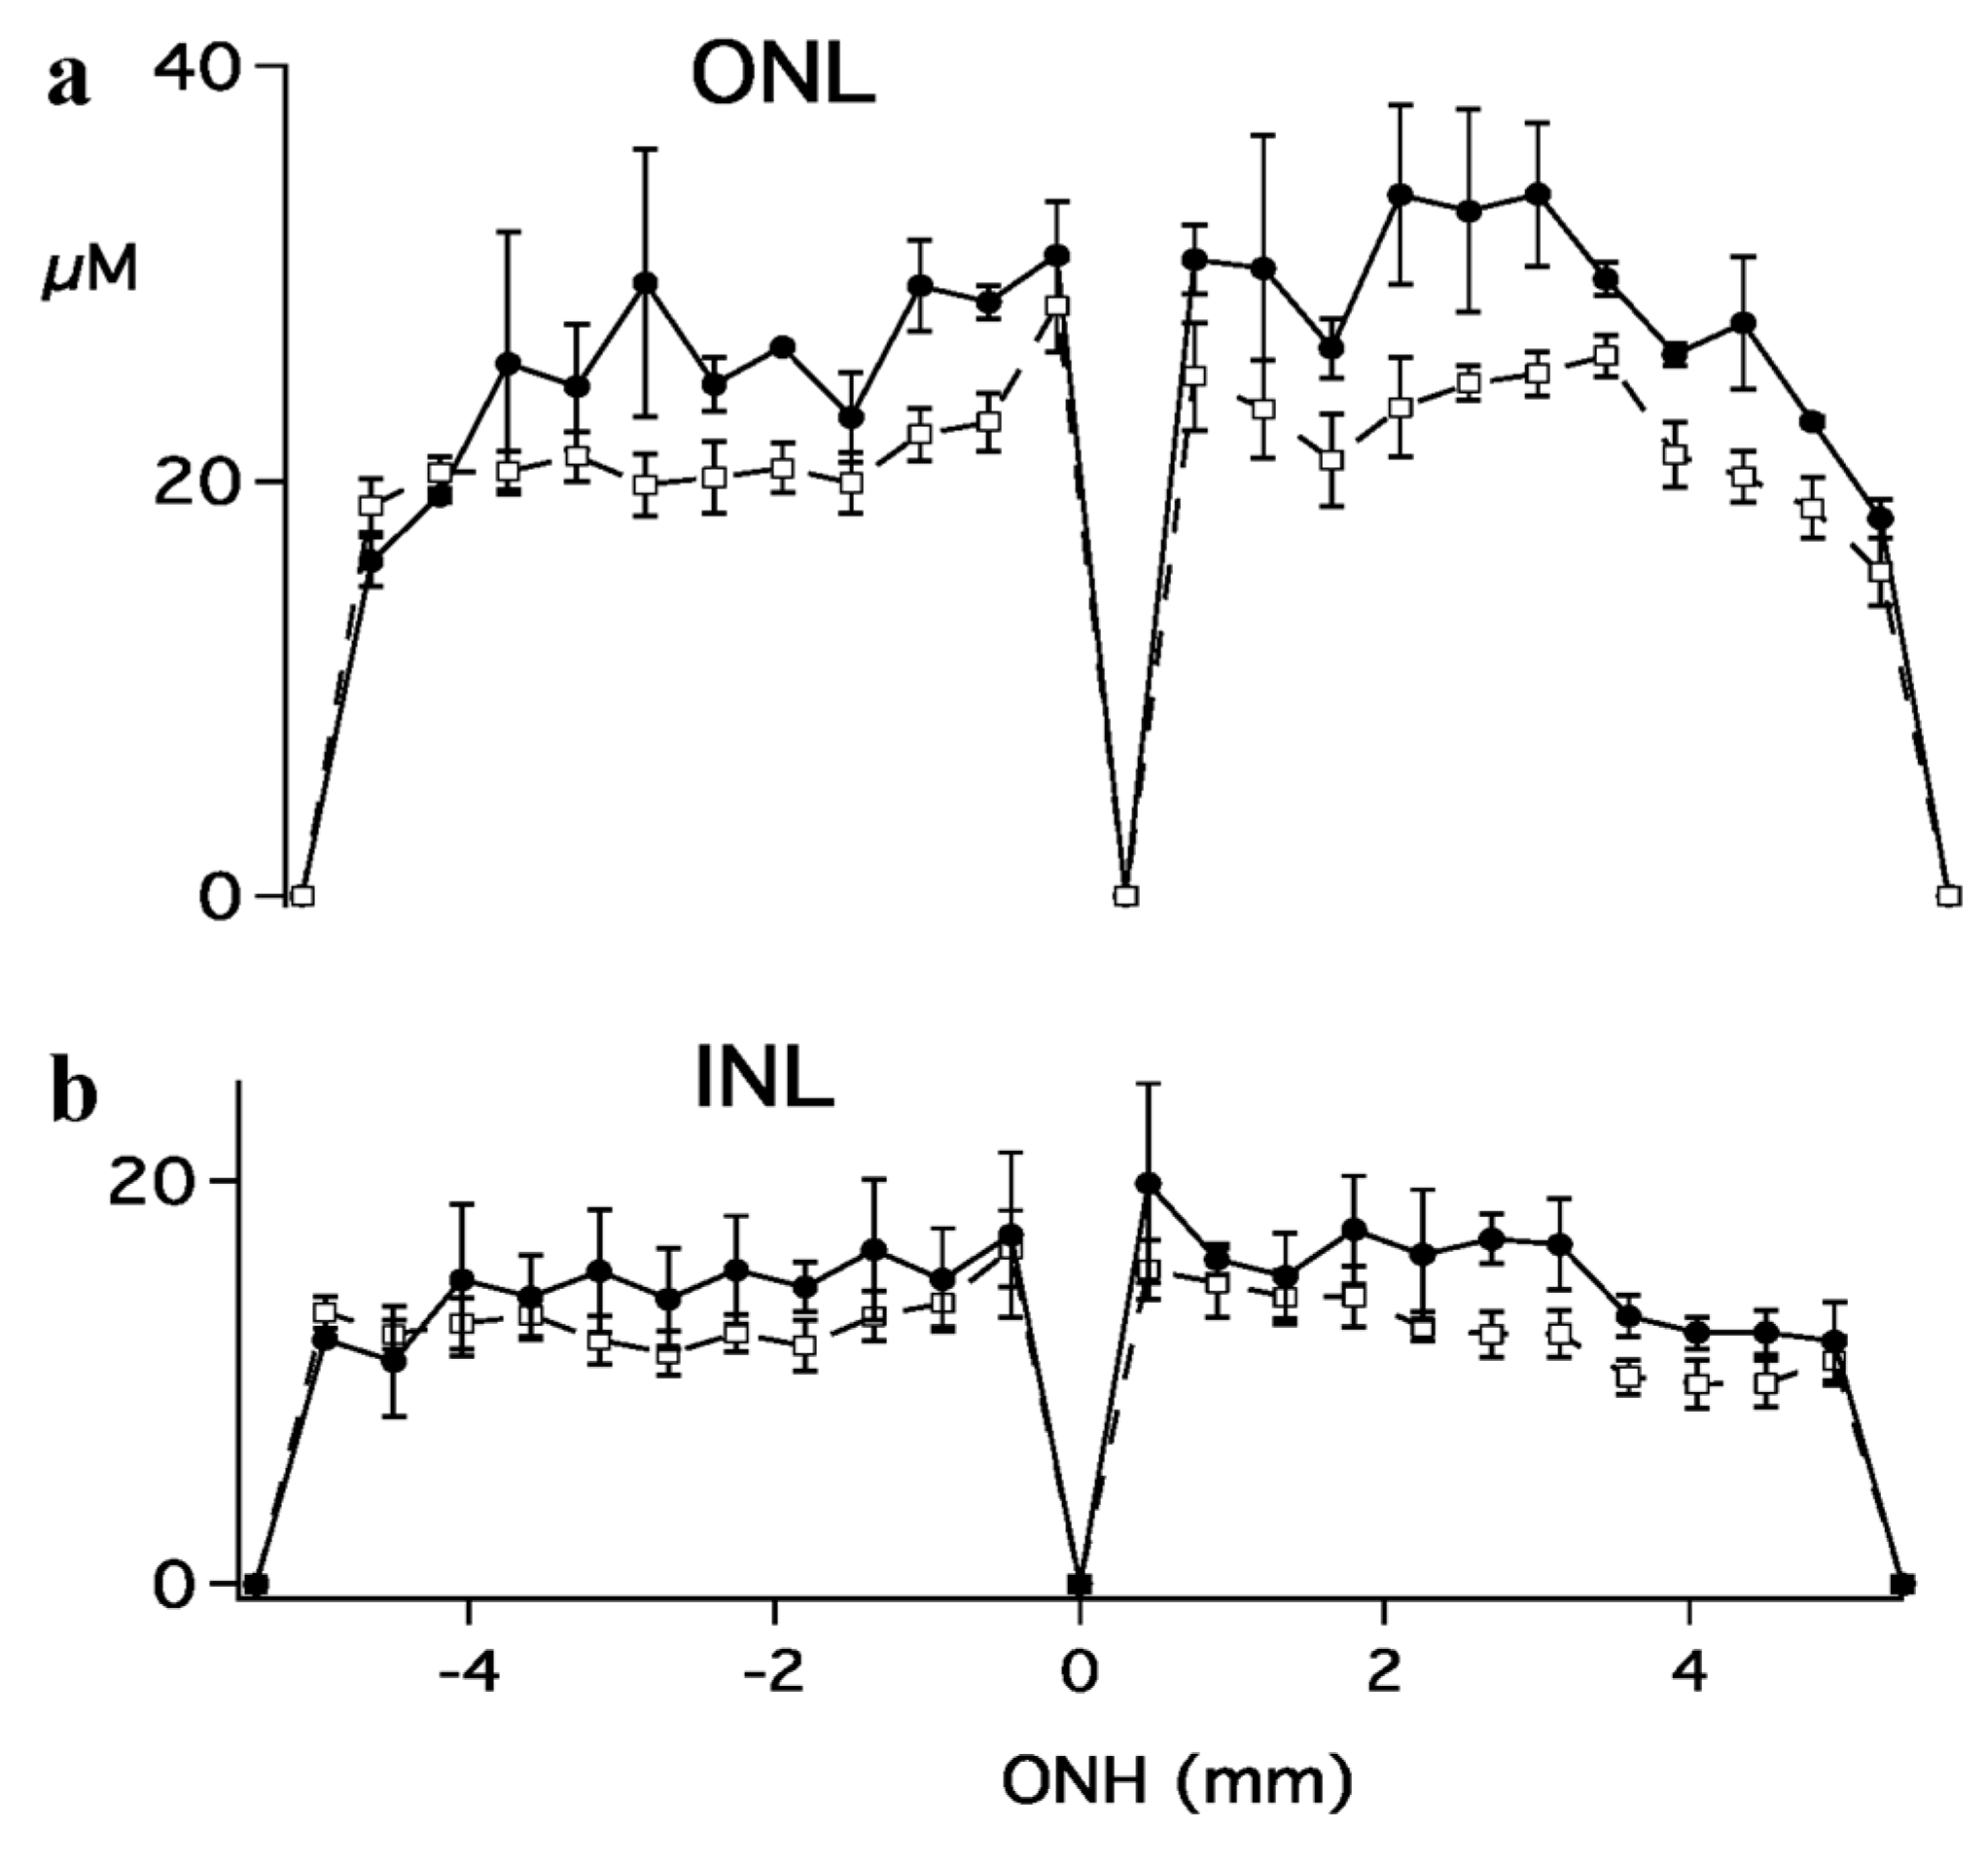
2. Results
3. Discussion
4. Materials and Methods
4.1. Animals
4.2. Electroretinography
4.3. Behavior
4.4. Light Damage
4.5. Histology
4.6. Statistical Analysis
Supplementary Materials
Author Contributions
Funding
Institutional Review Board Statement
Acknowledgments
Conflicts of Interest
References
- Fishman, G.A. Electrophysiologic Testing in Disorders of the Retina, Optic Nerve, and Visual Pathway; Foundation of the American Academy of Ophthalmology: San Francisco, CA, USA, 2001; 308p. [Google Scholar]
- Weymouth, A.E.; Vingrys, A.J. Rodent electroretinography: Methods for extraction and interpretation of rod and cone responses. Prog. Retin. Eye Res. 2008, 27, 1–44. [Google Scholar] [CrossRef] [PubMed]
- Delyfer, M.N.; Leveillard, T.; Mohand-Said, S.; Hicks, D.; Picaud, S.; Sahel, J.A. Inherited retinal degenerations: Therapeutic prospects. Biol. Cell 2004, 96, 261–269. [Google Scholar] [CrossRef] [PubMed]
- Hartong, D.T.; Berson, E.L.; Dryja, T.P. Retinitis pigmentosa. Lancet 2006, 368, 1795–1809. [Google Scholar] [PubMed]
- Birch, D.G.; Fish, G.E. Rod ERGs in retinitis pigmentosa and cone-rod degeneration. Investig. Ophthalmol. Vis. Sci. 1987, 28, 140–150. [Google Scholar]
- Humayun, M.S.; Weiland, J.D.; Fujii, G.Y.; Greenberg, R.; Williamson, R.; Little, J.; Mech, B.; Cimmarusti, V.; Van Boemel, G.; Dagnelie, G.; et al. Visual perception in a blind subject with a chronic microelectronic retinal prosthesis. Vis. Res. 2003, 43, 2573–2581. [Google Scholar] [CrossRef] [Green Version]
- Margalit, E.; Maia, M.; Weiland, J.D.; Greenberg, R.J.; Fujii, G.Y.; Torres, G.; Piyathaisere, D.V.; O’Hearn, T.M.; Liu, W.; Lazzi, G.; et al. Retinal prosthesis for the blind. Surv. Ophthalmol. 2002, 47, 335–356. [Google Scholar] [CrossRef]
- Richards, A.; Emondi, A.A.; Rohrer, B. Long-term ERG analysis in the partially light-damaged mouse retina reveals regressive and compensatory changes. Vis. Neurosci. 2006, 23, 91–97. [Google Scholar] [CrossRef]
- Noell, W.K. Different Kinds of Retinal Light Damage in the Retina; Plenum Press: New York, NY, USA, 1980; pp. 3–29. [Google Scholar]
- Noell, W.K.; Walker, V.S.; Kang, B.S.; Berman, S. Retinal damage by light in rats. Investig. Ophthalmol. Vis. Sci. 1966, 5, 450–473. [Google Scholar]
- Rapp, L.M.; Williams, T.P. Damage to the albino rat retina produced by low intensity light. Photochem. Photobiol. 1979, 29, 731–733. [Google Scholar]
- La Vail, M.M. Survival of some photoreceptor cells in albino rats following long-term exposure to continuous light. Investig. Ophthalmol. Vis. Sci. 1976, 15, 64–70. [Google Scholar]
- Cicerone, C.M. Cone survive rods in the light-damaged eye of albino rat. Science 1976, 194, 1183–1185. [Google Scholar] [CrossRef] [PubMed] [Green Version]
- Cicerone, C.M.; Green, D.G.; Fisher, L.J. Cone inputs to ganglion cells in hereditary retinal degeneration. Science 1979, 203, 1113–1115. [Google Scholar] [CrossRef] [PubMed] [Green Version]
- Sugawara, T.; Sieving, P.A.; Bush, R.A. Quantitative relationship of the scotopic and photopic ERG to photoreceptor cell loss in light damaged rats. Exp. Eye. Res. 2000, 70, 693–705. [Google Scholar] [CrossRef] [PubMed]
- Williams, R.A.; Pollitz, C.H.; Smith, J.C.; Williams, T.P. Flicker detection in the albino rat following light-induced retinal damage. Physiol. Behav. 1985, 34, 259–266. [Google Scholar] [CrossRef]
- Riccitelli, S.; Di Paolo, M.; Ashley, J.; Bisti, S.; Di Marco, S. The Timecourses of Functional, Morphological, and Molecular Changes Triggered by Light Exposure in Sprague-Dawley Rat Retinas. Cells 2021, 10, 1561. [Google Scholar] [CrossRef]
- Rubin, G.R.; Kraft, T.W. Flicker assessment of rod and cone function in a model of retinal degeneration. Doc. Ophthalmol. 2007, 115, 165–172. [Google Scholar] [CrossRef]
- Miralles de Imperial-Ollero, J.A.; Gallego-Ortega, A.; Norte-Muñoz, M.; Di Pierdomenico, J.; Bernal-Garro, J.M.; Valiente-Soriano, F.J.; Vidal-Sanz, M. Short- and Long-Term Study of the Impact of Focal Blue Light-Emitting Diode-Induced Phototoxicity in Adult Albino Rats. Int. J. Mol. Sci. 2021, 22, 9742. [Google Scholar] [CrossRef]
- Ortín-Martínez, A.; Valiente-Soriano, F.J.; García-Ayuso, D.; Alarcón-Martínez, L.; Jiménez-López, M.; Bernal-Garro, J.M.; Nieto-López, L.; Nadal-Nicolás, F.M.; Villegas-Pérez, M.P.; Wheeler, L.A.; et al. A novel in vivo model of focal light emitting diode-induced cone-photoreceptor phototoxicity: Neuroprotection afforded by brimonidine, BDNF, PEDF or bFGF. PLoS ONE 2014, 9, e113798. [Google Scholar] [CrossRef]
- Benthal, M.C.; McKeown, A.S.; Kraft, T.W. Cone Photoreceptor Loss in Light-Damaged Albino Rats. Int. J. Mol. Sci. 2022, 23, 3978. [Google Scholar] [CrossRef]
- Gopalakrishnan, S.; Mehrvar, S.; Maleki, S.; Schmitt, H.; Summerfelt, P.; Dubis, A.M.; Abroe, B.; Connor, T.B.; Carroll, J.; Huddleston, W.; et al. Photobiomodulation preserves mitochondrial redox state and is retinoprotective in a rodent model of retinitis pigmentosa. Sci. Rep. 2020, 10, 20382. [Google Scholar] [CrossRef]
- Montalbán-Soler, L.; Alarcón-Martínez, L.; Jiménez-López, M.; Salinas-Navarro, M.; Galindo-Romero, C.; de Bezerra, S.F.; García-Ayuso, D.; Avilés-Trigueros, M.; Vidal-Sanz, M.; Agudo-Barriuso, M.; et al. Retinal compensatory changes after light damage in albino mice. Mol. Vis. 2012, 18, 675–693. [Google Scholar]
- Polosa, A.; Bessaklia, H.; Lachapelle, P. Strain Differences in Light-Induced Retinopathy. PLoS ONE 2016, 11, e0158082. [Google Scholar] [CrossRef] [PubMed] [Green Version]
- Cuenca, N.; Pinilla, I.; Sauvé, Y.; Lu, B.; Wang, S.; Lund, R.D. Regressive and reactive changes in the connectivity patterns of rod and cone pathways of P23H transgenic rat retina. Neuroscience 2004, 127, 301–317. [Google Scholar] [CrossRef] [PubMed]
- Jones, B.W.; Kondo, M.; Terasaki, H.; Lin, Y.; McCall, M.; Marc, R.E. Retinal remodeling. Jpn. J. Ophthalmol. 2012, 56, 289–306. [Google Scholar] [CrossRef]
- Swinkels, D.; Das, Y.; Kocherlakota, S.; Vinckier, S.; Wever, E.; van Kampen, A.H.C.; Vaz, F.M.; Baes, M. Cell Type-Selective Loss of Peroxisomal β-Oxidation Impairs Bipolar Cell but Not Photoreceptor Survival in the Retina. Cells 2022, 11, 161. [Google Scholar] [CrossRef]
- Vollrath, D.; Feng, W.; Duncan, J.L.; Yasumura, D.; D’Cruz, P.M.; Chappelow, A.; Matthes, M.T.; Kay, M.A.; LaVail, M.M. Correction of the retinal dystrophy phenotype of the RCS rat by viral gene transfer of Mertk. Proc. Natl. Acad. Sci. USA 2001, 98, 12584–12589. [Google Scholar] [CrossRef] [Green Version]
- Tso, M.O.; Zhang, C.; Abler, A.S.; Chang, C.J.; Wong, F.; Chang, G.Q.; Lam, T.T. Apoptosis leads to photoreceptor degeneration in inherited retinal dystrophy of RCS rats. Investig. Ophthalmol. Vis. Sci. 1994, 35, 2693–2699. [Google Scholar]
- Herron, W.L., Jr.; Riegel, B.W.; Brennan, E.; Rubin, M.L. Retinal dystrophy in the pigmented rat. Investig. Ophthalmol. Vis. Sci. 1974, 13, 87–94. [Google Scholar]
- Valter, K.; Maslim, J.; Bowers, F.; Stone, J. Photoreceptor dystrophy in the RCS rat: Roles of oxygen, debris, and bFGF. Investig. Ophthalmol. Vis. Sci. 1998, 39, 2427–2442. [Google Scholar]
- Perche, O.; Doly, M.; Ranchon-Cole, I. Caspase-dependent apoptosis in light-induced retinal degeneration. Investig. Ophthalmol. Vis. Sci. 2007, 48, 2753–2759. [Google Scholar] [CrossRef]
- Zhang, Y.; Molday, L.L.; Molday, R.S.; Sarfare, S.S.; Woodruff, M.L.; Fain, G.L.; Kraft, T.W.; Pittler, S.J. Knockout of cGMP-gated channel b-subunit and GARPs disrupts disk morphogenesis and rod outer segment structural integrity. J. Cell Sci. 2009, 122, 1192–1200. [Google Scholar] [CrossRef] [PubMed] [Green Version]
- Scholl, H.P.; Langrova, H.; Weber, B.H.; Zrenner, E.; Apfelstedt-Sylla, E. Clinical electrophysiology of two rod pathways: Normative values and clinical application. Graefes Arch. Clin. Exp. Ophthalmol. 2001, 239, 71–80. [Google Scholar] [CrossRef] [PubMed]
- Pinilla, I.; Lund, R.D.; Sauve, Y. Cone function studied with flicker electroretinogram during progressive retinal degeneration in RCS rats. Exp. Eye Res. 2005, 80, 51–59. [Google Scholar] [CrossRef]
- Coile, D.C.; Pollitz, C.H.; Smith, J.C. Behavioral determination of critical flicker fusion in dogs. Physiol. Behav. 1989, 45, 1087–1092. [Google Scholar] [CrossRef]
- Lee, B.B.; Martin, P.R.; Valberg, A. Sensitivity of macaque retinal ganglion cells to chromatic and luminance flicker. J. Physiol. 1989, 414, 223–243. [Google Scholar] [CrossRef] [PubMed] [Green Version]
- Sokol, S.; Riggs, L.A. Electrical and psychophysical responses of the human visual system to periodic variation of luminance. Investig. Ophthalmol. Vis. Sci. 1971, 10, 171–180. [Google Scholar]
- Van Der Tweel, L. Relation between psychophysics and electrophysiology of flicker. Doc. Ophthalmol. 1964, 18, 287–304. [Google Scholar] [CrossRef]
- Schremser, J.L.; Williams, T.P. Rod outer segment (ROS) renewal as a mechanism for adaptation to a new intensity environment. I. Rhodopsin levels and ROS length. Exp. Eye Res. 1995, 61, 17–23. [Google Scholar] [CrossRef]
- Tanito, M.; Anderson, R.E. Bright cyclic light rearing-mediated retinal protection against damaging light exposure in adrenalectomized mice. Exp Eye Res. 2006, 83, 697–701. [Google Scholar] [CrossRef]
- Delmelle, M.; Noell, W.K.; Organisciak, D.T. Hereditary retinal dystrophy in the rat, rhodopsin, retinol, vitamin A deficiency. Exp. Eye Res. 1975, 21, 369–380. [Google Scholar] [CrossRef]
- Hafezi, F.; Steinbach, J.P.; Marti, A.; Munz, K.; Wang, Z.Q.; Wagner, E.F.; Aguzzi, A.; Reme, C.E. The absence of c-fos prevents light-induced apoptotic cell death of photoreceptors in retinal degeneration in vivo. Nat. Med. 1997, 3, 346–349. [Google Scholar] [CrossRef] [PubMed]
- Noell, W.K.; Organisciak, D.T.; Ando, H.; Braniecki, M.A.; Durlin, C. Ascorbate and dietary protective mechanisms in retinal light damage of rats: Electrophysiological, histological and DNA measurements. Prog. Clin. Biol. Res. 1987, 247, 469–483. [Google Scholar] [PubMed]
- Specht, S.; Organisciak, D.T.; Darrow, R.M.; Leffak, M. Continuing damage to rat retinal DNA during darkness following light exposure. Photochem. Photobiol. 2000, 71, 559–566. [Google Scholar] [CrossRef]
- Ortín-Martínez, A.; Nadal-Nicolás, F.M.; Jiménez-López, M.; Alburquerque-Béjar, J.J.; Nieto-López, L.; García-Ayuso, D.; Villegas-Pérez, M.P.; Vidal-Sanz, M.; Agudo-Barriuso, M. Number and distribution of mouse retinal cone photoreceptors: Differences between an albino (Swiss) and a pigmented (C57/BL6) strain. PLoS ONE 2014, 9, e102392. [Google Scholar] [CrossRef]
- Natoli, R.; Fernando, N.; Madigan, M.; Chu-Tan, J.A.; Valter, K.; Provis, J.; Rutar, M. Microglia-derived IL-1β promotes chemokine expression by Müller cells and RPE in focal retinal degeneration. Mol. Neurodegener. 2017, 12, 31. [Google Scholar] [CrossRef]
- Lyubarsky, A.L.; Daniele, L.L.; Pugh, E.N., Jr. From candelas to photoisomerizations in the mouse eye by rhodopsin bleaching in situ and the light-rearing dependence of the major components of the mouse ERG. Vis. Res. 2004, 44, 3235–3251. [Google Scholar] [CrossRef] [Green Version]
- Clark, M.E.; Kraft, T.W. Measuring rodent electroretinograms to assess retinal function. Methods Mol. Biol. 2012, 884, 265–276. [Google Scholar] [CrossRef]
- Akula, J.D.; Lyubarsky, A.L.; Naarendorp, F. The sensitivity and spectral identity of the cones driving the b-wave of the rat electroretinogram. Vis. Neurosci. 2003, 20, 109–117. [Google Scholar] [CrossRef] [PubMed]
- McGill, T.J.; Douglas, R.M.; Lund, R.D.; Prusky, G.T. Quantification of spatial vision in the Royal College of Surgeons rat. Investig. Ophthalmol. Vis. Sci. 2004, 45, 932–936. [Google Scholar] [CrossRef] [Green Version]
- Prusky, G.T.; West, P.W.; Douglas, R.M. Behavioral assessment of visual acuity in mice and rats. Vis. Res. 2000, 40, 2201–2209. [Google Scholar] [CrossRef] [Green Version]
- Cornsweet, T. The Staircase Method in Psychophysics. Am. J. Psychol. 1962, 75, 485–491. [Google Scholar] [CrossRef] [PubMed]
- Gellerman, L.W. Chance orders of alternating stimuli in visual discrimination experiments. J. Gen. Psychol. 1933, 42, 206–208. [Google Scholar] [CrossRef]


| Animal | a-Wave | b-Wave | ||
|---|---|---|---|---|
| Control | LD | Control | LD | |
| Pre-LD | 367 ± 19 (5) | 354 ± 7 (10) | 1440 ± 123(5) | 1450 ± 78 (10) |
| R6 | 363 ± 42 (4) | 236 ± 15 (9) | 1420 ± 144 (4) | 930 ± 64 (9) |
| R20 | 313 ± 9 (3) | 277 ± 20 (7) | 1230 ± 55 (3) | 1200 ± 57 (7) |
| R48 | 349 ± 9 (3) | 250 ± 30 (5) | 1350 ± 49 (3) | 1250 ± 74 (5) |
| R90 | 278 ± 16 (3) | 237 ± 5 (5) | 1260 ± 126 (3) | 1180 ± 95 (5) |
| (p = 0.15) | (p < 0.01) | (p = 0.62) | (p < 0.05) | |
Publisher’s Note: MDPI stays neutral with regard to jurisdictional claims in published maps and institutional affiliations. |
© 2022 by the authors. Licensee MDPI, Basel, Switzerland. This article is an open access article distributed under the terms and conditions of the Creative Commons Attribution (CC BY) license (https://creativecommons.org/licenses/by/4.0/).
Share and Cite
Rubin, G.R.; Wen, Y.; Loop, M.S.; Kraft, T.W. ERG and Behavioral CFF in Light-Damaged Albino Rats. Int. J. Mol. Sci. 2022, 23, 4127. https://doi.org/10.3390/ijms23084127
Rubin GR, Wen Y, Loop MS, Kraft TW. ERG and Behavioral CFF in Light-Damaged Albino Rats. International Journal of Molecular Sciences. 2022; 23(8):4127. https://doi.org/10.3390/ijms23084127
Chicago/Turabian StyleRubin, Glen R., Yuquan Wen, Michael S. Loop, and Timothy W. Kraft. 2022. "ERG and Behavioral CFF in Light-Damaged Albino Rats" International Journal of Molecular Sciences 23, no. 8: 4127. https://doi.org/10.3390/ijms23084127
APA StyleRubin, G. R., Wen, Y., Loop, M. S., & Kraft, T. W. (2022). ERG and Behavioral CFF in Light-Damaged Albino Rats. International Journal of Molecular Sciences, 23(8), 4127. https://doi.org/10.3390/ijms23084127