
The Use of Autologous Chondrocyte and Mesenchymal Stem Cell Implants for the Treatment of Focal Chondral Defects in Human Knee Joints—A Systematic Review and Meta-Analysis


Abstract
:1. Introduction
2. Materials and Methods
2.1. Search Algorithm
2.2. Inclusion and Exclusion Criteria
2.3. Data Extraction
- Study characteristics such as study design, cohort size and time of follow-up.
- Demographic information such as mean age, sex distribution, defect location and defect size.
- Type of intervention, including type of ACI/MSC and scaffold composition.
- Molecular status of the cells used in each intervention, including cluster of differentiation (CD) molecule profile and molecular construct of the scaffolds.
- Primary outcome measures regarding integration between the implant and native cartilage, assessment method (MRI, arthroscopy or histology) and scoring system used to quantify integration.
- Secondary outcomes, including clinical scores and any surgical complications.
2.4. Data Analysis
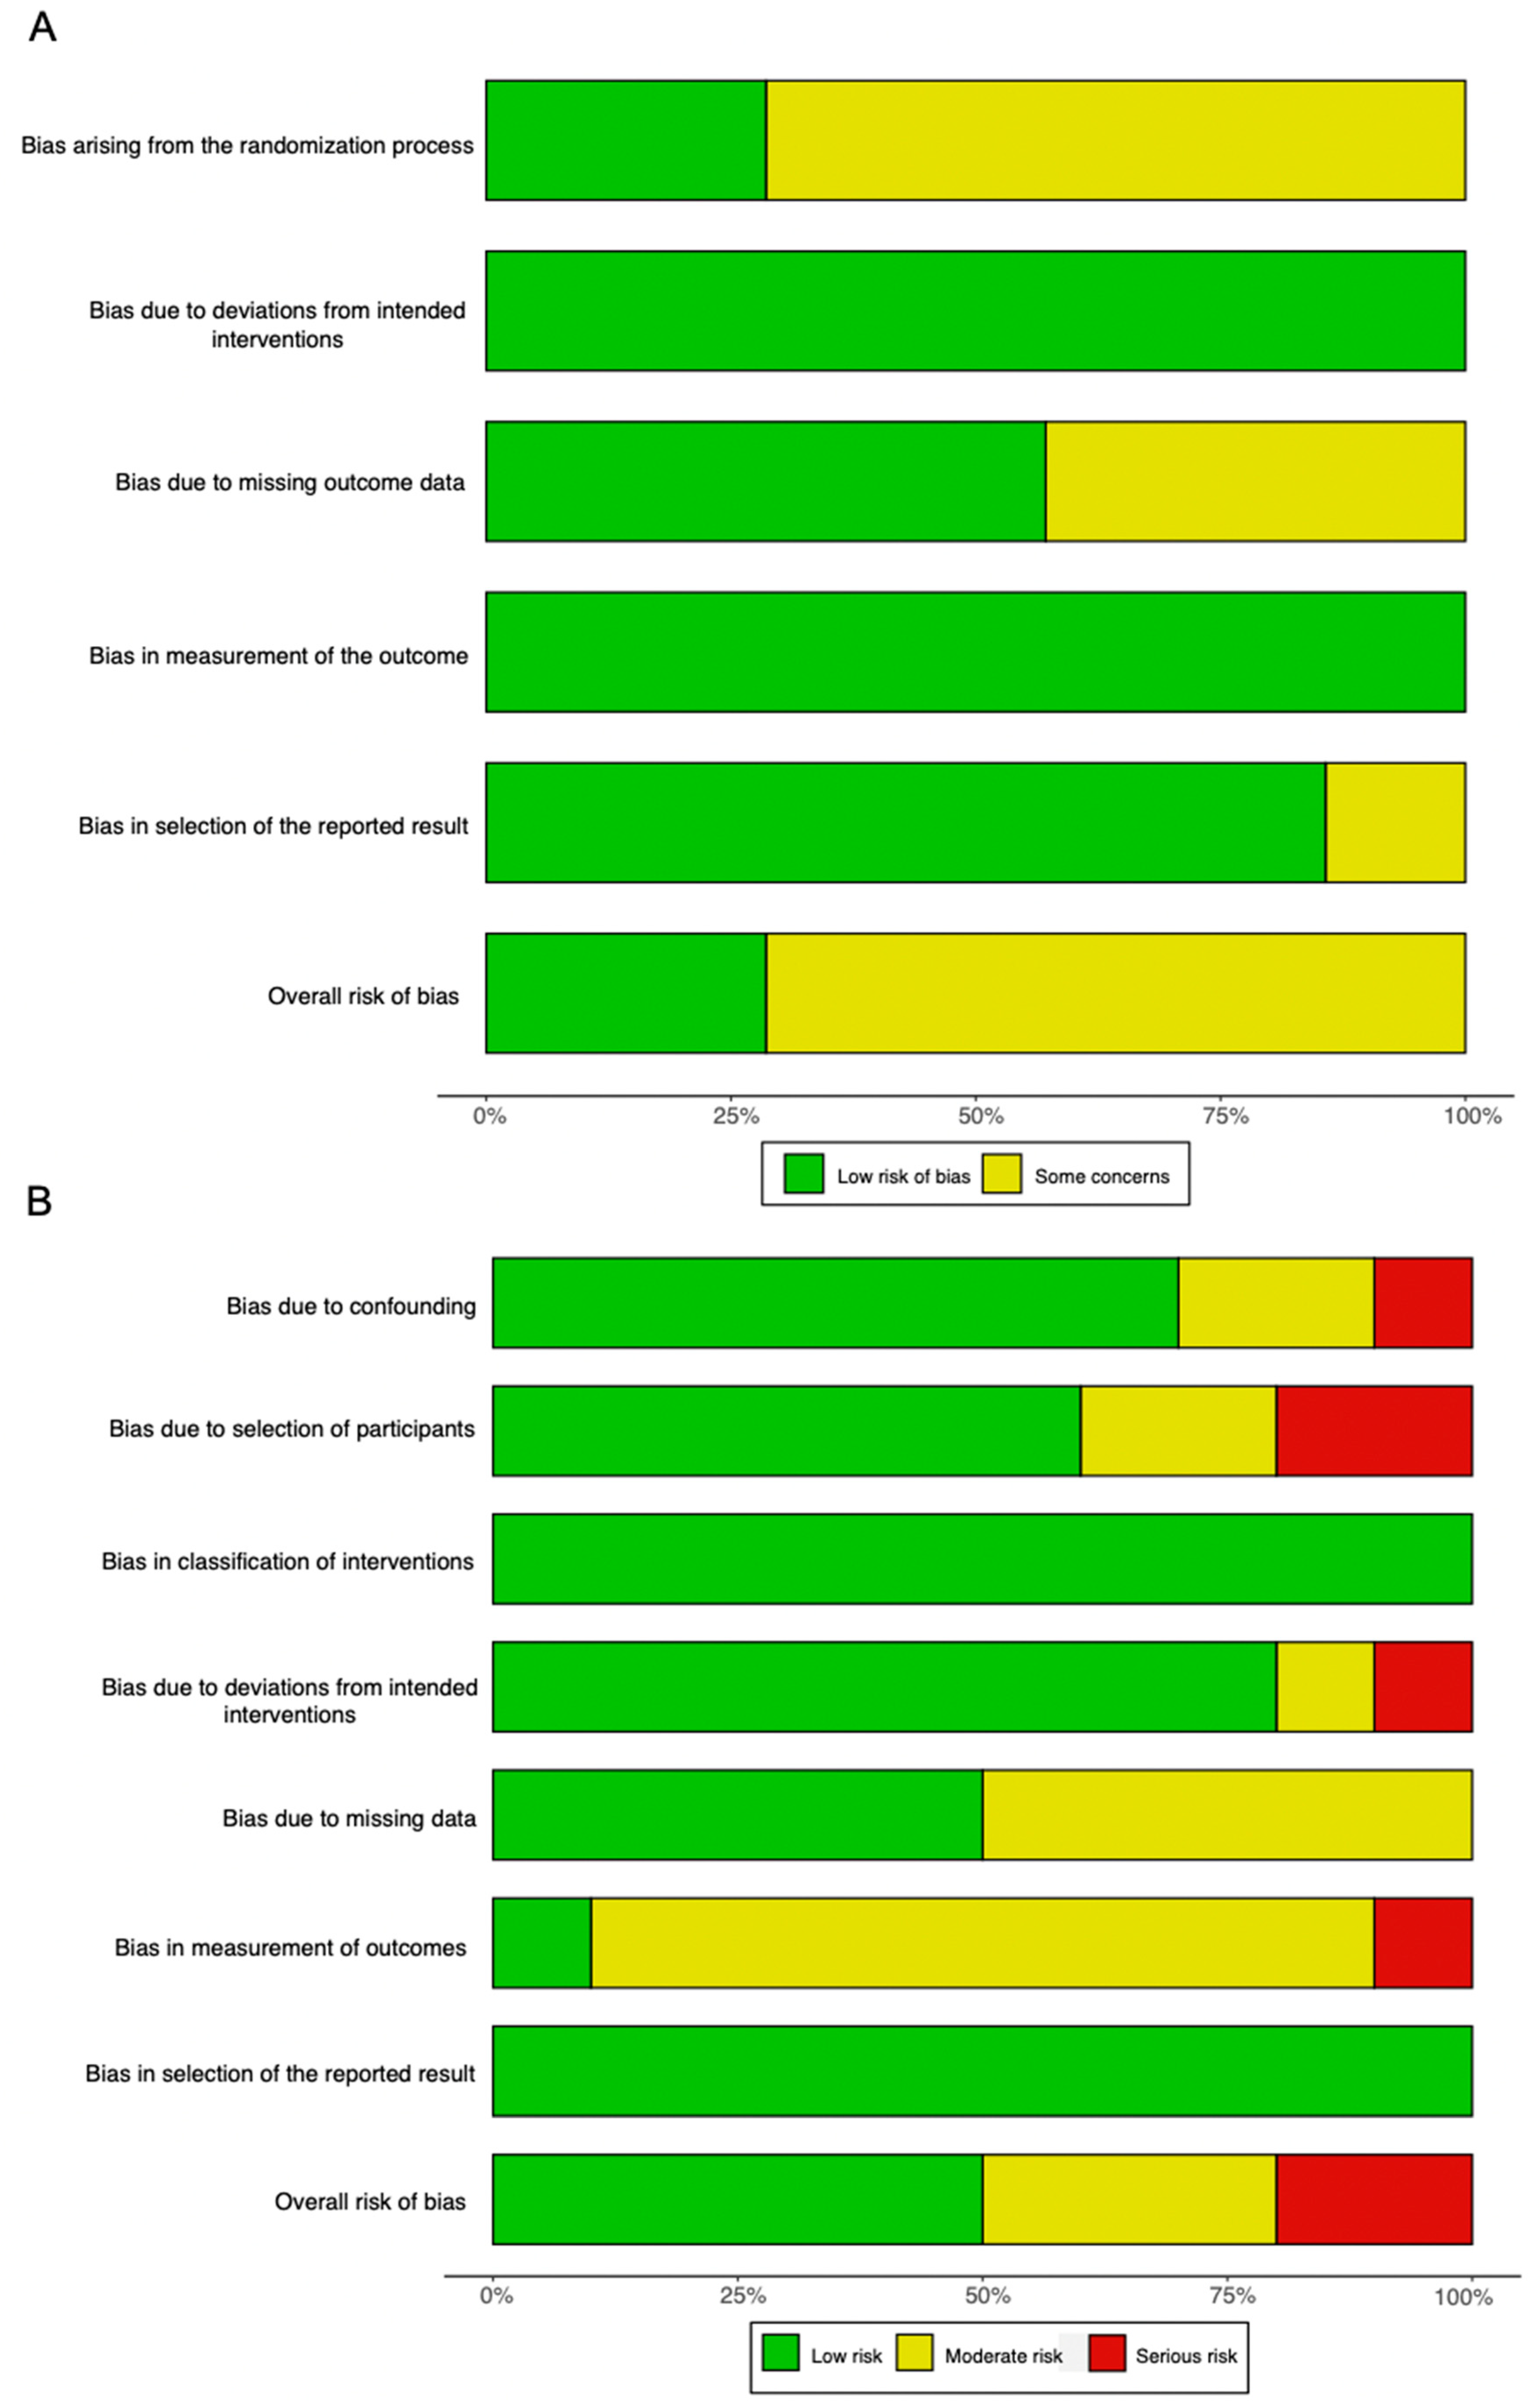
2.5. Assessing Risk of Bias
3. Results
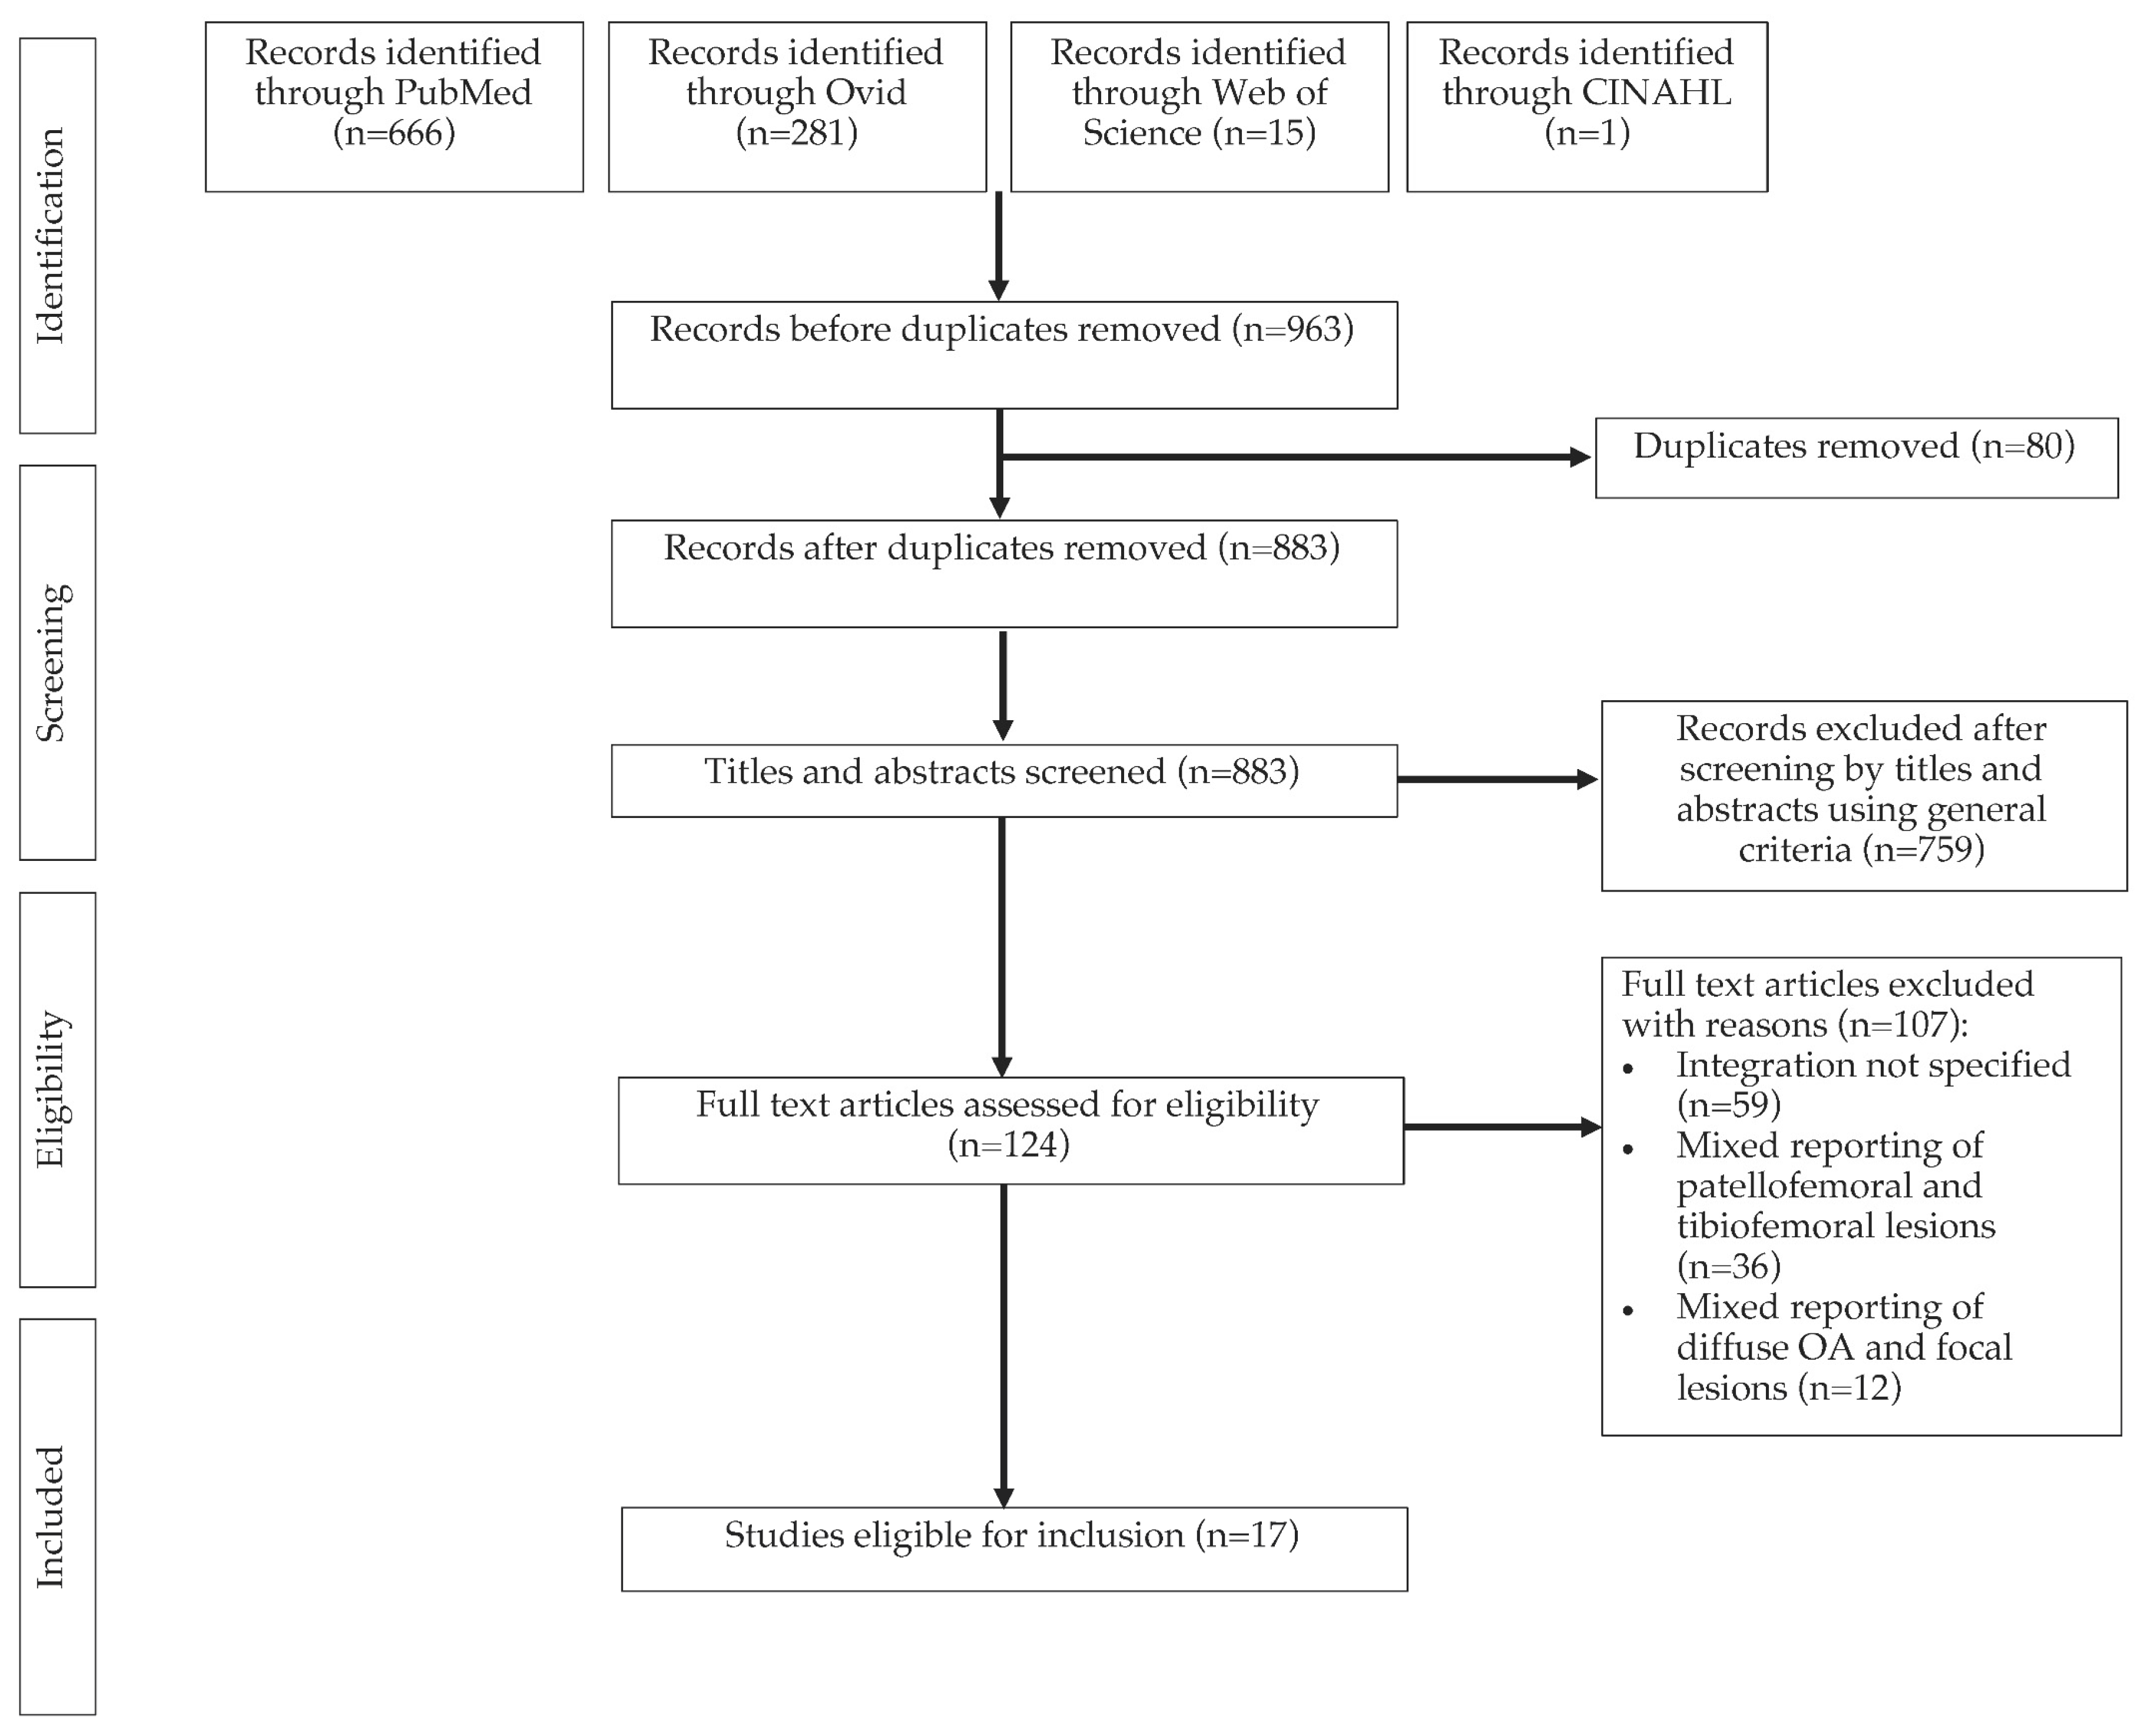
3.1. Search Results
3.2. Characteristics of Selected Studies
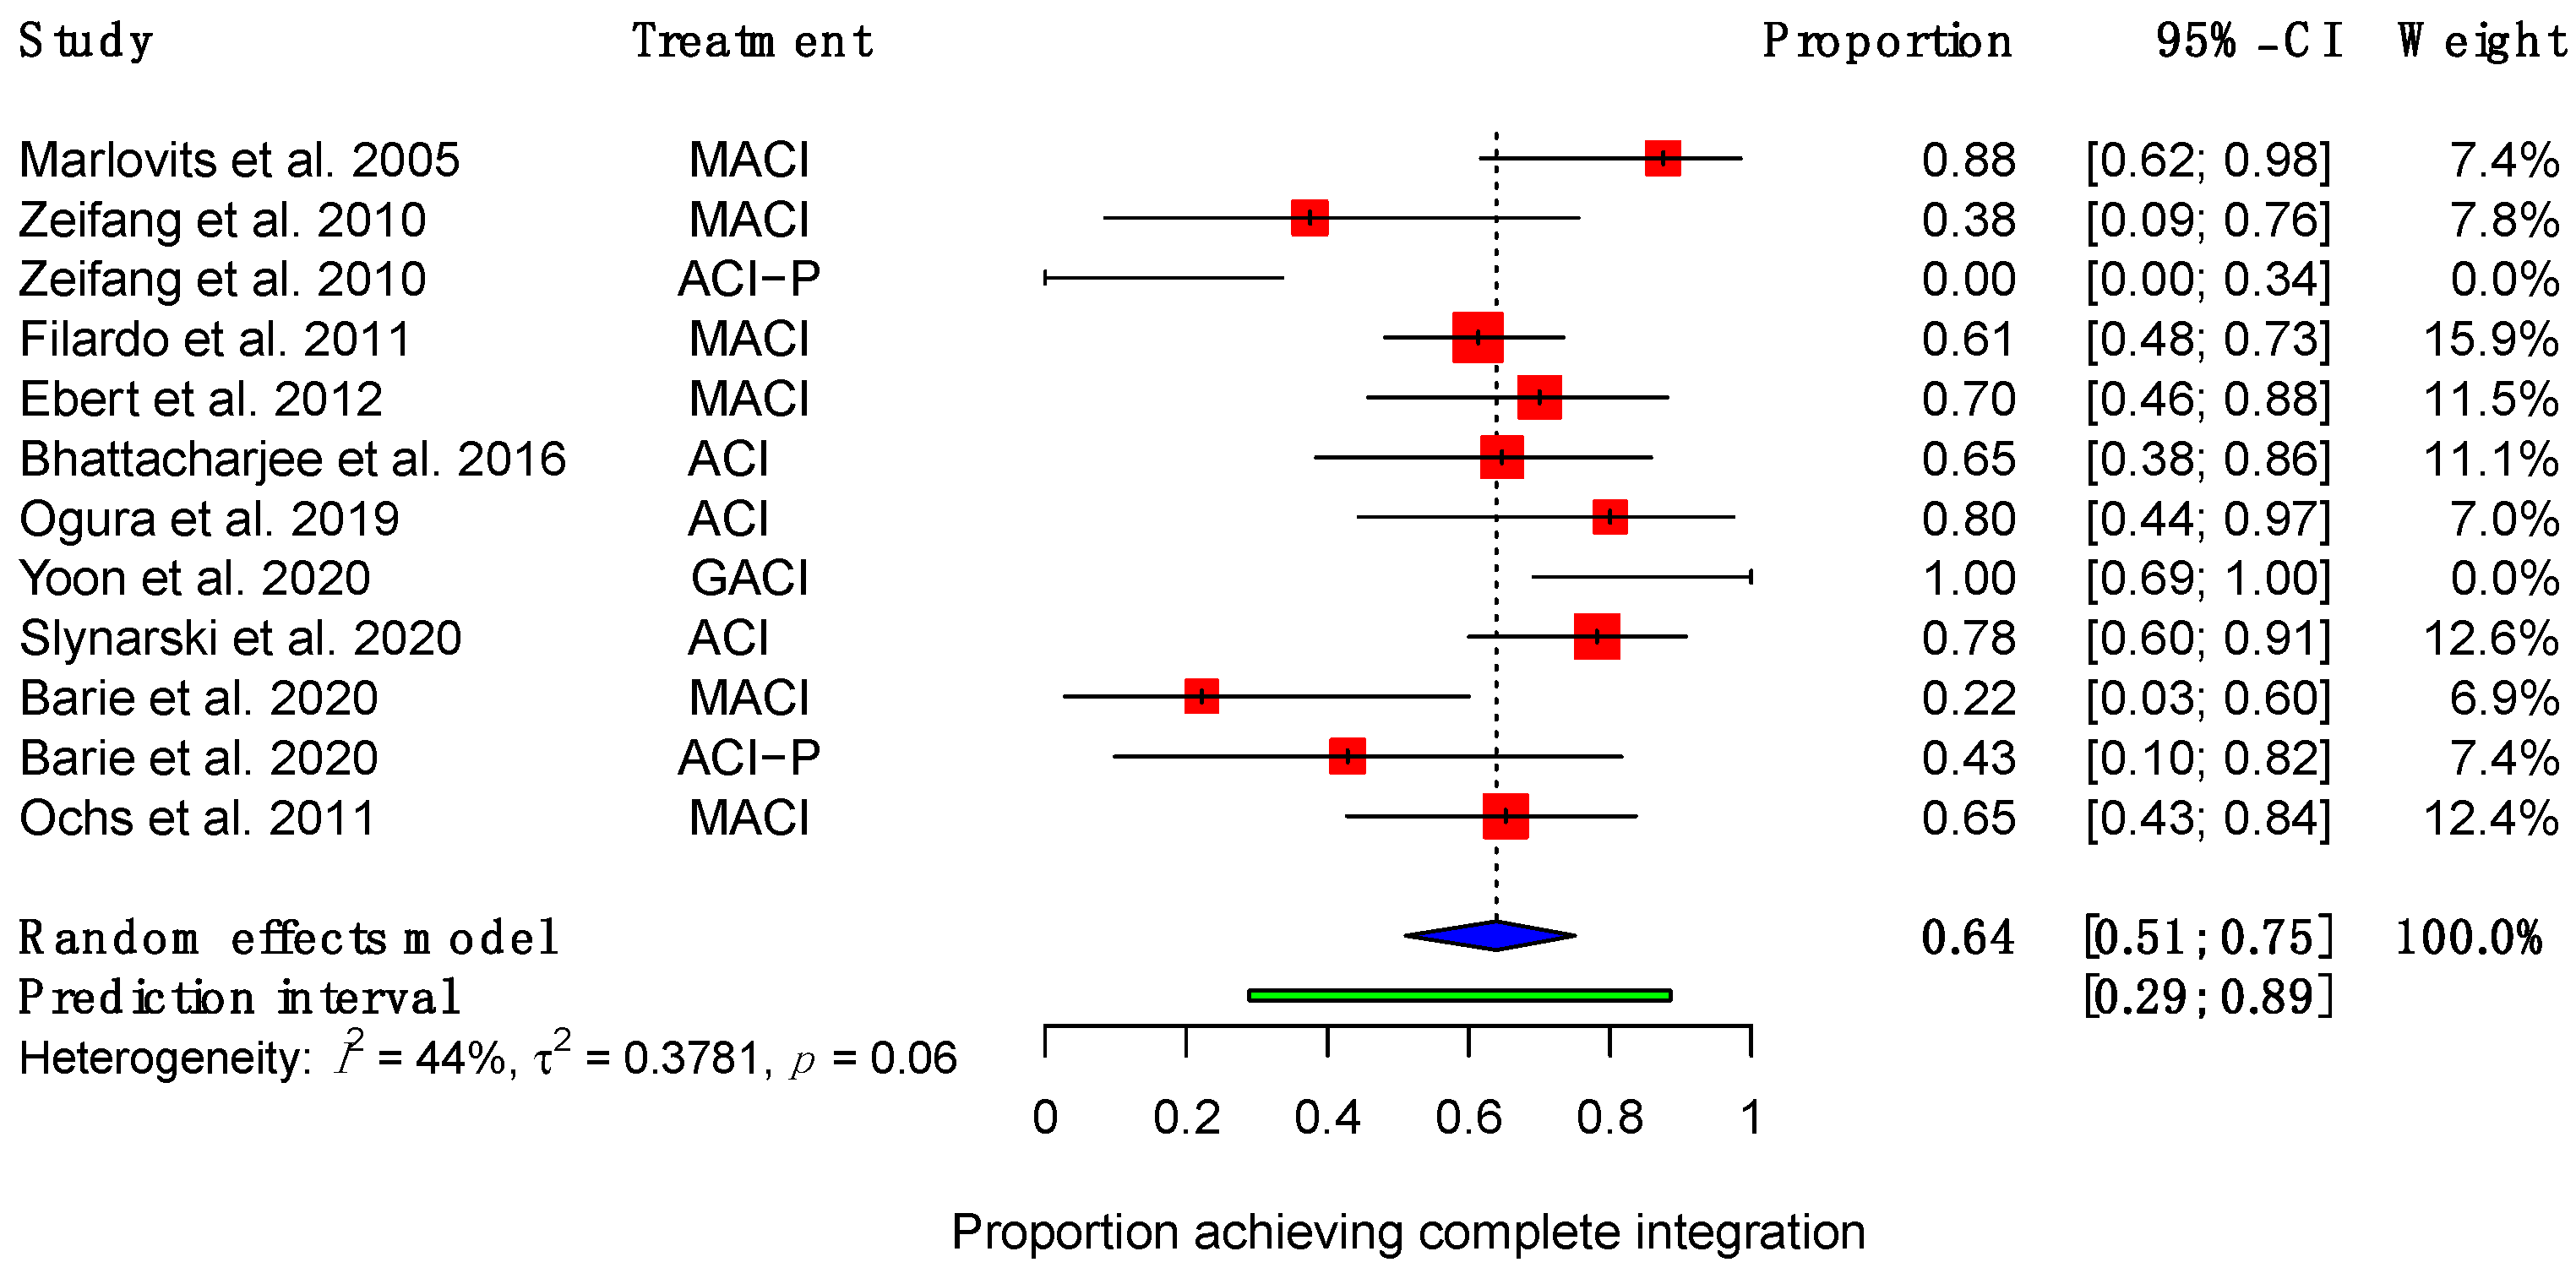
3.3. Integration Outcomes
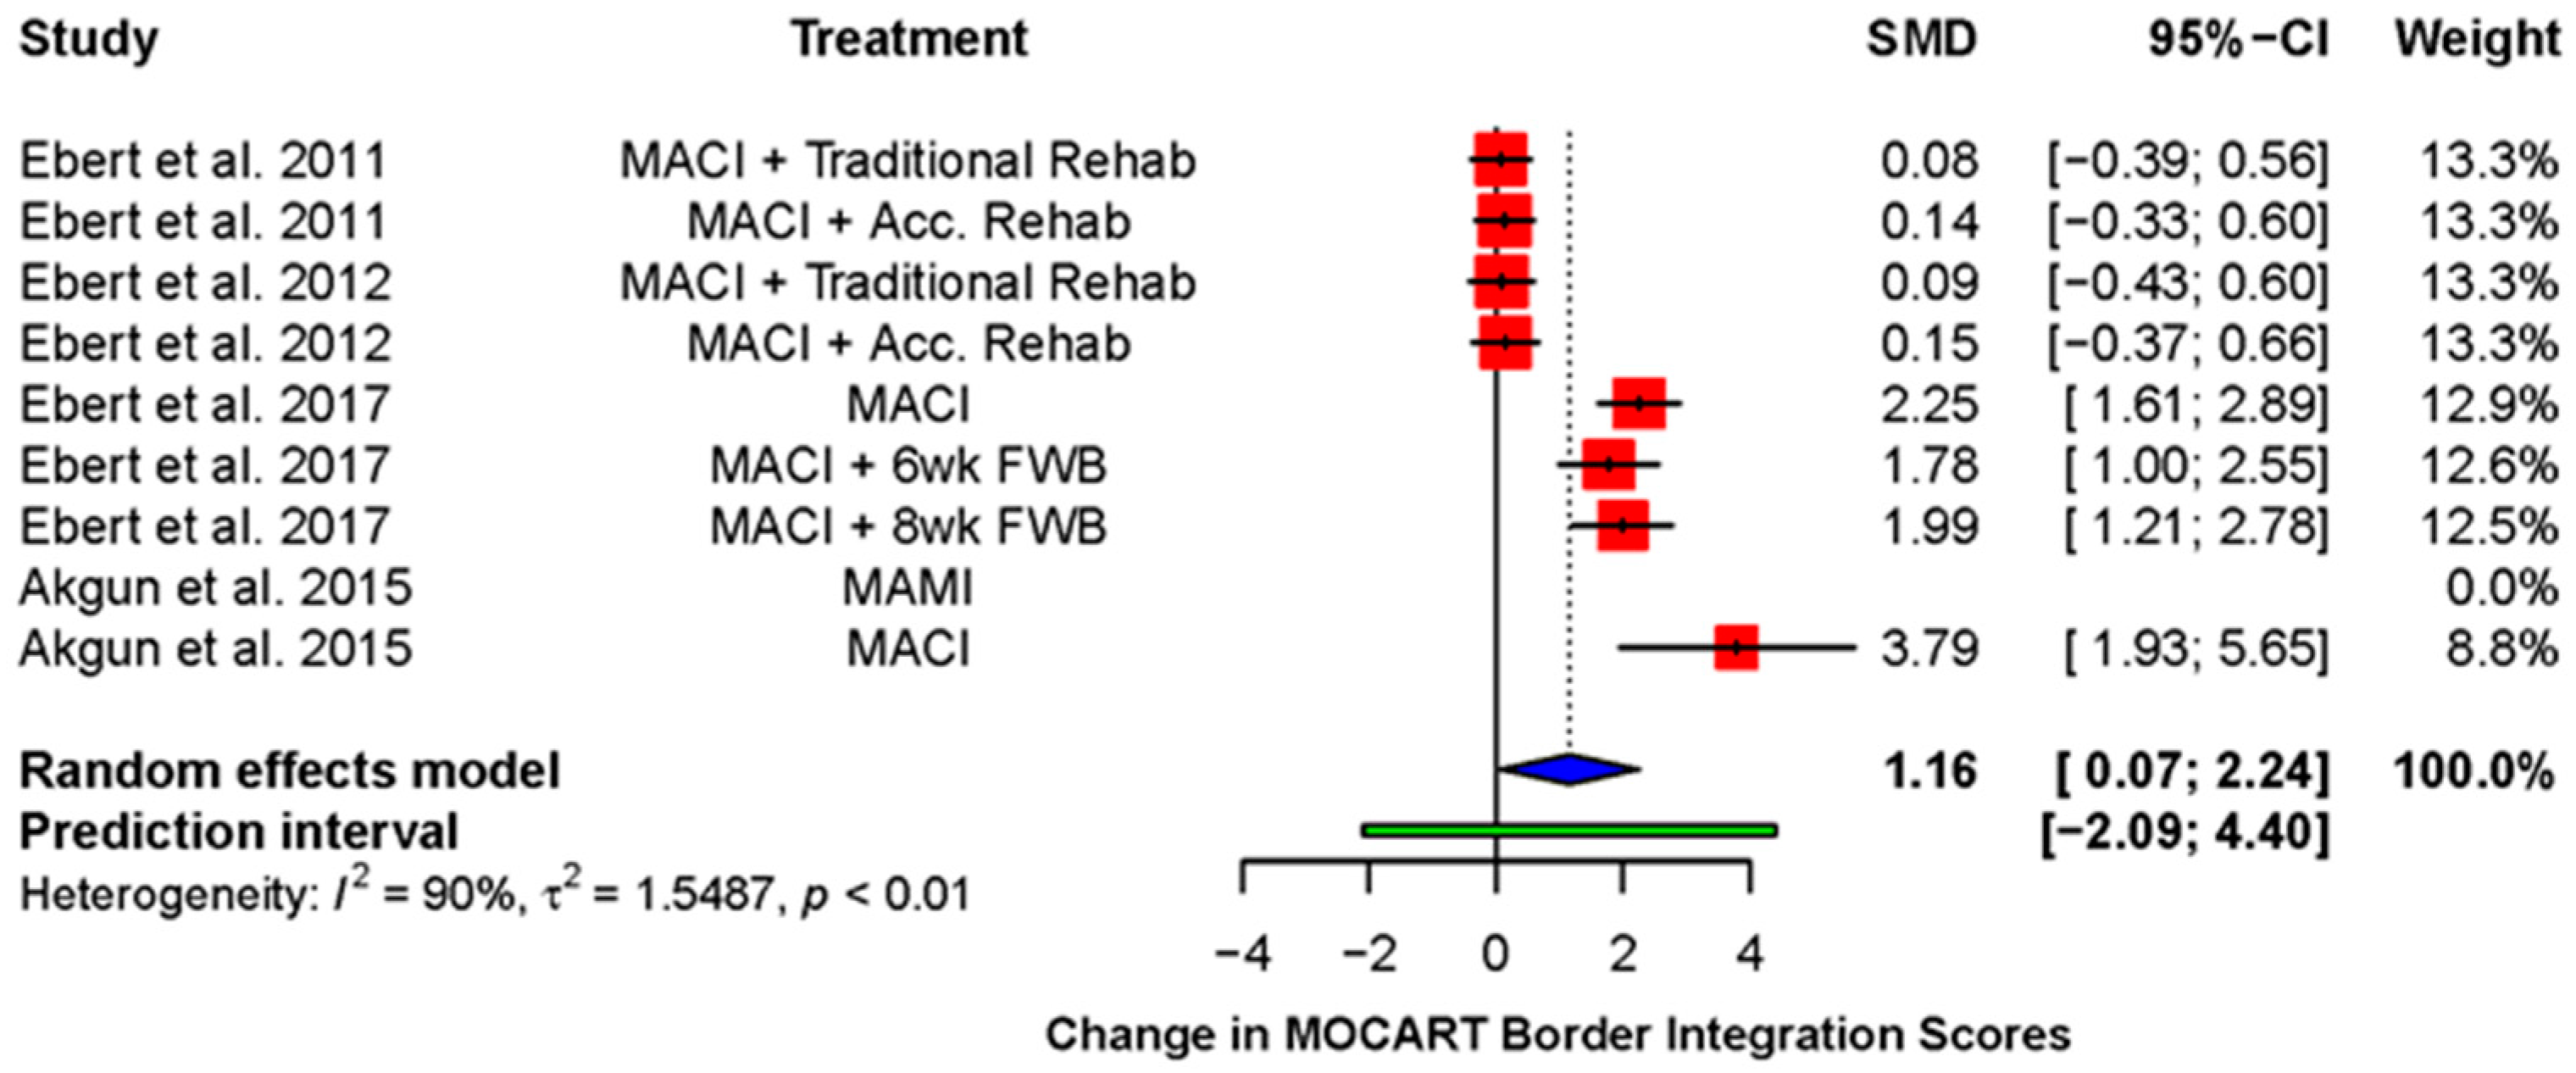
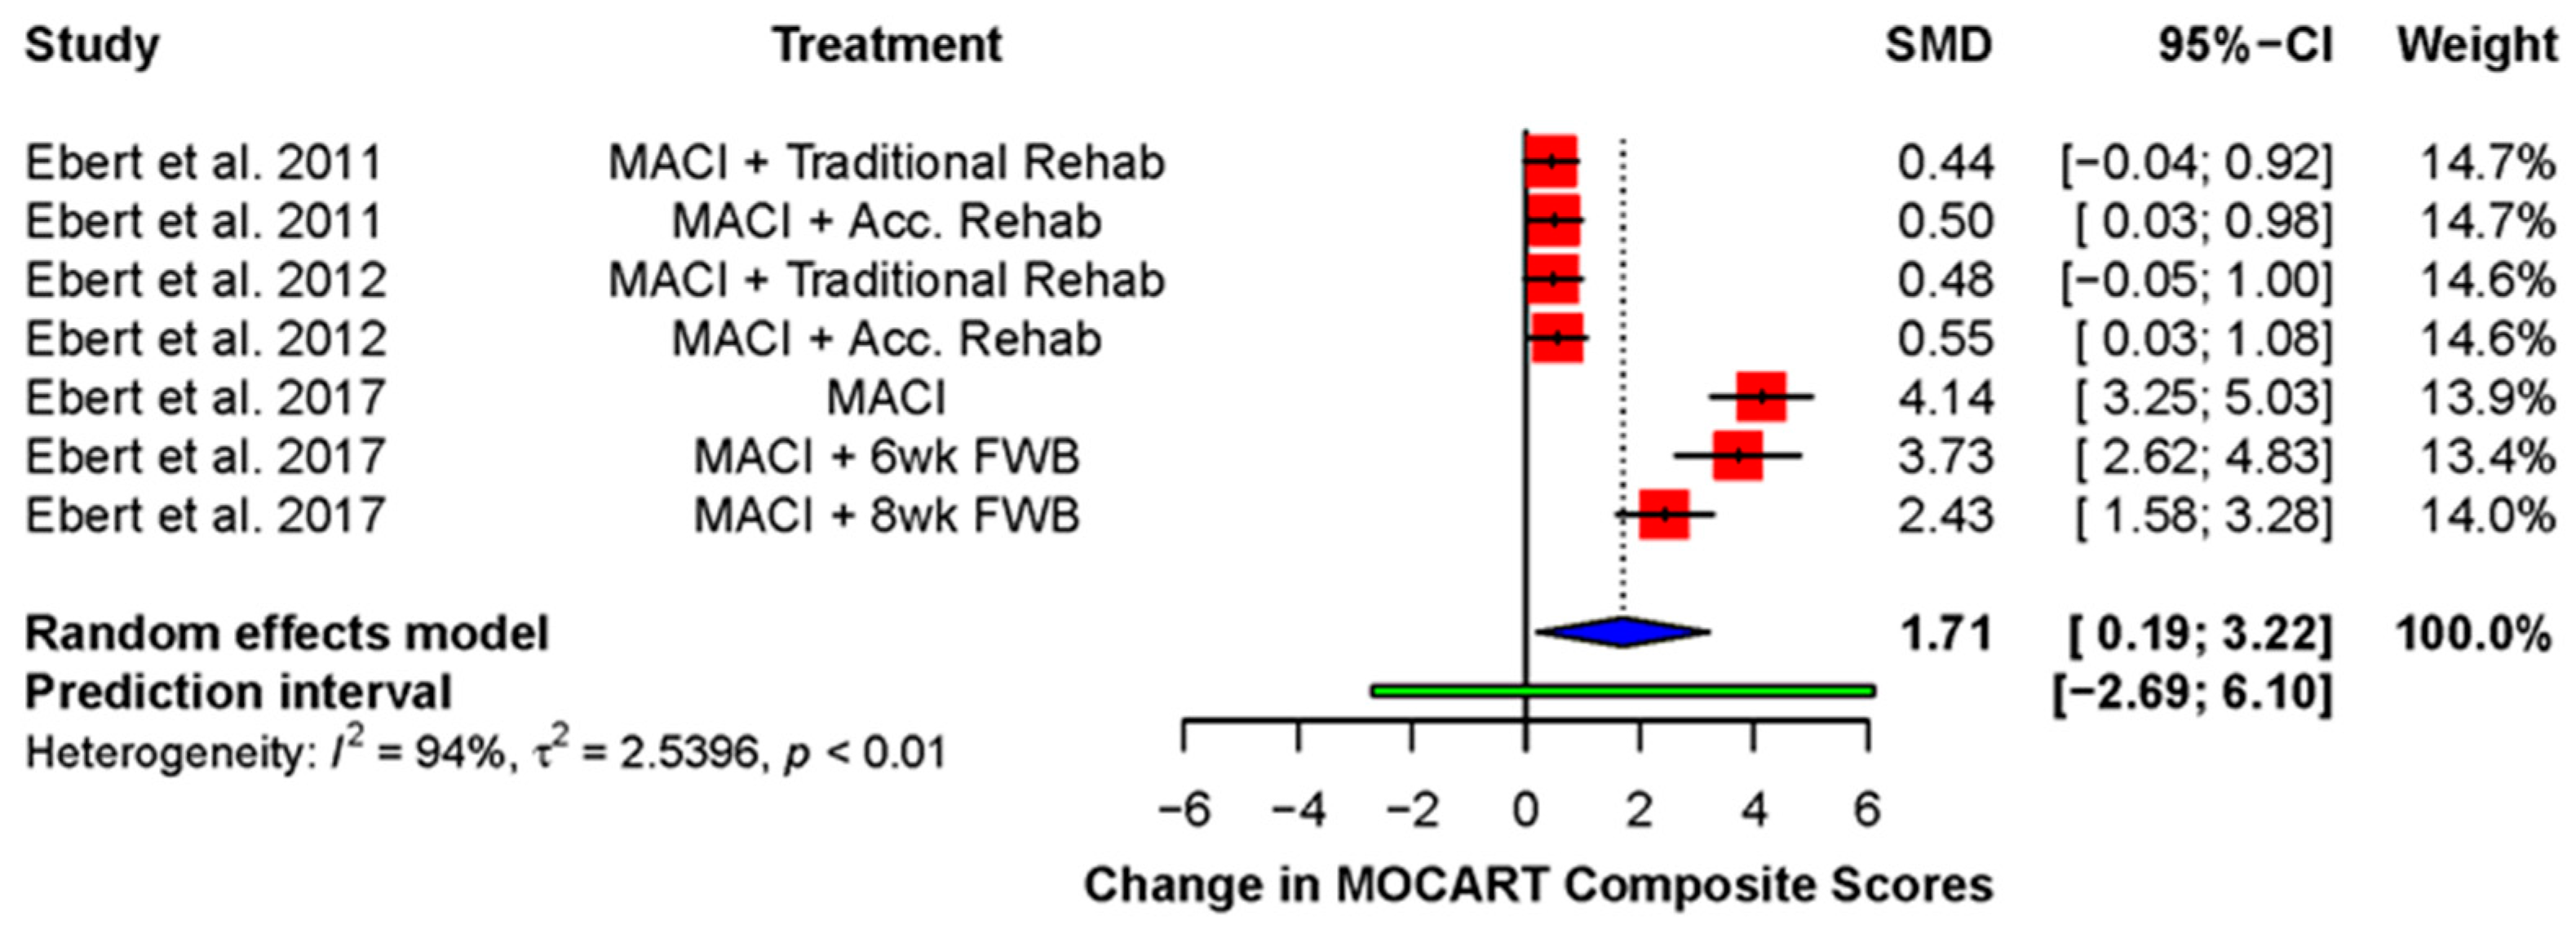
3.3.1. Magnetic Resonance Imaging
3.3.2. Arthroscopy
3.3.3. Histology
3.4. Other Imaging Outcomes
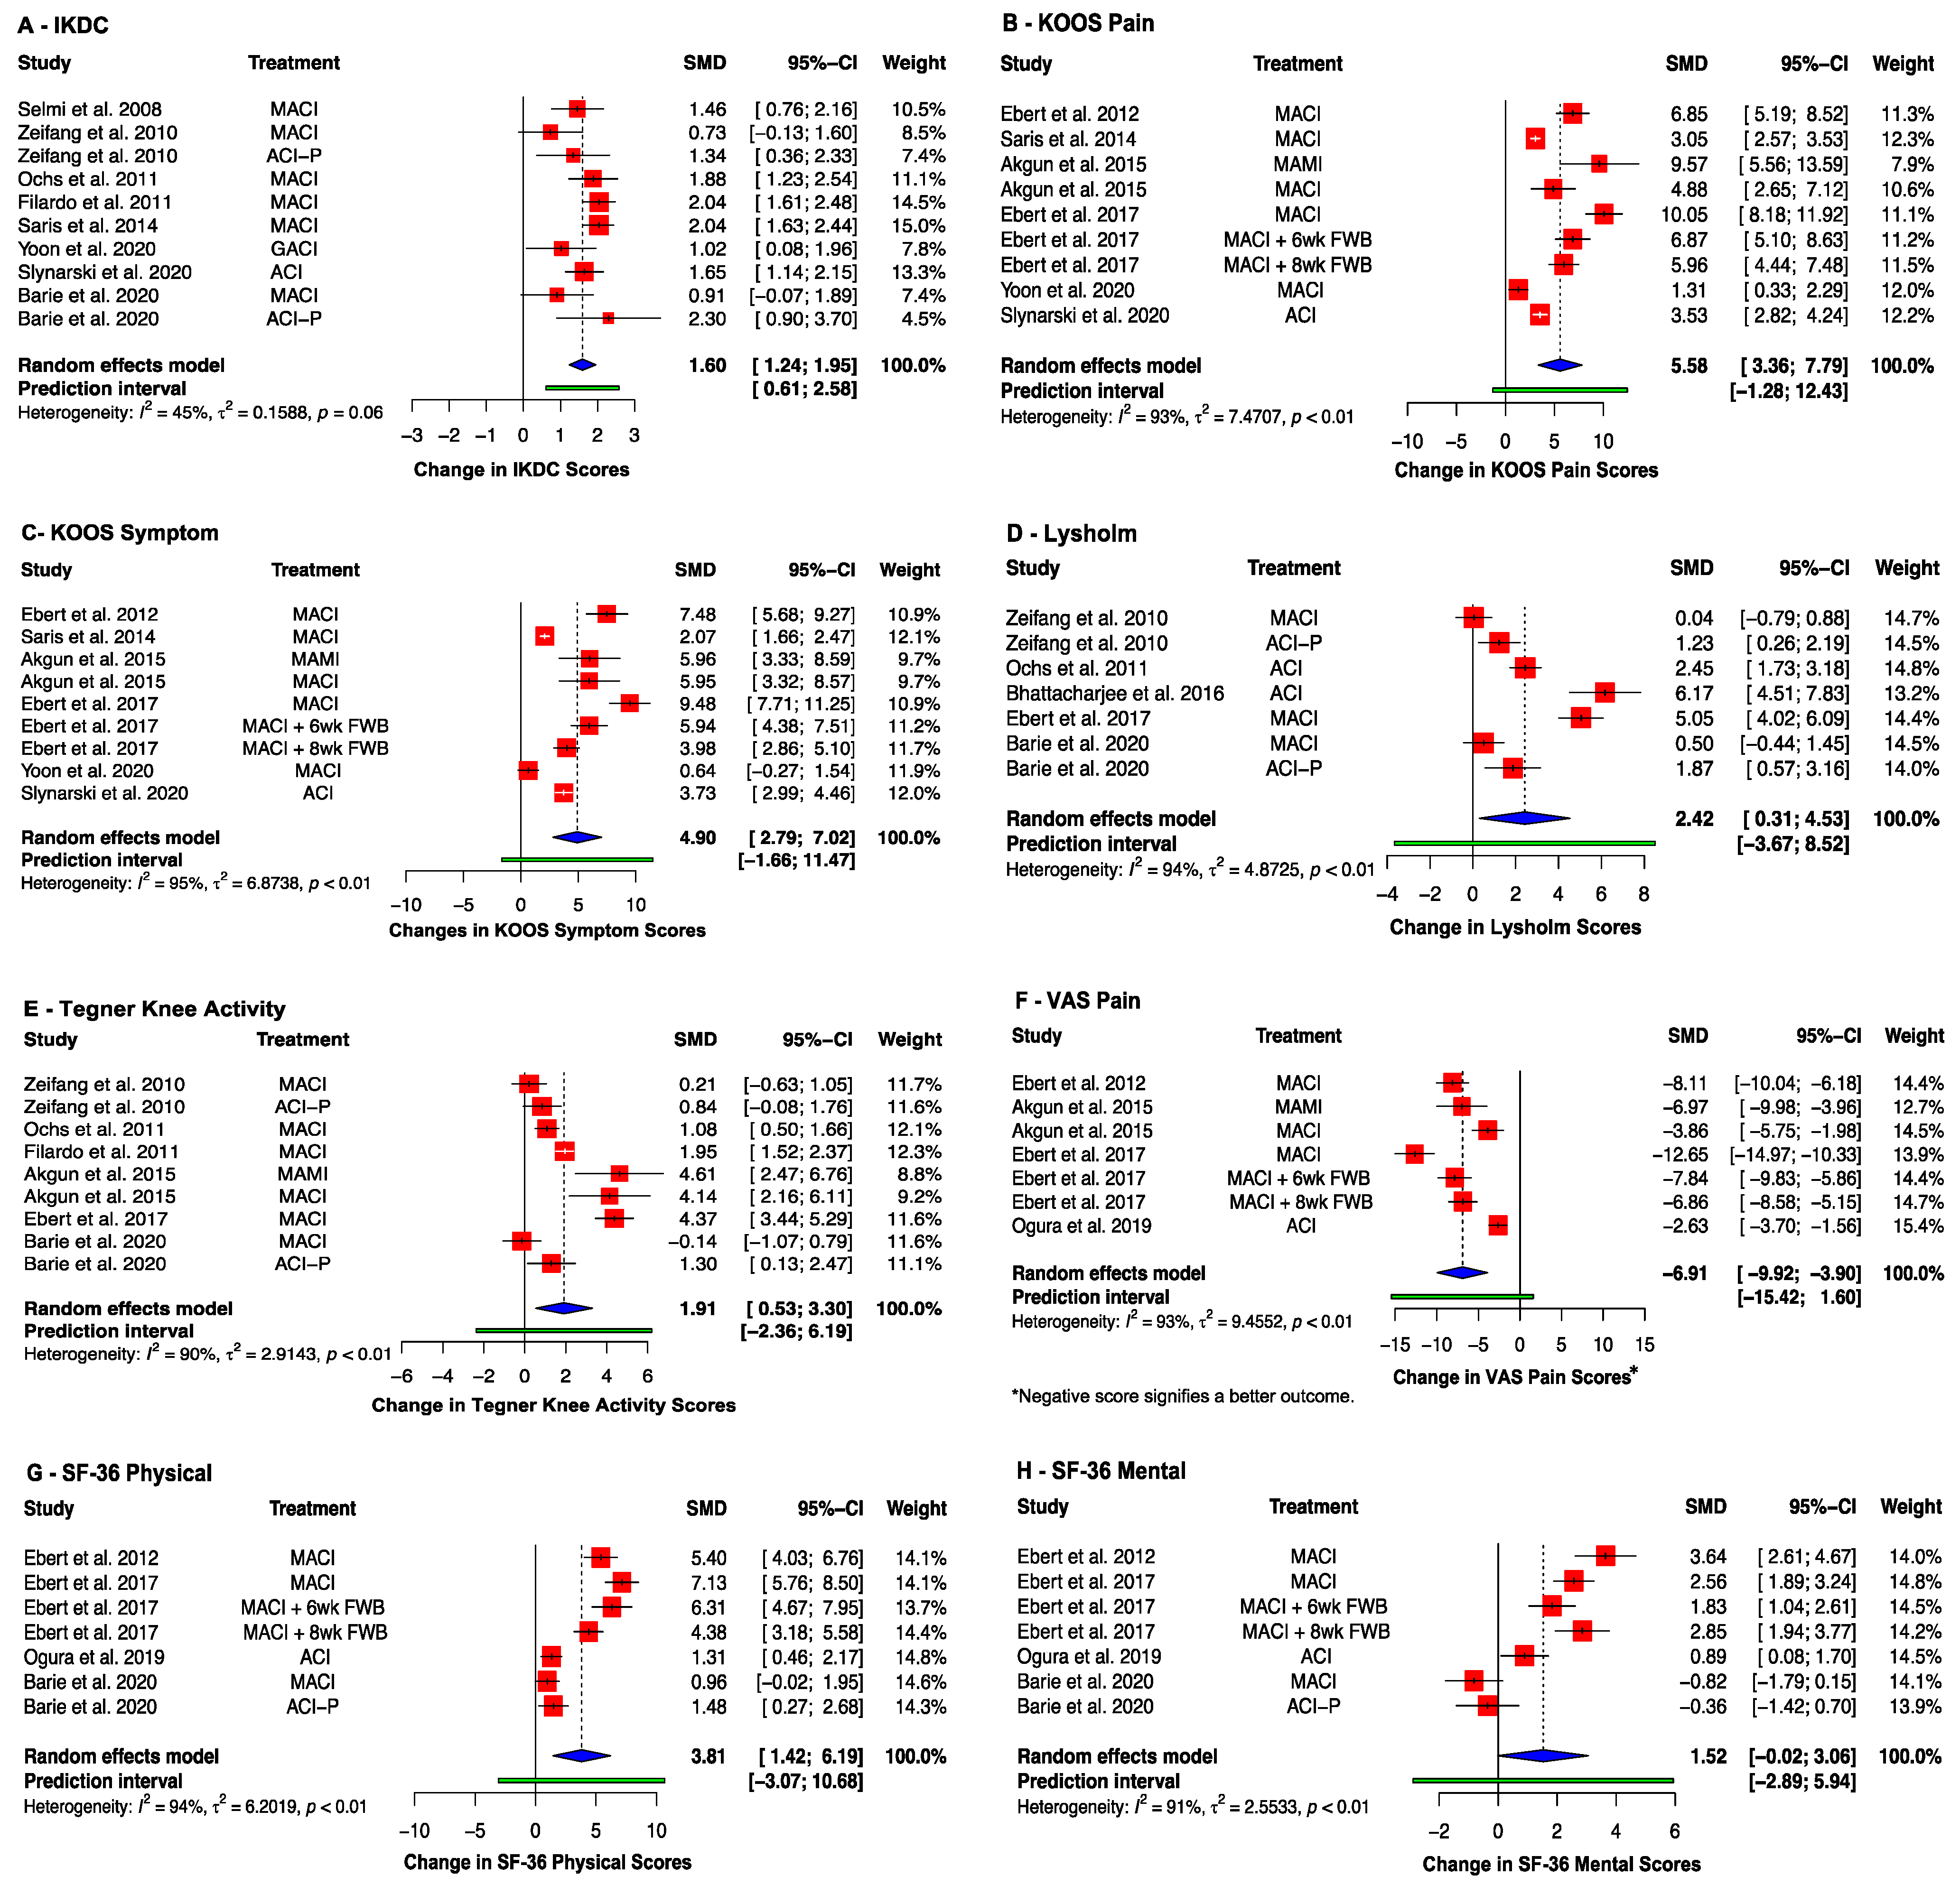
3.5. Clinical Outcomes
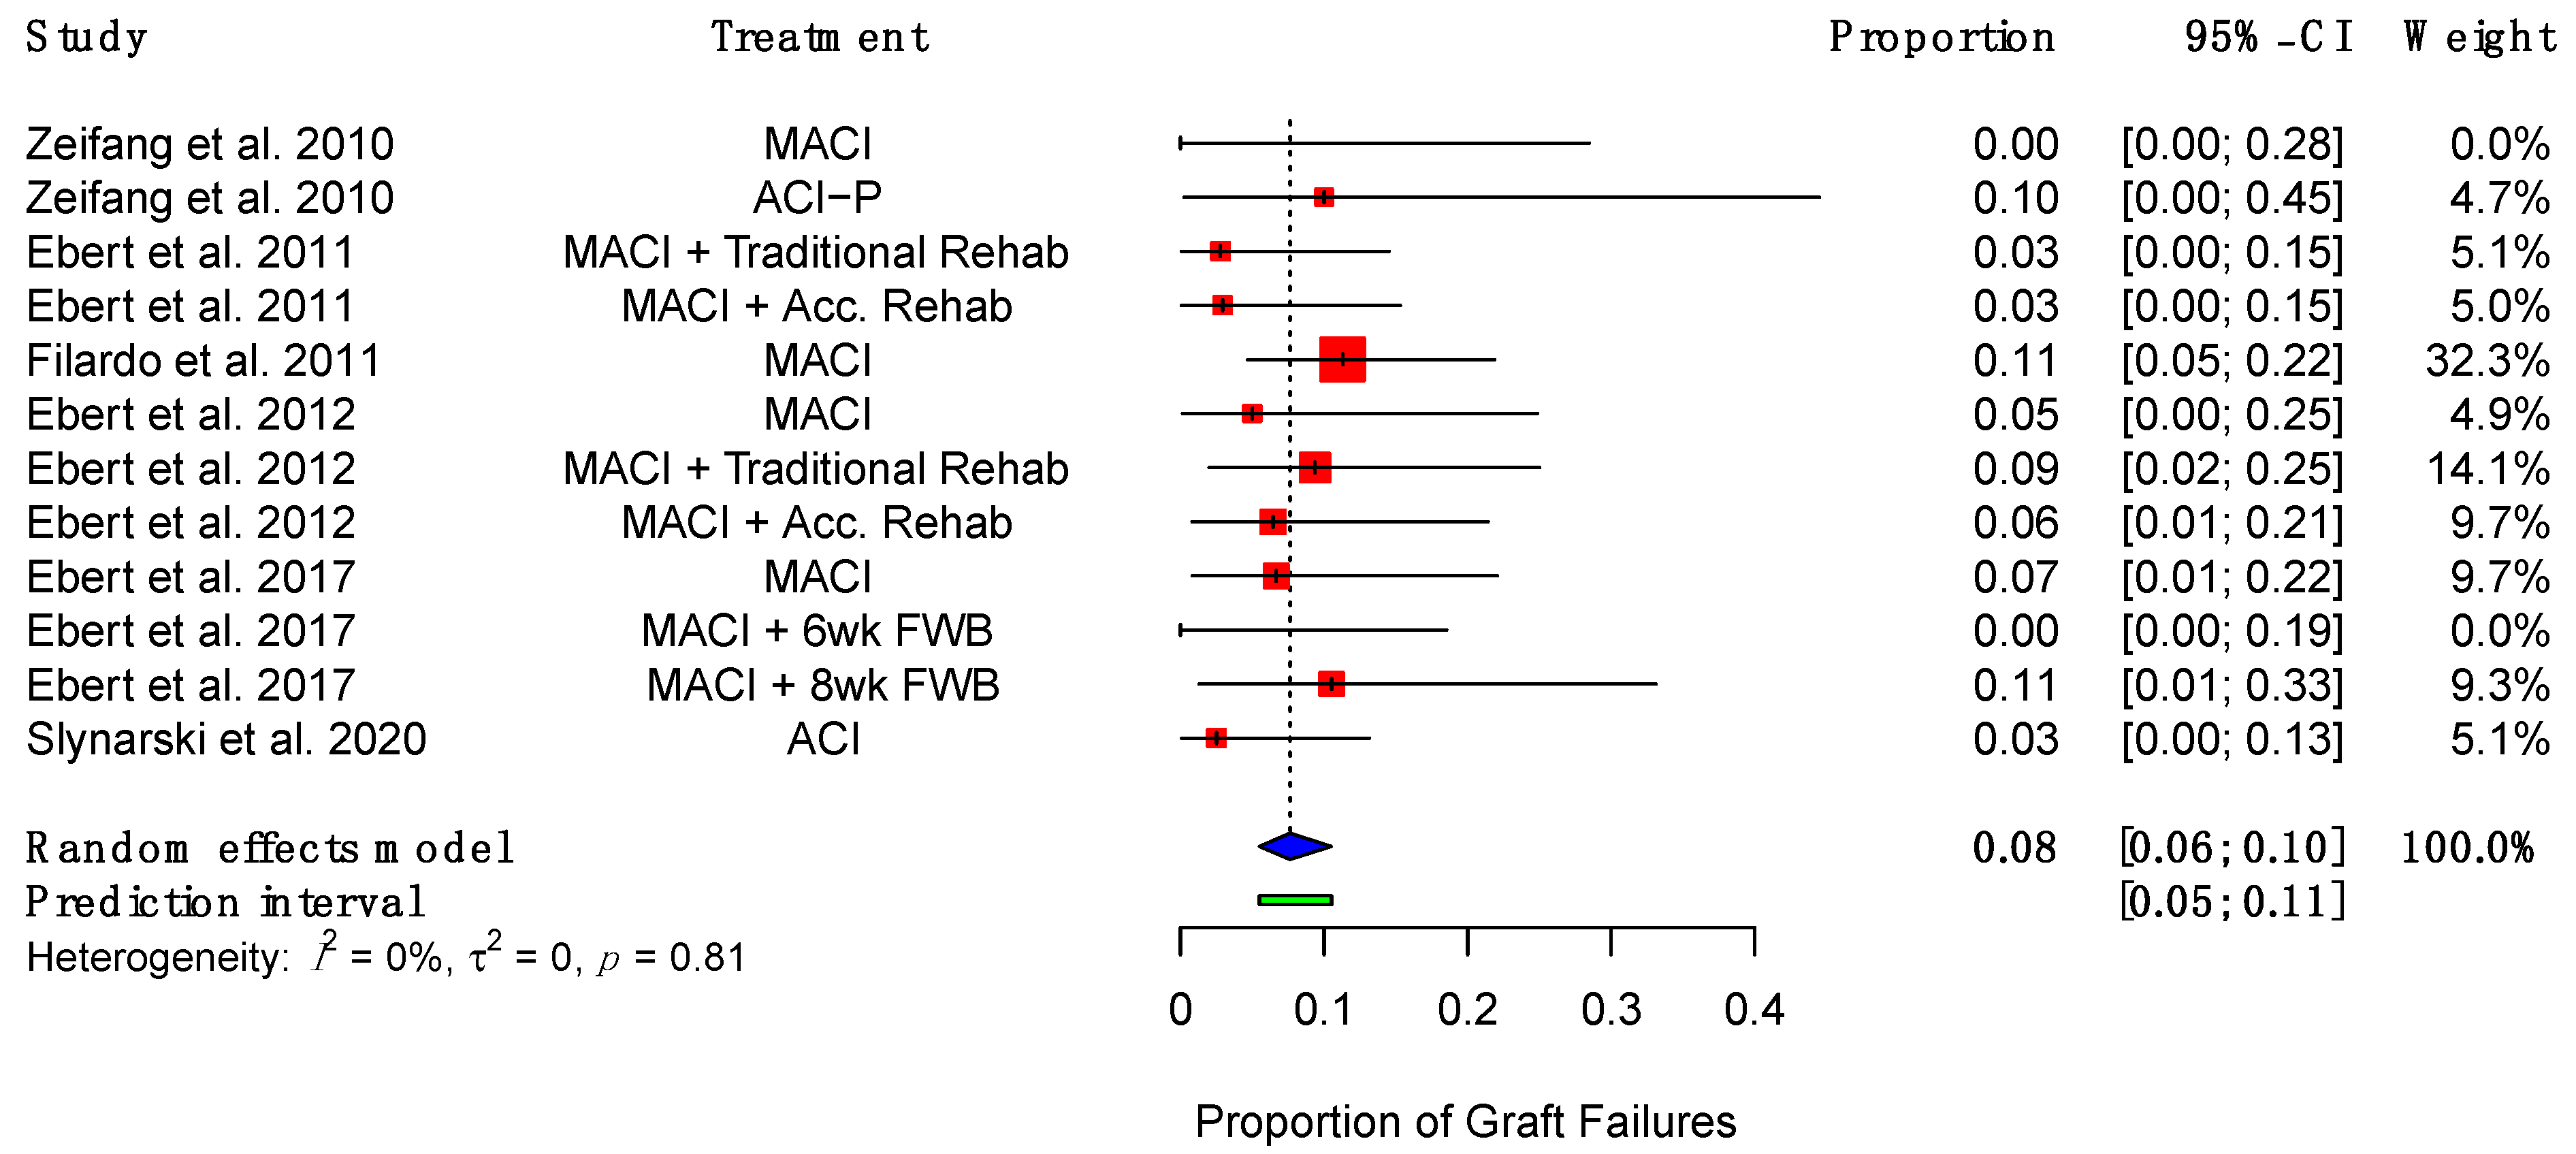
3.6. Graft Failure and Complications
3.7. Subgroup Meta-Analyses
3.8. Risk of Bias Assessment
4. Discussion
4.1. MRI as an Investigative Technique for Integration
4.2. Molecular Analysis for Optimal Scaffold and Source of Cells
4.3. Role of Arthroscopy and Histology
4.4. Long-Term Outcomes
4.5. Strengths and Limitations
5. Conclusions
Supplementary Materials
Author Contributions
Funding
Institutional Review Board Statement
Informed Consent Statement
Data Availability Statement
Conflicts of Interest
References
- Cross, M.; Smith, E.; Hoy, D.; Nolte, S.; Ackerman, I.; Fransen, M.; Bridgett, L.; Williams, S.; Guillemin, F.; Hill, C.L.; et al. The global burden of hip and knee osteoarthritis: Estimates from the global burden of disease 2010 study. Ann. Rheum. Dis. 2014, 73, 1323–1330. [Google Scholar] [CrossRef] [PubMed]
- Loza, E.; Lopez-Gomez, J.M.; Abasolo, L.; Maese, J.; Carmona, L.; Batlle-Gualda, E.; on behalf of the Artrocad Study Group. Economic burden of knee and hip osteoarthritis in Spain. Arthritis Care Res. 2009, 61, 158–165. [Google Scholar] [CrossRef] [PubMed]
- Bhandari, M.; Smith, J.; Miller, L.E.; Block, J.E. Clinical and economic burden of revision knee arthroplasty. Clin. Med. Insights Arthritis Musculoskelet. Disord. 2012, 5, 89–94. [Google Scholar] [CrossRef] [PubMed] [Green Version]
- Ackerman, I.N.; Bohensky, M.A.; Zomer, E.; Tacey, M.; Gorelik, A.; Brand, C.A.; de Steiger, R. The projected burden of primary total knee and hip replacement for osteoarthritis in Australia to the year 2030. BMC Musculoskelet. Disord. 2019, 20, 90. [Google Scholar] [CrossRef] [PubMed] [Green Version]
- Fransen, M.; McConnell, S.; Harmer, A.R.; Van der Esch, M.; Simic, M.; Bennell, K.L. Exercise for osteoarthritis of the knee: A Cochrane systematic review. Br. J. Sports Med. 2015, 49, 1554–1557. [Google Scholar] [CrossRef] [PubMed]
- Richards, M.M.; Maxwell, J.S.; Weng, L.; Angelos, M.G.; Golzarian, J. Intra-articular treatment of knee osteoarthritis: From anti-inflammatories to products of regenerative medicine. Physician Sportsmed. 2016, 44, 101–108. [Google Scholar] [CrossRef] [Green Version]
- Madry, H.; Kon, E.; Condello, V.; Peretti, G.M.; Steinwachs, M.; Seil, R.; Berruto, M.; Engebretsen, L.; Filardo, G.; Angele, P. Early osteoarthritis of the knee. Knee Surg. Sports Traumatol. Arthrosc. 2016, 24, 1753–1762. [Google Scholar] [CrossRef]
- Guermazi, A.; Hayashi, D.; Roemer, F.W.; Niu, J.; Quinn, E.K.; Crema, M.D.; Nevitt, M.C.; Torner, J.; Lewis, C.E.; Felson, D.T. Brief Report: Partial- and Full-Thickness Focal Cartilage Defects Contribute Equally to Development of New Cartilage Damage in Knee Osteoarthritis: The Multicenter Osteoarthritis Study. Arthritis Rheumatol. 2017, 69, 560–564. [Google Scholar] [CrossRef]
- Żylińska, B.; Silmanowicz, P.; Sobczyńska-Rak, A.; Jarosz, Ł.; Szponder, T. Treatment of Articular Cartilage Defects: Focus on Tissue Engineering. In Vivo 2018, 32, 1289–1300. [Google Scholar] [CrossRef] [Green Version]
- Lim, H.C.; Bae, J.H.; Song, S.H.; Park, Y.E.; Kim, S.J. Current treatments of isolated articular cartilage lesions of the knee achieve similar outcomes. Clin. Orthop. Relat. Res. 2012, 470, 2261–2267. [Google Scholar] [CrossRef] [Green Version]
- Gracitelli, G.C.; Moraes, V.Y.; Franciozi, C.; Luzo, M.V.; Belloti, J.C. Surgical interventions (microfracture, drilling, mosaicplasty, and allograft transplantation) for treating isolated cartilage defects of the knee in adults. Cochrane Database Syst. Rev. 2016, 9, CD010675. [Google Scholar] [CrossRef] [PubMed]
- Devitt, B.M.; Bell, S.W.; Webster, K.E.; Feller, J.A.; Whitehead, T.S. Surgical treatments of cartilage defects of the knee: Systematic review of randomised controlled trials. Knee 2017, 24, 508–517. [Google Scholar] [CrossRef] [PubMed]
- Brittberg, M.; Lindahl, A.; Nilsson, A.; Ohlsson, C.; Isaksson, O.; Peterson, L. Treatment of deep cartilage defects in the knee with autologous chondrocyte transplantation. N. Engl. J. Med. 1994, 331, 889–895. [Google Scholar] [CrossRef] [PubMed]
- Oldershaw, R.A. Cell sources for the regeneration of articular cartilage: The past, the horizon and the future. Int. J. Exp. Pathol. 2012, 93, 389–400. [Google Scholar] [CrossRef]
- Huang, B.J.; Hu, J.C.; Athanasiou, K.A. Cell-based tissue engineering strategies used in the clinical repair of articular cartilage. Biomaterials 2016, 98, 1–22. [Google Scholar] [CrossRef] [Green Version]
- Mistry, H.; Connock, M.; Pink, J.; Shyangdan, D.; Clar, C.; Royle, P.; Court, R.; Biant, L.; Metcalfe, A.; Waugh, N. Autologous chondrocyte implantation in the knee: Systematic review and economic evaluation. Health Technol. Assess. 2017, 21, 1–294. [Google Scholar] [CrossRef]
- Vasiliadis, H.S.; Wasiak, J. Autologous chondrocyte implantation for full thickness articular cartilage defects of the knee. Cochrane Database Syst. Rev. 2010, 2010, CD003323. [Google Scholar] [CrossRef]
- Gou, G.H.; Tseng, F.J.; Wang, S.H.; Chen, P.J.; Shyu, J.F.; Weng, C.F.; Pan, R.Y. Autologous Chondrocyte Implantation versus Microfracture in the Knee: A Meta-analysis and Systematic Review. Arthrosc. J. Arthrosc. Relat. Surg. 2020, 36, 289–303. [Google Scholar] [CrossRef] [Green Version]
- Le, H.; Xu, W.; Zhuang, X.; Chang, F.; Wang, Y.; Ding, J. Mesenchymal stem cells for cartilage regeneration. J. Tissue Eng. 2020, 11, 2041731420943839. [Google Scholar] [CrossRef]
- Goldberg, A.; Mitchell, K.; Soans, J.; Kim, L.; Zaidi, R. The use of mesenchymal stem cells for cartilage repair and regeneration: A systematic review. J. Orthop. Surg. Res. 2017, 12, 39. [Google Scholar] [CrossRef] [Green Version]
- Gopal, K.; Amirhamed, H.A.; Kamarul, T. Advances of human bone marrow-derived mesenchymal stem cells in the treatment of cartilage defects: A systematic review. Exp. Biol. Med. 2014, 239, 663–669. [Google Scholar] [CrossRef] [PubMed]
- Borakati, A.; Mafi, R.; Mafi, P.; Khan, W.S. A Systematic Review and Meta-Analysis of Clinical Trials of Mesenchymal Stem Cell Therapy for Cartilage Repair. Curr. Stem Cell Res. Ther. 2018, 13, 215–225. [Google Scholar] [CrossRef] [PubMed]
- Pabbruwe, M.; Esfandiari, E.; Kafienah, W.; Tarlton, J.; Hollander, A.P. Induction of cartilage integration by a chondrocyte/collagen-scaffold implant. Biomaterials 2009, 30, 4277–4286. [Google Scholar] [CrossRef] [PubMed] [Green Version]
- Theodoropoulos, J.S.; De Croos, J.N.A.; Park, S.S.; Pilliar, R.; Kandel, R.A. Integration of tissue-engineered cartilage with host cartilage: An in vitro model. Clin. Orthop. Relat. Res. 2011, 469, 2785–2795. [Google Scholar] [CrossRef] [Green Version]
- Fujie, H.; Nansai, R.; Ando, W.; Shimomura, K.; Moriguchi, Y.; Hart, D.A.; Nakamura, N. Zone-specific integrated cartilage repair using a scaffold-free tissue engineered construct derived from allogenic synovial mesenchymal stem cells: Biomechanical and histological assessments. J. Biomech. 2015, 48, 4101–4108. [Google Scholar] [CrossRef]
- Crema, M.D.; Roemer, F.W.; Marra, M.D.; Burstein, D.; Gold, G.E.; Eckstein, F.; Baum, T.; Mosher, T.; Carrino, J.A.; Guermazi, A. Articular cartilage in the knee: Current mr imaging techniques and applications in clinical practice and research. Radiographics 2011, 31, 37–61. [Google Scholar] [CrossRef] [Green Version]
- Page, M.J.; McKenzie, J.E.; Bossuyt, P.M.; Boutron, I.; Hoffmann, T.C.; Mulrow, C.D.; Shamseer, L.; Tetzlaff, J.M.; Akl, E.A.; Brennan, S.E.; et al. The PRISMA 2020 statement: An updated guideline for reporting systematic reviews. BMJ 2021, 372, n71. [Google Scholar] [CrossRef]
- Ouzzani, M.; Hammady, H.; Fedorowicz, Z.; Elmagarmid, A. Rayyan—A web and mobile app for systematic reviews. Syst. Rev. 2016, 5, 210. [Google Scholar] [CrossRef] [Green Version]
- Methley, A.M.; Campbell, S.; Chew-Graham, C.; McNally, R.; Cheraghi-Sohi, S. PICO, PICOS and SPIDER: A comparison study of specificity and sensitivity in three search tools for qualitative systematic reviews. BMC Health Serv. Res. 2014, 14, 579. [Google Scholar] [CrossRef] [Green Version]
- Migliorini, F.; Maffulli, N.; Eschweiler, J.; Driessen, A.; Tingart, M.; Baroncini, A. Reliability of the MOCART score: A systematic review. J. Orthop. Traumatol. 2021, 22, 39. [Google Scholar] [CrossRef]
- Schreiner, M.M.; Raudner, M.; Marlovits, S.; Bohndorf, K.; Weber, M.; Zalaudek, M.; Röhrich, S.; Szomolanyi, P.; Filardo, G.; Windhager, R.; et al. The MOCART (Magnetic Resonance Observation of Cartilage Repair Tissue) 2.0 Knee Score and Atlas. Cartilage 2019, 13, 571S–587S. [Google Scholar] [CrossRef] [PubMed] [Green Version]
- Wan, X.; Wang, W.; Liu, J.; Tong, T. Estimating the sample mean and standard deviation from the sample size, median, range and/or interquartile range. BMC Med. Res. Methodol. 2014, 14, 135. [Google Scholar] [CrossRef] [PubMed] [Green Version]
- Higgins, J.P.T.; Thompson, S.G. Quantifying heterogeneity in a meta-analysis. Stat. Med. 2002, 21, 1539–1558. [Google Scholar] [CrossRef] [PubMed]
- Cochran, W.G. Some Methods for Strengthening the Common χ2 Tests. Biometrics 1954, 10, 417. [Google Scholar] [CrossRef]
- Sterne, J.A.C.; Savović, J.; Page, M.J.; Elbers, R.G.; Blencowe, N.S.; Boutron, I.; Cates, C.J.; Cheng, H.Y.; Corbett, M.S.; Eldridge, S.M.; et al. RoB 2: A revised tool for assessing risk of bias in randomised trials. BMJ 2019, 366, l4898. [Google Scholar] [CrossRef] [PubMed] [Green Version]
- Sterne, J.A.C.; Hernán, M.A.; Reeves, B.C.; Savović, J.; Berkman, N.D.; Viswanathan, M.; Henry, D.; Altman, D.G.; Ansari, M.T.; Boutron, I.; et al. ROBINS-I: A tool for assessing risk of bias in non-randomised studies of interventions. BMJ 2016, 355, i4919. [Google Scholar] [CrossRef] [PubMed] [Green Version]
- McGuinness, L.A.; Higgins, J.P.T. Risk-of-bias VISualization (robvis): An R package and Shiny web app for visualizing risk-of-bias assessments. Res. Synth. Methods 2021, 12, 55–61. [Google Scholar] [CrossRef] [PubMed]
- Ebert, J.R.; Fallon, M.; Robertson, W.B.; Lloyd, D.G.; Zheng, M.; Wood, D.J.; Ackland, T. Radiological Assessment of Accelerated versus Traditional Approaches to Postoperative Rehabilitation following Matrix-Induced Autologous Chondrocyte Implantation. Cartilage 2010, 2, 60–72. [Google Scholar] [CrossRef] [Green Version]
- Ebert, J.R.; Fallon, M.; Zheng, M.H.; Wood, D.J.; Ackland, T.R. A randomized trial comparing accelerated and traditional approaches to postoperative weightbearing rehabilitation after matrix-induced autologous chondrocyte implantation: Findings at 5 years. Am. J. Sports Med. 2012, 40, 1527–1537. [Google Scholar] [CrossRef]
- Zeifang, F.; Oberle, D.; Nierhoff, C.; Richter, W.; Moradi, B.; Schmitt, H. Autologous chondrocyte implantation using the original periosteum-cover technique versus matrix-associated autologous chondrocyte implantation: A randomized clinical trial. Am. J. Sports Med. 2010, 38, 924–933. [Google Scholar] [CrossRef]
- Barié, A.; Kruck, P.; Sorbi, R.; Rehnitz, C.; Oberle, D.; Walker, T.; Zeifang, F.; Moradi, B. Prospective Long-term Follow-up of Autologous Chondrocyte Implantation with Periosteum versus Matrix-Associated Autologous Chondrocyte Implantation: A Randomized Clinical Trial. Am. J. Sports Med. 2020, 48, 2230–2241. [Google Scholar] [CrossRef] [PubMed]
- Akgun, I.; Unlu, M.C.; Erdal, O.A.; Ogut, T.; Erturk, M.; Ovali, E.; Kantarci, F.; Caliskan, G.; Akgun, Y. Matrix-induced autologous mesenchymal stem cell implantation versus matrix-induced autologous chondrocyte implantation in the treatment of chondral defects of the knee: A 2-year randomized study. Arch. Orthop. Trauma. Surg. 2015, 135, 251–263. [Google Scholar] [CrossRef] [PubMed]
- Ochs, B.G.; Müller-Horvat, C.; Albrecht, D.; Schewe, B.; Weise, K.; Aicher, W.K.; Rolauffs, B. Remodeling of articular cartilage and subchondral bone after bone grafting and matrix-associated autologous chondrocyte implantation for osteochondritis dissecans of the knee. Am. J. Sports Med. 2010, 39, 764–773. [Google Scholar] [CrossRef] [PubMed]
- Bhattacharjee, A.; McCarthy, H.; Tins, B.; Roberts, S.; Kuiper, J.; Harrison, P.E.; Richardson, J.B. Autologous Bone Plug Supplemented with Autologous Chondrocyte Implantation in Osteochondral Defects of the Knee. Am. J. Sports Med. 2016, 44, 1249–1259. [Google Scholar] [CrossRef] [PubMed]
- Ogura, T.; Merkely, G.; Bryant, T.; Winalski, C.S.; Minas, T. Autologous Chondrocyte Implantation “Segmental-Sandwich” Technique for Deep Osteochondral Defects in the Knee: Clinical Outcomes and Correlation with Magnetic Resonance Imaging Findings. Orthop. J. Sports Med. 2019, 7, 2325967119847173. [Google Scholar] [CrossRef]
- Yoon, T.H.; Jung, M.; Choi, C.H.; Kim, H.S.; Lee, Y.H.; Choi, Y.S.; Kim, S.J.; Kim, S.H. Arthroscopic gel-type autologous chondrocyte implantation presents histologic evidence of regenerating hyaline-like cartilage in the knee with articular cartilage defect. Knee Surg. Sports Traumatol. Arthrosc. 2019, 28, 941–951. [Google Scholar] [CrossRef]
- Saris, D.; Price, A.; Widuchowski, W.; Bertrand-Marchand, M.; Caron, J.; Drogset, J.O.; Emans, P.; Podskubka, A.; Tsuchida, A.; Kili, S.; et al. Matrix-Applied Characterized Autologous Cultured Chondrocytes versus Microfracture: Two-Year Follow-up of a Prospective Randomized Trial. Am. J. Sports Med. 2014, 42, 1384–1394. [Google Scholar] [CrossRef]
- Słynarski, K.; de Jong, W.C.; Snow, M.; Hendriks, J.A.A.; Wilson, C.E.; Verdonk, P. Single-Stage Autologous Chondrocyte-Based Treatment for the Repair of Knee Cartilage Lesions: Two-Year Follow-up of a Prospective Single-Arm Multicenter Study. Am. J. Sports Med. 2020, 48, 1327–1337. [Google Scholar] [CrossRef]
- Ebert, J.R.; Fallon, M.; Wood, D.J.; Janes, G. A Prospective Clinical and Radiological Evaluation at 5 Years after Arthroscopic Matrix-Induced Autologous Chondrocyte Implantation. Am. J. Sports Med. 2017, 45, 59–69. [Google Scholar] [CrossRef] [Green Version]
- Marlovits, S.; Striessnig, G.; Kutscha-Lissberg, F.; Resinger, C.; Aldrian, S.M.; Vécsei, V.; Trattnig, S. Early postoperative adherence of matrix-induced autologous chondrocyte implantation for the treatment of full-thickness cartilage defects of the femoral condyle. Knee Surg. Sports Traumatol. Arthrosc. 2004, 13, 451–457. [Google Scholar] [CrossRef]
- Selmi, T.A.; Verdonk, P.; Chambat, P.; Dubrana, F.; Potel, J.F.; Barnouin, L.; Neyret, P. Autologous chondrocyte implantation in a novel alginate-agarose hydrogel: Outcome at two years. J. Bone Jt. Surg. Br. 2008, 90, 597–604. [Google Scholar] [CrossRef] [PubMed]
- Filardo, G.; Kon, E.; Di Martino, A.; Iacono, F.; Marcacci, M. Arthroscopic second-generation autologous chondrocyte implantation: A prospective 7-year follow-up study. Am. J. Sports Med. 2011, 39, 2153–2160. [Google Scholar] [CrossRef] [PubMed]
- Ebert, J.R.; Fallon, M.; Ackland, T.; Wood, D.J.; Janes, G. Arthroscopic matrix-induced autologous chondrocyte implantation: 2-year outcomes. Arthrosc. J. Arthrosc. Relat. Surg. 2012, 28, 952–964. [Google Scholar] [CrossRef] [PubMed]
- Ebert, J.R.; Edwards, P.; Fallon, M.; Ackland, T.; Janes, G.; Wood, D.J. Two-Year Outcomes of a Randomized Trial Investigating a 6-Week Return to Full Weightbearing after Matrix-Induced Autologous Chondrocyte Implantation. Am. J. Sports Med. 2017, 45, 838–848. [Google Scholar] [CrossRef] [PubMed]
- Marcacci, M.; Zaffagnini, S.; Kon, E.; Visani, A.; Iacono, F.; Loreti, I. Arthroscopic autologous chondrocyte transplantation: Technical note. Knee Surg. Sports Traumatol. Arthrosc. 2002, 10, 154–159. [Google Scholar] [CrossRef] [PubMed]
- Cavinatto, L.; Hinckel, B.B.; Tomlinson, R.E.; Gupta, S.; Farr, J.; Bartolozzi, A.R. The role of bone marrow aspirate concentrate for the treatment of focal chondral lesions of the knee: A systematic review and critical analysis of animal and clinical studies. Arthrosc. J. Arthrosc. Relat. Surg. 2019, 35, 1860–1877. [Google Scholar] [CrossRef]
- Filardo, G.; Madry, H.; Jelic, M.; Roffi, A.; Cucchiarini, M.; Kon, E. Mesenchymal stem cells for the treatment of cartilage lesions: From preclinical findings to clinical application in orthopaedics. Knee Surg. Sports Traumatol. Arthrosc. 2013, 21, 1717–1729. [Google Scholar] [CrossRef]
- Makris, E.A.; Gomoll, A.H.; Malizos, K.N.; Hu, J.C.; Athanasiou, K.A. Repair and tissue engineering techniques for articular cartilage. Nat. Rev. Rheumatol. 2015, 11, 21–34. [Google Scholar] [CrossRef]
- von Hippel, P.T. The heterogeneity statistic I2 can be biased in small meta-analyses. BMC Med. Res. Methodol. 2015, 15, 35. [Google Scholar] [CrossRef] [Green Version]
- Goyal, D.; Goyal, A.; Keyhani, S.; Lee, E.H.; Hui, J.H. Evidence-based status of second- and third-generation autologous chondrocyte implantation over first generation: A systematic review of level I and II studies. Arthrosc. J. Arthrosc. Relat. Surg. 2013, 29, 1872–1878. [Google Scholar] [CrossRef]
- Martinčič, D.; Mekač, J.; Drobnič, M. Survival Rates of Various Autologous Chondrocyte Grafts and Concomitant Procedures. A Prospective Single-Center Study over 18 Years. Cell Transplant. 2019, 28, 1439–1444. [Google Scholar] [CrossRef] [PubMed] [Green Version]
- Migliorini, F.; Berton, A.; Salvatore, G.; Candela, V.; Khan, W.; Longo, U.G.; Denaro, V. Autologous Chondrocyte Implantation and Mesenchymal Stem Cells for the Treatments of Chondral Defects of the Knee—A Systematic Review. Curr. Stem Cell Res. Ther. 2020, 15, 547–556. [Google Scholar] [CrossRef] [PubMed]
- Zheng, M.H.; King, E.; Kirilak, Y.; Huang, L.; Papadimitriou, J.M.; Wood, D.J.; Xu, J. Molecular characterisation of chondrocytes in autologous chondrocyte implantation. Int. J. Mol. Med. 2004, 13, 623–628. [Google Scholar] [CrossRef]
- Park, Y.B.; Ha, C.W.; Rhim, J.H.; Lee, H.J. Stem Cell Therapy for Articular Cartilage Repair: Review of the Entity of Cell Populations Used and the Result of the Clinical Application of Each Entity. Am. J. Sports Med. 2018, 46, 2540–2552. [Google Scholar] [CrossRef] [PubMed]
- Brittberg, M. Cell carriers as the next generation of cell therapy for cartilage repair: A review of the matrix-induced autologous chondrocyte implantation procedure. Am. J. Sports Med. 2010, 38, 1259–1271. [Google Scholar] [CrossRef] [PubMed]
- Zhang, M.; Min, Z.; Rana, N.; Liu, H. Accuracy of magnetic resonance imaging in grading knee chondral defects. Arthrosc. J. Arthrosc. Relat. Surg. 2013, 29, 349–356. [Google Scholar] [CrossRef] [PubMed]
- Roberts, S.; Menage, J.; Sandell, L.; Evans, E.; Richardson, J. Immunohistochemical study of collagen types I and II and procollagen IIA in human cartilage repair tissue following autologous chondrocyte implantation. Knee 2009, 16, 398–404. [Google Scholar] [CrossRef] [Green Version]


| Domain | Inclusion Criteria | Exclusion Criteria |
|---|---|---|
| Population | Studies with human patients of any age, gender and ethnicity who have focal chondral defects of the tibiofemoral joint. | Studies with patients who have diffuse osteoarthritis. Studies conducted on animals or cadavers. Ex vivo, in vitro and in silico studies. |
| Intervention | Studies that use implants made with autologous chondrocytes or mesenchymal stem cells. Studies using cell-seeded scaffolds. | Studies that do not use implants, intra-articular injection or cell-free scaffolds. |
| Comparison | Studies that compare use of implant to cell-free therapies such as microfracture. | None |
| Outcome | Studies that describe the integration between the novel and native cartilage. | Studies where the outcomes of tibiofemoral and patellofemoral defects cannot be differentiated. Studies that do not have a measuring or scoring system for integration. Studies that do not report integration separately. |
| Study Type | English with full text available. Sample size greater than 10 patients. | Case report, case series with fewer than 10 patients and review article. |
| Author | Study Design | Cohort Size | Mean Age (Years) | Sex (% Male) | Defect Location | Mean Defect Surface Area (cm2) or Diameter (cm) | Intervention | Scaffold Composition | Cell Number/Density in Scaffold | Follow-Up |
|---|---|---|---|---|---|---|---|---|---|---|
| Marlovits et al., 2005 [50] | Prospective case series | 16 | 33.1 (range 20.1–44.3) | 93.8 | MFC: 10/16, LFC: 6/16 | 4.70 ± 2.30 | MACI | Type I/III collagen membrane | 15–20 million cells | Mean 34.7 days post-operation, range 22–47 days |
| Selmi et al., 2008 [51] | Prospective case series, multi-center | 20 | 30.0 (range 17.0–42.0) | 71.5 | Not Specified | 3.00 (range 1.00–5.10) | MACI | Agarose-alginate hydrogel scaffold (CARTIPATCH; Tissue Bank of France, Lyon, France) | 10 million cells/mL of hydrogel | 3, 6, 12, 24 months |
| Zeifang et al., 2010 [40] | RCT | 11 | 29.1 ± 7.5 | 54.5 | MFC: 18/21, LFC: 3/21 | 4.30 ± 1.1 | MACI | Polyglactin 910 and poly-p-dioxanon | 20 million cells | 3, 6, 12, 24 months |
| 10 | 29.5 ± 11.1 | 100 | 4.10 ± 0.90 | ACI-P | N/A | 15 million chondrocytes/500 μL suspension | ||||
| Ebert et al., 2011 [38] | RCT | 35 | 39.8 (range 16.0–63.0) | 62.9 | MFC: 26/35, LFC: 9/35 | 3.31 (range 0.75–10.0) | MACI & Traditional rehabilitation | Type I/III collagen membrane (ACI-Maix Matricel GmbH, Germany) | Not Reported | 3, 12, 24 months |
| 34 | 36.3 (range 21.0–62.0) | 64.7 | MFC: 26/34, LFC: 8/34 | 3.22 (range 0.65–10.0) | MACI & Accelerated rehabilitation | |||||
| Ochs et al., 2011 [43] | Prospective case series | 26 | Not Reported | 69.2 | MFC: 22/26, LFC: 4/26 | 5.30 ± 2.30 | MACI | Novocart 3D, a bilayer collagen type I sponge with chondroitin sulfate and a bone graft (TETEC AG, Reutlingen, Germany): | Not Reported | 39.8 ± 12.0 months |
| Filardo et al., 2011 [52] | Prospective case series | 62 | 28.1 ± 11.4 | 77.4 | MFC: 45/62, LFC: 17/62 | 2.50 ± 1.00 | MACI | Hyalograft C (Fidia Advanced Biopolymers Laboratories, Padova, Italy), a benzylic ester of hyaluronic acid (HYAFF 11) | Not Reported | 1, 2, 3, 4, 5, 6, 7 years |
| Ebert et al., 2012 [53] | Prospective case series | 20 | 34.0 (range 16.0–57.0) | 50.0 | MFC: 11/20, LFC: 3/20, MTP: 2/20, LTP: 4/20 | 2.72 (range 1.00–5.00) | MACI | Type I/III collagen membrane (ACI-Maix; Matricel GmbH, Herzogenrath, Germany) | Not Reported | 3, 12, 24 months |
| Ebert et al., 2012 [39] | RCT | 32 | 39.8 (range 16.0 to 63.0) | 62.9 | MFC: 26/32, LFC: 9/32 | 3.31 (range 0.75–10.0) | MACI & Traditional rehabilitation | Type I/III collagen membrane (ACI-Maix Matricel GmbH, Germany) | Not Reported | 5 years |
| 31 | 36.6 (range 21.0–62.0) | 64.7 | MFC: 26/31, LFC: 8/31 | 3.22 (range 0.65–10.0) | MACI & Traditional rehabilitation | |||||
| Saris et al., 2014 [47] | RCT | 72 | 34.8 ± 9.8 | 62.5 | MFC: 54/72, LFC: 13/72, T: 5/72 | 34.8 ± 9.20 | MACI | Porcine-derived collagen type I/III membrane | 500,000–1 million cells/cm2 | 24 months |
| 72 | 32.9 ± 8.8 | 66.7 | MFC: 53/72, LFC: 15/72, T: 4/72 | 32.9 ± 8.80 | Microfracture | N/A | N/A | |||
| Akgun et al., 2015 [42] | RCT | 7 | 32.3 ± 7.9 | 57.1 | MFC: 5, LFC: 2 | 2.90 ± 0.80 | MAMI: Synovium-derived MSCs, CD105+, CD73+, CD90+ | Type I/III- collagen (Chondro-Gide®; Geitschlich Biomaterials) | Not Reported | |
| 7 | 32.7 ± 10.4 | 57.1 | MFC: 5, LFC: 2 | 3.00 ± 0.80 | MACI: Cartilage-derived chondrocytes, CD44+, CD73+ | Type I/III collagen (Chondro-Gide®; Geitschlich Biomaterials) | Not Reported | 3, 6, 12, 24 months | ||
| Bhattacharjee et al., 2016 [44] | Prospective case series | 17 | 27.0 ± 7.0 | Not Reported | MFC: 15/17, LFC: 2/17 | 4.50 ± 2.60 | ACI, OsPlug technique | Autologous bone graft and ACI in serum injected under a periosteal or collagen cover | Not Reported | 1 and 5 years |
| Ebert et al., 2017 [49] | Prospective case series | 31 | 35.3 (range 16.0–57.0) | 48.4 | MFC: 18/31, LFC: 7/31, MTP: 2/31, LTP: 4/31 | 2.52 (range: 1.00–5.00) | MACI | Type I/III collagen membrane (ACI-Maix Matricel GmbH, Germany) | Not Reported | 3 and 6 months, 1, 2, and 5 years |
| Ebert et al., 2017 [54] | RCT | 18 | 36.4 (range 21.0–55.0) | 50.0 | MFC: 13/18, LFC: 5/18 | 3.15 (range: 1.00–6.25) | MACI and 6-week return to full weight-bearing | Type I/III collagen membrane (ACI-Maix Matricel GmbH, Germany) | Not Reported | 4 and 8 weeks, 3, 6, 12, and 24 months |
| 19 | 36.4 (range 23.0–53.0) | 63.0 | MFC: 14/19, LFC: 5/19 | 2.89 (range, 1.00–7.70) | MACI and 8-week return to full weight-bearing | Type I/III collagen membrane (ACI-Maix Matricel GmbH, Germany) | Not Reported | |||
| Ogura et al., 2019 [45] | Prospective case series | 13 | 26.0 (range 16.0–42.0) | 76.9 | MFC: 8/13, T: 5/13 | 6.40 (range, 1.50–13.5) | ACI, segmental sandwich technique | Bone graft, periosteal patch glued with Tisseel fibrin glue (Baxter BioSurgery): 5/13, or porcine type I/III bilayer collagen membrane (Bio-Gide; Geistlich Pharma): 8/13, and ACI injected between two membrane layers | Not Reported | Mean: 7.8 ± 3.0 years, range: 2–15 years |
| Yoon et al., 2020 [46] | Prospective case series | 10 | 40.3 ± 10.3 | 50.0 | MFC: 6/10, T: 3/10, LTP: 1/10 | 2.90 ± 1.20 | GACI | Gel composed of 1 ml fibrinogen and 0.1–0.2 ml thrombin | 24–30 million cells/2 mL | 3, 6, 12 and 24. 5 years for clinical outcomes |
| Słynarski et al., 2020 [48] | Prospective case series | 40 | 35.2 (range 20.0–53.0) | 70.0 | MFC: 24/40, LFC 9/40, T: 5/40, MFC/T: 2/40 | 2.09 (range 1.00–3.24) | ACI combined with bone marrow mononucleated cells | Polyethylene glycol terephthalate and polybutylene terephthalate copolymer | 30 million cells/cm3 | 3, 6, 12, 18 and 24 months |
| Barié et al., 2020 [41] | RCT | 9 | 30.4 ± 6.8 | 44.4 | MFC: 8/9, LFC: 1/9 | 4.27 ± 0.20 | MACI | Fibrin combined with polyglactin 910 and poly-p-dioxanon scaffold | 20 million cells/scaffold | 12 and 24 months and longest follow-up (mean: 9.6 ± 0.9 years) |
| 7 | 28.8 ± 9.1 | 100.0 | MFC: 7/7 | 4.08 ± 0.44 | ACI-P | N/A | 20 million cells/500μL suspension | 12 and 24 months and longest follow-up (mean: 8.6 ± 0.8 years) |
| Author | Number of Participants | Scoring System | Results | p |
|---|---|---|---|---|
| Marlovits et al., 2005 [50] | 16 | MRI evaluation of cartilage interface | Completely attached: 14/16 (87.5%), partially attached: 1/16 (6.25%), detached: 1/16 (6.25%) | Not assessed |
| Selmi et al., 2008 [51] | 15 | MRI evaluation of cartilage interface | Transition zone of repair tissue with adjacent normal cartilage smooth: 13/15 (86.7%), repair tissue no longer distinguished from adjacent normal cartilage: 11/15 (73.3%) | Not assessed |
| 13 | Arthroscopy: macroscopic ICRS assessment | Complete integration: 9/13 (69.2%), 75% of peripheral margin integrated: 2/13 (15.4%), 50% of peripheral margin integrated: 2/13 (14.4%) | Not assessed | |
| Zeifang et al., 2010 [40] | 8 (MACI) | Overall mean MOCART, lower score corresponds to more normal MRI | 6 months: 7.0 ± 2.7, 12 months: 6.3 ± 3.5, 24 months (n = 7): 6.3± 3.0 | (m-ACI vs ACI-P) 6 months: p = 0.0123, 12 months: p = 0.02065, 24 months: p = 0.6926 |
| MOCART border zone integration | Complete integration at 6 months: 2/8 (25.0%), complete integration at 12 months: 3/8 (37.5%) | Not assessed | ||
| 9 (ACI-P) | Overall mean MOCART, lower score corresponds to more normal MRI | 6 months: 10.3 ± 1.6, 12 months: 8.4 ± 2.2, 24 months (n = 11): 6.8 ± 4.7 | (m-ACI vs ACI-P) 6 months: p = 0.0123, 12 months: p = 0.02065, 24 months: p = 0.6926 | |
| MOCART border zone integration | Complete integration at 6 months: 0/9 (0%), complete integration at 12 months: 0/9 (0%) | Not assessed | ||
| Ebert et al., 2011 [38] | 34 (MACI & traditional rehabilitation) | Mean MRI composite | 3 months: 2.80 (SE = 0.10), 12 months: 3.15 (SE = 0.12), 24 months: 3.07 (SE = 0.11) | Time effect p < 0.0001, group effect p = 0.740, interaction effect = 0.796 |
| Mean border zone integration | 3 months: 2.66 (SE = 0.18), 12 months: 2.84 (SE = 0.19), 24 months: 2.75 (SE = 0.20) | Time effect p = 0.0113, group effect p = 0.659, interaction effect p = 0.733 | ||
| Percentage of patients achieving good to excellent for border integration | 3 months: 68%, 12 months: 71%, 24 months: 68% | Not assessed | ||
| 35 (MACI & accelerated rehabilitation) | Mean MRI composite | 3 months: 2.81 (SE = 0.10), 12 months: 3.21 (SE = 0.13), 24 months: 3.14 (SE = 0.12) | Time effect p < 0.0001, group effect p = 0.740, interaction effect = 0.796 | |
| Mean border zone integration | 3 months: 2.77 (SE = 0.19), 12 months: 2.90 (SE = 0.19), 24 months: 2.93 (SE = 0.21) | Time effect p = 0.0113, group effect p = 0.659, interaction effect p = 0.733 | ||
| Percentage of patients achieving good to excellent for border integration | 3 months: 68%, 12 months: 71%, 24 months: 76% | Not assessed | ||
| Ochs et al., 2011 [43] | 23 | Overall mean MOCART | At latest follow-up: 62.4 ± 18.9 | 3 months compared to all other follow-up points: 0.008 ≤ p < 0.001 |
| MOCART border zone integration | Complete integration: 15/23 (65.2%), incomplete integration: 5/23 (21.7%), visible defect: 3 (13.0%) | Not assessed | ||
| Filardo et al., 2011 [52] | 42 | MOCART border zone integration | Complete integration: 26/42 (62.0%) | Not assessed |
| Ebert et al., 2012 [53] | 20 | MRI composite (proportion rated good to excellent) | 3 months: 14/20 (70.0%), 12 months: 16/20 (80.0%), 24 months: 14/20 (70.0%) | Not assessed |
| MRI composite (proportion rated poor to fair) | 3 months: 6/20 (30.0%), 12 months: 4/20 (20.0%), 24 months: 6/20 (30.0%) | |||
| Border zone integration (proportion rated good to excellent) | 3 months: 12/20 (60.0%), 12 months: 14/20 (70.0%), 24 months: 14/20 (70.0%) | Not assessed | ||
| Border zone integration (proportion rated poor to fair) | 3 months: 8/20 (40.0%), 12 months: 7/20 (35.0%), 24 months: 6/20 (30.0%) | |||
| Ebert et al., 2012 [39] | 29 (MACI & traditional rehabilitation) | Mean MRI composite | 2.91 (SE = 0.17) | Mean MRI composite: traditional vs accelerated p = 0.614, Border integration: traditional vs accelerated p = 0.138 |
| Mean border zone integration | 2.50 (SE = 0.22) | |||
| 29 (MACI & accelerated rehabilitation) | Mean MRI composite | 3.01 (SE = 0.12) | ||
| Mean border zone integration | 2.92 (SE = 0.17) | |||
| Saris et al., 2014 [47] | 60 (MACI) | Arthroscopy: macroscopic ICRS assessment | Complete integration: 45/60 (62.5%), demarcating border < 1 mm: 10/60 (13.9%), ¾ integrated or ¼ with border > 1 mm: 4/60 (5.60%), ½ integration and ½ with border > 1 mm: 4/60 (5.60%), no contact to ¼ integrated: 1/60 (1.40%), missing: 8/60 (11.1%) | MACI vs Microfracture p = 0.519 |
| 56 (Microfracture) | Arthroscopy: macroscopic ICRS assessment | Complete integration: 38/60 (52.8%), demarcating border < 1 mm: 9/60 (12.5%), ¾ integrated or ¼ with border > 1 mm: 7/60 (9.70%), ½ integration and ½ with border > 1 mm: 3/60 (4.20%), no contact to ¼ integrated: 2/60 (2.80%), missing: 13/60 (18.1%) | ||
| Akgun et al., 2015 [42] | 7 (MSCs) | Mean MOCART border zone integration | 3 months: 2.29 ± 0.49, 12 months: 3.00 ± 0.00, 24 months: 3.57 ± 0.53 | Time effect p = 0.005, group effect p = 0.530 |
| 7 (ACI) | Mean MOCART border zone integration | 3 months: 2.14 ± 0.38, 12 months: 2.86 ± 0.38, 24 months: 3.14 ± 0.38 | Time effect p = 0.006, group effect p = 0.530 | |
| Bhattacharjee et al., 2016 [44] | 11 | Overall mean MOCART | 61.0 ± 22.0 | Not assessed |
| MOCART border zone integration | Complete integration: 7/11 (63.6%), incomplete integration: 1/11 (9.10%), defect visible > 50% of length: 3/11 (27.3%) | Not assessed | ||
| 5 | Integration parameter of ICRS II Histology Score (Scores 0–10, higher score means higher quality) | Patient 1: 11 months post-operation: 7.85, 24 months: 9.50 Patient 2: 24 months: 9.90 Patient 3: 13 months: 9.80, 37 months: 10.0 Patient 4: 12 months: 9.95 Patient 5: 18 months: 9.20 | Not assessed | |
| Ebert et al., 2017 [49] | 31 | Overall mean MOCART | 3 months: 2.74 ± 0.10, 1 year: 3.11 ± 0.12, 2 years 3.22 ± 0.13, 5 years (n = 30): 3.14 ± 0.14 | Time effect p = 0.028 |
| Mean MOCART border zone integration | 3 months: 2.71 ± 0.20, 1 year: 3.00 ± 0.20, 2 years 3.16 ± 0.20, 5 years (n = 30): 3.10 ± 0.19 | Time effect p = 0.38 | ||
| Ebert et al., 2017 [54] | 17 (ACI and 6-week return to full weight-bearing) | Overall mean MOCART | 3 months: 2.97 ± 0.11, 12 months: 3.32 ± 0.16, 24 months: 3.46 ± 0.15 | Time effect p < 0.0001, group effect p = 0.052, interaction effect p = 0.376 |
| Mean MOCART border zone integration | 3 months: 2.88 ± 0.21, 12 months: 3.24 ± 0.23, 24 months: 3.29 ± 0.25 | Time effect p = 0.062, group effect p = 0.041, interaction effect p =0.983 | ||
| 14 (ACI and 8-week return to full weight-bearing) | Overall mean MOCART | 3 months: 2.68 ± 0.11, 12 months: 3.01 ± 0.15, 24 months: 3.00 ± 0.15 | Time effect p < 0.0001, group effect p = 0.052, interaction effect p = 0.376 | |
| Mean MOCART border zone integration | 3 months: 2.37 ± 0.19, 12 months: 2.79 ± 0.22, 24 months: 2.79 ± 0.23 | Time effect p = 0.062, group effect p = 0.041, interaction effect p =0.983 | ||
| Ogura et al., 2019 [45] | 10 | MOCART border zone integration | Complete integration: 8/10 (80.0%), incomplete integration: 1/10 (10.0%), defect visible < 50% of length: 1/10 (10.0%), defect visible > 50% of length: 0/10 (0.0%) | Not assessed |
| Yoon et al., 2020 [46] | 10 | Overall mean MOCART | 3 months: 59.5 ± 29.4, 6 months: 65.5 ± 24.3, 12 months: 83 ± 11.1, 24 months: 85.0 ± 8.0 | Not assessed |
| MOCART border zone integration | 3 months: Complete integration: 7/10 (70.0%), demarcating border: 1/10 (10.0%), defect visible < 50% of length: 1/10 (10.0%), defect visible > 50% of length: 1/10 (10.0%) | Not assessed | ||
| 6 months (n = 11 reported): Complete integration: 9/10 (90.0%), demarcating border: 0/10 (0.0%), defect visible < 50% of length: 1/10 (10.0%), defect visible > 50% of length: 1/10 (10.0%) | ||||
| 12 months: Complete integration: 10/10 (100.0%), demarcating border: 0/10 (0.0%), defect visible < 50% of length: 0/10 (0.0%), defect visible > 50% of length: 0/10 (0.0%) | ||||
| 24 months: 12 months: Complete integration: 10/10 (100.0%), demarcating border: 0/10 (0.0%), defect visible < 50% of length: 0/10 (0.0%), defect visible > 50% of length: 0/10 (0.0%) | ||||
| Słynarski et al., 2020 [48] | 40 | MOCART border zone integration | 3 months: Observer 1: Complete integration: 29/38 (76.3%), demarcating border: 7/38 (18.4%), defect visible < 50% of length: 1/38 (2.6%), defect visible > 50% of length: 1/38 (2.6%) Observer 2: Complete integration: 38/40 (95.0%), demarcating border: 7/38 (18.4%), incomplete integration: 2/40 (5.0%) | Not assessed |
| 6 months: Observer 1: Complete integration: 22/38 (57.9%), demarcating border: 12/38 (31.6%), defect visible < 50% of length: 3/38 (7.9%), defect visible > 50% of length: 1/38 (2.6%) Observer 2: Complete integration: 35/38 (92.1%), demarcating border: 3/38 (7.9%), defect visible < 50% of length: 0/38 (0.0%), defect visible > 50% of length: 0/38 (0.0%) | ||||
| 12 months: Observer 1: Complete integration: 20/37 (54.1%), demarcating border: 17/38 (45.9%), defect visible < 50% of length: 0/38 (0.0%), defect visible > 50% of length: 0/38 (0.0%) Observer 2: Complete integration: 34/37 (91.9%), demarcating border: 2/37 (5.4%), defect visible < 50% of length: 1/37 (2.7%), defect visible > 50% of length: 0/38 (0.0%) | Not assessed | |||
| 24 months: Observer 1: Complete integration: 18/32 (56.3%), demarcating border: 13/32 (40.6%), defect visible < 50% of length: 1/32 (3.1%), defect visible > 50% of length: 0/38 (0.0%) Observer 2: Complete integration: 31/31 (100.0%), demarcating border: 0/31 (0.0%), defect visible < 50% of length: 0/31 (0.0%), defect visible > 50% of length: 0/31 (0.0%) | ||||
| 31 specimens (2 at 6 months, 27 at 12 months, 2 at 24 months) | Based on Histological ICRS II and O’Driscoll grading scales: Tidemark formation between implant and native cartilage | Interface absent: 17/29 (58.6%), Calcification front: 12/29 (41.4%), Single tidemark: 0/29 (0.0%) | Not assessed | |
| Barié et al., 2020 [41] | 9 (MACI) | Overall mean MOCART | 58.9 ± 18.3 | Overall mean MOCART: MACI vs ACI-P p = 0.206, Border integration: MACI vs ACI-P p = 0.206 |
| MOCART border zone integration | Complete integration: 2/9 (22.2%), incomplete integration: 2/9 (22.2%), <50% of length: 3/9 (33.4%), >50% of length: 2/9 (22.2%) | |||
| 7 (ACI-P) | Overall mean MOCART | 71.4 ± 19.3 | ||
| MOCART border zone integration | Complete integration: 3/7 (42.8%), incomplete integration: 2/7 (28.6%), <50% of length: 2/7 (28.6%), >50 of length: 0/7 (0.0%). |
| Number of Cohorts | Number of Patients | Proportion or SMD | 95% Confidence Interval | 95% Prediction Interval | psubgroup | |
|---|---|---|---|---|---|---|
| Integration | ||||||
| Complete Integration | ||||||
| Collagen Scaffold | 4 | 69 | 0.7263 | 0.5361, 0.8591 | 0.4630, 0.8909 | 0.0616 |
| Other techniques | 8 | 154 | 0.5590 | 0.3859, 0.7189 | 0.1801, 0.8797 | |
| Clinical Scores | ||||||
| IKDC | ||||||
| Collagen Scaffold | 2 | 100 | 1.9780 | 1.0121, 2.9439 | N/A | 0.0047 |
| Other techniques | 8 | 169 | 1.4283 | 1.0051, 1.8516 | 0.3801, 2.4766 | |
| KOOS Pain | ||||||
| Collagen Scaffold | 7 | 174 | 6.3287 | 4.1189, 8.5385 | 0.2874, 12.3700 | 0.0064 |
| Other techniques | 2 | 50 | 2.4036 | −11.8279, 16.6351 | N/A | |
| KOOS Symptoms | ||||||
| Collagen Scaffold | 7 | 174 | 5.5559 | 3.3265, 7.7854 | −0.6257, 11.7376 | 0.0579 |
| Other techniques | 2 | 50 | 2.1616 | −17.4148, 21.7380 | N/A | |
| Lysholm | ||||||
| Collagen Scaffold | 2 | 57 | 3.6742 | −12.6766, 20.0249 | N/A | 0.2645 |
| Other techniques | 5 | 54 | 1.8202 | −1.0972, 4.7377 | −6.1101 9.7506 | |
| TAS | ||||||
| Collagen Scaffold | 4 | 71 | 3.2418 | 0.5963, 5.8872 | −4.0359, 10.5194 | 0.0090 |
| Other techniques | 5 | 99 | 0.8512 | −0.2112, 1.9135 | −1.7837, 3.4860 | |
| SF-36 Physical | ||||||
| Collagen Scaffold | 5 | 101 | 4.7544 | 1.9547, 7.5541 | −2.7818, 12.2906 | 0.0004 |
| Other techniques | 2 | 16 | 1.1053 | −1.7924, 4.0030 | N/A | |
| SF-36 Mental | ||||||
| Collagen Scaffold | 5 | 101 | 2.2829 | 1.0191, 3.5467 | −0.9880, 5.5538 | <0.0001 |
| Other techniques | 2 | 16 | −0.5795 | −3.3890, 2.2300 | N/A | |
| Graft Failure | ||||||
| Collagen Scaffold | 8 | 282 | 0.0657 | 0.0442, 0.0965 | 0.0436, 0.0977 | 0.3449 |
| Other techniques | 4 | 61 | 0.0904 | 0.0345, 0.2162 | 0.0179, 0.3513 | |
Publisher’s Note: MDPI stays neutral with regard to jurisdictional claims in published maps and institutional affiliations. |
© 2022 by the authors. Licensee MDPI, Basel, Switzerland. This article is an open access article distributed under the terms and conditions of the Creative Commons Attribution (CC BY) license (https://creativecommons.org/licenses/by/4.0/).
Share and Cite
Epanomeritakis, I.E.; Lee, E.; Lu, V.; Khan, W. The Use of Autologous Chondrocyte and Mesenchymal Stem Cell Implants for the Treatment of Focal Chondral Defects in Human Knee Joints—A Systematic Review and Meta-Analysis. Int. J. Mol. Sci. 2022, 23, 4065. https://doi.org/10.3390/ijms23074065
Epanomeritakis IE, Lee E, Lu V, Khan W. The Use of Autologous Chondrocyte and Mesenchymal Stem Cell Implants for the Treatment of Focal Chondral Defects in Human Knee Joints—A Systematic Review and Meta-Analysis. International Journal of Molecular Sciences. 2022; 23(7):4065. https://doi.org/10.3390/ijms23074065
Chicago/Turabian StyleEpanomeritakis, Ilias Ektor, Ernest Lee, Victor Lu, and Wasim Khan. 2022. "The Use of Autologous Chondrocyte and Mesenchymal Stem Cell Implants for the Treatment of Focal Chondral Defects in Human Knee Joints—A Systematic Review and Meta-Analysis" International Journal of Molecular Sciences 23, no. 7: 4065. https://doi.org/10.3390/ijms23074065
APA StyleEpanomeritakis, I. E., Lee, E., Lu, V., & Khan, W. (2022). The Use of Autologous Chondrocyte and Mesenchymal Stem Cell Implants for the Treatment of Focal Chondral Defects in Human Knee Joints—A Systematic Review and Meta-Analysis. International Journal of Molecular Sciences, 23(7), 4065. https://doi.org/10.3390/ijms23074065