Article

Identification of Tumor-Suppressive miR-30e-3p Targets: Involvement of SERPINE1 in the Molecular Pathogenesis of Head and Neck Squamous Cell Carcinoma

1
Department of Oral Science, Graduate School of Medicine, Chiba University, Chiba 260-8670, Japan
2
Department of Oral and Maxillofacial Surgery, National Defense Medical College Hospital, Tokorozawa 359-8513, Japan
3
Department of Functional Genomics, Chiba University Graduate School of Medicine, Chiba 260-8670, Japan
4
Department of Otorhinolaryngology/Head and Neck Surgery, Chiba University Graduate School of Medicine, Chiba 260-8670, Japan
*
Author to whom correspondence should be addressed.
Int. J. Mol. Sci. 2022, 23(7), 3808; https://doi.org/10.3390/ijms23073808
Submission received: 19 January 2022 / Revised: 13 March 2022 / Accepted: 28 March 2022 / Published: 30 March 2022
(This article belongs to the Special Issue Advances in Molecular Mechanism of Head and Neck Cancer)

Abstract

:
Recently, our studies revealed that some passenger strands of microRNAs (miRNAs) were closely involved in cancer pathogenesis. Analysis of miRNA expression signatures showed that the expression of miR-30e-3p (the passenger strand of pre-miR-30e) was significantly downregulated in cancer tissues. In this study, we focused on miR-30e-3p (the passenger strand of pre-miR-30e). We addressed target genes controlled by miR-30e-3p that were closely associated with the molecular pathogenesis of head and neck squamous cell carcinoma (HNSCC). Ectopic expression assays demonstrated that the expression of miR-30e-3p attenuated cancer cell malignant phenotypes (e.g., cell proliferation, migration, and invasive abilities). Our analysis of miR-30e-3p targets revealed that 11 genes (ADA, CPNE8, C14orf126, ERGIC2, HMGA2, PLS3, PSMD10, RALB, SERPINE1, SFXN1, and TMEM87B) were expressed at high levels in HNSCC patients. Moreover, they significantly predicted the short survival of HNSCC patients based on 5-year overall survival rates (p < 0.05) in The Cancer Genome Atlas (TCGA). Among these targets, SERPINE1 was found to be an independent prognostic factor for patient survival (multivariate Cox regression; hazard ratio = 1.6078, p < 0.05). Aberrant expression of SERPINE1 was observed in HNSCC clinical samples by immunohistochemical analysis. Functional assays by targeting SERPINE1 expression revealed that the malignant phenotypes (e.g., proliferation, migration, and invasion abilities) of HNSCC cells were suppressed by the silencing of SERPINE1 expression. Our miRNA-based approach will accelerate our understanding of the molecular pathogenesis of HNSCC.

1. Introduction

The Global Cancer Statistics (2018) reported that head and neck squamous cell carcinoma (HNSCC) is the eighth most common human malignancy worldwide [1]. Every year, approximately 800,000 patients are diagnosed with HNSCC, and there are 430,000 deaths [2]. HNSCC is a malignant neoplasm that occurs in the oral cavity, hypopharynx, nasopharynx, and larynx, and the most common subtype is oral squamous cell carcinoma [3]. The aggressive nature of HNSCC is characterized by a high recurrence rate and distant metastasis. Almost 60% of such patients are initially diagnosed at an advanced stage of disease [4]. Treatment strategies for advanced cases are limited and their prognosis is poor, with 5-year survival rates below 30% [5]. The developed immunotherapies are not effective for many patients, and this treatment imposes a financial burden on patients [6]. In order to improve the prognosis of patients, it is essential to better understand the molecular mechanism underlying the malignant features of HNSCC and to develop new therapeutic strategies.
As a result of the human genome project, it became clear that a vast number of non-coding RNA molecules (ncRNAs) are transcribed from the human genome. Those molecules function in both normal and pathological cells [7]. Recent studies have revealed that various ncRNAs play pivotal roles in cell maintenance: for example, fine-tuning gene expression, controlling the cell cycle, and stabilizing RNA molecules, etc. [8,9]. It is apparent that the dysregulation of ncRNAs can contribute to the initiation and enhancement of human diseases, including cancers [10].
Due to their regulatory roles, microRNAs (miRNAs) have been intensively scrutinized. They function as fine-tuners of gene expression in a sequence-dependent manner [11]. A single miRNA might control a great number of RNA transcripts and contribute to various cellular signaling pathways under both normal and pathological conditions [10,12]. A vast number of studies have shown that aberrantly expressed miRNAs can function as oncogenes and/or tumor suppressors in human cancer cells, including HNSCC [13,14].
Two types of mature miRNAs are derived from pre-miRNAs. One strand (the guide strand) is selected for loading into the miRNA-Induced Silencing Complex (miRISC). The miRISC (including the guide strand) targets mRNA for silencing based on sequence compatibility [15]. The other strand of pre-miRNA (the passenger stand) is usually ejected and degraded in the cytoplasm [11,15]. However, recent studies showed that some passenger strands can act as oncogenes or tumor suppressors in a wide range of cancers, targeting several cancer-related genes [16,17,18]. Moreover, recent studies indicated that both strands of pre-miRNAs cooperated to control oncogenic pathways and exerted tumor-suppressive functions in several cancers [19,20,21]. The realization that passenger strands are involved in the molecular pathogenesis of cancer should permit new developments in cancer research.
We have created the miRNA expression signatures in various types of cancers [17,22,23]. Analysis of our miRNA signatures and other studies revealed that some members of the miR-30 family were frequently downregulated in cancer tissues, suggesting that the miR-30 family acted as pivotal tumor-suppressors [24,25,26,27]. The Cancer Genome Atlas (TCGA) datasets analysis showed that miR-30e-3p (the passenger strand derived from pre-miR-30e) was significantly downregulated in HNSCC tissues, and its low expression predicted worse prognosis of the disease. Some genes controlled by miR-30e-5p are closely associated with the prognosis of HNSCC patients [28,29]. In contrast, miR-30e-3p (the passenger strand) has not been carefully examined in HNSCC.
The aim of this study was to elucidate the involvement of miR-30e-3p in HNSCC. Here, ectopic expression assays showed that miR-30e-3p had tumor-suppressive roles in HNSCC cells. A total of 53 genes were successfully identified as putative miR-30e-3p targets in HNSCC cells. Among these targets, the high expression of 11 genes (ADA, CPNE8, C14orf126, ERGIC2, HMGA2, PLS3, PSMD10, RALB, SERPINE1, SFXN1, and TMEM87B) significantly predicted the short survival of HNSCC patients according to The Cancer Genome Atlas (TCGA) (5-year overall survival rate; p < 0.05). This is the first report of the involvement of miR-30e-3p (the passenger strand) and its target genes in HNSCC.

2. Results

2.1. Expression Levels of miR-30e-3p in Clinical Specimens

The expression levels of miR-30e-3p were evaluated by TCGA-HNSC database analysis. The expression levels were significantly downregulated in HNSCC tissues compared with normal tissues (p < 0.001; Figure 1A). The downregulation of miR-30e-3p in HNSCC tissues was confirmed by other datasets (GSE45238 and GSE31277; Supplemental Figure S1). The expression of miR-30e-5p (the guide strand derived from pre-miR-30e) was also downregulated in HNSCC tissues by TCGA database analysis (data not shown). To determine the clinical significance, the 5-year overall survival rates of HNSCC patients were assessed using TCGA-HNSC data. Patients with low expression of miR-30e-3p had a significantly poorer prognosis compared to those with high expression [log lank p value = 0.0353, hazard ratio (HR) = 0.6097, 95% confidence interval (95% CI): 0.3828–0.9711] (Figure 1B).

2.2. Effects of Ectopic Expression of miR-30e-3p on HNSCC Cell Lines

To confirm the antitumor effectiveness of miR-30e-3p in HNSCC cells, we conducted ectopic expression assays using two HNSCC cell lines (Sa3 and SAS), focusing on cell proliferation, migration, and invasion. Cancer cell proliferation, migration, and invasion were significantly inhibited by miR-30e-3p transfection (Figure 1C–E). Representative images of the migration and invasion assays are shown in Supplemental Figure S2.

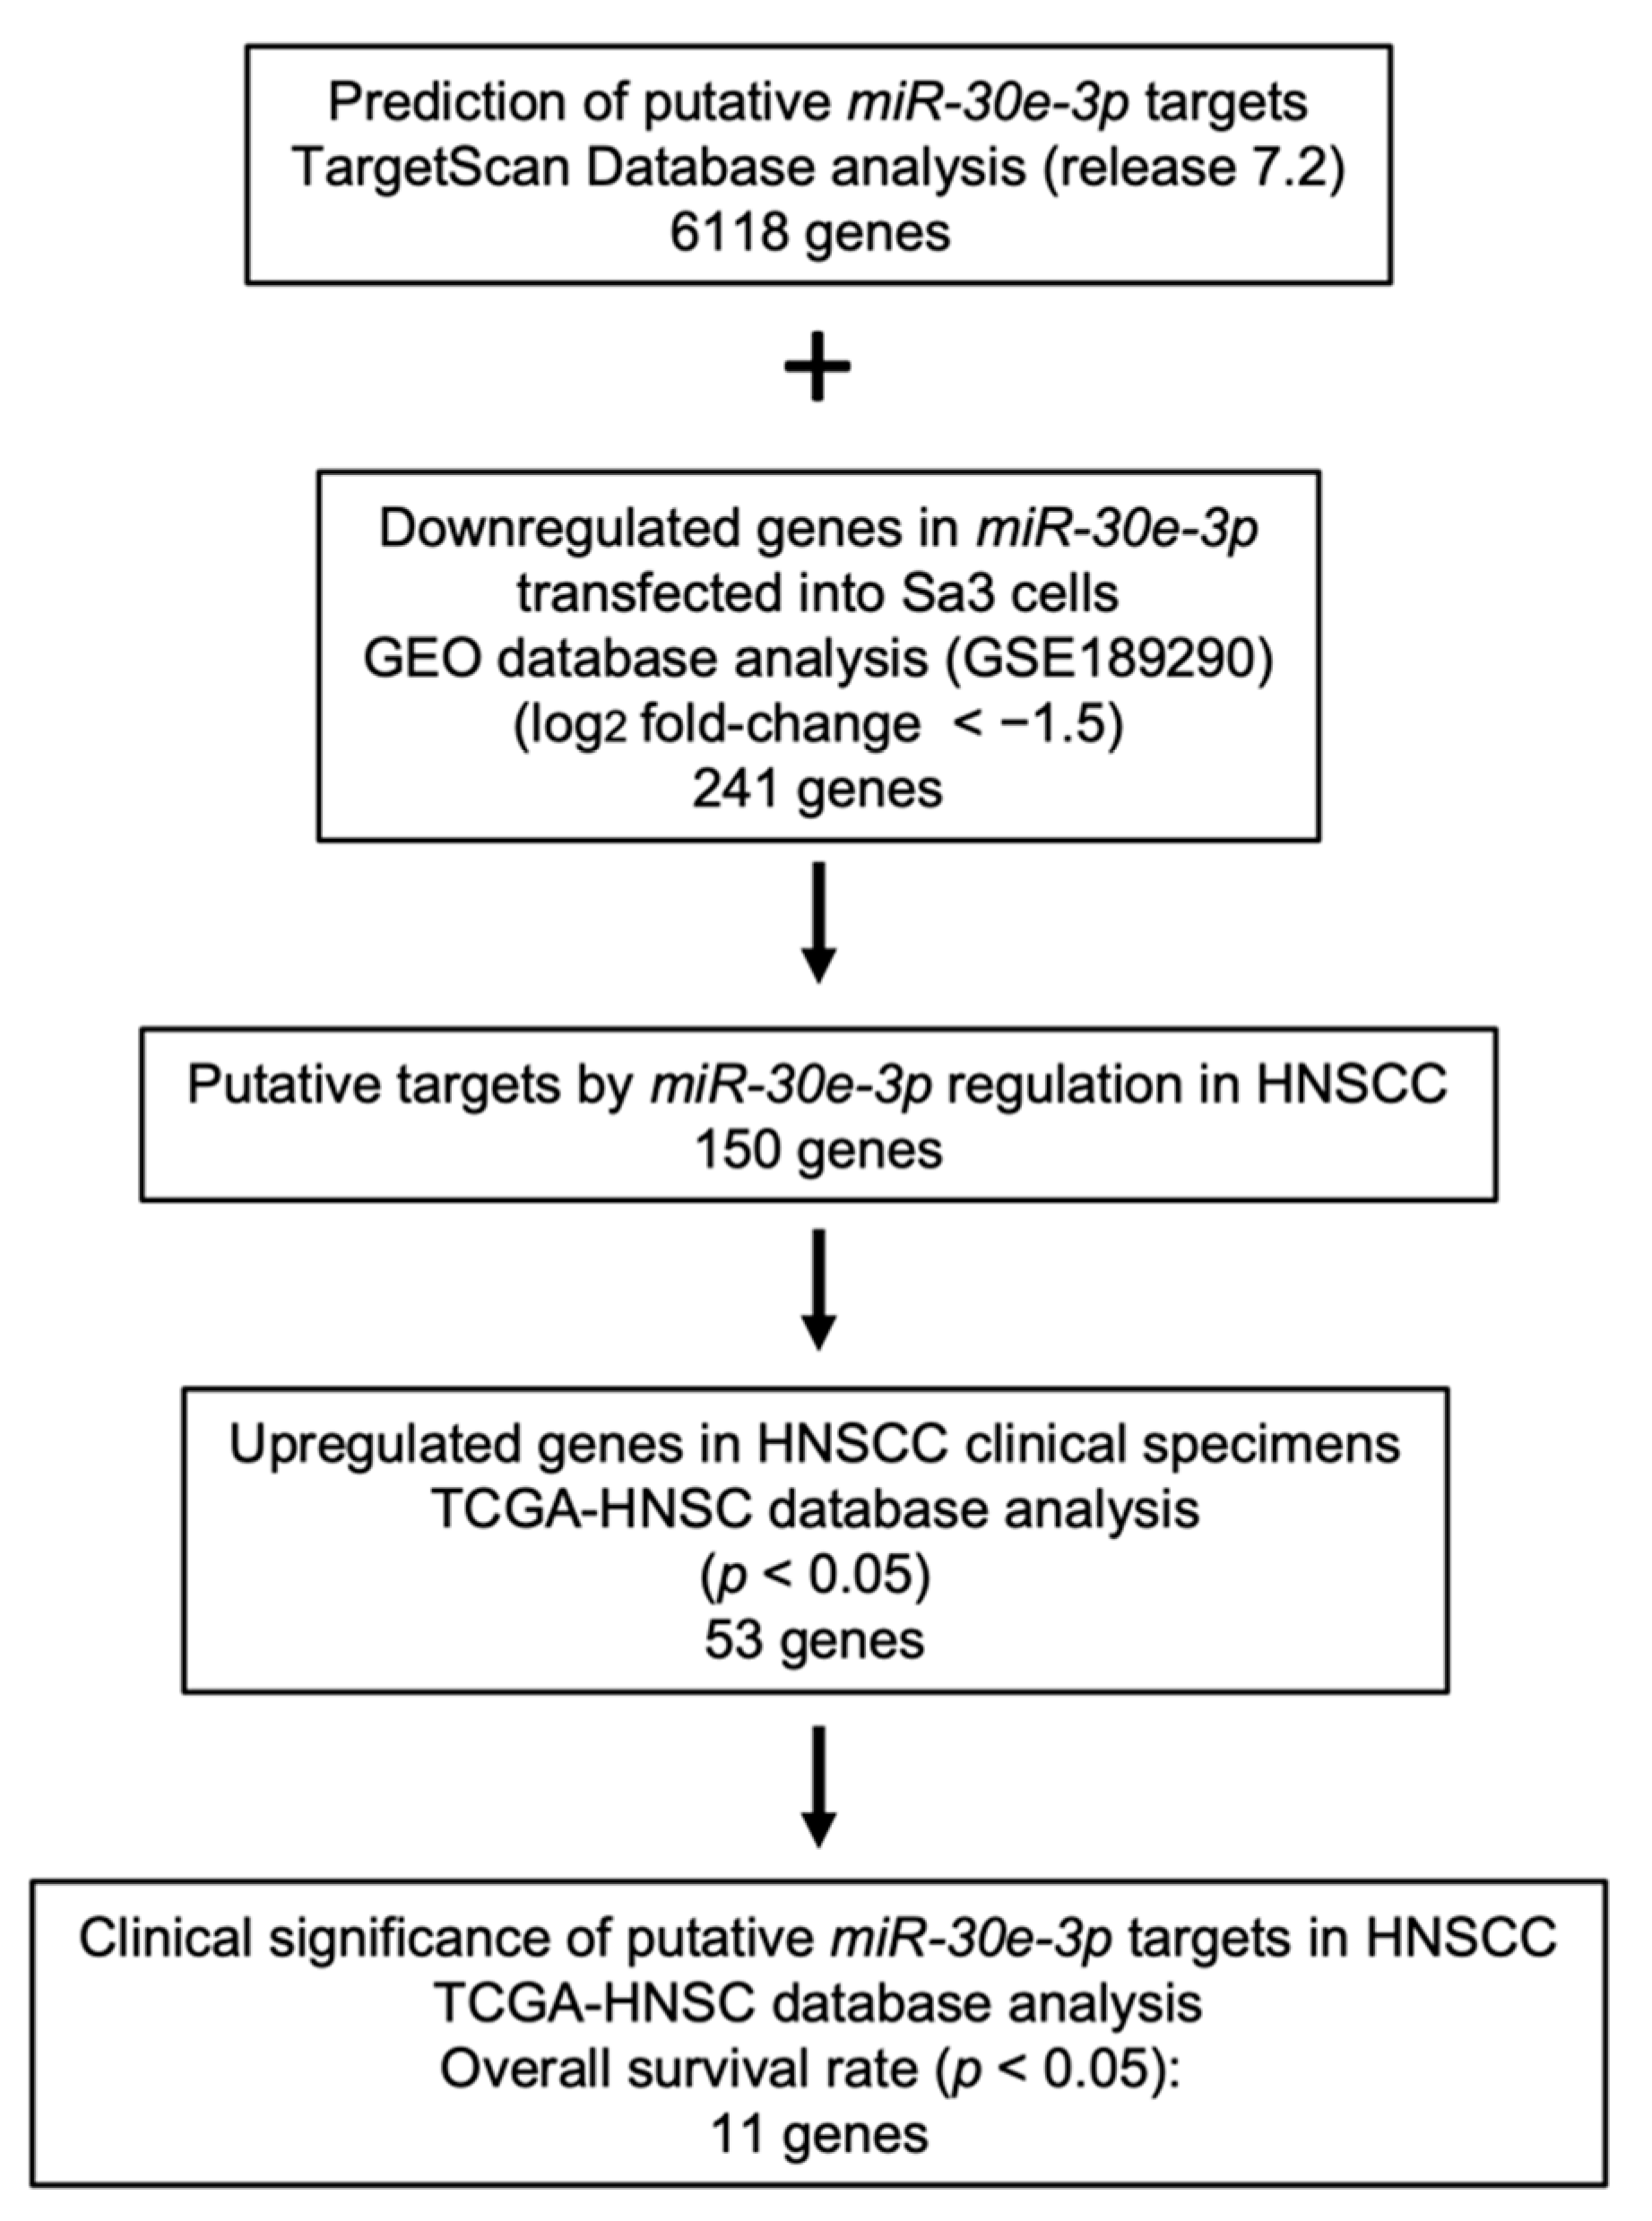
2.3. Identification of Putative Oncogenic Targets of miR-30e-3p in HNSCC Cells

To search for the oncogenic targets of HNSCC cells, we combined two datasets to select candidate targets controlled by miR-30e-3p. Our strategy for identifying miR-30e-3p target genes is shown in Figure 2.
According to the TargetScan database (release 7.2), 6118 genes had putative miR-30e-3p binding sites within their sequences (Figure 2). In this study, we performed genome-wide genes expression analysis (oligo-array) using miR-30e-3p transfected Sa3 cells, and 241 downregulated genes were identified. Our gene expression data were deposited in the Gene Expression Omnibus (GEO) database (accession number: GSE189290). We selected 150 genes by combining the aforementioned two datasets.

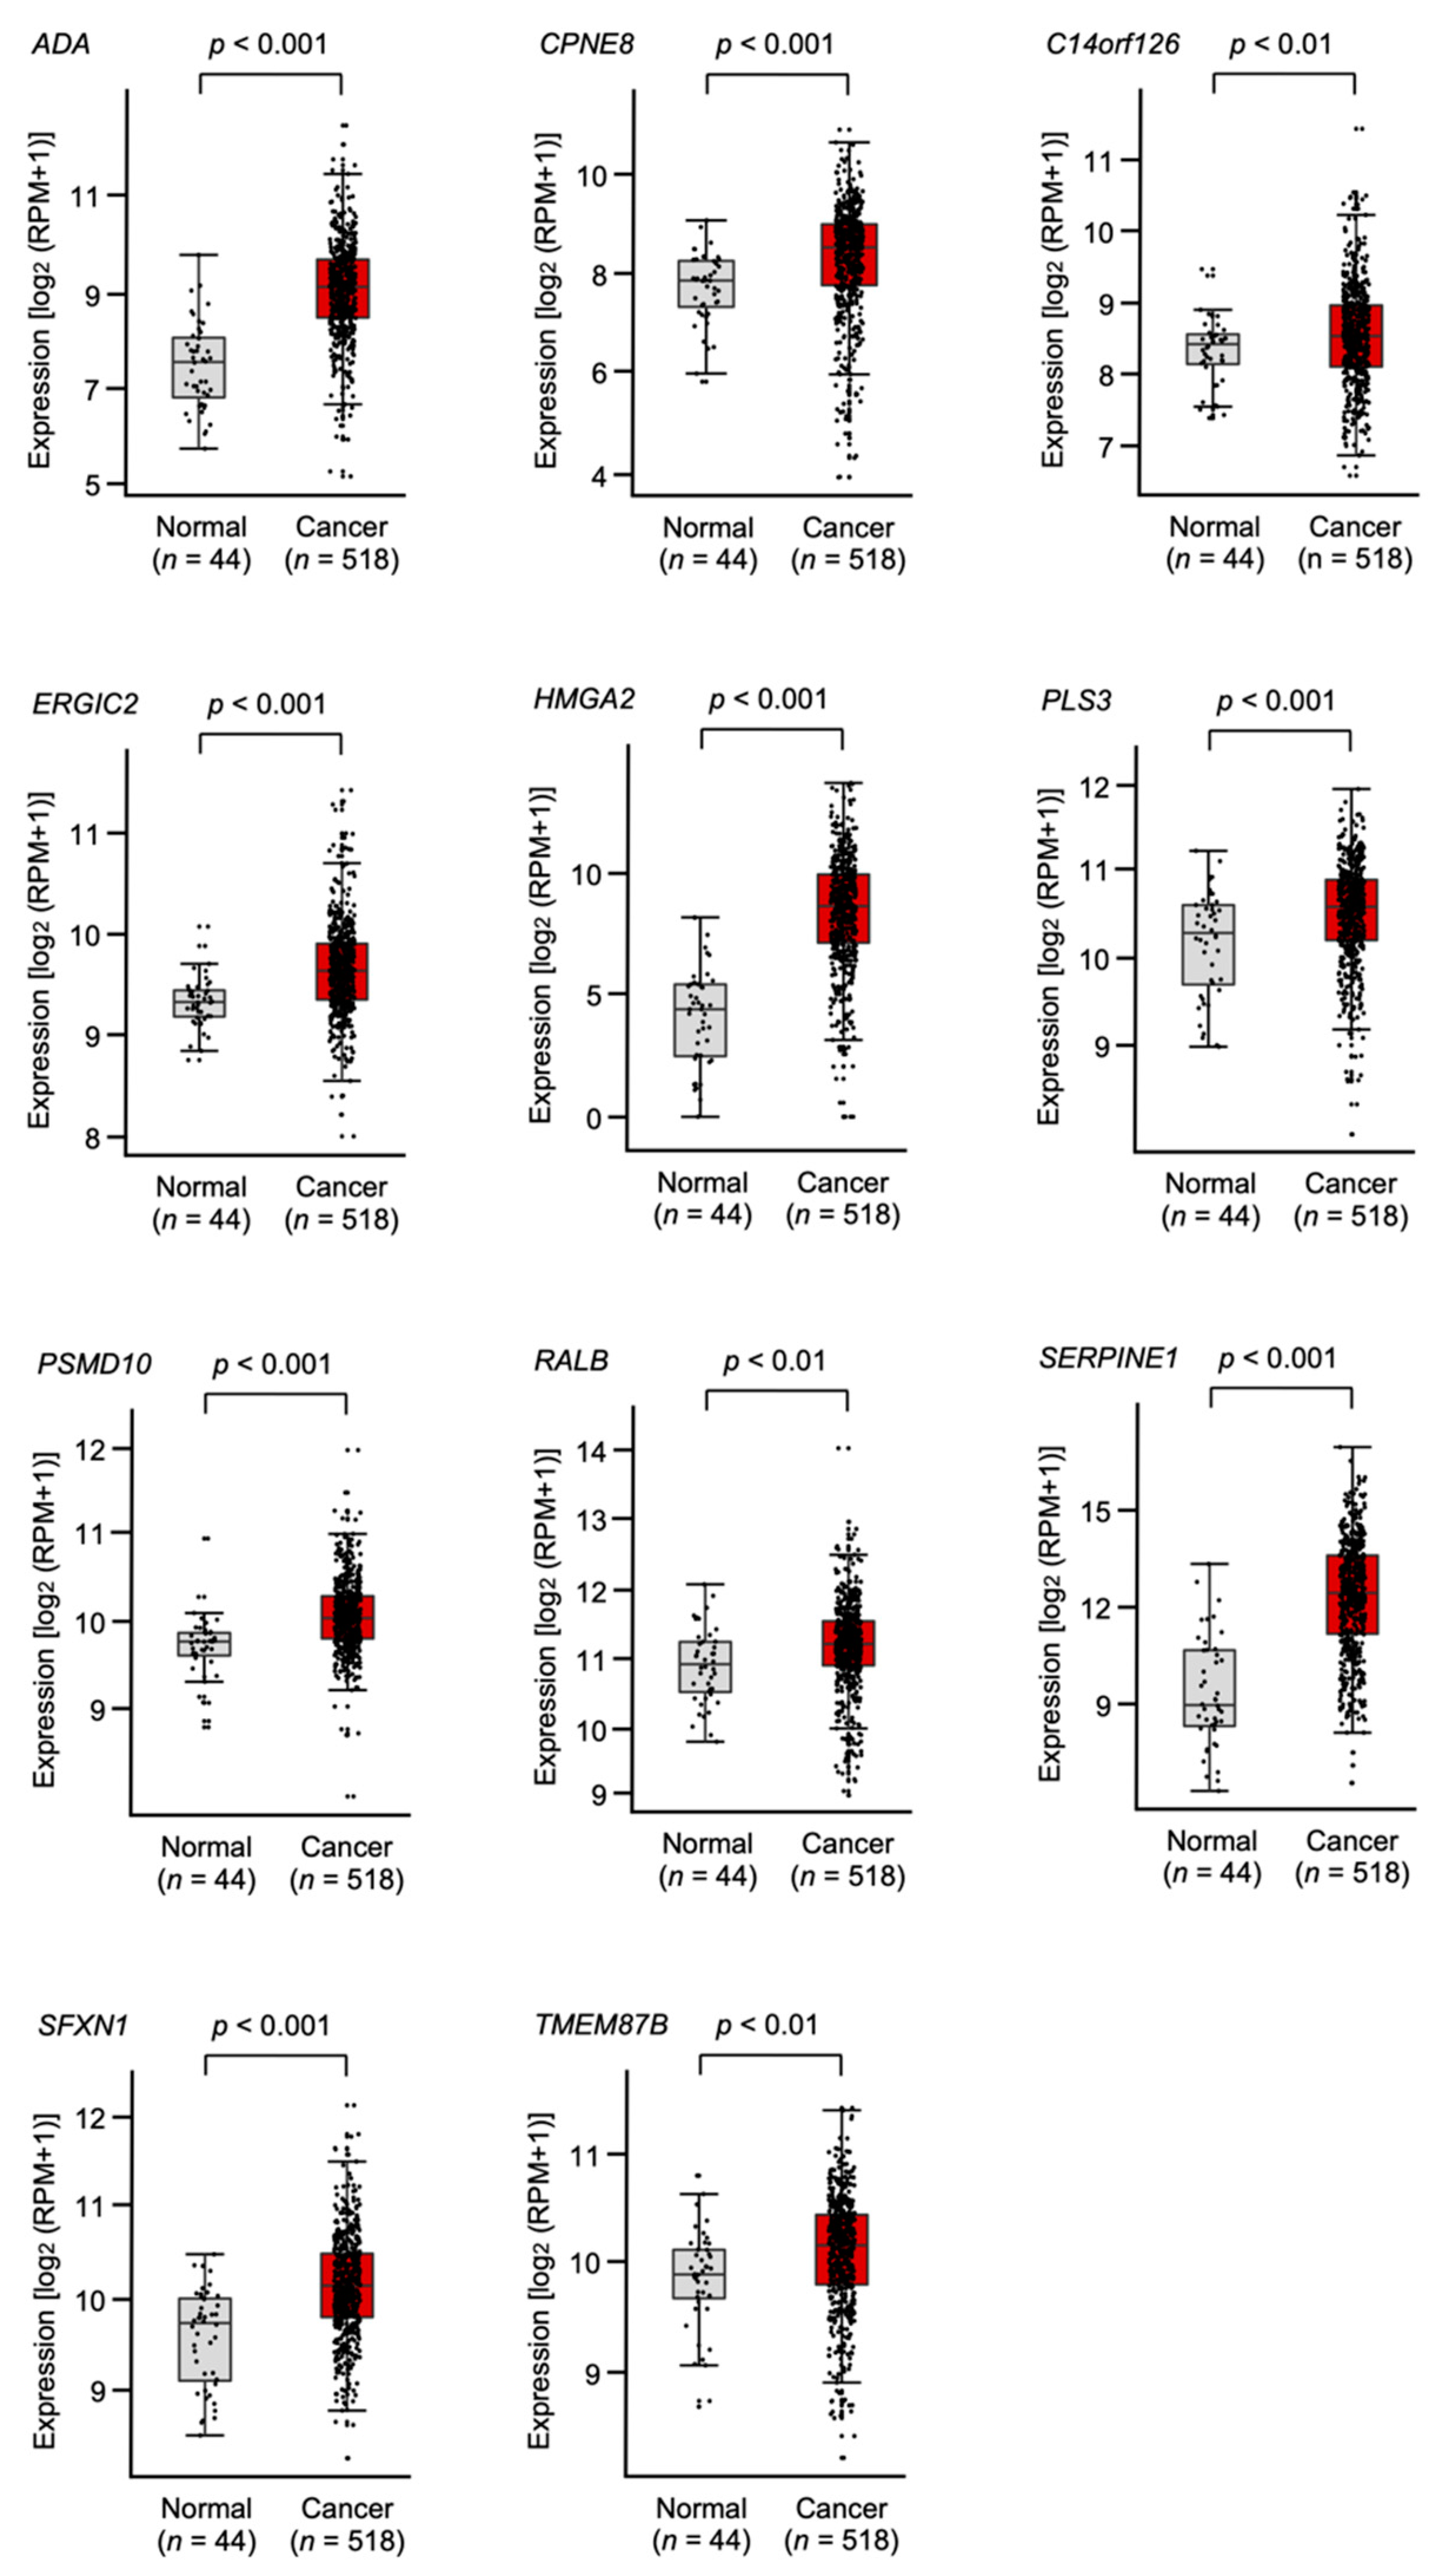
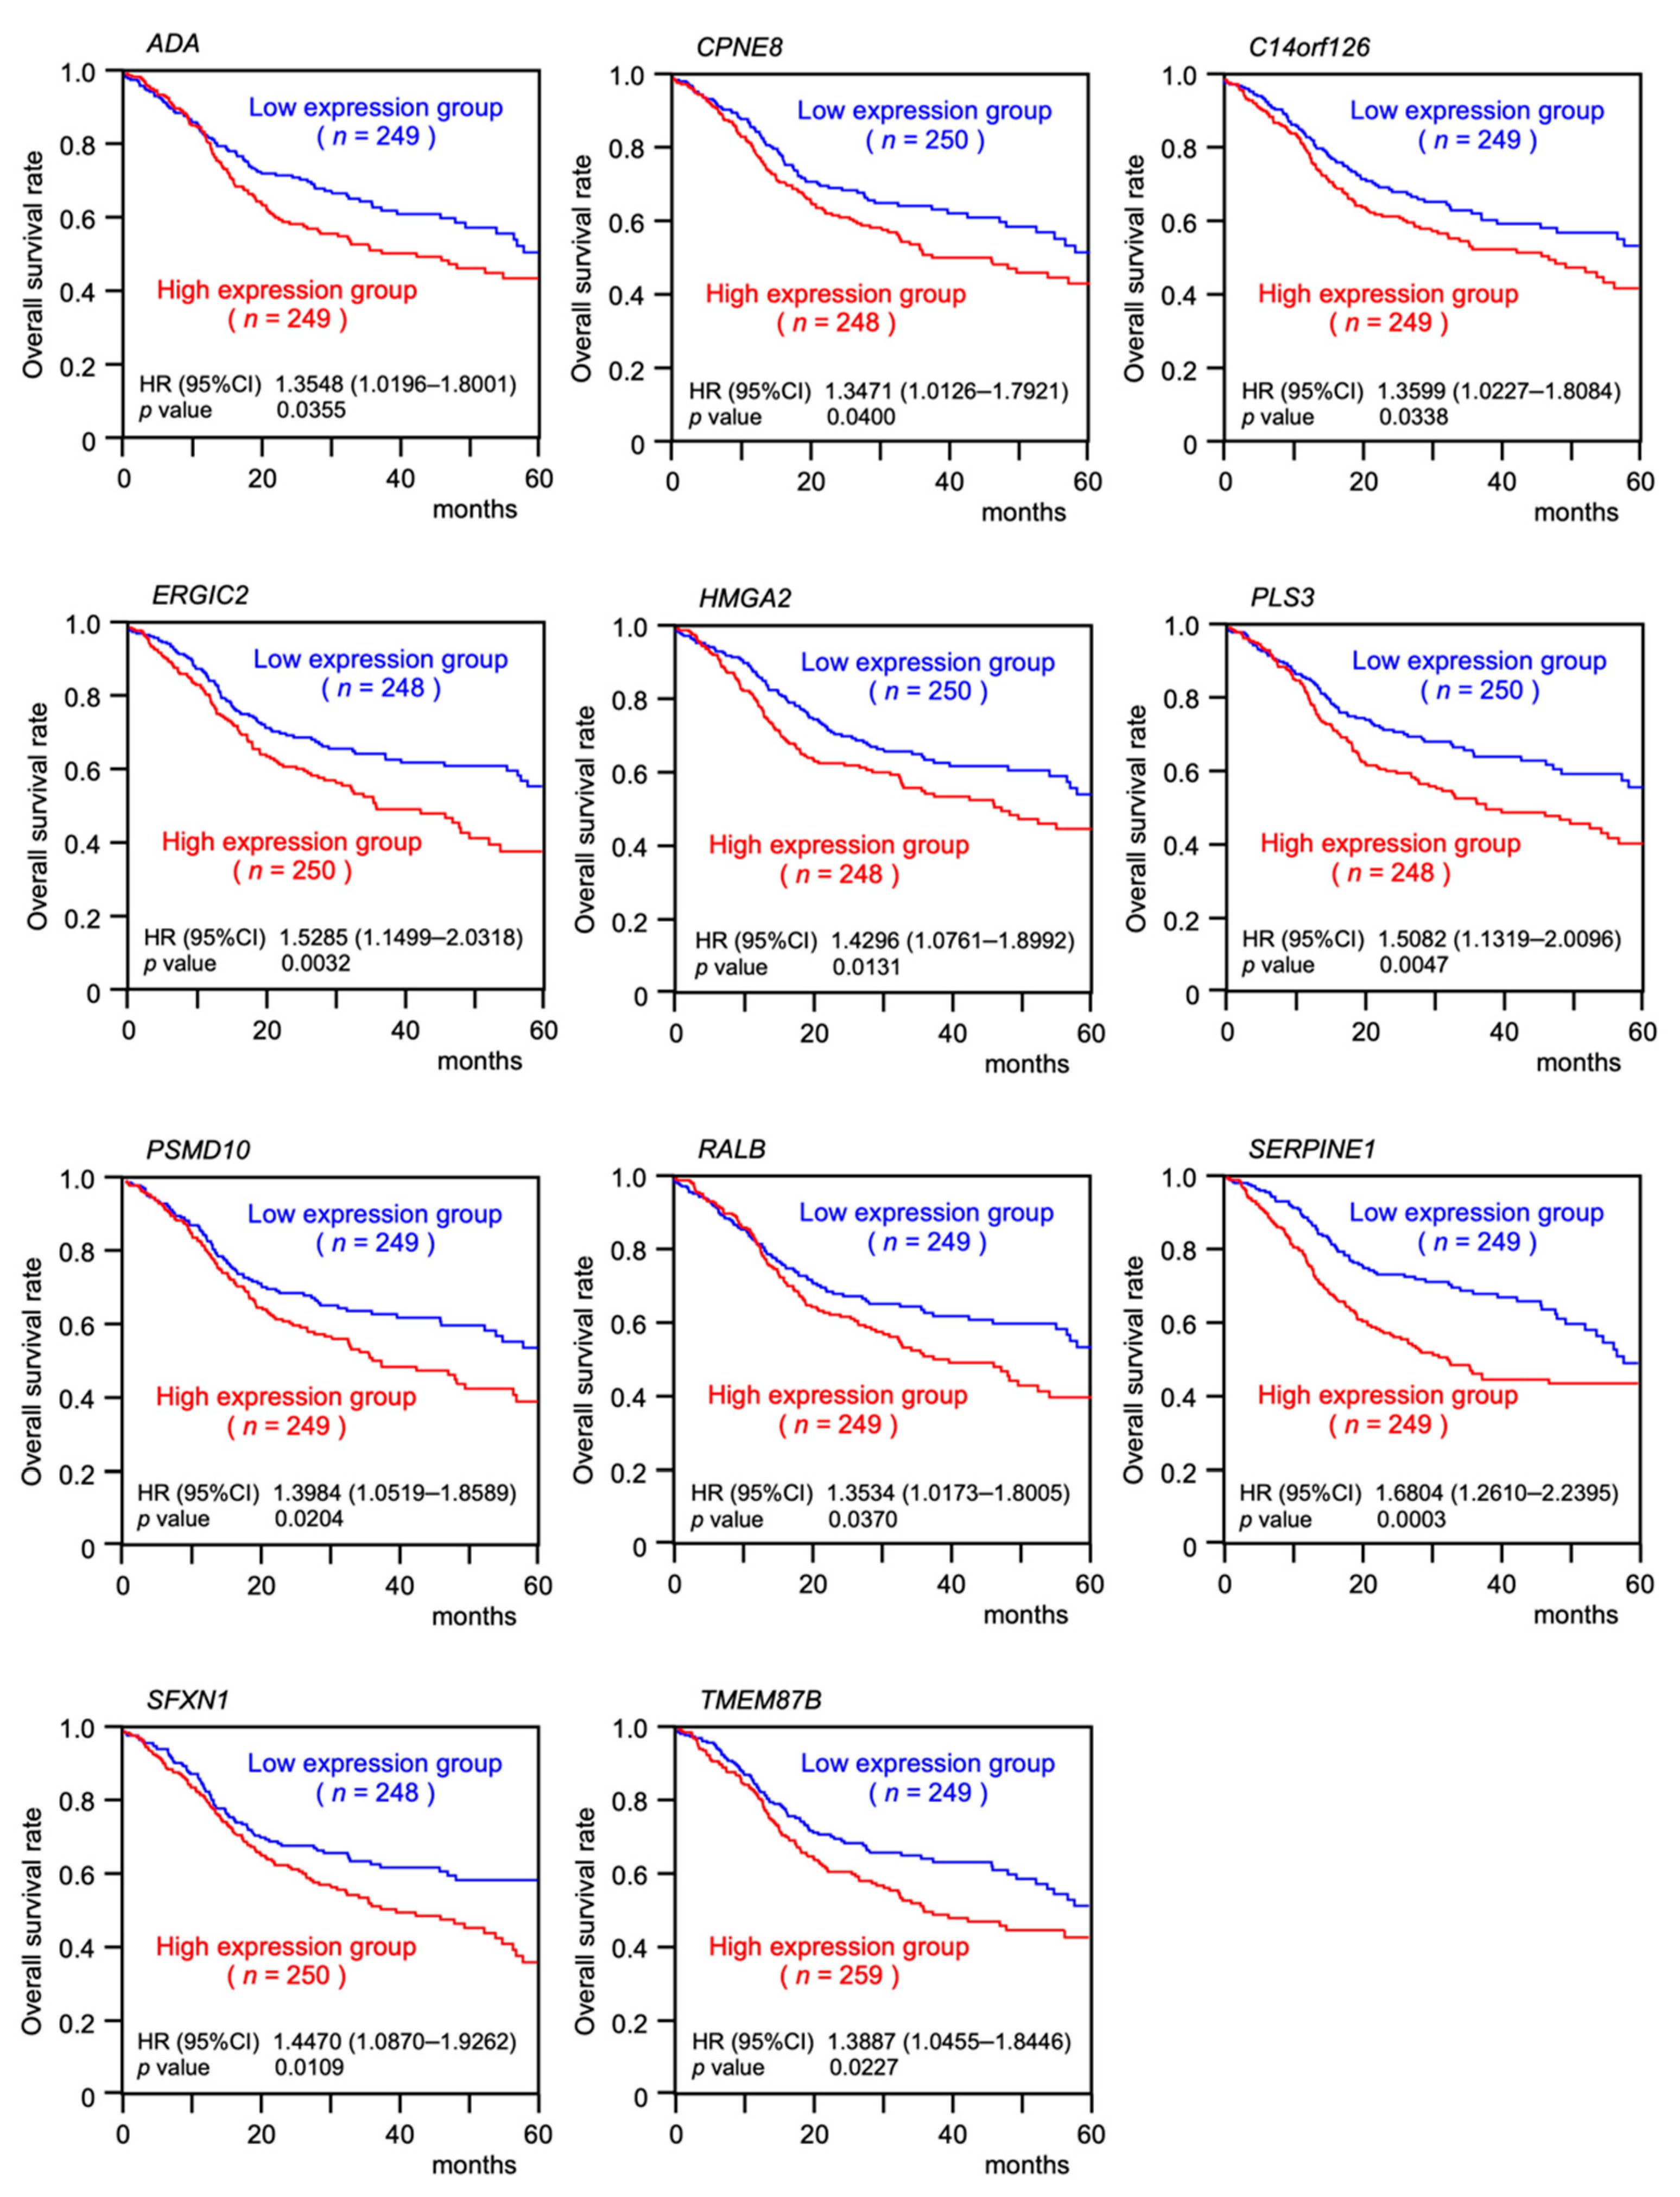
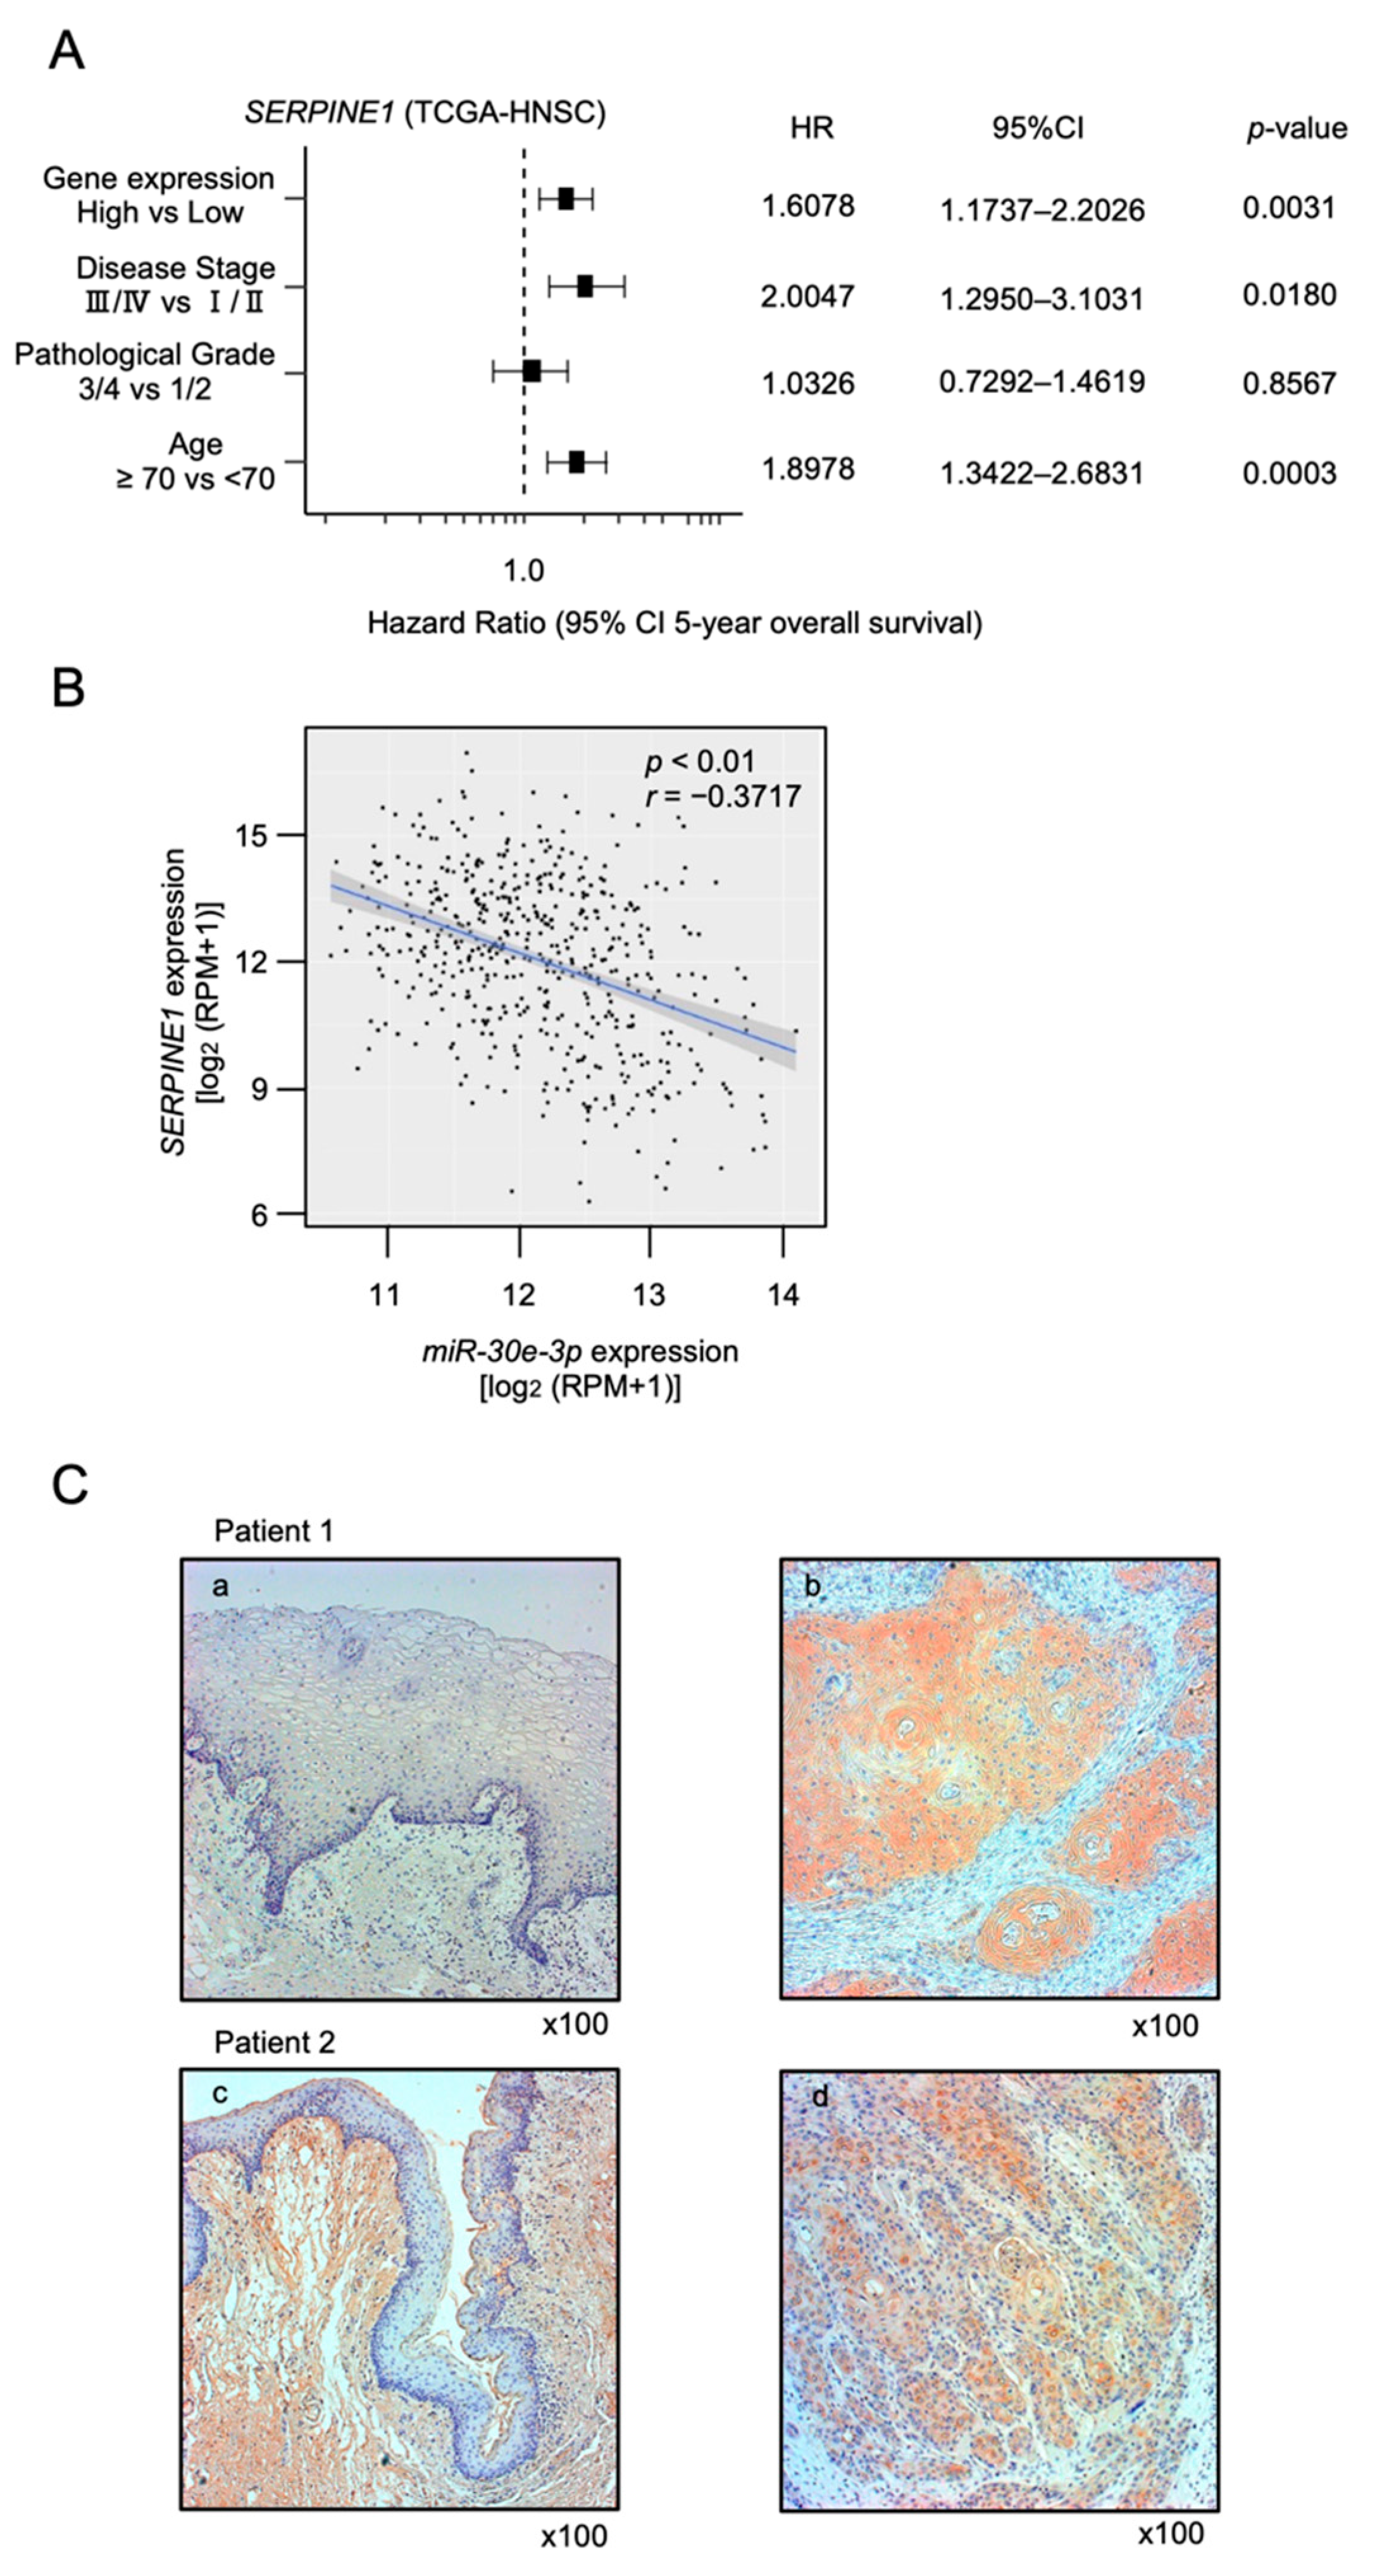
2.4. Clinical Significance of miR-30e-3p Target Genes Determined by TCGA Analysis

Clinicopathological analysis of the 150 putative target genes was performed using TCGA data to confirm clinical relevance. Among those 150 genes, 53 were significantly upregulated in HNSCC tissues (n = 518) compared with normal tissues (n = 44) according to the TCGA-HNSC database (Table 1).
Furthermore, 11 of the genes (ADA, CPNE8, C14orf126, ERGIC2, HMGA2, PLS3, PSMD10, RALB, SERPINE1, SFXN1, and TMEM87B) predicted a significantly poorer prognosis in HNSCC patients (Figure 3 and Figure 4). To confirm the upregulation of these target genes in HNSCC tissues, we verified using other datasets (GSE30784 and GSE59102; Supplemental Figures S3 and S4). Furthermore, it was examined by quantitative PCR whether these target genes were regulated by miR-30e-3p in HNSCC cells. It was revealed that the expression levels of all genes were reduced by the miR-30e-3p transfected in HNSCC cells (Supplemental Figure S5). PCR primer sequences were shown in Supplemental Table S3. Among these targets, SERPINE1 was found to be an independent prognostic factor for patient survival (log rank test, p < 0.001 and false discovery rate < 0.05, multivariate Cox regression; hazard ratio = 1.6078, p = 0.0031; Table 1, Figure 5A).
Moreover, we investigated the extent to which the expression of miR-30e-3p and SERPINE1 was correlated in HNSCC clinical specimens. Spearman’s rank test revealed a negative correlation between the expression levels of miR-30e-3p and SERPINE1 (p < 0.01, r = −0.3717; Figure 5B).
Immunohistochemistry was performed to analyze SERPINE1 protein expression in HNSCC clinical specimens. SERPINE1 protein was clearly stained in cancer lesions, whereas it was only weakly stained in normal tissues (Figure 5C).

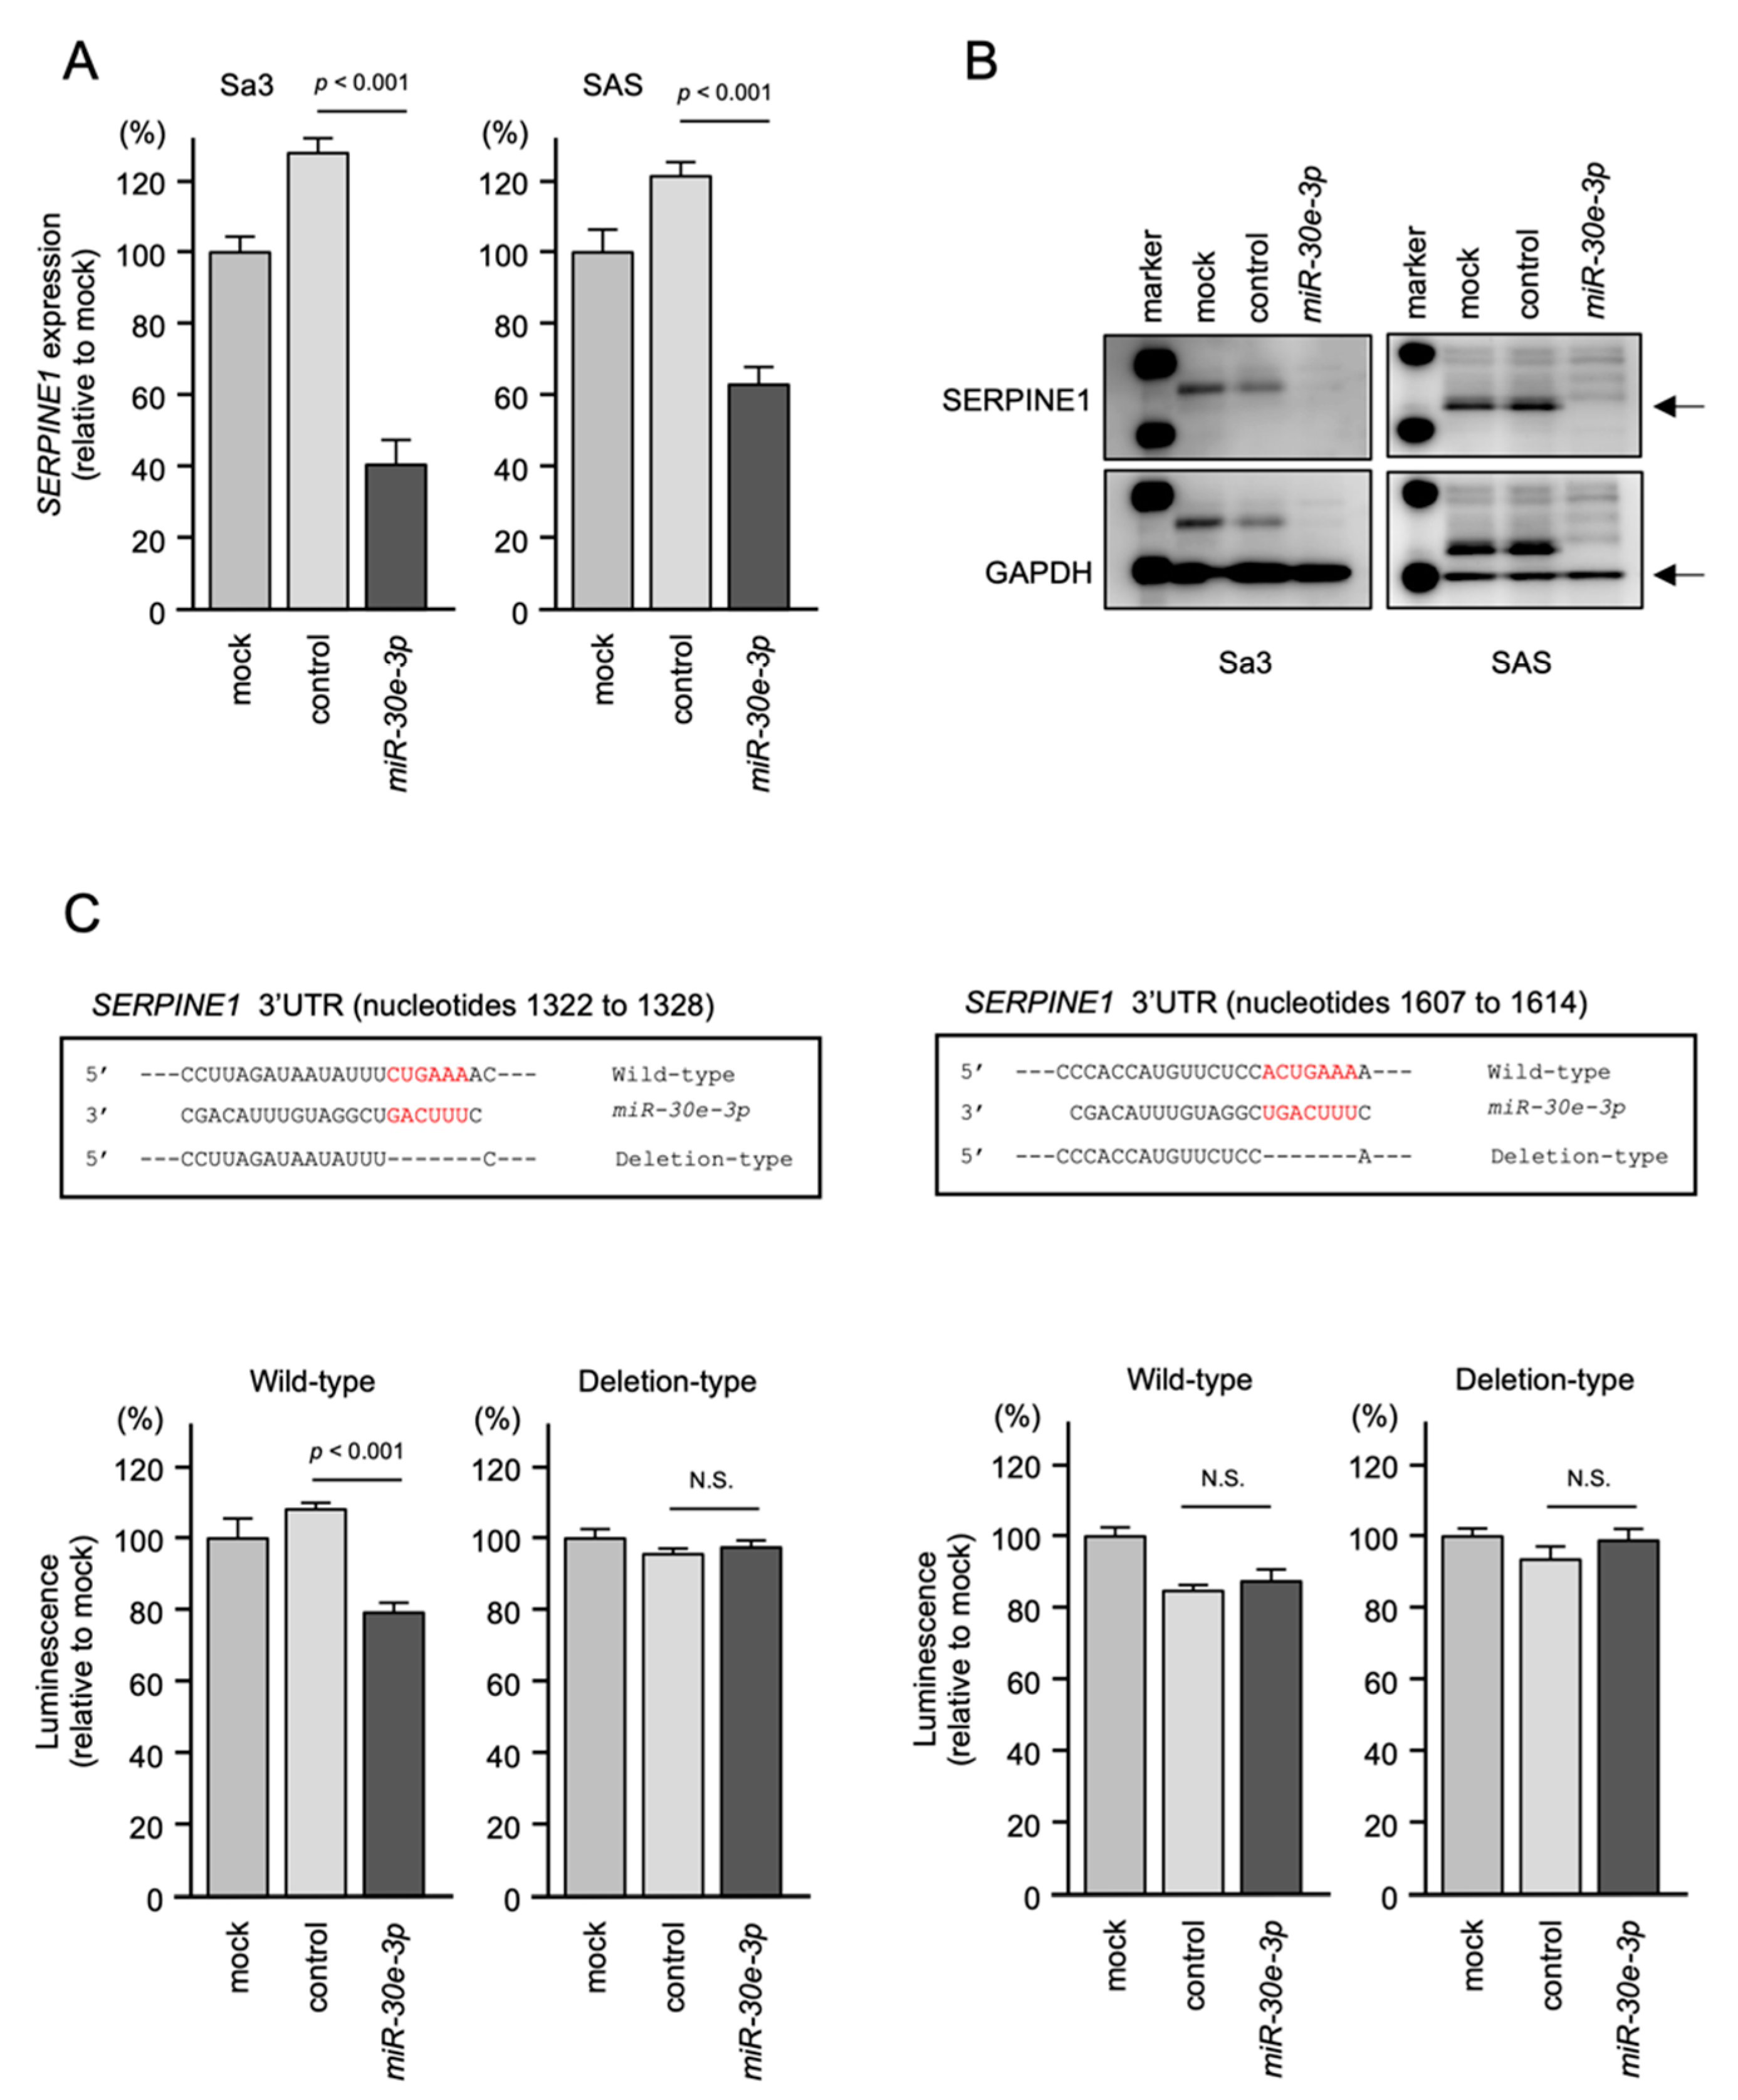
2.5. Regulation of SERPINE1 Expression by miR-30e-3p in HNSCC Cells

Both the mRNA and protein expression levels of SERPINE1 were suppressed in miR-30e-3p-transfected HNSCC cells (Figure 6A,B). Full-size Western blot images are shown in Supplemental Figure S2. To investigate whether miR-30e-3p bound directly to the 3′-UTR of SERPINE1 in HNSCC cells, dual-luciferase reporter assays were performed. TargetScan database analysis revealed that there were two miR-30e-3p binding sites predicted within the 3′-UTR of SERPINE1 (Figure 6C). Luciferase activity was significantly reduced following the co-transfection of miR-30e-3p and a vector containing the miR-30e-3p-binding site (1322 to 1328) in the 3′-UTR of SERPINE1. On the other hand, co-transfection of a vector containing the SERPINE1 3′-UTR lacking the miR-30e-3p-binding site resulted in no change in luciferase activity (left panel of Figure 6C). With regard to the other predicted binding site (1607 to 1614), luciferase activity was not changed following co-transfection of miR-30e-3p and a vector containing the miR-30e-3p-binding site in the 3′-UTR of SERPINE1 (right panel of Figure 6C). Our present data suggest that miR-30e-3p binds directly to one of the predicted binding sites of SERPINE1, and that it controls the expression levels of SERPINE1 in HNSCC cells.
Dual luciferase reporter assays showed reduced luminescence activity after co-transfection of the wild-type vector (position 1322–1328) and miR-30e-3p in Sa3 cells (left panel). There was no reduced luminescence activity after co-transfection of the deletion-type vector (position 1322–1328) and miR-30e-3p in Sa3 cells (lower panel). Normalized data are expressed as the Renilla/firefly luciferase activity ratio (N.S., not significant). For the other putative binding site (position 1607–1614), there was no reduced luminescence activity after co-transfection of the wild-type vector and miR-30e-3p in Sa3 cells (right panel).

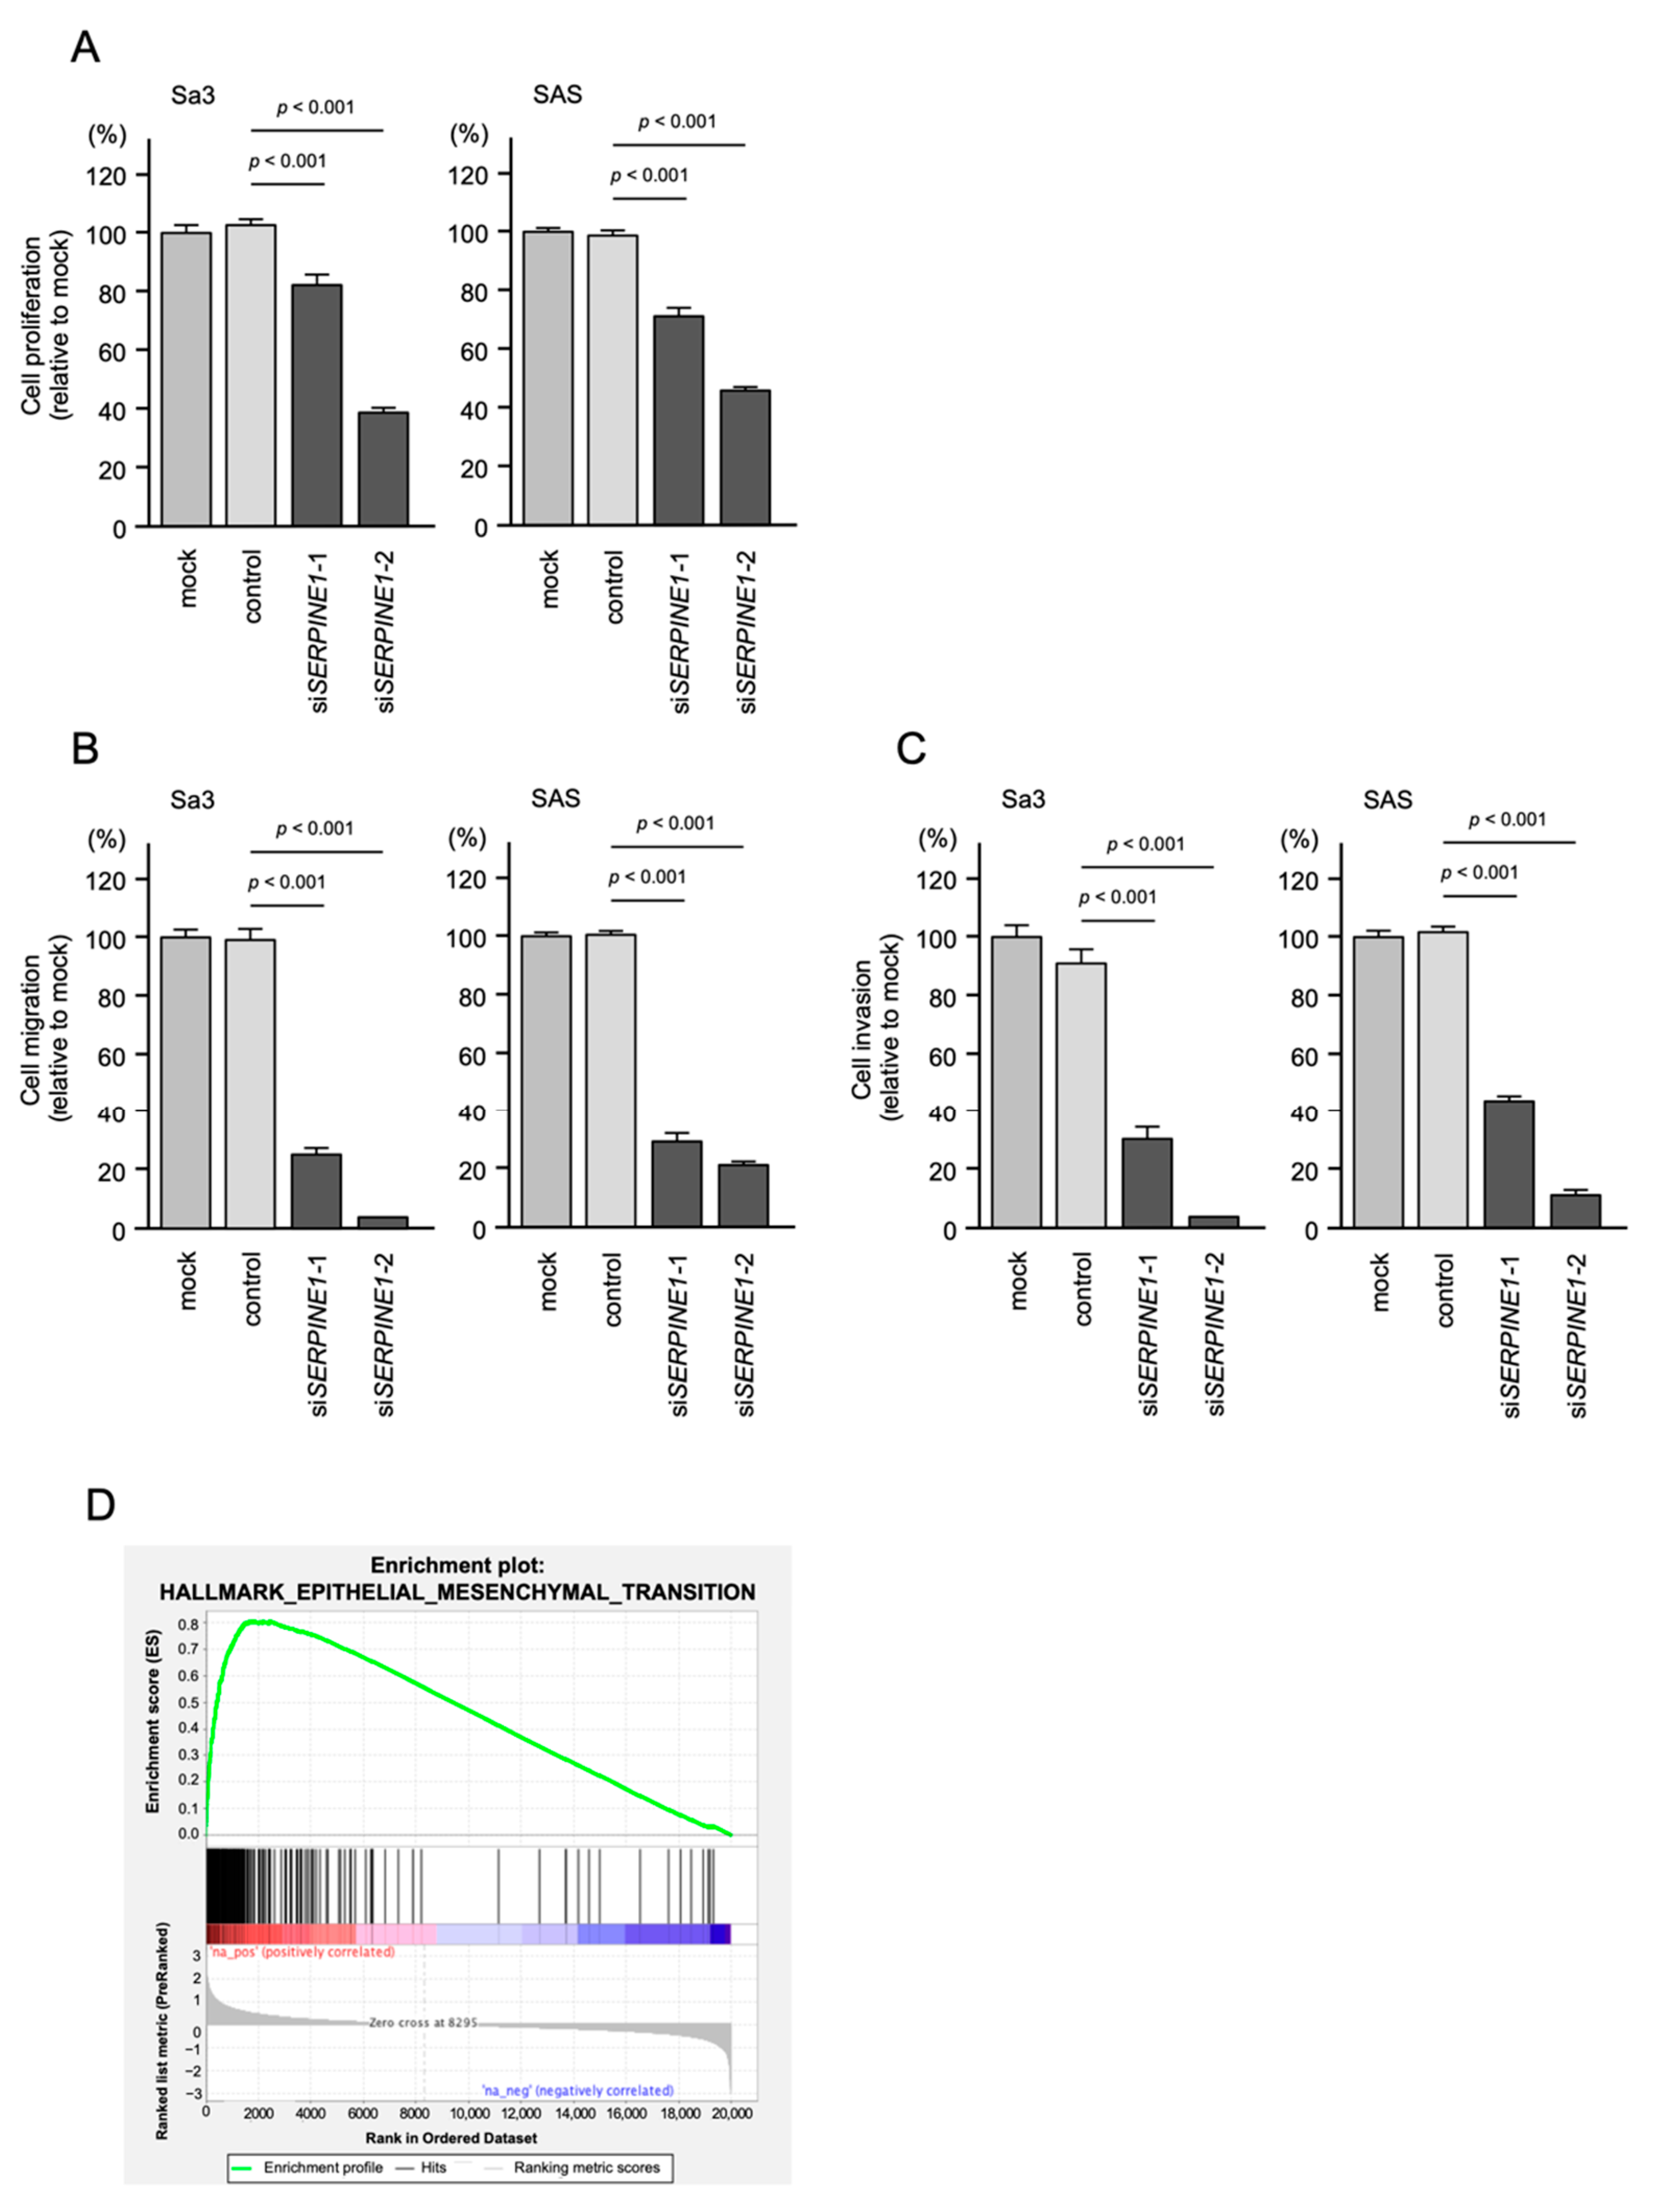
2.6. Effects of SERPINE1 Knockdown on the Proliferation, Migration, and Invasion Assays

To explore the potential cancer-promoting function of SERPINE1 in HNSCC cells, we used siRNAs targeting SERPINE1 in knockdown assays. First, the inhibitory effects of two different siRNAs targeting SERPINE1 (siSERPINE1–1 and siSERPINE1–2) on SERPINE1 expression were confirmed. The SERPINE1 mRNA and protein levels were effectively suppressed by each siRNA transfected into Sa3 and SAS cells (Supplemental Figure S3). Knockdown of SERPINE1 in HNSCC cells inhibited cancer cell malignant transformation (Figure 7A–C). Notably, cancer cell invasion and migration abilities were significantly blocked after siSERPINE1–1 or siSERPINE1–2 was transfected into Sa3 and SAS cells (Figure 7B,C). Our present data indicate that aberrantly expressed SERPINE1 contributed to the aggressive phenotype of HNSCC cells.
To understand the effects of overexpression of SERPINE1 in HNSCC cells, gene set enrichment analysis (GSEA) was performed to determine differentially expressed genes between the high and low SERPINE1 expression groups of the TCGA-HNSC cohort. The results of GSEA showed that the most enriched gene set in the high SERPINE1 expression group was “epithelial–mesenchymal transition” (Figure 7D and Table 2). GSEA analysis showed that several signal pathways were involved in the high SERPINE1 expression group, e.g., “myogenesis”, “TNFα signaling”, “angiogenesis”, and “KRAS signaling” (Table 2). We suggest that the overexpression of SERPINE1 may affect various intracellular signaling pathways. Activation of these signaling pathways may induce the malignant transformation of HNSCC cells.

3. Discussion

Initially, it was believed that only the guide strand derived from pre-miRNA was functional, whereas the passenger strand was degraded and had no function [11,15]. Contrary to this concept, a large number of studies have shown that the passenger strands of several miRNAs are responsible for the regulation of target genes in the cell [30]. A large number of cohort analyses by TCGA data showed that in some miRNAs (e.g., miR-30a, miR-143, miR-145, and miR-139), both strands (-5p/-3p (the guide strand/the passenger strand)) cooperated to regulate oncogenic pathways [30]. Our recent studies demonstrated that miR-30a-3p, miR-143-5p, miR-145-3p, and miR-139-3p (all of which are passenger strands) acted as tumor-suppressive miRNAs through the control of many oncogenic genes and pathways in various types of cancers [31,32,33]. Finding functional passenger chains and exploring the networks they control will deepen our understanding of the molecular mechanisms of cancer.
The ectopic expression of miR-30e-5p markedly blocked the malignant characteristics of certain cancer cells, indicating that miR-30e-5p acted as a tumor-suppressor in HNSCC cells [28]. Our present analysis revealed that the other strand derived from pre-miR-30e also has a tumor-suppressive function. In other words, two miRNAs (miR-30e-5p and miR-30e-3p) derived from pre-miR-30e function as tumor suppressors in HNSCC cells.
Relatively little is known about the functional characteristics of miR-30e-3p in human cancers. A previous study showed that the overexpression of miR-30e-3p inhibited renal cell carcinoma (RCC) cell line (A498 and 786-O) migration and invasive abilities [34]. This study also indicated that Snail1 was directly regulated by miR-30e-3p in RCC cells [34]. Snail1 is a zinc finger-containing transcription factor. It functions as a negative regulator of E-cadherin expression, and it is closely related to RCC metastasis [35].
Recently, an interesting study of miR-30e-3p reported that miR-30e-3p possessed two functions (tumor-suppressor or oncogene) depending on TP53 status [36]. With wild-type TP53, miR-30e-3p targeted MDM2, and it seems to behave as a tumor suppressor. In contrast, with a nonfunctional TP53, miR-30e-3p behaved as an oncogene. Notably, elevated miR-30e-3p levels predicted the development of sorafenib resistance in hepatocellular carcinoma patients [36]. It is an interesting finding that the role of miR-30e-3p varies depending on the status of the TP53. It is necessary to examine whether this situation is a universal phenomenon in HNSCC cells.
A single miRNA can control a large number of genes, and the target genes can differ between cell types. Therefore, it is important to clarify which genes are controlled by miR-30e-3p for each type of cancer. Our in silico analysis of miR-30e-3p targets revealed that 53 genes acted as putative oncogenic targets in HNSCC. The expression of all 11 genes was closely associated with the molecular pathogenesis of HNSCC. A detailed analysis of these genes should improve our understanding of the molecular mechanisms underlying HNSCC. For example, Plastin-3 (PLS3) is an actin-bundling protein that contributes to cofilin-mediated actin polymerization [37]. The aberrant expression of PLS3 was reported in a wide range of cancers, and its expression is closely associated with the EMT-induced malignant phenotypes of cancers [38]. A previous study showed that the expression of PLS3 by circulating tumor cells was a marker in metastatic colorectal cancer [39]. Recent study indicated that it is possible to predict the responsiveness of lung cancer patients to nivolumab treatment by measuring plasma levels of PLS3 [40].
PSMD10 (Proteasome 26S Subunit, Non-ATPase 10), also known as Gankyrin, was initially cloned from a cDNA library obtained from a hepatocellular carcinoma. It consisted of ankyrin repeat motifs that promoted protein–protein interactions [41]. A large number of studies showed that aberrantly expressed PSMD10/Gankyrin was present in several types of cancers, and its overexpression enhanced cancer cell proliferation, invasion, and metastasis through the activation of several oncogenic signal pathways, e.g., RhoA/ROCK/PTEN, PI3K/AKT, and IL-6/STAT3 pathways [42]. In oral cancer, overexpressed PSMD10/Gankyrin was detected in cancer tissues and premalignant oral lesions [43].
Human RAL (RAS-like) is a member of the RAS-family (RAS, RAL, RIT, RAP, RHEB, and RAD), and it has an amino acid sequence most similar to RAS [44]. The human RALA and RALB genes were cloned from a human pheochromocytoma cDNA library. The two proteins share approximately 80% similarity at the amino acid level [45]. Previous studies showed that RALA and RALB might play distinctive oncogenic roles in human cancers, as RALB contributed to the survival of human cancer cells [46]. In pancreatic cancer, RALB was activated in cancer tissues, and it enhanced the cells’ invasive ability and their metastatic colonization in in vitro and in vivo studies [47].
SERPINE1 (also known as Plasminogen Activator Inhibitor-1: PAI-1) is an inhibitor of the plasminogen activators tPA and uPA [48]. In a wide range of cancers, the upregulation of SERPINE1 was observed in genome-wide gene expression analyses, and its expression is a marker of poor prognosis [49]. The roles of SERPINE1 in cancer progression have been studied in depth, especially tumor promotion of inflammation, sustaining proliferative signals, invasion and metastasis, angiogenesis, and resisting tumor death [50]. In genome-wide gene expression profiles of HNSCC, upregulated SERPINE1 was frequently observed in independent studies [51]. A previous study showed that the overexpression of SERPINE1 enhanced the migration of HNSCC cells, and its expression protected cells from cisplatin-induced apoptosis through activation of the PI3K/AKT pathway [52]. Another study indicated that overexpression of SERPINE1 also promoted tumor aggressiveness and metastatic dissemination to lymph nodes and lung. Moreover, its association is consistent with poor outcome in HNSCC patients [53]. Given its predominance in the HNSCC literature, it is surprising that no effective cancer chemotherapy targeting SERPINE1 has been proposed.
Accumulating studies have shown that miRNAs regulated the malignancy of cancer cells by controlling the target genes [54]. The downregulation of tumor-suppressive miRNAs causes the aberrant expression of oncogenic genes in cancer cells. The involvement of several tumor-suppressive microRNAs has been reported as a caused of overexpression of SERPINE1 in cancer cells [52]. Previous study showed that miR-617 was directly bound in the UTR of SERPINE1 mRNA and controlled its expression in OSCC cells [55]. Other study demonstrated that ectopic expression of miR-181c-5p suppressed the expression of SERPINE1 in HNSCC cells [56]. Notably, the expression of miR-617 and miR-181c-5p inhibited cancer cell proliferation and migration abilities in OSCC/HNSCC cells [55,56].
Here, we identified a number of genes that were controlled by miR-30e-3p. Many of those molecules are involved in cancer pathogenesis. Functional analysis of these genes will reveal at least some of the molecular mechanisms underlying HNSCC.

4. Materials and Methods

4.1. Transfection of Mature miRNAs and Small-Interfering RNAs (siRNAs) into HNSCC Cells

The HNSCC cell lines (SAS and Sa3) used in this study were obtained from the RIKEN BioResource Center (Tsukuba, Ibaraki, Japan). The miRNA precursors, negative control miRNA, and siRNAs were obtained from Applied Biosystems (Waltham, MA, USA). The procedures used for the transient transfection of miRNAs, siRNAs, and plasmid vectors were described in our previous studies [20,21,57,58]. miRNAs at 10 nM and siRNAs at 5 nM were transfected into HNSCC cell lines using RNAiMAX reagent (Invitrogen, Waltham, MA, USA). The reagents used in this study are listed in Supplemental Table S1; here, “mock”: transfection reagent only, and “control”: negative control miRNA precursor that have no function transfected.

4.2. Functional Assays of miR-30e-3p and SERPINE1 on HNSCC Cells

Cell proliferation, migration, and invasion assays were performed using HNSCC cells. The XTT assay (Sigma–Aldrich, St. Louis, MO, USA) characterized cell proliferation, a chamber assay using the Corning BioCoatTM cell culture chamber (Corning, Corning, NY, USA) assessed migration, and Matrigel chamber assays using the Corning BioCoat Matrigel assessed invasion. They were performed with HNSCC cells as described previously [20,21,57,58]. The reagents used in this study are listed in Supplemental Table S1.

4.3. RNA Extraction and Quantitative Real-Time Reverse Transcription Polymerase Chain Reaction (qRT-PCR)

RNA extraction from cell lines and qRT-PCR were performed as described in our previous studies [20,21,57,58]. The TaqMan assays used in this study are summarized in Supplemental Table S1. The primers for SYBR green assays designed in this study are summarized in Supplemental Table S3. GAPDH was used as the internal control.

4.4. Western Blotting and Immunohistochemistry

Western blotting and immunohistochemical procedures were described in our previous studies [20,21,48,49]. Paraffin sections for immunohistochemistry were obtained from HNSCC patients who underwent surgical treatment at Chiba University hospital. The clinical features of the HNSCC patients are summarized in Supplemental Table S2. The antibodies used in this study are shown in Supplemental Table S1. Full blots of the membrane are shown in Supplemental Figure S2. Our study has been approved by the Ethics Committee of Chiba University (approval number; 28–65, 10 February 2015). The research methodology is implemented in accordance with the standards set by the Declaration of Helsinki.

4.5. Dual Luciferase Reporter Assays

Synthetic DNA sequences of SERPINE1 with or without the miR-30e-3p-binding sites were inserted into the psiCHECK-2 vector (C8021; Promega, Madison, WI, USA). The differences between wild-type and deletion type sequences are detailed in Figure 6. Then, the plasmid vectors and miR-30e-3p were transfected into Sa3 cells. After 48 h of transfection, dual luciferase reporter assays were performed using the Dual Luciferase Reporter Assay System (Promega). Normalized data are expressed as a Renilla/Firefly luciferase activity ratio.

4.6. Identification of miR-30e-3p Targets in HNSCC

To predict miRNA binding sites, we relied on the TargetScanHuman database (release 7.2, http://www.targetscan.org/vert_72/; accessed on 1 August 2019) [59]. We assessed the genes that were downregulated by the transfection of miR-30e-3p into HNSCC cells using genome-wide gene expression analysis (microarray assays). Our expression data were deposited in the GEO database (accession number: GSE189290). The strategy used for the identification of miR-30e-3p target genes in this study is summarized in Figure 2.
To validate the expression of miR-30e-3p and identified target genes in multiple HNSCC samples, GSE45238, GSE31277, GSE30784, and GSE59102 were downloaded from GEO datasets.

4.7. Analysis of miRNAs and miRNA Target Genes in HNSCC Patients

We used TCGA-HNSC (https://tcga-data.nci.nih.gov/tcga/; accessed on 10 July 2019) to investigate the clinical significance of miRNAs and their target genes. Clinical parameters and gene expression data were obtained from cBioPortal (http://www.cbioportal.org/; accessed on 13 July 2019) [60,61] and OncoLnc (http://www.oncolnc.org/; accessed on 1 August 2019) [62].
For Kaplan–Meier analyses of overall survival, we downloaded TCGA clinical data (Firehose Legacy) from cBioPortal (https://www.cbioportal.org; data downloaded on 13 July 2019). Gene expression grouping data for each gene were collected from OncoLnc (http://www.oncolnc.org/; accessed on 1 August 2019).
Monovariate and multivariate analyses were also performed using TCGA-HNSC clinical data and survival data according to the expression level of each gene from OncoLnc to identify factors associated with HNSCC patient survival. In addition to gene expression, the tumor stage, pathological grade, and age were evaluated as potential independent prognostic factors. The multivariate analyses were performed using JMP Pro 15.0.0 (SAS Institute Inc., Cary, NC, USA).

4.8. Gene Set Enrichment Analysis (GSEA)

To analyze the molecular pathways related to SERPINE1, we performed GSEA. We divided TCGA-HNSC data into high and low expression groups according to the Z-score of the SERPINE1 expression level. A ranked list of genes was generated by log2 ratio comparing the expression levels of each gene between the two groups. The obtained gene lists were uploaded into GSEA software [63,64]. The Hallmark gene set in The Molecular Signatures Database was applied [63,65].

4.9. Statistical Analysis

All data are shown as mean values with standard errors derived from ≥3 independent experiments. Statistical analyses were determined using JMP Pro 15 (SAS Institute Inc., Cary, NC, USA). Welch’s t-test was performed to determine the significance of differences between two groups. Dunnet’s test was applied for comparisons among multiple groups. We applied Spearman’s rank test to evaluate the correlation between expression of miR-30e-3p and target genes. Monovariate and multivariate analyses were performed using Cox’s proportional hazards model. A p-value less than 0.05 was considered statistically significant.

5. Conclusions

In conclusion, analysis of the TCGA database showed that the expression level of miR-30e-3p was significantly downregulated in HNSCC clinical specimens. Ectopic expression assays demonstrated that miR-30e-3p inhibited HNSCC cells’ aggressiveness, suggesting that miR-30e-3p acted as a tumor suppressor. Interestingly, some of the putative targets regulated by miR-30e-3p closely predicted the prognosis of HNSCC patients. Our identification of miR-30e-3p (the passenger strand of pre-miR-30e) in the molecular pathogenesis of HNSCC may open the way to improved treatments of HNSCC oncogenesis.

Supplementary Materials

The following are available online at https://www.mdpi.com/article/10.3390/ijms23073808/s1.

Author Contributions

Data curation, C.M., S.A.; formal analysis, C.M., S.A.; investigation, C.M., S.A., A.K. (Ayaka Koma), I.K.-K., N.T., N.K.; project administration, N.S.; supervision, H.Y., T.H. and K.U.; writing—original draft, C.M. and N.S.; writing—review and editing, A.K. (Atsushi Kasamatsu). All authors have read and agreed to the published version of the manuscript.

Funding

This study was supported by JSPS KAKENHI grant numbers 19H03847, 20H03883, and 21K09577.

Institutional Review Board Statement

The study was conducted according to the Declaration of Helsinki and approved by the Bioethics Committee of Chiba University (approval number: 28–65, 10 February 2015).

Informed Consent Statement

Informed consent was obtained from all subjects involved in the study.

Data Availability Statement

Our expression data were deposited in the GEO database (accession number: GSE189290).

Acknowledgments

The results shown here are in part based upon data generated by the TCGA Research Network: https://www.cancer.gov/tcga (accessed on 13 July 2019).

Conflicts of Interest

The authors declare no conflict of interest.

References

  1. Bray, F.; Ferlay, J.; Soerjomataram, I.; Siegel, R.L.; Torre, L.A.; Jemal, A. Global cancer statistics 2018: GLOBOCAN estimates of incidence and mortality worldwide for 36 cancers in 185 countries. CA Cancer J. Clin. 2018, 68, 394–424. [Google Scholar] [CrossRef] [PubMed] [Green Version]
  2. Johnson, D.E.; Burtness, B.; Leemans, C.R.; Lui, V.W.Y.; Bauman, J.E.; Grandis, J.R. Head and neck squamous cell carcinoma. Nat. Rev. Dis. Primers 2020, 6, 92. [Google Scholar] [CrossRef] [PubMed]
  3. Cramer, J.D.; Burtness, B.; Le, Q.T.; Ferris, R.L. The changing therapeutic landscape of head and neck cancer. Nat. Rev. Clin. Oncol. 2019, 16, 669–683. [Google Scholar] [CrossRef] [PubMed]
  4. Chow, L.Q.M. Head and Neck Cancer. N. Engl. J. Med. 2020, 382, 60–72. [Google Scholar] [CrossRef]
  5. Kulasinghe, A.; Perry, C.; Jovanovic, L.; Nelson, C.; Punyadeera, C. Circulating tumour cells in metastatic head and neck cancers. Int. J. Cancer 2015, 136, 2515–2523. [Google Scholar] [CrossRef]
  6. Tran, G.; Zafar, S.Y. Financial toxicity and implications for cancer care in the era of molecular and immune therapies. Ann. Transl. Med. 2018, 6, 166. [Google Scholar] [CrossRef]
  7. Anfossi, S.; Babayan, A.; Pantel, K.; Calin, G.A. Clinical utility of circulating non-coding RNAs—An update. Nat. Rev. Clin. Oncol. 2018, 15, 541–563. [Google Scholar] [CrossRef]
  8. Esteller, M. Non-coding RNAs in human disease. Nat. Rev. Genet. 2011, 12, 861–874. [Google Scholar] [CrossRef]
  9. Panni, S.; Lovering, R.C.; Porras, P.; Orchard, S. Non-coding RNA regulatory networks. Biochim. Biophys. Acta Gene Regul. Mech. 2020, 1863, 194417. [Google Scholar] [CrossRef]
  10. Anastasiadou, E.; Jacob, L.S.; Slack, F.J. Non-coding RNA networks in cancer. Nat. Rev. Cancer 2018, 18, 5–18. [Google Scholar] [CrossRef]
  11. Ha, M.; Kim, V.N. Regulation of microRNA biogenesis. Nat. Rev. Mol. Cell Biol. 2014, 15, 509–524. [Google Scholar] [CrossRef] [PubMed]
  12. He, L.; Hannon, G.J. MicroRNAs: Small RNAs with a big role in gene regulation. Nat. Rev. Genet. 2004, 5, 522–531. [Google Scholar] [CrossRef] [PubMed]
  13. Lin, S.; Gregory, R.I. MicroRNA biogenesis pathways in cancer. Nat. Rev. Cancer 2015, 15, 321–333. [Google Scholar] [CrossRef] [PubMed]
  14. Carron, J.; Torricelli, C.; Silva, J.K.; Queiroz, G.S.R.; Ortega, M.M.; Lima, C.S.P.; Lourenço, G.J. microRNAs deregulation in head and neck squamous cell carcinoma. Head Neck 2021, 43, 645–667. [Google Scholar] [CrossRef] [PubMed]
  15. Gebert, L.F.R.; MacRae, I.J. Regulation of microRNA function in animals. Nat. Rev. Mol. Cell Biol. 2019, 20, 21–37. [Google Scholar] [CrossRef] [PubMed]
  16. Mizuno, K.; Tanigawa, K.; Misono, S.; Suetsugu, T.; Sanada, H.; Uchida, A.; Kawano, M.; Machida, K.; Asai, S.; Moriya, S.; et al. Regulation of Oncogenic Targets by Tumor-Suppressive miR-150-3p in Lung Squamous Cell Carcinoma. Biomedicines 2021, 9, 1883. [Google Scholar] [CrossRef]
  17. Hozaka, Y.; Kita, Y.; Yasudome, R.; Tanaka, T.; Wada, M.; Idichi, T.; Tanabe, K.; Asai, S.; Moriya, S.; Toda, H.; et al. RNA-Sequencing Based microRNA Expression Signature of Colorectal Cancer: The Impact of Oncogenic Targets Regulated by miR-490-3p. Int. J. Mol. Sci. 2021, 22, 9876. [Google Scholar] [CrossRef]
  18. Oshima, S.; Asai, S.; Seki, N.; Minemura, C.; Kinoshita, T.; Goto, Y.; Kikkawa, N.; Moriya, S.; Kasamatsu, A.; Hanazawa, T.; et al. Identification of Tumor Suppressive Genes Regulated by miR-31-5p and miR-31-3p in Head and Neck Squamous Cell Carcinoma. Int. J. Mol. Sci. 2021, 22, 6199. [Google Scholar] [CrossRef]
  19. Shinden, Y.; Hirashima, T.; Nohata, N.; Toda, H.; Okada, R.; Asai, S.; Tanaka, T.; Hozaka, Y.; Ohtsuka, T.; Kijima, Y.; et al. Molecular pathogenesis of breast cancer: Impact of miR-99a-5p and miR-99a-3p regulation on oncogenic genes. J. Hum. Genet. 2021, 66, 519–534. [Google Scholar] [CrossRef]
  20. Tanaka, N.; Minemura, C.; Asai, S.; Kikkawa, N.; Kinoshita, T.; Oshima, S.; Koma, A.; Kasamatsu, A.; Hanazawa, T.; Uzawa, K.; et al. Identification of miR-199-5p and miR-199-3p Target Genes: Paxillin Facilities Cancer Cell Aggressiveness in Head and Neck Squamous Cell Carcinoma. Genes 2021, 12, 1910. [Google Scholar] [CrossRef]
  21. Okada, R.; Goto, Y.; Yamada, Y.; Kato, M.; Asai, S.; Moriya, S.; Ichikawa, T.; Seki, N. Regulation of Oncogenic Targets by the Tumor-Suppressive miR-139 Duplex (miR-139-5p and miR-139-3p) in Renal Cell Carcinoma. Biomedicines 2020, 8, 599. [Google Scholar] [CrossRef] [PubMed]
  22. Toda, H.; Seki, N.; Kurozumi, S.; Shinden, Y.; Yamada, Y.; Nohata, N.; Moriya, S.; Idichi, T.; Maemura, K.; Fujii, T.; et al. RNA-sequence-based microRNA expression signature in breast cancer: Tumor-suppressive miR-101-5p regulates molecular pathogenesis. Mol. Oncol. 2020, 14, 426–446. [Google Scholar] [CrossRef] [PubMed] [Green Version]
  23. Wada, M.; Goto, Y.; Tanaka, T.; Okada, R.; Moriya, S.; Idichi, T.; Noda, M.; Sasaki, K.; Kita, Y.; Kurahara, H.; et al. RNA sequencing-based microRNA expression signature in esophageal squamous cell carcinoma: Oncogenic targets by antitumor miR-143-5p and miR-143-3p regulation. J. Hum. Genet. 2020, 65, 1019–1034. [Google Scholar] [CrossRef] [PubMed]
  24. Koshizuka, K.; Hanazawa, T.; Arai, T.; Okato, A.; Kikkawa, N.; Seki, N. Involvement of aberrantly expressed microRNAs in the pathogenesis of head and neck squamous cell carcinoma. Cancer Metastasis Rev. 2017, 36, 525–545. [Google Scholar] [CrossRef] [PubMed]
  25. Tanaka, T.; Okada, R.; Hozaka, Y.; Wada, M.; Moriya, S.; Satake, S.; Idichi, T.; Kurahara, H.; Ohtsuka, T.; Seki, N. Molecular Pathogenesis of Pancreatic Ductal Adenocarcinoma: Impact of miR-30c-5p and miR-30c-2-3p Regulation on Oncogenic Genes. Cancers 2020, 12, 2731. [Google Scholar] [CrossRef]
  26. Nepal, P.; Hozaka, Y.; Tanaka, T.; Wada, M.; Asai, S.; Minemura, C.; Idichi, T.; Arigami, T.; Kurahara, H.; Seki, N.; et al. Impact of Oncogenic Targets Controlled by Tumor-Suppressive miR-30a-5p in Pancreatic Ductal Adenocarcinoma. Anticancer Res. 2021, 41, 4821–4836. [Google Scholar] [CrossRef]
  27. Yang, S.J.; Yang, S.Y.; Wang, D.D.; Chen, X.; Shen, H.Y.; Zhang, X.H.; Zhong, S.L.; Tang, J.H.; Zhao, J.H. The miR-30 family: Versatile players in breast cancer. Tumour Biol 2017, 39, 1010428317692204. [Google Scholar] [CrossRef] [Green Version]
  28. Zhang, S.; Li, G.; Liu, C.; Lu, S.; Jing, Q.; Chen, X.; Zheng, H.; Ma, H.; Zhang, D.; Ren, S.; et al. miR-30e-5p represses angiogenesis and metastasis by directly targeting AEG-1 in squamous cell carcinoma of the head and neck. Cancer Sci. 2020, 111, 356–368. [Google Scholar] [CrossRef] [Green Version]
  29. Saleh, A.D.; Cheng, H.; Martin, S.E.; Si, H.; Ormanoglu, P.; Carlson, S.; Clavijo, P.E.; Yang, X.; Das, R.; Cornelius, S.; et al. Integrated Genomic and Functional microRNA Analysis Identifies miR-30-5p as a Tumor Suppressor and Potential Therapeutic Nanomedicine in Head and Neck Cancer. Clin. Cancer Res. 2019, 25, 2860–2873. [Google Scholar] [CrossRef] [Green Version]
  30. Mitra, R.; Adams, C.M.; Jiang, W.; Greenawalt, E.; Eischen, C.M. Pan-cancer analysis reveals cooperativity of both strands of microRNA that regulate tumorigenesis and patient survival. Nat. Commun. 2020, 11, 968. [Google Scholar] [CrossRef] [Green Version]
  31. Shimomura, H.; Okada, R.; Tanaka, T.; Hozaka, Y.; Wada, M.; Moriya, S.; Idichi, T.; Kita, Y.; Kurahara, H.; Ohtsuka, T.; et al. Role of miR-30a-3p Regulation of Oncogenic Targets in Pancreatic Ductal Adenocarcinoma Pathogenesis. Int. J. Mol. Sci. 2020, 21, 6459. [Google Scholar] [CrossRef] [PubMed]
  32. Yamada, Y.; Koshizuka, K.; Hanazawa, T.; Kikkawa, N.; Okato, A.; Idichi, T.; Arai, T.; Sugawara, S.; Katada, K.; Okamoto, Y.; et al. Passenger strand of miR-145-3p acts as a tumor-suppressor by targeting MYO1B in head and neck squamous cell carcinoma. Int. J. Oncol. 2018, 52, 166–178. [Google Scholar] [CrossRef] [PubMed]
  33. Koma, A.; Asai, S.; Minemura, C.; Oshima, S.; Kinoshita, T.; Kikkawa, N.; Koshizuka, K.; Moriya, S.; Kasamatsu, A.; Hanazawa, T.; et al. Impact of Oncogenic Targets by Tumor-Suppressive miR-139-5p and miR-139-3p Regulation in Head and Neck Squamous Cell Carcinoma. Int. J. Mol. Sci. 2021, 22, 9947. [Google Scholar] [CrossRef] [PubMed]
  34. Wang, D.; Zhu, C.; Zhang, Y.; Zheng, Y.; Ma, F.; Su, L.; Shao, G. MicroRNA-30e-3p inhibits cell invasion and migration in clear cell renal cell carcinoma by targeting Snail1. Oncol. Lett. 2017, 13, 2053–2058. [Google Scholar] [CrossRef] [Green Version]
  35. Shi, H.; Yan, C.; Chen, Y.; Wang, Z.; Guo, J.; Pei, H. Propofol inhibits the proliferation, migration, invasion and epithelial to mesenchymal transition of renal cell carcinoma cells by regulating microRNA-363/Snail1. Am. J. Transl. Res. 2021, 13, 2256–2269. [Google Scholar]
  36. Gramantieri, L.; Pollutri, D.; Gagliardi, M.; Giovannini, C.; Quarta, S.; Ferracin, M.; Casadei-Gardini, A.; Callegari, E.; De Carolis, S.; Marinelli, S.; et al. MiR-30e-3p Influences Tumor Phenotype through MDM2/TP53 Axis and Predicts Sorafenib Resistance in Hepatocellular Carcinoma. Cancer Res. 2020, 80, 1720–1734. [Google Scholar] [CrossRef]
  37. Kurashige, J.; Yokobori, T.; Mima, K.; Sawada, G.; Takahashi, Y.; Ueo, H.; Takano, Y.; Matsumura, T.; Uchi, R.; Eguchi, H.; et al. Plastin3 is associated with epithelial-mesenchymal transition and poor prognosis in gastric cancer. Oncol. Lett. 2019, 17, 2393–2399. [Google Scholar] [CrossRef]
  38. Wolff, L.; Strathmann, E.A.; Müller, I.; Mählich, D.; Veltman, C.; Niehoff, A.; Wirth, B. Plastin 3 in health and disease: A matter of balance. Cell Mol. Life Sci. 2021, 78, 5275–5301. [Google Scholar] [CrossRef]
  39. Sugimachi, K.; Yokobori, T.; Iinuma, H.; Ueda, M.; Ueo, H.; Shinden, Y.; Eguchi, H.; Sudo, T.; Suzuki, A.; Maehara, Y.; et al. Aberrant expression of plastin-3 via copy number gain induces the epithelial-mesenchymal transition in circulating colorectal cancer cells. Ann. Surg. Oncol. 2014, 21, 3680–3690. [Google Scholar] [CrossRef]
  40. Kuriyama, K.; Yokobori, T.; Sohda, M.; Nakazawa, N.; Yajima, T.; Naruse, I.; Kuwano, H.; Shirabe, K.; Kaira, K.; Saeki, H. Plasma plastin-3: A tumor marker in patients with non-small-cell lung cancer treated with nivolumab. Oncol. Lett. 2021, 21, 11. [Google Scholar] [CrossRef]
  41. Hori, T.; Kato, S.; Saeki, M.; DeMartino, G.N.; Slaughter, C.A.; Takeuchi, J.; Toh-e, A.; Tanaka, K. cDNA cloning and functional analysis of p28 (Nas6p) and p40.5 (Nas7p), two novel regulatory subunits of the 26S proteasome. Gene 1998, 216, 113–122. [Google Scholar] [CrossRef]
  42. Li, H.; Zhang, J.; Zhen, C.; Yang, B.; Feng, L. Gankyrin as a potential target for tumor therapy: Evidence and perspectives. Am. J. Transl. Res. 2018, 10, 1949–1960. [Google Scholar] [PubMed]
  43. Li, J.; Knobloch, T.J.; Kresty, L.A.; Zhang, Z.; Lang, J.C.; Schuller, D.E.; Weghorst, C.M. Gankyrin, a biomarker for epithelial carcinogenesis, is overexpressed in human oral cancer. Anticancer Res. 2011, 31, 2683–2692. [Google Scholar] [PubMed]
  44. Yan, C.; Theodorescu, D. RAL GTPases: Biology and Potential as Therapeutic Targets in Cancer. Pharm. Rev. 2018, 70, 1–11. [Google Scholar] [CrossRef]
  45. Chardin, P.; Tavitian, A. Coding sequences of human ralA and ralB cDNAs. Nucleic Acids Res. 1989, 17, 4380. [Google Scholar] [CrossRef] [Green Version]
  46. Chien, Y.; White, M.A. RAL GTPases are linchpin modulators of human tumour-cell proliferation and survival. EMBO Rep. 2003, 4, 800–806. [Google Scholar] [CrossRef] [Green Version]
  47. Lim, K.H.; O’Hayer, K.; Adam, S.J.; Kendall, S.D.; Campbell, P.M.; Der, C.J.; Counter, C.M. Divergent roles for RalA and RalB in malignant growth of human pancreatic carcinoma cells. Curr. Biol. 2006, 16, 2385–2394. [Google Scholar] [CrossRef] [Green Version]
  48. Ghosh, A.K.; Vaughan, D.E. PAI-1 in tissue fibrosis. J. Cell Physiol. 2012, 227, 493–507. [Google Scholar] [CrossRef] [Green Version]
  49. Li, S.; Wei, X.; He, J.; Tian, X.; Yuan, S.; Sun, L. Plasminogen activator inhibitor-1 in cancer research. Biomed. Pharm. 2018, 105, 83–94. [Google Scholar] [CrossRef]
  50. Kubala, M.H.; DeClerck, Y.A. The plasminogen activator inhibitor-1 paradox in cancer: A mechanistic understanding. Cancer Metastasis Rev. 2019, 38, 483–492. [Google Scholar] [CrossRef]
  51. Pavón, M.A.; Arroyo-Solera, I.; Céspedes, M.V.; Casanova, I.; León, X.; Mangues, R. uPA/uPAR and SERPINE1 in head and neck cancer: Role in tumor resistance, metastasis, prognosis and therapy. Oncotarget 2016, 7, 57351–57366. [Google Scholar] [CrossRef] [PubMed] [Green Version]
  52. Pavón, M.A.; Arroyo-Solera, I.; Téllez-Gabriel, M.; León, X.; Virós, D.; López, M.; Gallardo, A.; Céspedes, M.V.; Casanova, I.; López-Pousa, A.; et al. Enhanced cell migration and apoptosis resistance may underlie the association between high SERPINE1 expression and poor outcome in head and neck carcinoma patients. Oncotarget 2015, 6, 29016–29033. [Google Scholar] [CrossRef] [PubMed] [Green Version]
  53. Arroyo-Solera, I.; Pavón, M.; León, X.; López, M.; Gallardo, A.; Céspedes, M.V.; Casanova, I.; Pallarès, V.; López-Pousa, A.; Mangues, M.A.; et al. Effect of serpinE1 overexpression on the primary tumor and lymph node, and lung metastases in head and neck squamous cell carcinoma. Head Neck 2019, 41, 429–439. [Google Scholar] [CrossRef] [PubMed]
  54. Ali Syeda, Z.; Langden, S.S.S.; Munkhzul, C.; Lee, M.; Song, S.J. Regulatory Mechanism of MicroRNA Expression in Cancer. Int. J. Mol. Sci. 2020, 21, 1723. [Google Scholar] [CrossRef] [PubMed] [Green Version]
  55. Zhao, C.; Liu, Z. MicroRNA 617 Targeting SERPINE1 Inhibited the Progression of Oral Squamous Cell Carcinoma. Mol. Cell Biol. 2021, 41, e0056520. [Google Scholar] [CrossRef] [PubMed]
  56. Li, X.; Wu, P.; Tang, Y.; Fan, Y.; Liu, Y.; Fang, X.; Wang, W.; Zhao, S. Down-Regulation of MiR-181c-5p Promotes Epithelial-to-Mesenchymal Transition in Laryngeal Squamous Cell Carcinoma via Targeting SERPINE1. Front. Oncol. 2020, 10, 544476. [Google Scholar] [CrossRef]
  57. Mizuno, K.; Tanigawa, K.; Nohata, N.; Misono, S.; Okada, R.; Asai, S.; Moriya, S.; Suetsugu, T.; Inoue, H.; Seki, N. FAM64A: A Novel Oncogenic Target of Lung Adenocarcinoma Regulated by Both Strands of miR-99a (miR-99a-5p and miR-99a-3p). Cells 2020, 9, 2083. [Google Scholar] [CrossRef]
  58. Kase-Kato, I.; Asai, S.; Minemura, C.; Tsuneizumi, K.; Oshima, S.; Koma, A.; Kasamatsu, A.; Hanazawa, T.; Uzawa, K.; Seki, N. Molecular Pathogenesis of the Coronin Family: CORO2A Facilitates Migration and Invasion Abilities in Oral Squamous Cell Carcinoma. Int. J. Mol. Sci. 2021, 22, 2684. [Google Scholar] [CrossRef]
  59. Agarwal, V.; Bell, G.W.; Nam, J.W.; Bartel, D.P. Predicting effective microRNA target sites in mammalian mRNAs. eLife 2015, 4, e05005. [Google Scholar] [CrossRef]
  60. Gao, J.; Aksoy, B.A.; Dogrusoz, U.; Dresdner, G.; Gross, B.; Sumer, S.O.; Sun, Y.; Jacobsen, A.; Sinha, R.; Larsson, E.; et al. Integrative analysis of complex cancer genomics and clinical profiles using the cBioPortal. Sci. Signal. 2013, 6, pl1. [Google Scholar] [CrossRef] [Green Version]
  61. Cerami, E.; Gao, J.; Dogrusoz, U.; Gross, B.E.; Sumer, S.O.; Aksoy, B.A.; Jacobsen, A.; Byrne, C.J.; Heuer, M.L.; Larsson, E.; et al. The cBio cancer genomics portal: An open platform for exploring multidimensional cancer genomics data. Cancer Discov. 2012, 2, 401–404. [Google Scholar] [CrossRef] [PubMed] [Green Version]
  62. Anaya, J. Linking TCGA survival data to mRNAs, miRNAs, and lncRNAs. Peer J. Comput. Sci. 2016, 2, e67. [Google Scholar] [CrossRef] [Green Version]
  63. Subramanian, A.; Tamayo, P.; Mootha, V.K.; Mukherjee, S.; Ebert, B.L.; Gillette, M.A.; Paulovich, A.; Pomeroy, S.L.; Golub, T.R.; Lander, E.S.; et al. Gene set enrichment analysis: A knowledge-based approach for interpreting genome-wide expression profiles. Proc. Natl. Acad. Sci. USA 2005, 102, 15545–15550. [Google Scholar] [CrossRef] [PubMed] [Green Version]
  64. Mootha, V.K.; Lindgren, C.M.; Eriksson, K.F.; Subramanian, A.; Sihag, S.; Lehar, J.; Puigserver, P.; Carlsson, E.; Ridderstråle, M.; Laurila, E.; et al. PGC-1alpha-responsive genes involved in oxidative phosphorylation are coordinately downregulated in human diabetes. Nat. Genet. 2003, 34, 267–273. [Google Scholar] [CrossRef] [PubMed]
  65. Liberzon, A.; Subramanian, A.; Pinchback, R.; Thorvaldsdóttir, H.; Tamayo, P.; Mesirov, J.P. Molecular signatures database (MSigDB) 3.0. Bioinformatics 2011, 27, 1739–1740. [Google Scholar] [CrossRef] [PubMed]
Figure 1. Tumor-suppressive role of miR-30e-3p in HNSCC cells. (A) The expression level of miR-30e-3p was analyzed using the TCGA-HNSC database. A total of 485 HNSCC tissues and 44 normal epithelial tissues were evaluated. (B) Kaplan–Meier survival analyses of HNSCC patients using data from the TCGA database. Patients were divided into two groups (top 25% and low 25%). The red and blue lines indicate the high and low expression groups, respectively (log rank p value = 0.0353, HR = 0.6097, 95% CI: 0.3828–0.9711). (CE) Functional assays of cell proliferation, migration, and invasion following the transient transfection of miR-30e-3p in HNSCC cell lines (Sa3 and SAS cells). (C) Cell proliferation assessed by XTT assay at 72 h after siRNA transfection. (D) Cell migration assessed using a membrane culture system at 48 h after seeding miRNA-transfected cells into the chambers. (E) Cell invasion assessed by Matrigel invasion assays at 48 h after seeding miRNA-transfected cells into chambers.
Ijms 23 03808 g001
Figure 2. Flowchart of the strategy used to identify candidate miR-30e-3p target genes in HNSCC cells.
Ijms 23 03808 g002
Figure 3. HNSCC tissue expression of 11 target genes of miR-30e-3p using TCGA-HNSC data. The expression levels of 11 genes (ADA, CPNE8, C14orf126, ERGIC2, HMGA2, PLS3, PSMD10, RALB, SERPINE1, SFXN1, and TMEM87B) were analyzed using the TCGA-HNSC database. A total of 518 HNSCC tissues and 44 normal epithelial tissues were evaluated.
Ijms 23 03808 g003
Figure 4. Five-year survival rates of 11 target genes of miR-30e-3p using TCGA-HNSC data. Kaplan–Meier survival analyses of HNSCC patients using data from the TCGA database. Patients were divided into high and low expression groups according to the median of each gene expression level. The red and blue lines indicate the high and low expression groups, respectively.
Ijms 23 03808 g004
Figure 5. Clinical significance of SERPINE1 using TCGA-HSCC data. (A) Forest plot showing the multivariate analysis results for SERPINE1, which were identified as independent prognostic factors for overall survival after adjustment for patient age, disease stage, and pathological grade. (B) Expression negative correlation between miR-30e-3p and SERPINE1 in HNSCC clinical specimens. Spearman’s rank test indicated negative correlations of miR-30e-3p expression with SERPINE1 (p < 0.01, r = −0.3717). (C) Immunohistochemical staining of SERPINE1 in HNSCC clinical specimens. SERPINE1 expression was high in the cancer lesions (right panels; b and d), whereas normal mucosa were only weakly stained (left panels; a and c).
Ijms 23 03808 g005
Figure 6. Direct regulation of SERPINE1 expression by miR-30e-3p in HNSCC cells. (A) qRT-PCR showing significantly reduced expression of SERPINE1 mRNA at 72 h after miR-30e-3p transfection in Sa3 and SAS cells. Expression of GAPDH was used as an internal control. (B) Western blot showing reduced expression of SERPINE1 protein at 72 h after miR-30e-3p transfection in Sa3 and SAS cells. Expression of GAPDH was used as an internal control. (C) TargetScan database analysis predicting two putative miR-30e-3p-binding sites in the 3′-UTR of SERPINE1 (upper panel).
Ijms 23 03808 g006
Figure 7. Functional assays of cell proliferation, migration, and invasion following the transient transfection of siRNAs targeting SERPINE1 in HNSCC cell lines (Sa3 and SAS cells). (AC) Functional assays of cell proliferation, migration, and invasion following the transient transfection of siSERPINE1–1 and siSERPINE1–2 in HNSCC cell lines (Sa3 and SAS cells). (A) Cell proliferation assessed by XTT assay at 72 h after siRNA transfection. (B) Cell migration assessed using a membrane culture system at 48 h after seeding miRNA-transfected cells into the chambers. (C) Cell invasion assessed by Matrigel invasion assays at 48 h after seeding miRNA-transfected cells into chambers. (D) GSEA analysis showed that most enrichment pathway was “epithelial–mesenchymal transition”.
Ijms 23 03808 g007
Table 1. Upregulated genes in HNSCC clinical specimens in TCGA-HNSC database analysis.
Entrez Gene IDGene SymbolGene NameTotal Binding SitesGEO log2 FC 15y OS 2
p-Value
FDR 3
5054SERPINE1serpin peptidase inhibitor, clade E (nexin, plasminogen activator inhibitor type 1), member 12−1.980.00030.0209
51290ERGIC2ERGIC and golgi 22−1.680.00320.0730
5358PLS3plastin 32−1.530.00470.0898
94081SFXN1sideroflexin 12−1.920.01090.1423
8091HMGA2high mobility group AT-hook 21−2.650.01310.1575
5716PSMD10proteasome (prosome, macropain) 26S subunit, non-ATPase, 101−1.520.02040.2014
84910TMEM87Btransmembrane protein 87B1−1.640.02270.2137
112487C14orf126D-tyrosyl-tRNA deacylase 2 (putative)1−1.580.03380.2663
100ADAadenosine deaminase1−1.640.03550.2736
5899RALBv-ral simian leukemia viral oncogene homolog B2−1.560.03700.2799
144402CPNE8copine VIII1−1.740.04000.2921
10923SUB1SUB1 homolog (S. cerevisiae)3−2.530.09330.4584
6566SLC16A1solute carrier family 16 (monocarboxylate transporter), member 14−1.750.09550.4640
3336HSPE1heat shock 10kDa protein 1 (chaperonin 10)1−1.530.09600.4652
55156ARMC1armadillo repeat containing 14−1.910.09970.4743
79624C6orf211chromosome 6 open reading frame 2114−1.500.12510.5316
528ATP6V1C1ATPase, H+ transporting, lysosomal 42kDa, V1 subunit C12−2.040.13090.5436
64841GNPNAT1glucosamine-phosphate N-acetyltransferase 13−1.730.15640.5927
10552ARPC1Aactin related protein 2/3 complex, subunit 1A, 41 kDa1−1.970.18710.6449
6780STAU1staufen double-stranded RNA binding protein 13−1.770.18830.6468
9265CYTH3cytohesin 32−1.520.21130.6817
90874ZNF697zinc finger protein 6973−1.580.21820.6915
5923RASGRF1Ras protein-specific guanine nucleotide-releasing factor 12−1.510.23590.7157
136ADORA2Badenosine A2b receptor1−2.090.23670.7168
81539SLC38A1solute carrier family 38, member 15−2.000.24930.7330
10473HMGN4high-mobility group nucleosomal binding domain 42−1.840.26780.7555
51762RAB8BRAB8B, member RAS oncogene family4−1.590.26830.7561
54165DCUN1D1DCN1, defective in cullin neddylation 1, domain containing 15−1.520.33270.8236
84056KATNAL1katanin p60 subunit A-like 12−1.550.36630.8530
3556IL1RAPinterleukin 1 receptor accessory protein1−3.200.39160.8729
112399EGLN3egl-9 family hypoxia-inducible factor 31−2.100.43890.9051
1021CDK6cyclin-dependent kinase 63−1.820.47330.9249
54108CHRAC1chromatin accessibility complex 11−1.650.47330.9249
7172TPMTthiopurine S-methyltransferase1−1.660.47540.9260
2113ETS1v-ets avian erythroblastosis virus E26 oncogene homolog 13−1.890.51190.9436
51199NINninein (GSK3B interacting protein)2−1.580.55820.9616
8862APLNapelin1−2.050.55960.9621
5597MAPK6mitogen-activated protein kinase 62−2.100.58180.9690
57045TWSG1twisted gastrulation BMP signaling modulator 11−1.690.58570.9701
55142HAUS2HAUS augmin-like complex, subunit 24−1.980.58620.9702
4015LOXlysyl oxidase1−1.550.61330.9769
4678NASPnuclear autoantigenic sperm protein (histone-binding)2−1.740.68110.9864
55824PAG1phosphoprotein associated with glycosphingolipid microdomains 15−2.100.70430.9871
3553IL1Binterleukin 1, beta1−2.150.73160.9871
65062ALS2CR4transmembrane protein 2371−1.860.73780.9871
51715RAB23RAB23, member RAS oncogene family2−1.700.78200.9871
4603MYBL1v-myb avian myeloblastosis viral oncogene homolog-like 11−1.550.78970.9871
4893NRASneuroblastoma RAS viral (v-ras) oncogene homolog3−2.530.79350.9871
84668FAM126Afamily with sequence similarity 126, member A2−1.610.84710.9871
51633OTUD6BOTU domain containing 6B2−1.630.92760.9871
3930LBRlamin B receptor1−2.400.94920.9871
8869ST3GAL5ST3 beta-galactoside alpha-2,3-sialyltransferase 51−2.380.96860.9871
1719DHFRdihydrofolate reductase4−1.960.97220.9871
1 Fold Change, 2 5-Year Overall Survival, 3 False Discovery Rate.
Table 2. The significantly enriched gene sets in the high SERPINE1 expression group in TCGA-HNSC.
NameNormalized Enrichment ScoreFDR q-Value
HALLMARK_EPITHELIAL_MESENCHYMAL_TRANSITION3.149q < 0.001
HALLMARK_MYOGENESIS2.866q < 0.001
HALLMARK_TNFA_SIGNALING_VIA_NFKB2.489q < 0.001
HALLMARK_ANGIOGENESIS2.349q < 0.001
HALLMARK_KRAS_SIGNALING_UP2.289q < 0.001
HALLMARK_COAGULATION2.285q < 0.001
HALLMARK_HYPOXIA2.282q < 0.001
HALLMARK_APICAL_JUNCTION2.247q < 0.001
HALLMARK_UV_RESPONSE_DN2.189q < 0.001
HALLMARK_INFLAMMATORY_RESPONSE2.156q < 0.001
HALLMARK_INTERFERON_ALPHA_RESPONSE2.054q < 0.001
HALLMARK_TGF_BETA_SIGNALING2.027q < 0.001
HALLMARK_INTERFERON_GAMMA_RESPONSE1.896q < 0.001
HALLMARK_COMPLEMENT1.846q < 0.001
HALLMARK_IL6_JAK_STAT3_SIGNALING1.836q < 0.001
HALLMARK_NOTCH_SIGNALING1.7930.001
HALLMARK_APOPTOSIS1.7160.002
HALLMARK_HEDGEHOG_SIGNALING1.6920.002
HALLMARK_IL2_STAT5_SIGNALING1.6180.004
HALLMARK_GLYCOLYSIS1.5930.005
HALLMARK_P53_PATHWAY1.3960.038
HALLMARK_WNT_BETA_CATENIN_SIGNALING1.3760.043
Publisher’s Note: MDPI stays neutral with regard to jurisdictional claims in published maps and institutional affiliations.

