
Application of the MAHDS Method for Multiple Alignment of Highly Diverged Amino Acid Sequences


Abstract
:1. Introduction
2. Results
2.1. Testing MAHDS Performance Using the BAliBASE
2.2. Determining the Significance Threshold for Z
2.3. Testing MAHDS Performance Using Artificial Sequences
2.4. Testing MAHDS Performance on Protein Families with Low Identity
3. Discussion
4. Materials and Methods
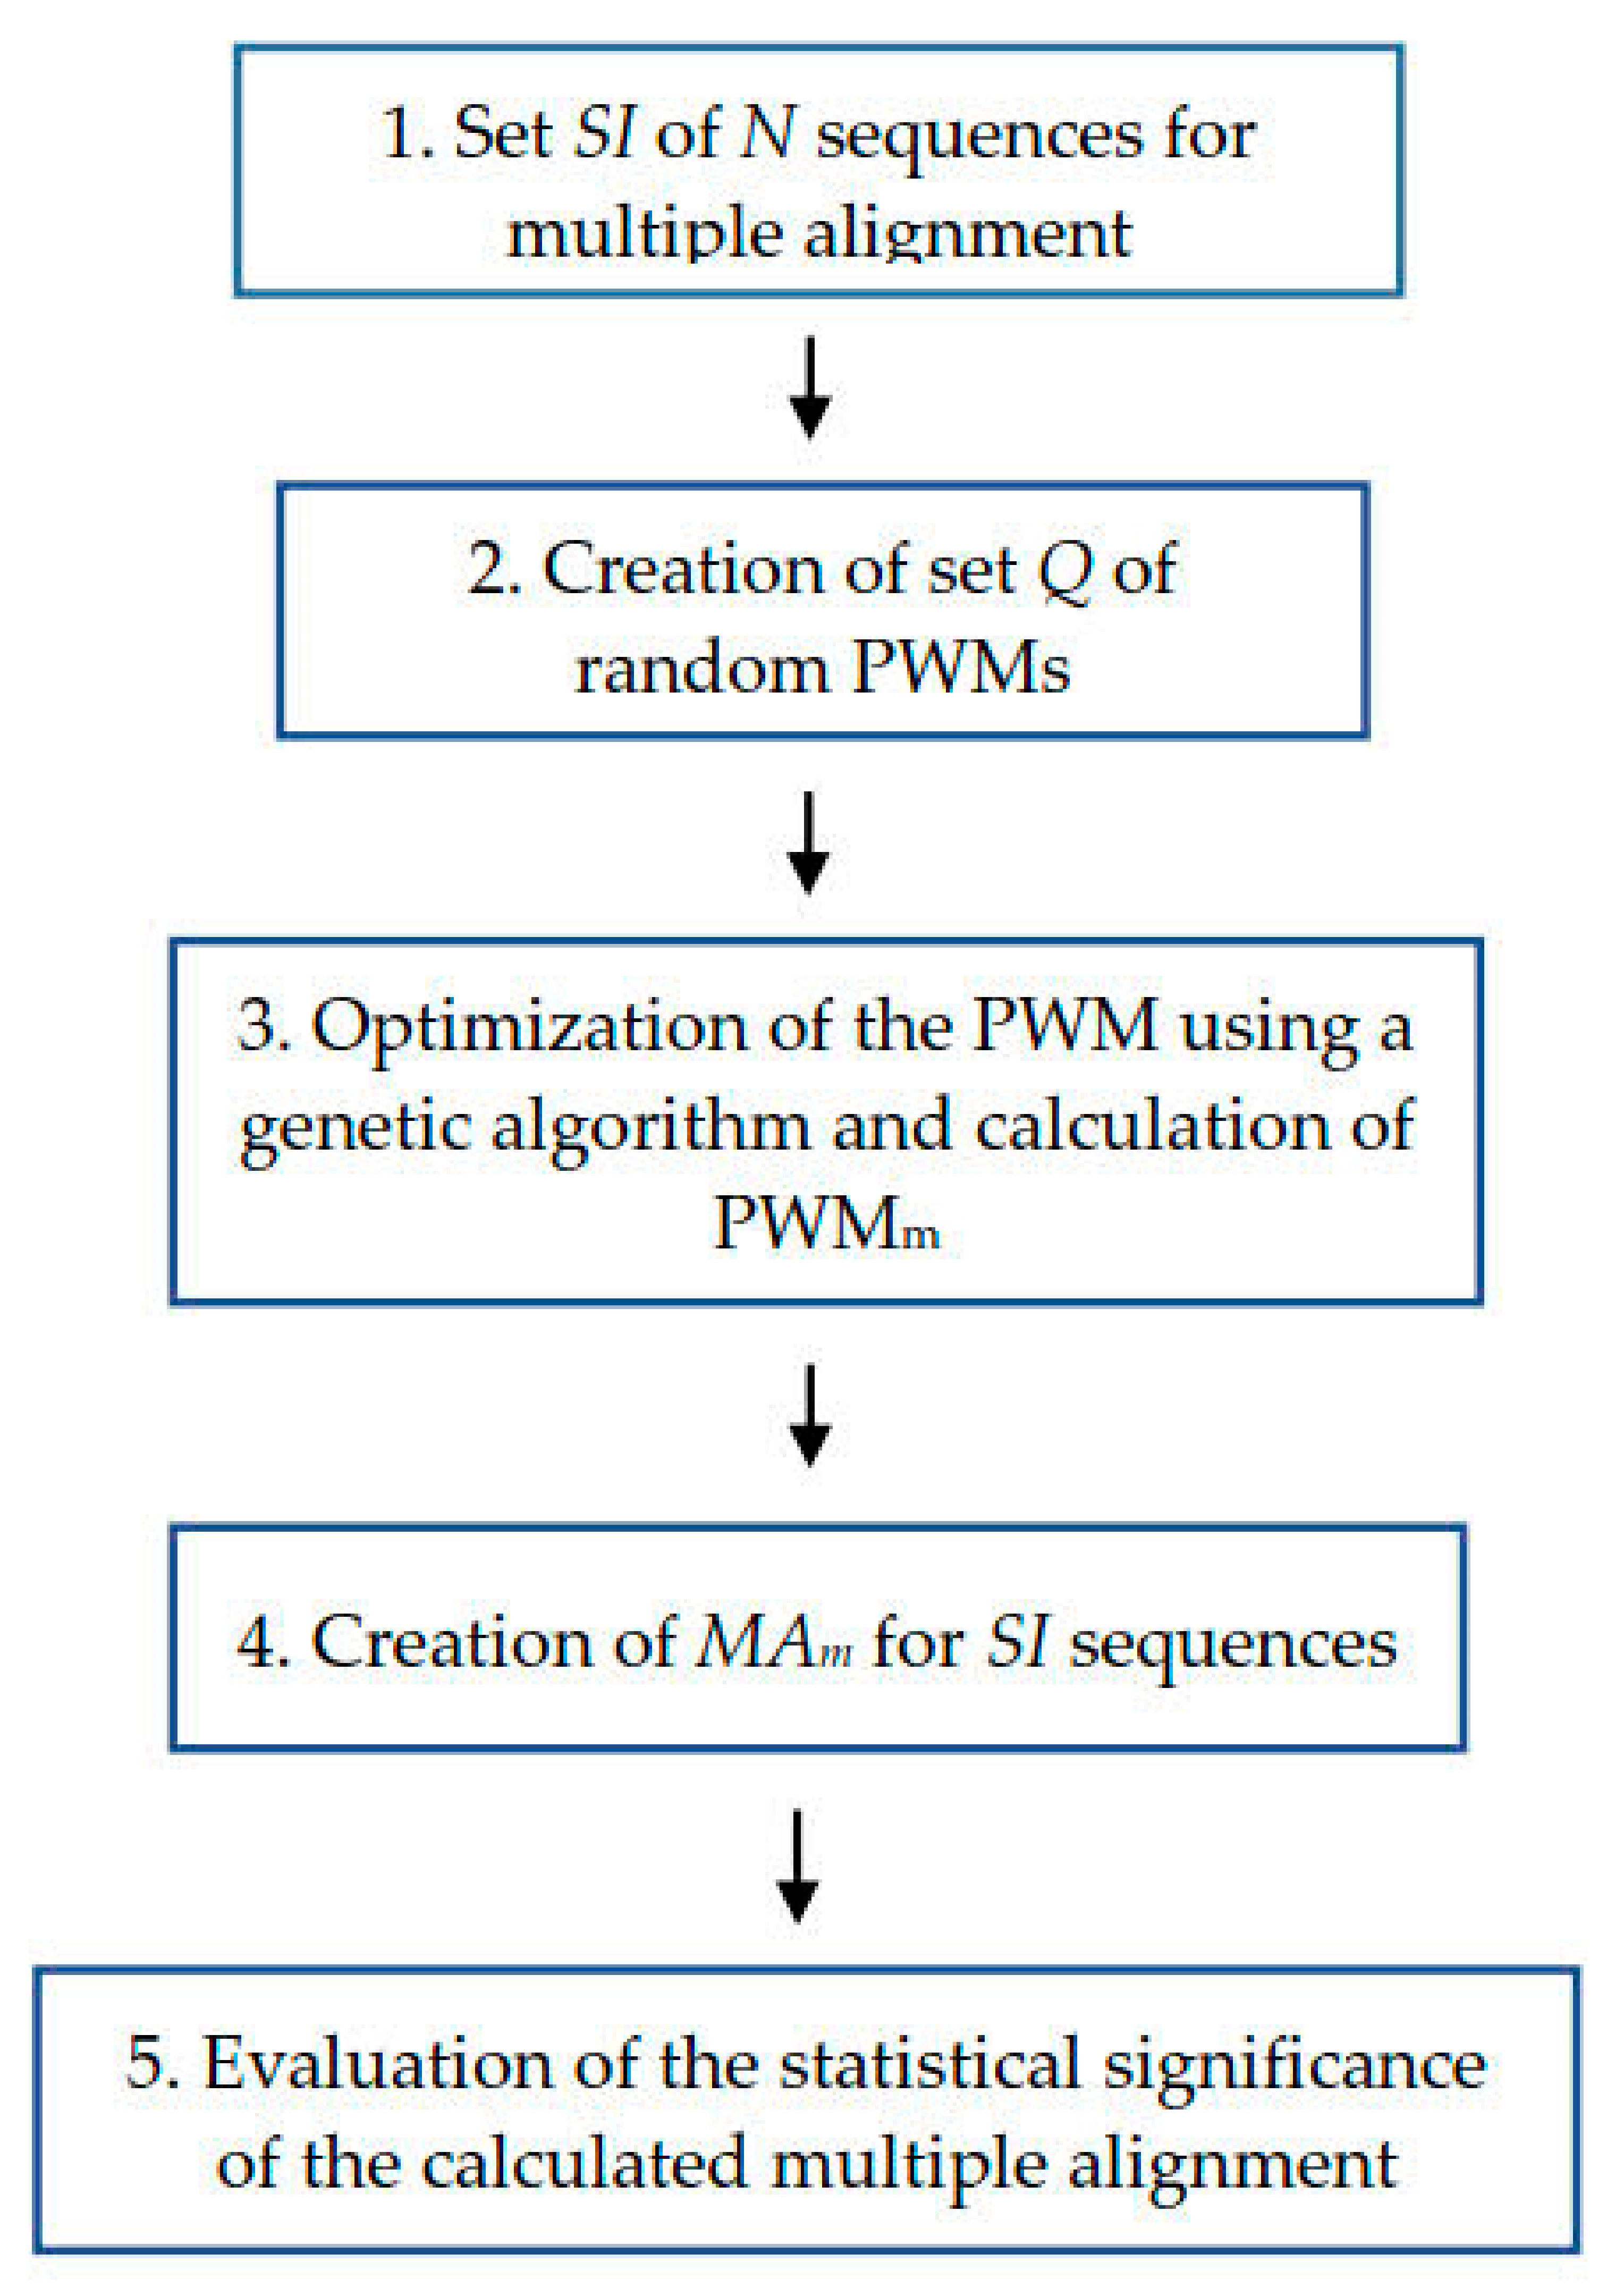
4.1. Algorithm to Calculate Multiple Alignment
4.2. Creation of Set Q of Random PWMs
4.3. Using a Genetic Algorithm to Optimize PWMs
4.4. Global Alignment of PWMs from Set Q and Sequences from Set SI
4.5. Algorithm for Constructing Multiple Alignment
4.6. Estimating the Statistical Significance of Multiple Alignments
4.6.1. Assessing the Statistical Significance of MAm
4.6.2. Estimating the Statistical Significance of an Arbitrary MA
4.7. Creation of Artificial Sequences to Compare Different Methods of Constructing MAs
Author Contributions
Funding
Conflicts of Interest
References
- Thompson, J.D.; Higgins, D.G.; Gibson, T.J. CLUSTAL W: Improving the sensitivity of progressive multiple sequence alignment through sequence weighting, position-specific gap penalties and weight matrix choice. Nucleic Acids Res. 1994, 22, 4673–4680. [Google Scholar] [CrossRef] [PubMed] [Green Version]
- Van Noorden, R.; Maher, B.; Nuzzo, R. The top 100 papers. Nature 2014, 514, 550–553. [Google Scholar] [CrossRef] [PubMed] [Green Version]
- Thompson, J.D.; Linard, B.; Lecompte, O.; Poch, O. A comprehensive benchmark study of multiple sequence alignment methods: Current challenges and future perspectives. PLoS ONE 2011, 6, e18093. [Google Scholar] [CrossRef] [PubMed]
- Kemena, C.; Notredame, C. Upcoming challenges for multiple sequence alignment methods in the high-throughput era. Bioinformatics 2009, 25, 2455–2465. [Google Scholar] [CrossRef] [Green Version]
- Wang, L.; Jiang, T. On the Complexity of Multiple Sequence Alignment. J. Comput. Biol. 1994, 1, 337–348. [Google Scholar] [CrossRef] [Green Version]
- Hogeweg, P.; Hesper, B. The alignment of sets of sequences and the construction of phyletic trees: An integrated method. J. Mol. Evol. 1984, 20, 175–186. [Google Scholar] [CrossRef]
- Sievers, F.; Wilm, A.; Dineen, D.; Gibson, T.J.; Karplus, K.; Li, W.; Lopez, R.; McWilliam, H.; Remmert, M.; Soding, J.; et al. Fast, scalable generation of high-quality protein multiple sequence alignments using Clustal Omega. Mol. Syst. Biol. 2014, 7, 539. [Google Scholar] [CrossRef]
- Katoh, K.; Rozewicki, J.; Yamada, K.D. MAFFT online service: Multiple sequence alignment, interactive sequence choice and visualization. Brief. Bioinform. 2019, 20, 1160–1166. [Google Scholar] [CrossRef] [Green Version]
- Notredame, C.; Higgins, D.G.; Heringa, J. T-coffee: A novel method for fast and accurate multiple sequence alignment. J. Mol. Biol. 2000, 302, 205–217. [Google Scholar] [CrossRef] [Green Version]
- Gotoh, O. Multiple sequence alignment: Algorithms and applications. Adv. Biophys. 1999, 36, 159–206. [Google Scholar] [CrossRef]
- Edgar, R.C. MUSCLE: Multiple sequence alignment with high accuracy and high throughput. Nucleic Acids Res. 2004, 32, 1792–1797. [Google Scholar] [CrossRef] [Green Version]
- UCSC-CRL-96-22: SAM: Sequence Alignment and Modeling Software System | Technical Reports. Available online: https://tr.soe.ucsc.edu/research/technical-reports/UCSC-CRL-96-22 (accessed on 19 November 2021).
- Analysis, B.S. Multiple Sequence Alignment using Profile HMM. Nucleic Acids Res. 1998, 26, 320–322. [Google Scholar]
- Notredame, C.; O’Brien, E.A.; Higgins, D.G. RAGA: RNA sequence alignment by genetic algorithm. Nucleic Acids Res. 1997, 25, 4570–4580. [Google Scholar] [CrossRef] [Green Version]
- Kim, J.; Pramanik, S.; Chung, M.J. Multiple sequence alignment using simulated annealing. Comput. Appl. Biosci. 1994, 10, 419–426. [Google Scholar] [CrossRef]
- Löytynoja, A.; Goldman, N. Phylogeny-aware gap placement prevents errors in sequence alignment and evolutionary analysis. Science 2008, 320, 1632–1635. [Google Scholar] [CrossRef] [Green Version]
- Szalkowski, A.M. Fast and robust multiple sequence alignment with phylogeny-aware gap placement. BMC Bioinf. 2012, 13, 129. [Google Scholar] [CrossRef] [Green Version]
- Korotkov, E.V.; Suvorova, Y.M.; Kostenko, D.O.; Korotkova, M.A. Multiple alignment of promoter sequences from the arabidopsis thaliana l. Genome. Genes 2021, 12, 135. [Google Scholar] [CrossRef]
- Kamionskaya, A.M.; Korotkova, M.A. Multiple Alignment of Promoter Sequences from the Human Genome. Biotekhnologiya 2020, 36, 7–14. [Google Scholar] [CrossRef]
- Korotkov, E.V.; Korotkova, M.A. Developing mathematical method for multi alignment of DNA sequences with weak similarity. J. Phys. Conf. Ser. 2019, 1205, 12025. [Google Scholar] [CrossRef]
- Larkin, M.A.; Blackshields, G.; Brown, N.P.; Chenna, R.; McGettigan, P.A.; McWilliam, H.; Valentin, F.; Wallace, I.M.; Wilm, A.; Lopez, R.; et al. Clustal W and Clustal X version 2. Bioinformatics 2007, 23, 2947–2948. [Google Scholar] [CrossRef] [Green Version]
- Katoh, K.; Frith, M.C. Adding unaligned sequences into an existing alignment using MAFFT and LAST. Bioinformatics 2012, 28, 3144–3146. [Google Scholar] [CrossRef] [PubMed]
- Lassmann, T.; Sonnhammer, E. Kalign—An accurate and fast multiple sequence alignment algorithm. BMC Bioinf. 2005, 6, 298. [Google Scholar] [CrossRef] [PubMed] [Green Version]
- Korotkova, M.A.; Kamionskya, A.M.; Korotkov, E.V. A mathematical method for the classification of promoter sequences from the A.thaliana genome. J. Phys. Conf. Ser. 2020, 1686, 012031. [Google Scholar] [CrossRef]
- Korotkov, E.V.; Suvorova, Y.M.; Nezhdanova, A.V.; Gaidukova, S.E.; Yakovleva, I.V.; Kamionskaya, A.M.; Korotkova, M.A. Mathematical Algorithm for Identification of Eukaryotic Promoter Sequences. Symmetry 2021, 13, 917. [Google Scholar] [CrossRef]
- Thompson, J.D.; Plewniak, F.; Poch, O. A comprehensive comparison of multiple sequence alignment programs. Nucleic Acids Res. 1999, 27, 2682–2690. [Google Scholar] [CrossRef]
- Thompson, J.D.; Koehl, P.; Ripp, R.; Poch, O. BAliBASE 3.0: Latest developments of the multiple sequence alignment benchmark. Proteins Struct. Funct. Genet. 2005, 61, 127–136. [Google Scholar] [CrossRef]
- Pais, F.S.M.; Ruy, P.C.; Oliveira, G.; Coimbra, R.S. Assessing the efficiency of multiple sequence alignment programs. Algorithms Mol. Biol. 2014, 9, 4. [Google Scholar] [CrossRef] [Green Version]
- Bahr, A.; Thompson, J.D.; Thierry, J.-C.; Poch, O. BAliBASE (Benchmark Alignment dataBASE): Enhancements for repeats, transmembrane sequences and circular permutations. Nucleic Acid Res. 2001, 29, 323–326. [Google Scholar] [CrossRef]
- Browning, B.L.; Browning, S.R. Detecting Identity by Descent and Estimating Genotype Error Rates in Sequence Data. Am. J. Hum. Genet. 2013, 93, 840–851. [Google Scholar] [CrossRef] [Green Version]
- Henikoff, S.; Henikoff, J.G. Amino acid substitution matrices from protein blocks. Proc. Natl. Acad. Sci. USA 1992, 89, 10915–10919. [Google Scholar] [CrossRef] [Green Version]
- Bastien, O.; Aude, J.-C.; Roy, S.; Maréchal, E. Fundamentals of massive automatic pairwise alignments of protein sequences: Theoretical significance of Z-value statistics. Bioinformatics 2004, 20, 534–537. [Google Scholar] [CrossRef]
- Pugacheva, V.; Korotkov, A.; Korotkov, E. Search of latent periodicity in amino acid sequences by means of genetic algorithm and dynamic programming. Stat. Appl. Genet. Mol. Biol. 2016, 15, 381–400. [Google Scholar] [CrossRef]
- Heringa, J.; Argos, P. A method to recognize distant repeats in protein sequences. Proteins 1993, 17, 391–411. [Google Scholar] [CrossRef]
- Russell, D.J. Multiple Sequence Alignment Methods—Edited by David J. Russell. Syst. Biol. 2015, 64, 690–692. [Google Scholar] [CrossRef] [Green Version]
- Zhang, C.; Freddolino, P.L.; Zhang, Y. COFACTOR: Improved protein function prediction by combining structure, sequence and protein-protein interaction information. Nucleic Acids Res. 2017, 45, W291–W299. [Google Scholar] [CrossRef]
- Haritha, P.; Shanmugavadivu, P.; Dhamodharan, S. A Comprehensive Review on Protein Sequence Analysis Techniques. Int. J. Comput. Sci. Eng. 2018, 6, 1433–1442. [Google Scholar] [CrossRef]
- Yoon, B.-J. Hidden Markov Models and their Applications in Biological Sequence Analysis. Curr. Genom. 2009, 10, 402–415. [Google Scholar] [CrossRef] [Green Version]
- Gil, N.; Fiser, A. The choice of sequence homologs included in multiple sequence alignments has a dramatic impact on evolutionary conservation analysis. Bioinformatics 2019, 35, 12–19. [Google Scholar] [CrossRef]
- Spielman, S.J.; Miraglia, M.L. Relative model selection of evolutionary substitution models can be sensitive to multiple sequence alignment uncertainty. BMC Ecol. Evol. 2021, 21, 214. [Google Scholar] [CrossRef]
- Wu, S.; Zhang, Y. ANGLOR: A composite machine-learning algorithm for protein backbone torsion angle prediction. PLoS ONE 2008, 3, e3400. [Google Scholar] [CrossRef]
- Hanson, J.; Paliwal, K.; Litfin, T.; Yang, Y.; Zhou, Y. Accurate prediction of protein contact maps by coupling residual two-dimensional bidirectional long short-term memory with convolutional neural networks. Bioinformatics 2018, 34, 4039–4045. [Google Scholar] [CrossRef] [PubMed]
- Zheng, W.; Zhang, C.; Wuyun, Q.; Pearce, R.; Li, Y.; Zhang, Y. LOMETS2: Improved meta-threading server for fold-recognition and structure-based function annotation for distant-homology proteins. Nucleic Acids Res. 2019, 47, W429–W436. [Google Scholar] [CrossRef] [Green Version]
- Zhang, C.; Mortuza, S.M.; He, B.; Wang, Y.; Zhang, Y. Template-based and free modeling of I-TASSER and QUARK pipelines using predicted contact maps in CASP12. Proteins Struct. Funct. Bioinform. 2018, 86 (Suppl. 1), 136–151. [Google Scholar] [CrossRef] [PubMed]
- Rudenko, V.; Korotkov, E. Search for Highly Divergent Tandem Repeats in Amino Acid Sequences. Int. J. Mol. Sci. 2021, 22, 7096. [Google Scholar] [CrossRef]
- Korotkov, E.V.; Kamionskya, A.M.; Korotkova, M.A. Detection of highly divergent tandem repeats in the rice genome. Genes 2021, 12, 473. [Google Scholar] [CrossRef] [PubMed]
- Nor, A.; Korotkov, E. Search of Fuzzy Periods in the Works of Poetry of Different Authors. Adv. Fuzzy Syst. 2018, 2018, 4028417. [Google Scholar] [CrossRef]
- Korotkov, E.V.; Korotkova, M.A. Search for regions with periodicity using the random position weight matrices in the C. elegans genome. Int. J. Data Min. Bioinform. 2017, 18, 331. [Google Scholar] [CrossRef]
- Korotkov, E.; Korotkova, M. Study of the periodicity in Euro-US Dollar exchange rates using local alignment and random matrixes. Procedia Comput. Sci. 2017, 108, 1344–1353. [Google Scholar] [CrossRef]
- Laskin, A.A.; Korotkov, E.V.; Chalei, M.B.; Kudryashov, N.A. The locally optimal method of cyclic alignment to reveal latent periodicities in genetic texts. The NAD-binding protein sites. Mol. Biol. 2003, 37, 663–673. [Google Scholar] [CrossRef]
- Needleman, S.B.; Wunsch, C.D. A general method applicable to the search for similarities in the amino acid sequence of two proteins. J. Mol. Biol. 1970, 48, 443–453. [Google Scholar] [CrossRef]


| RL | Kd | d | e | Z | CS (Bali_Score) | CS (Bali_Score_Reliable) |
|---|---|---|---|---|---|---|
| 5.0 | −1.0 | 40.0 | 5.0 | 178.02 | 0.32 | 0.43 |
| −1.0 | 40.0 | 4.0 | 180.08 | 0.33 | 0.45 | |
| −1.0 | 40.0 | 2.0 | 182.26 | 0.39 | 0.49 | |
| −1.0 | 40.0 | 1.0 | 180.95 | 0.43 | 0.52 | |
| −1.0 | 40.0 | 0.2 | 146.40 | 0.44 | 0.53 | |
| −2.0 | 40.0 | 2.0 | 172.64 | 0.32 | 0.41 | |
| −2.0 | 28.0 | 2.8 | 178.77 | 0.35 | 0.45 | |
| −2.0 | 28.0 | 0.7 | 126.46 | 0.44 | 0.52 |
| Methods | Z | CS (Bali_Score) | CS (Bali_Score_Reliable) |
|---|---|---|---|
| MAHDS | 180.95 | 0.43 | 0.52 |
| T-Coffee | 115.31 | 0.81 | 0.87 |
| MUSCLE | 158.60 | 0.73 | 0.80 |
| PRANK | 65.50 | 0.64 | 0.70 |
| Clustal Omega | 116.95 | 0.81 | 0.85 |
| Kalign | 131.51 | 0.75 | 0.82 |
| MAFFT | 125.32 | 0.80 | 0.85 |
| Indel Count | Indel Length | x = 0.6 | x = 1.2 | x = 1.8 | x = 2.4 | x = 3.0 | x = 3.6 | x = 4.2 | x = 4.8 | x = 5.4 |
|---|---|---|---|---|---|---|---|---|---|---|
| 2 | 1 | 604.3 | 514.0 | 290.5 | 206.8 | 132.4 | 87.0 | 24.4 | 13.1 | 7.2 |
| 2 | 5 | 761.6 | 476.0 | 302.1 | 208.2 | 113.6 | 85.6 | 21.3 | 11.6 | 3.4 |
| 2 | 20 | 570.9 | 382.6 | 277.6 | 193.4 | 119.7 | 38.3 | 17.7 | 11.2 | 8.1 |
| 5 | 1 | 565.0 | 387.4 | 288.3 | 179.1 | 133.0 | 36.1 | 19.2 | 12.7 | 8.4 |
| 5 | 5 | 570.9 | 366.6 | 266.1 | 174.4 | 114.2 | 27.0 | 14.6 | 8.7 | 6.8 |
| 5 | 20 | 504.3 | 355.3 | 218.3 | 141.0 | 57.2 | 22.0 | 12.2 | 8.8 | 6.4 |
| 10 | 1 | 596.6 | 373.1 | 232.0 | 145.2 | 82.6 | 21.4 | 13.7 | 9.7 | 6.4 |
| 10 | 5 | 557.2 | 342.4 | 230.1 | 129.7 | 33.8 | 16.8 | 11.0 | 7.6 | 6.0 |
| 10 | 20 | 353.3 | 233.8 | 144.0 | 39.1 | 22.3 | 13.4 | 8.6 | 7.0 | 5.2 |
| Indel Number | Indel Length | Clustal Omega | Kalign | |||
|---|---|---|---|---|---|---|
| x = 0.6 | x = 1.2 | x = 1.8 | x = 0.6 | x = 1.2 | ||
| 2 | 1 | 619.8 | 429.2 | 142.5 | 613.9 | 364.9 |
| 2 | 5 | 576.6 | 410.7 | 100.5 | 622.3 | 371.0 |
| 2 | 20 | 520.8 | 331.4 | 45.4 | 559.0 | 284.2 |
| 5 | 1 | 464.4 | 353.3 | −46.8 | 603.4 | 300.1 |
| 5 | 5 | 542.5 | 247.3 | −69.7 | 571.0 | 207.1 |
| 5 | 20 | 354.5 | 27.1 | −460.1 | 381.1 | 16.2 |
| 10 | 1 | 440.2 | 225.8 | −223.1 | 477.6 | 148.4 |
| 10 | 5 | 159.0 | 85.8 | −480.6 | 415.3 | −73.3 |
| 10 | 20 | 130.3 | −209.9 | −493.2 | 11.5 | −489.0 |
| Indel Count | Indel Length | MAFFT | MUSCLE | ||||
|---|---|---|---|---|---|---|---|
| x = 0.6 | x = 1.2 | x = 0.6 | x = 1.2 | x = 1.8 | x = 2.4 | ||
| 2 | 1 | 605.3 | 304.4 | 652.9 | 452.1 | 230.0 | 171.3 |
| 2 | 5 | 639.2 | 264.8 | 602.6 | 460.4 | 244.7 | 186.3 |
| 2 | 20 | 582.9 | 231.5 | 568.6 | 408.0 | 177.2 | 97.1 |
| 5 | 1 | 584.0 | 200.1 | 587.0 | 376.9 | 180.0 | 115.4 |
| 5 | 5 | 482.2 | 111.8 | 523.6 | 331.0 | 168.8 | 43.4 |
| 5 | 20 | 357.0 | −67.5 | 456.1 | 193.3 | 24.6 | −73.1 |
| 10 | 1 | 433.7 | 62.3 | 485.6 | 216.2 | 108.7 | 60.3 |
| 10 | 5 | 344.7 | −52.5 | 472.4 | 201.3 | 93.4 | −65.5 |
| 10 | 20 | 71.5 | −406.8 | 223.0 | 44.8 | −77.9 | −90.5 |
| Indel Count | Indel Length | PRANK | T-COFFEE | |||
|---|---|---|---|---|---|---|
| x = 0.6 | x = 1.2 | x = 0.6 | x = 1.2 | x = 1.8 | ||
| 2 | 1 | 658.7 | 388.1 | 601.28 | 492.4 | 298.7 |
| 2 | 5 | 608.8 | 375.9 | 530.01 | 363.3 | 130.6 |
| 2 | 20 | 555.7 | 347.9 | 467.06 | 285.6 | 91.6 |
| 5 | 1 | 576.2 | 284.1 | 607.94 | 401.3 | 271.2 |
| 5 | 5 | 515.6 | 307.3 | 311.63 | 62.5 | −167.5 |
| 5 | 20 | 468.2 | 164.0 | 168.84 | −78.8 | −355.1 |
| 10 | 1 | 462.5 | 125.5 | 479.07 | 314.6 | 147.1 |
| 10 | 5 | 412.8 | 113.4 | −18.4 | −260.7 | −387.6 |
| 10 | 20 | 210.0 | −225.7 | −133.27 | −415.8 | −905.0 |
| Name/ Accession Number | Number of Sequences | Average Length | Average % Identity | MAHDS | T-Coffee | MUSCLE | ||||||
|---|---|---|---|---|---|---|---|---|---|---|---|---|
| Z | Gap Openings | Gaps | Z | Gap Openings | Gaps | Z | Gap Openings | Gaps | ||||
| Fibronectin type 3 domain | 13 | 122 | 17% | −7.3 | 63 | 1465 | −12.5 | 325 | 1004 | −10.9 | 154 | 598 |
| PH domain | 14 | 98.0 | 16% | −12.9 | 71 | 2035 | −17.6 | 221 | 2011 | −7.7 | 172 | 1387 |
| PF00915 | 44 | 234.9 | 17% | 55.5 | 2962 | 182,664 | −88.4 | 7841 | 802,423 | −15.9 | 2775 | 124,031 |
| PF02950 | 9 | 76.0 | 14% | −6.93 | 33 | 1061 | −13.4 | 103 | 296 | −2.9 | 45 | 188 |
| PF06653 | 210 | 162.2 | 18% | 75.9 | 5666 | 393,226 | −124.7 | 13,698 | 648,158 | 16.4 | 6557 | 380,093 |
| PF07611 | 97 | 300.1 | 18% | 119.2 | 5651 | 163,051 | −11.7 | 10,943 | 197,366 | 88.33 | 3743 | 97,553 |
| PF07622 | 97 | 273.6 | 19% | 114.8 | 6896 | 343,751 | −33.5 | 15,437 | 616,470 | 105.2 | 5865 | 273,614 |
| PF08928 | 182 | 120.9 | 18% | 151.8 | 9934 | 235,705 | 28.0 | 11,885 | 374,657 | 135.0 | 7699 | 210,857 |
| PF09624 | 101 | 144.6 | 17% | 69.9 | 2198 | 43,877 | −0.2 | 3278 | 58,118 | 74.4 | 1459 | 27,515 |
| PF09987 | 22 | 223.7 | 14% | 15.9 | 192 | 14,967 | −14.8 | 747 | 8978 | 27.2 | 290 | 4748 |
| PF10734 | 219 | 80.5 | 19% | 49.4 | 2284 | 172,735 | −77.6 | 8520 | 390,912 | 24.5 | 4601 | 301,122 |
| PF10805 | 181 | 96.9 | 16% | 69.6 | 1602 | 67,600 | −34.7 | 6415 | 147,729 | 64.7 | 3807 | 75,691 |
| PF10846 | 285 | 226.6 | 12% | 61.1 | 13,166 | 607,607 | −91.6 | 55,603 | >5 × 10⁶ | −6.5 | 14,604 | 778,013 |
| PF10895 | 33 | 184.2 | 17% | 18.7 | 585 | 17,420 | −52.7 | 1487 | 29,766 | 3.8 | 712 | 12,837 |
| PF11368 | 178 | 228.4 | 17% | 116.2 | 2862 | 33,214 | −91.6 | 15,145 | 80,954 | 106.8 | 4108 | 29,868 |
| PF13944 | 185 | 124.2 | 18% | 18.0 | 9220 | 381,058 | −132.5 | 18,133 | >1 × 10⁶ | −22.5 | 5512 | 268,531 |
| PF16506 | 28 | 282.4 | 14% | −2.6 | 265 | 20,329 | −79.6 | 3052 | 51,549 | −3.5 | 1224 | 13,805 |
| PF18406 | 166 | 87.3 | 19% | 86.6 | 4073 | 142,973 | −45.1 | 12,397 | 460,552 | 43.2 | 5286 | 160,922 |
| PF18709 | 91 | 257.8 | 16% | 143.8 | 3724 | 101,986 | 15.2 | 8700 | 232,070 | 143.5 | 3280 | 97,117 |
| PF19443 | 216 | 216.7 | 17% | 71.4 | 22,203 | 533,793 | −56.5 | 39,783 | >1 × 10⁶ | 100.5 | 15,753 | 349,836 |
| PF19975 | 121 | 229.4 | 19% | 115.9 | 6716 | 179,105 | −96.6 | 12,219 | 503,784 | 32.5 | 5233 | 205,882 |
| Accession Number | Name |
|---|---|
| PF00915 | Calicivirus coat proteins |
| PF02950 | Conotoxins |
| PF06653 | Tight junction proteins |
| PF07611, PF07622 | Proteins of unknown function |
| PF08928, PF09624 | |
| PF10734, PF10805 | |
| PF10846, PF10895 | |
| PF11368 | |
| PF09987 | Uncharacterized protein conserved in archaea |
| PF13944 | Calycin-like beta-barrel domain |
| PF16506 | Putative virion glycoprotein of insect viruses |
| PF18406 | Ferredoxin-like domain in Api92-like protein |
| PF18709 | Dynamin-like helical domain |
| PF19443 | DAHL domain |
| PF19975 | Double-GTPase 1 |
Publisher’s Note: MDPI stays neutral with regard to jurisdictional claims in published maps and institutional affiliations. |
© 2022 by the authors. Licensee MDPI, Basel, Switzerland. This article is an open access article distributed under the terms and conditions of the Creative Commons Attribution (CC BY) license (https://creativecommons.org/licenses/by/4.0/).
Share and Cite
Kostenko, D.O.; Korotkov, E.V. Application of the MAHDS Method for Multiple Alignment of Highly Diverged Amino Acid Sequences. Int. J. Mol. Sci. 2022, 23, 3764. https://doi.org/10.3390/ijms23073764
Kostenko DO, Korotkov EV. Application of the MAHDS Method for Multiple Alignment of Highly Diverged Amino Acid Sequences. International Journal of Molecular Sciences. 2022; 23(7):3764. https://doi.org/10.3390/ijms23073764
Chicago/Turabian StyleKostenko, Dimitrii O., and Eugene V. Korotkov. 2022. "Application of the MAHDS Method for Multiple Alignment of Highly Diverged Amino Acid Sequences" International Journal of Molecular Sciences 23, no. 7: 3764. https://doi.org/10.3390/ijms23073764
APA StyleKostenko, D. O., & Korotkov, E. V. (2022). Application of the MAHDS Method for Multiple Alignment of Highly Diverged Amino Acid Sequences. International Journal of Molecular Sciences, 23(7), 3764. https://doi.org/10.3390/ijms23073764