
Biological Evaluation of Photodynamic Effect Mediated by Nanoparticles with Embedded Porphyrin Photosensitizer

 , ,
, ,
Abstract
:
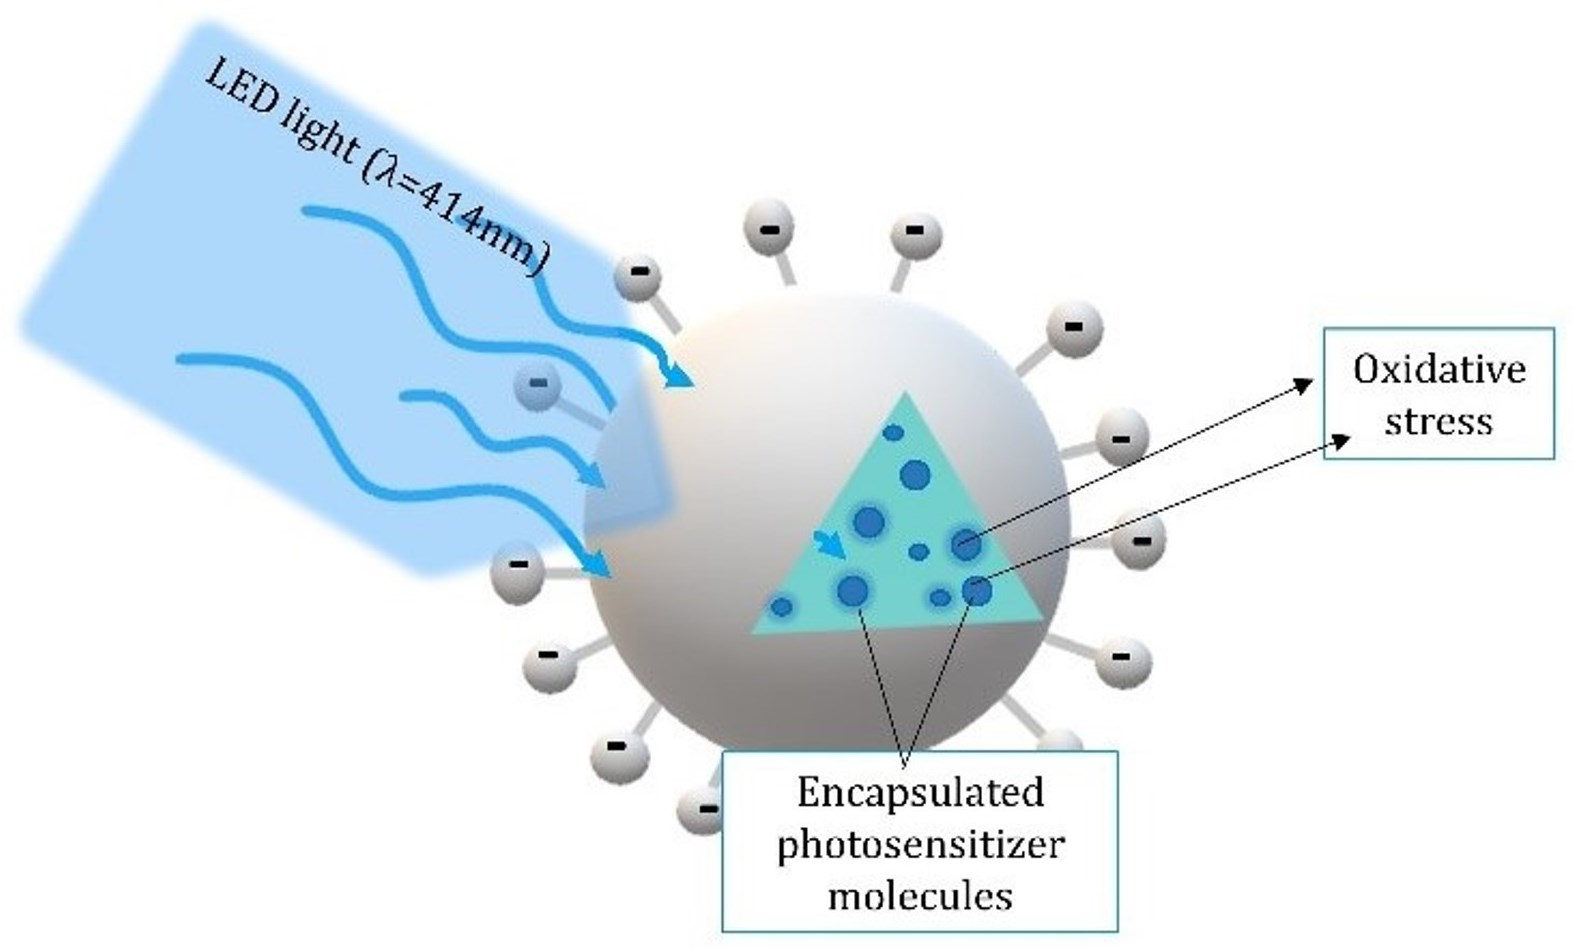
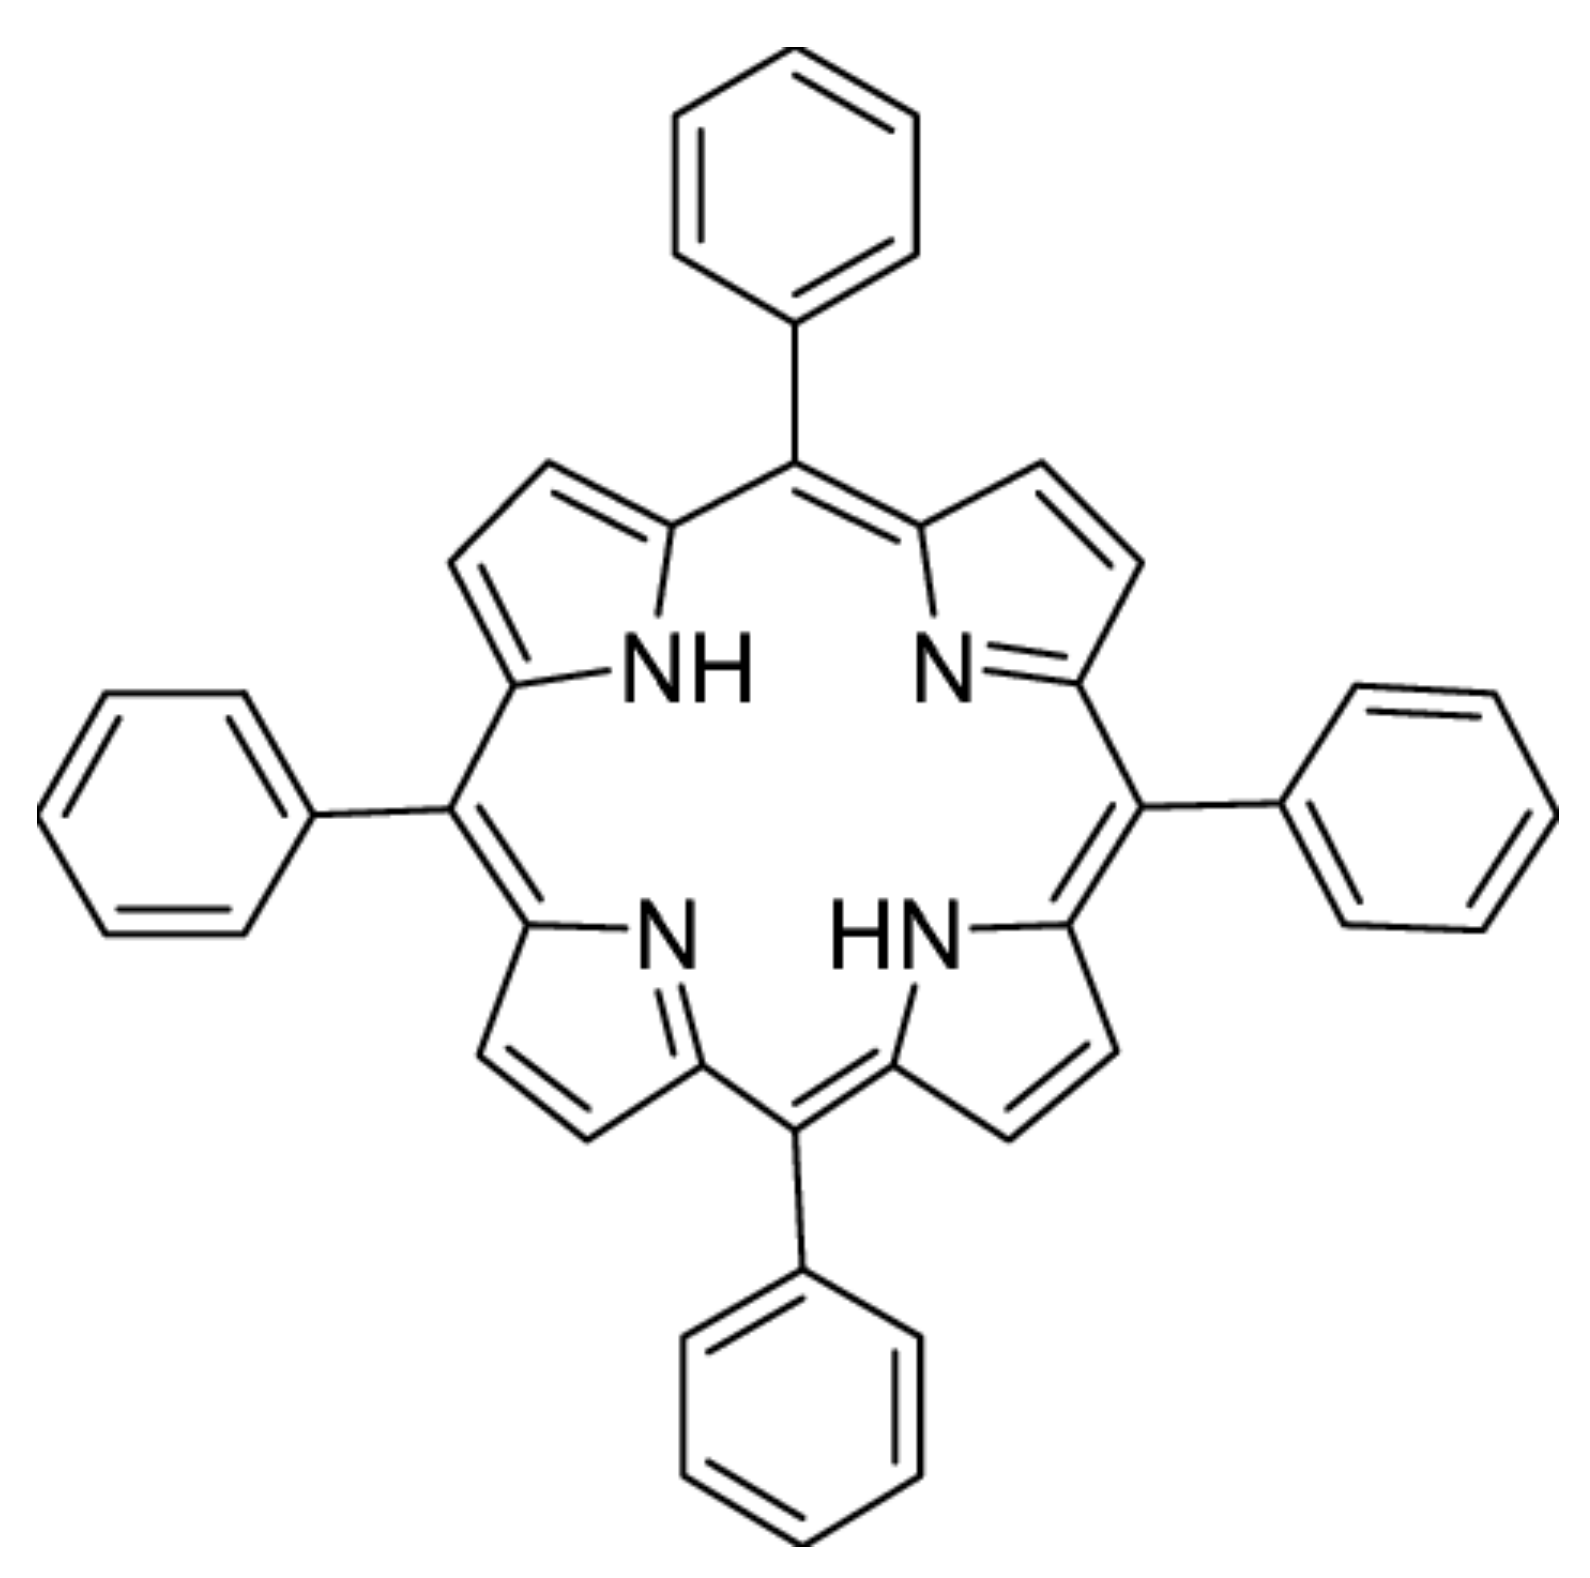
1. Introduction
2. Results
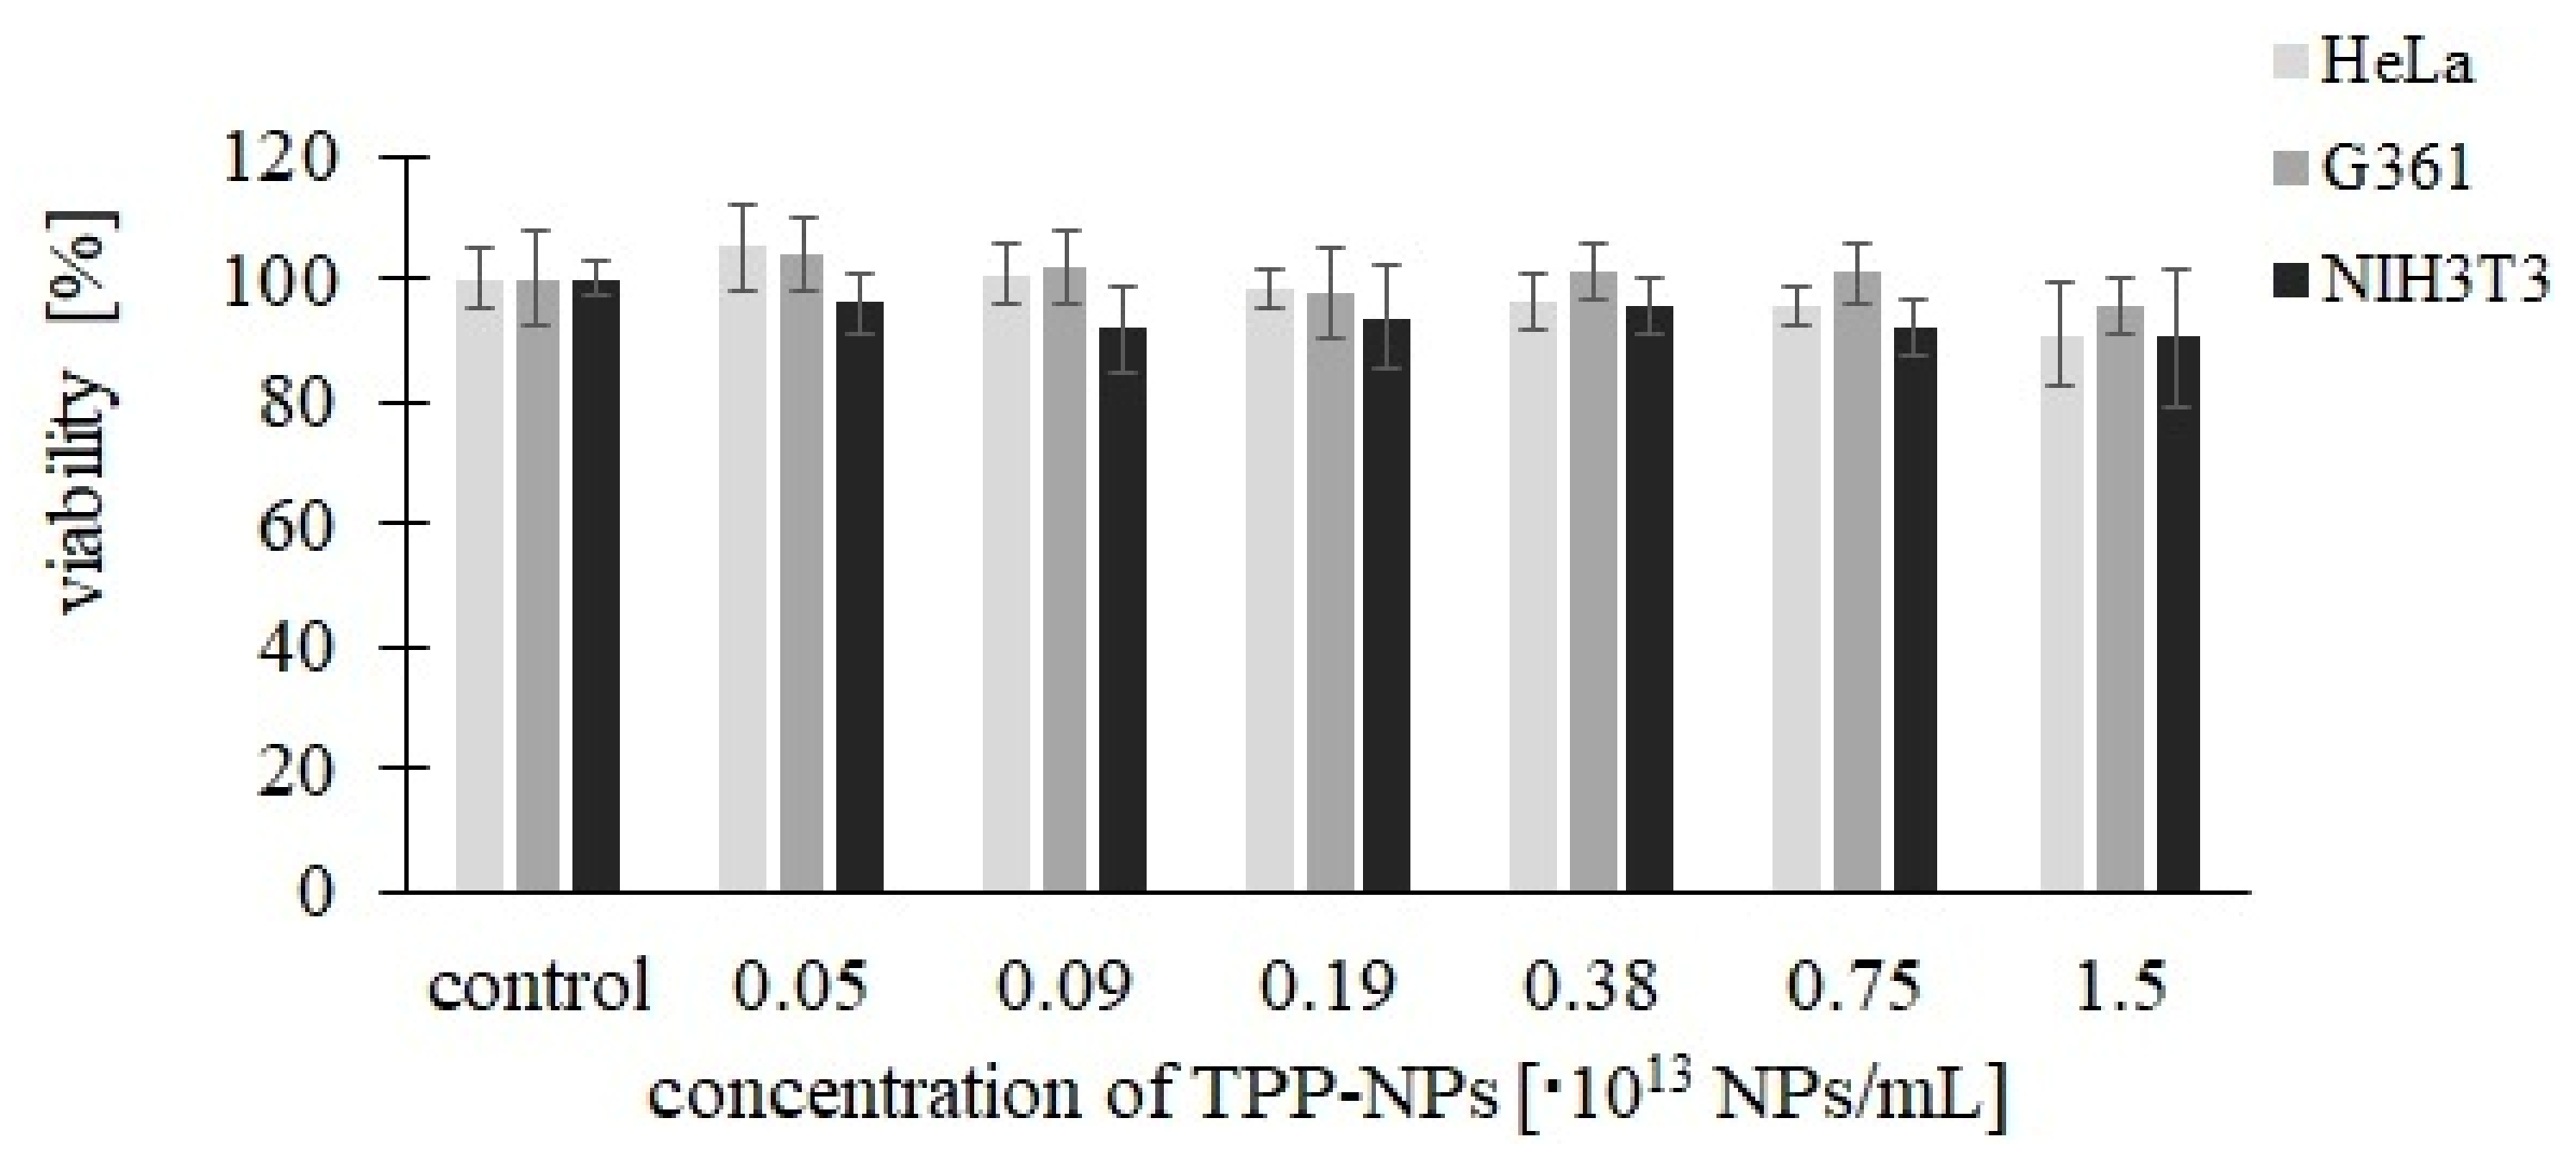
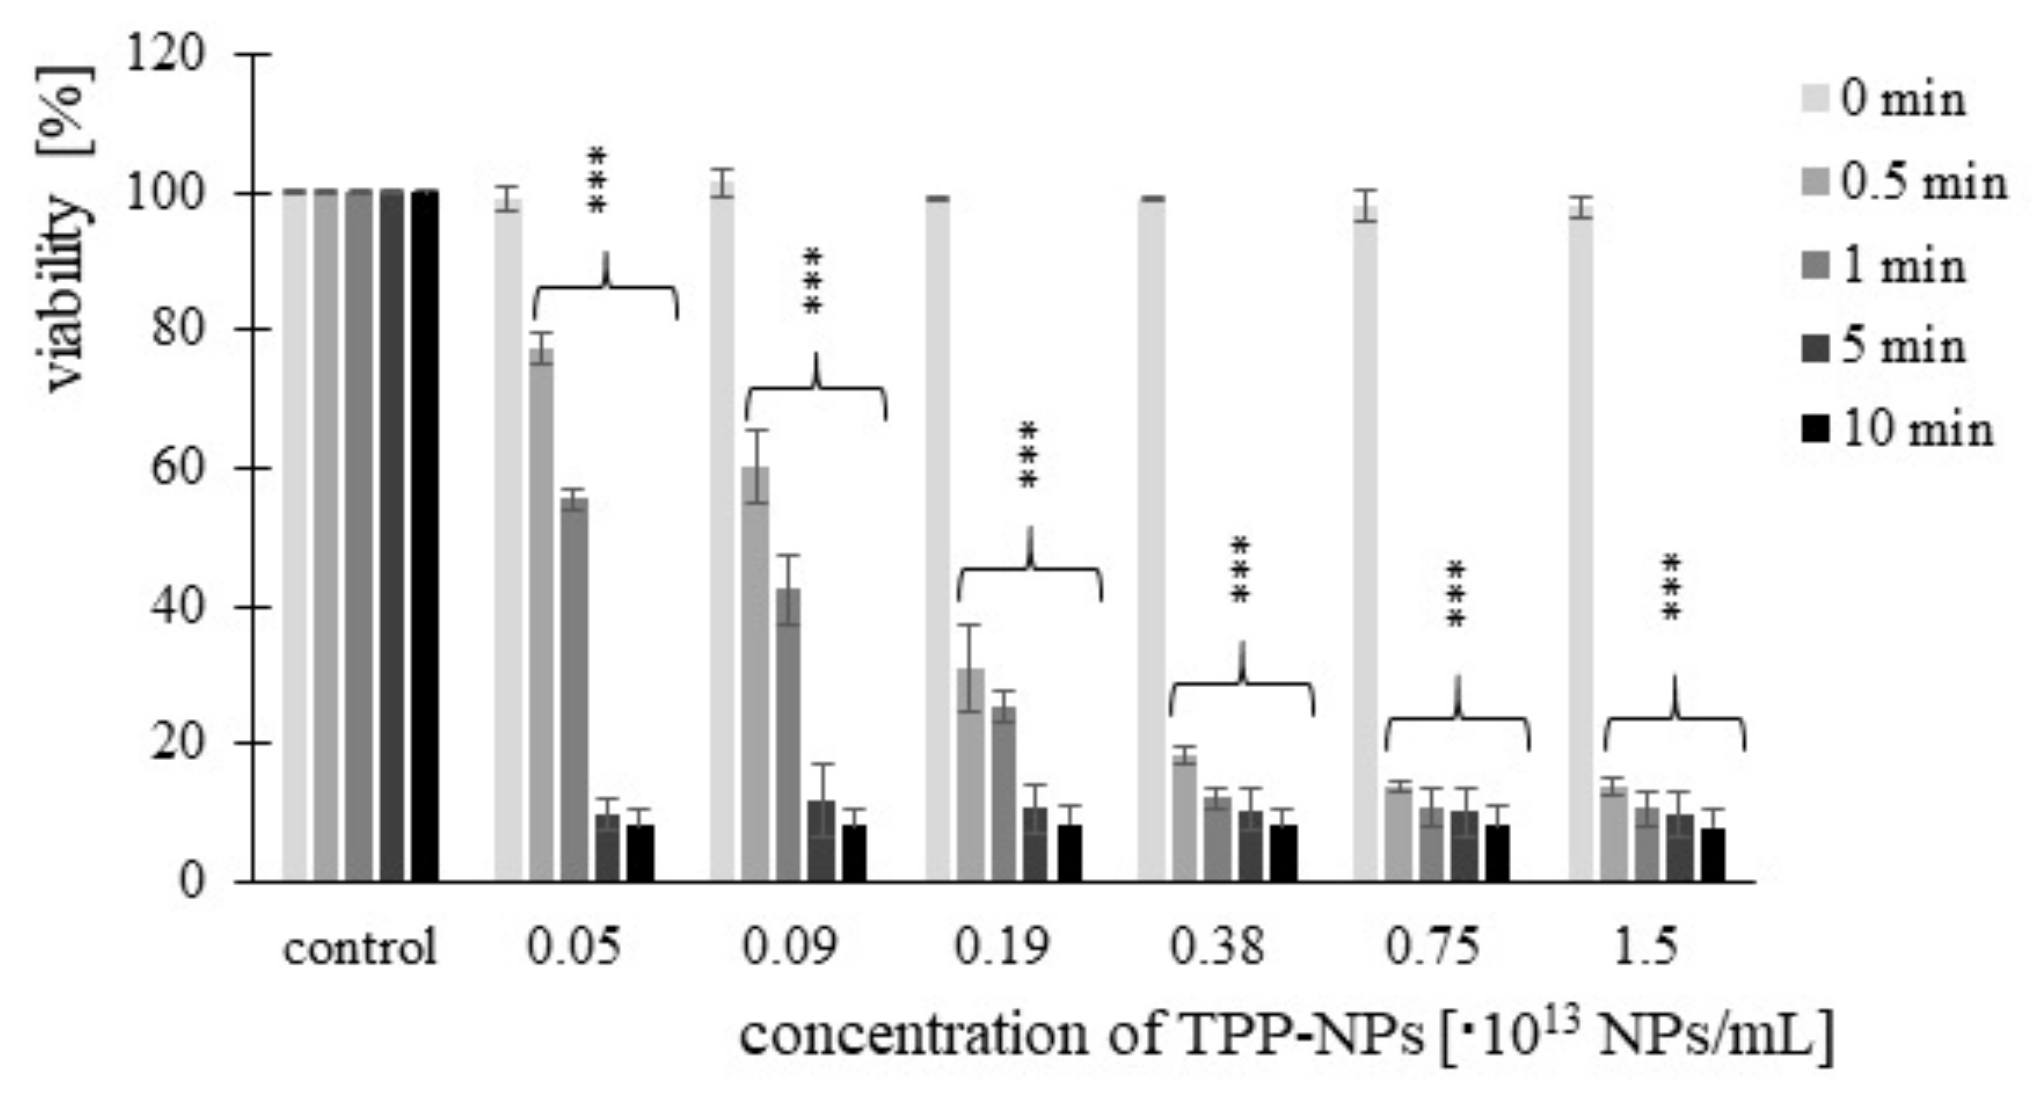
2.1. Measurement of Dark Toxicity
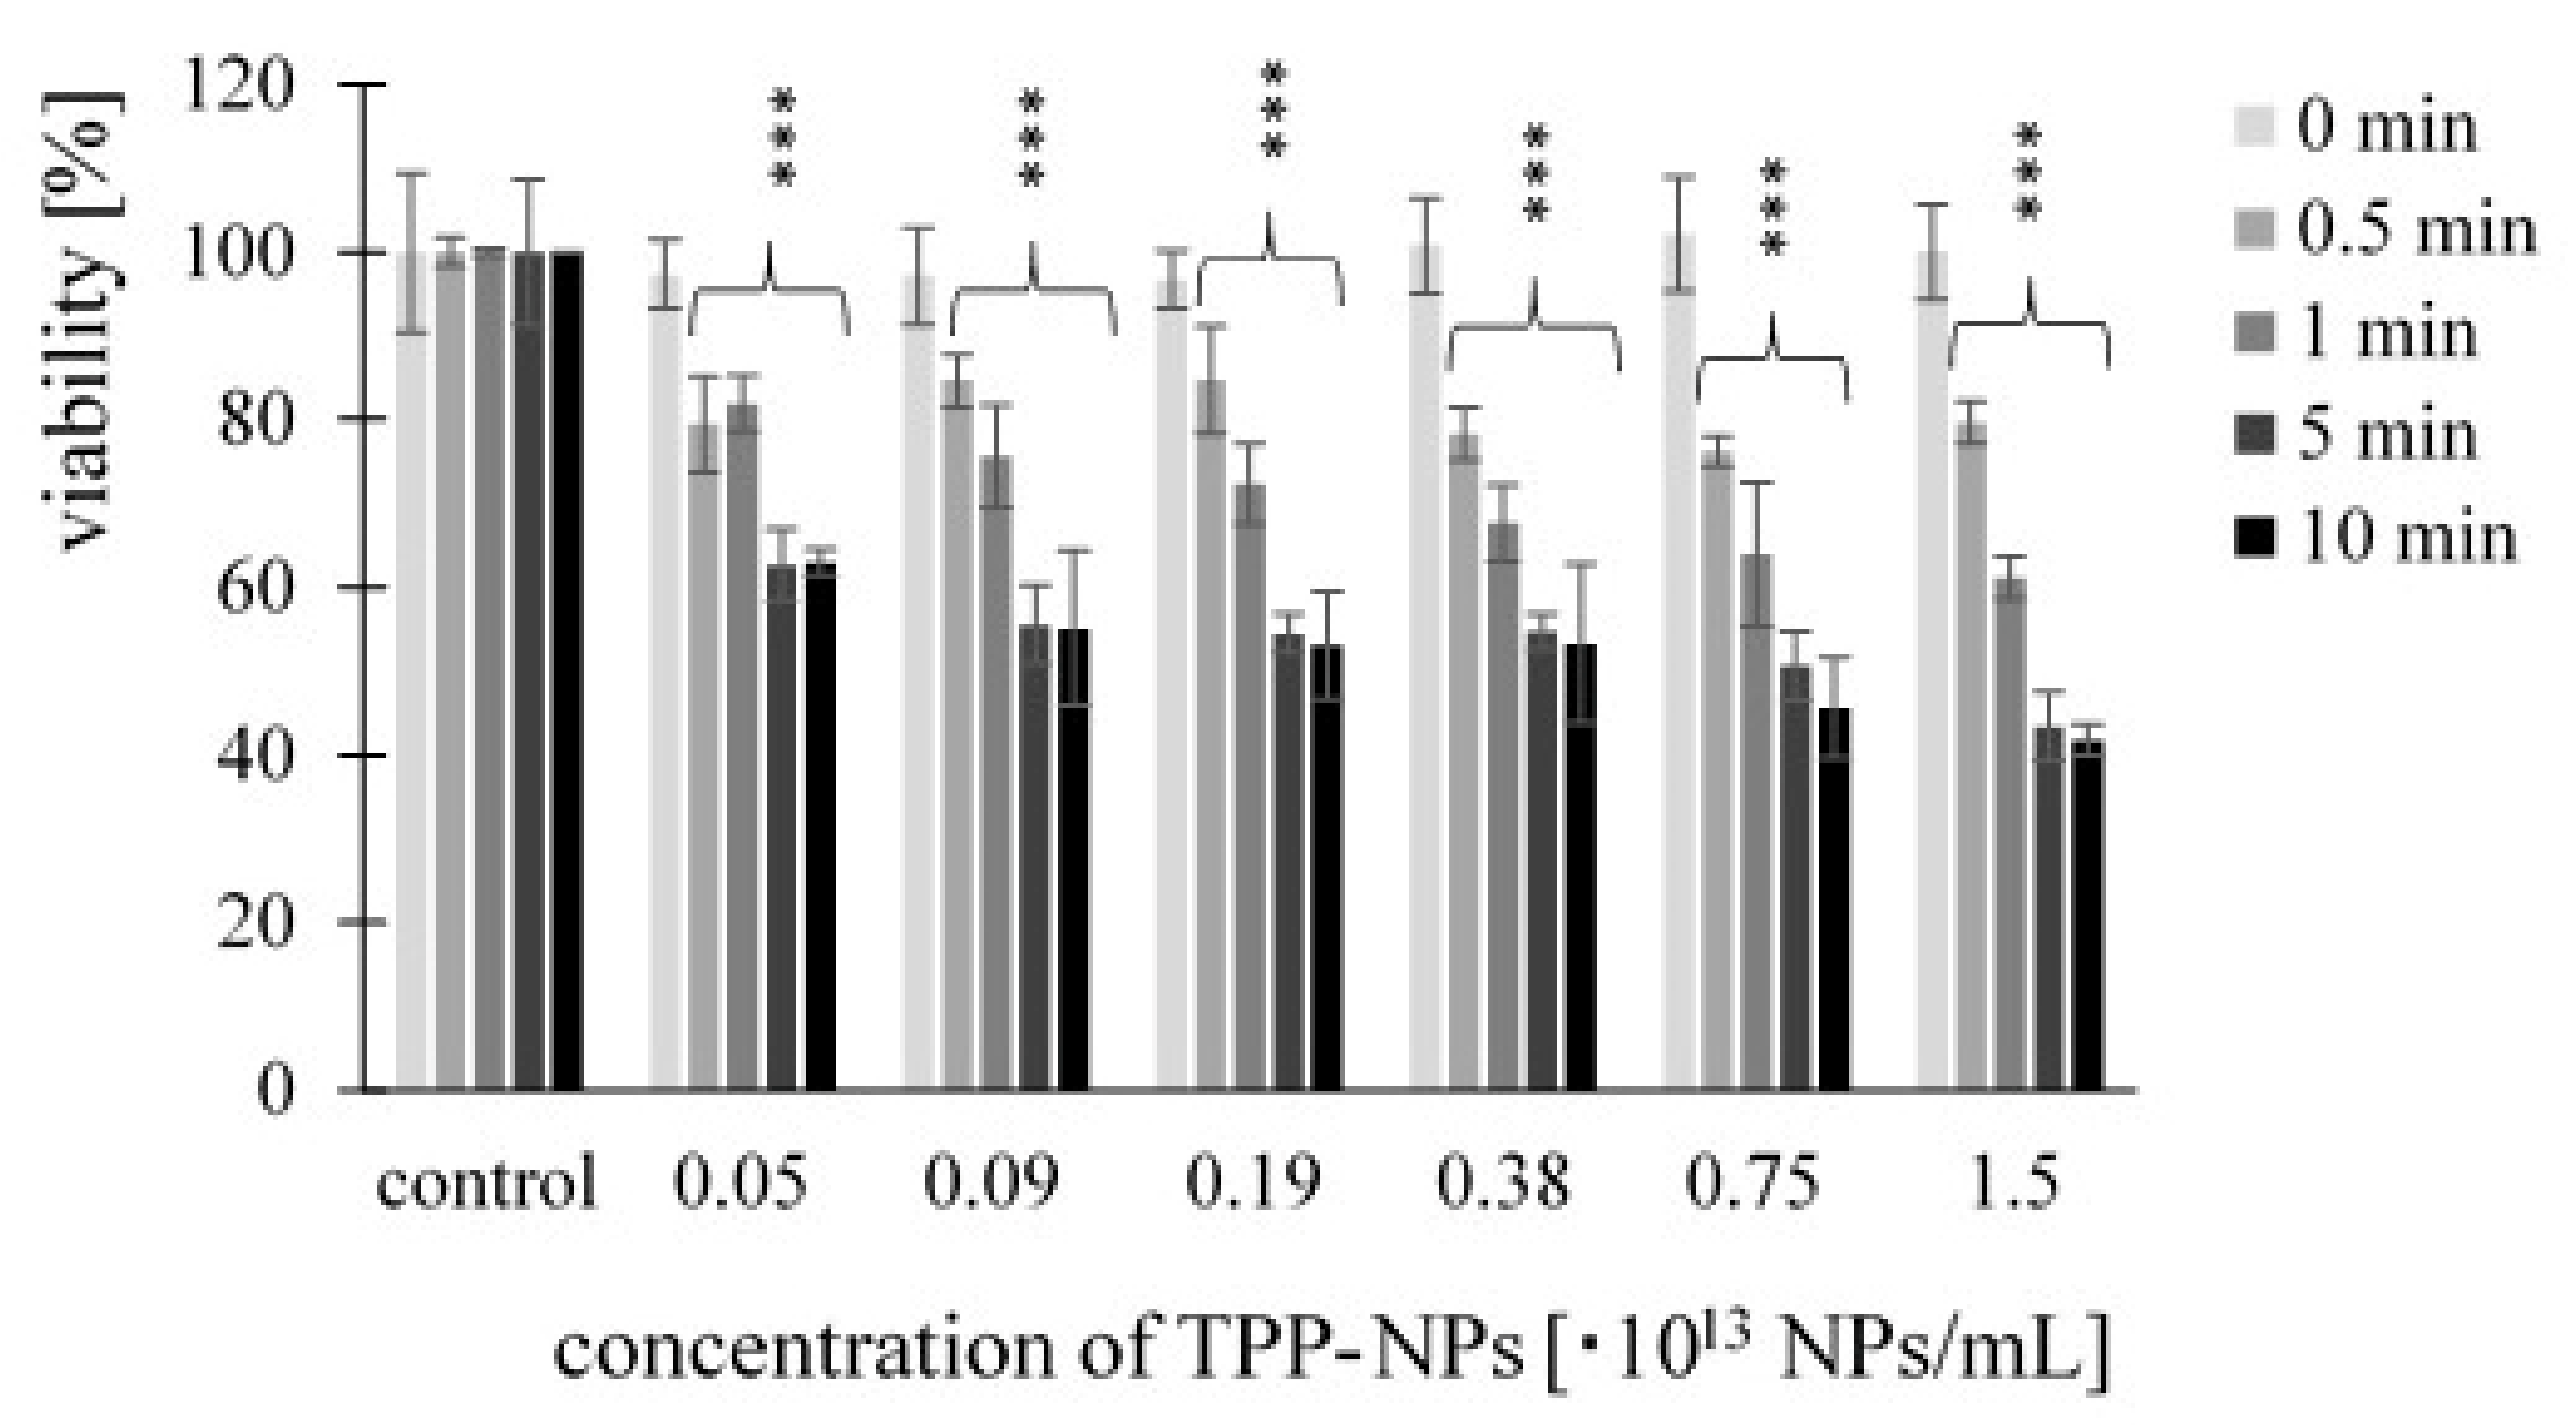
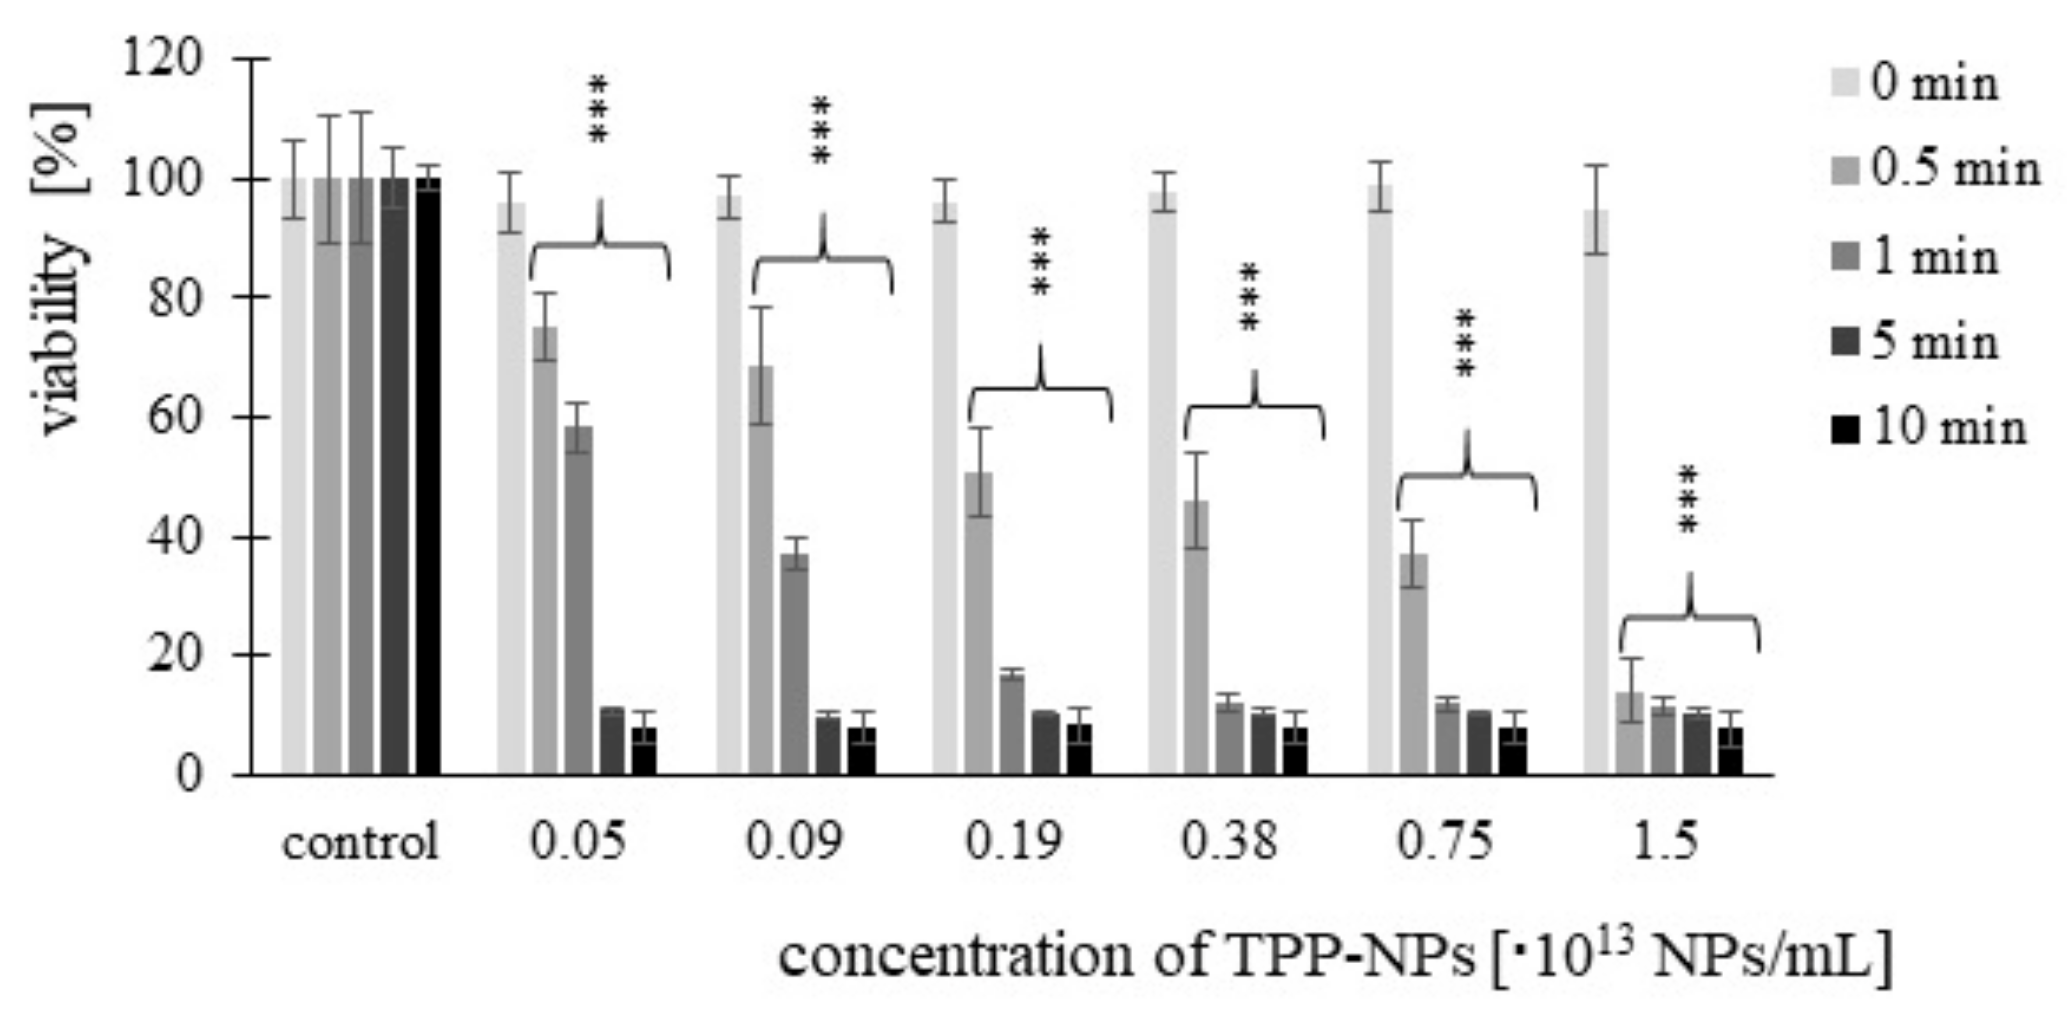
2.2. Cancer Cell Cytotoxicity—MTT Assay
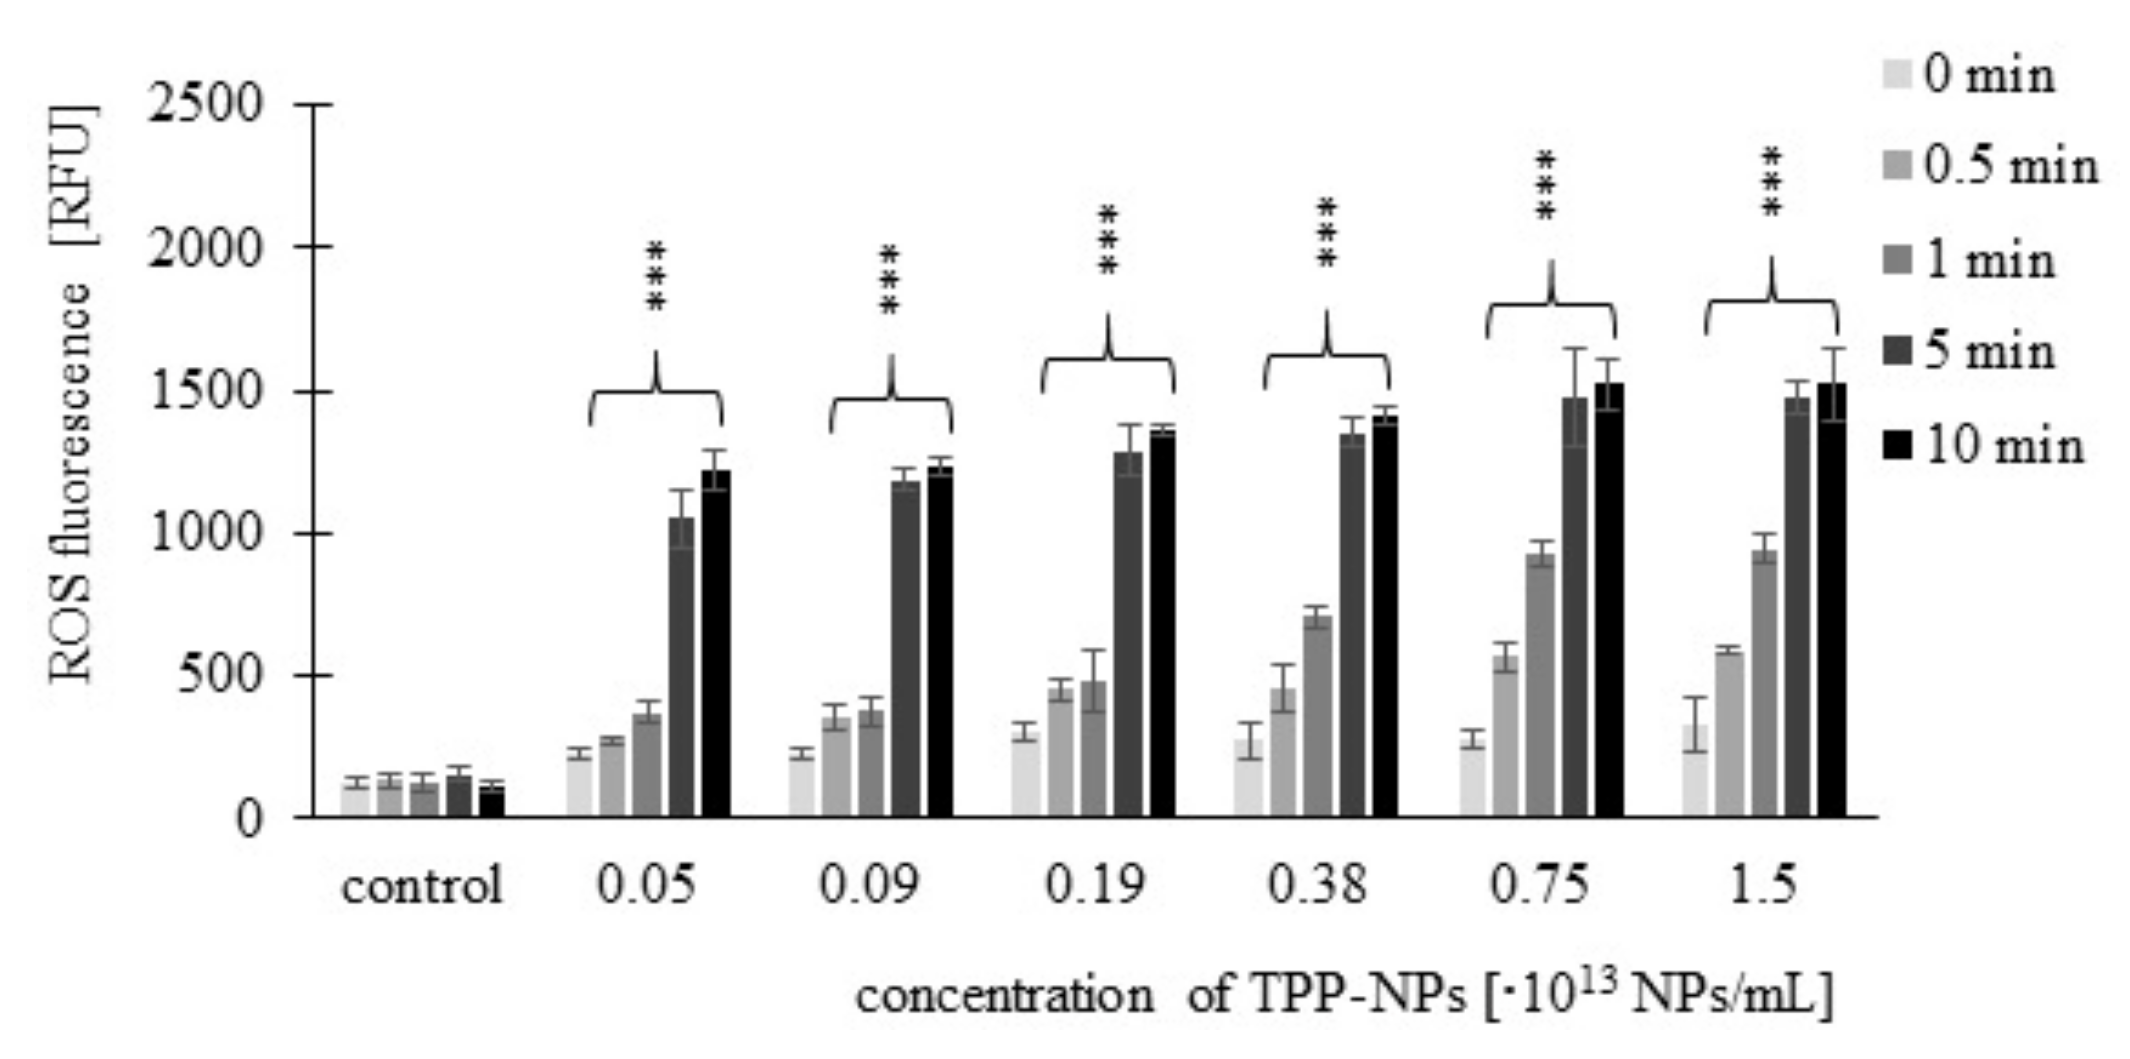
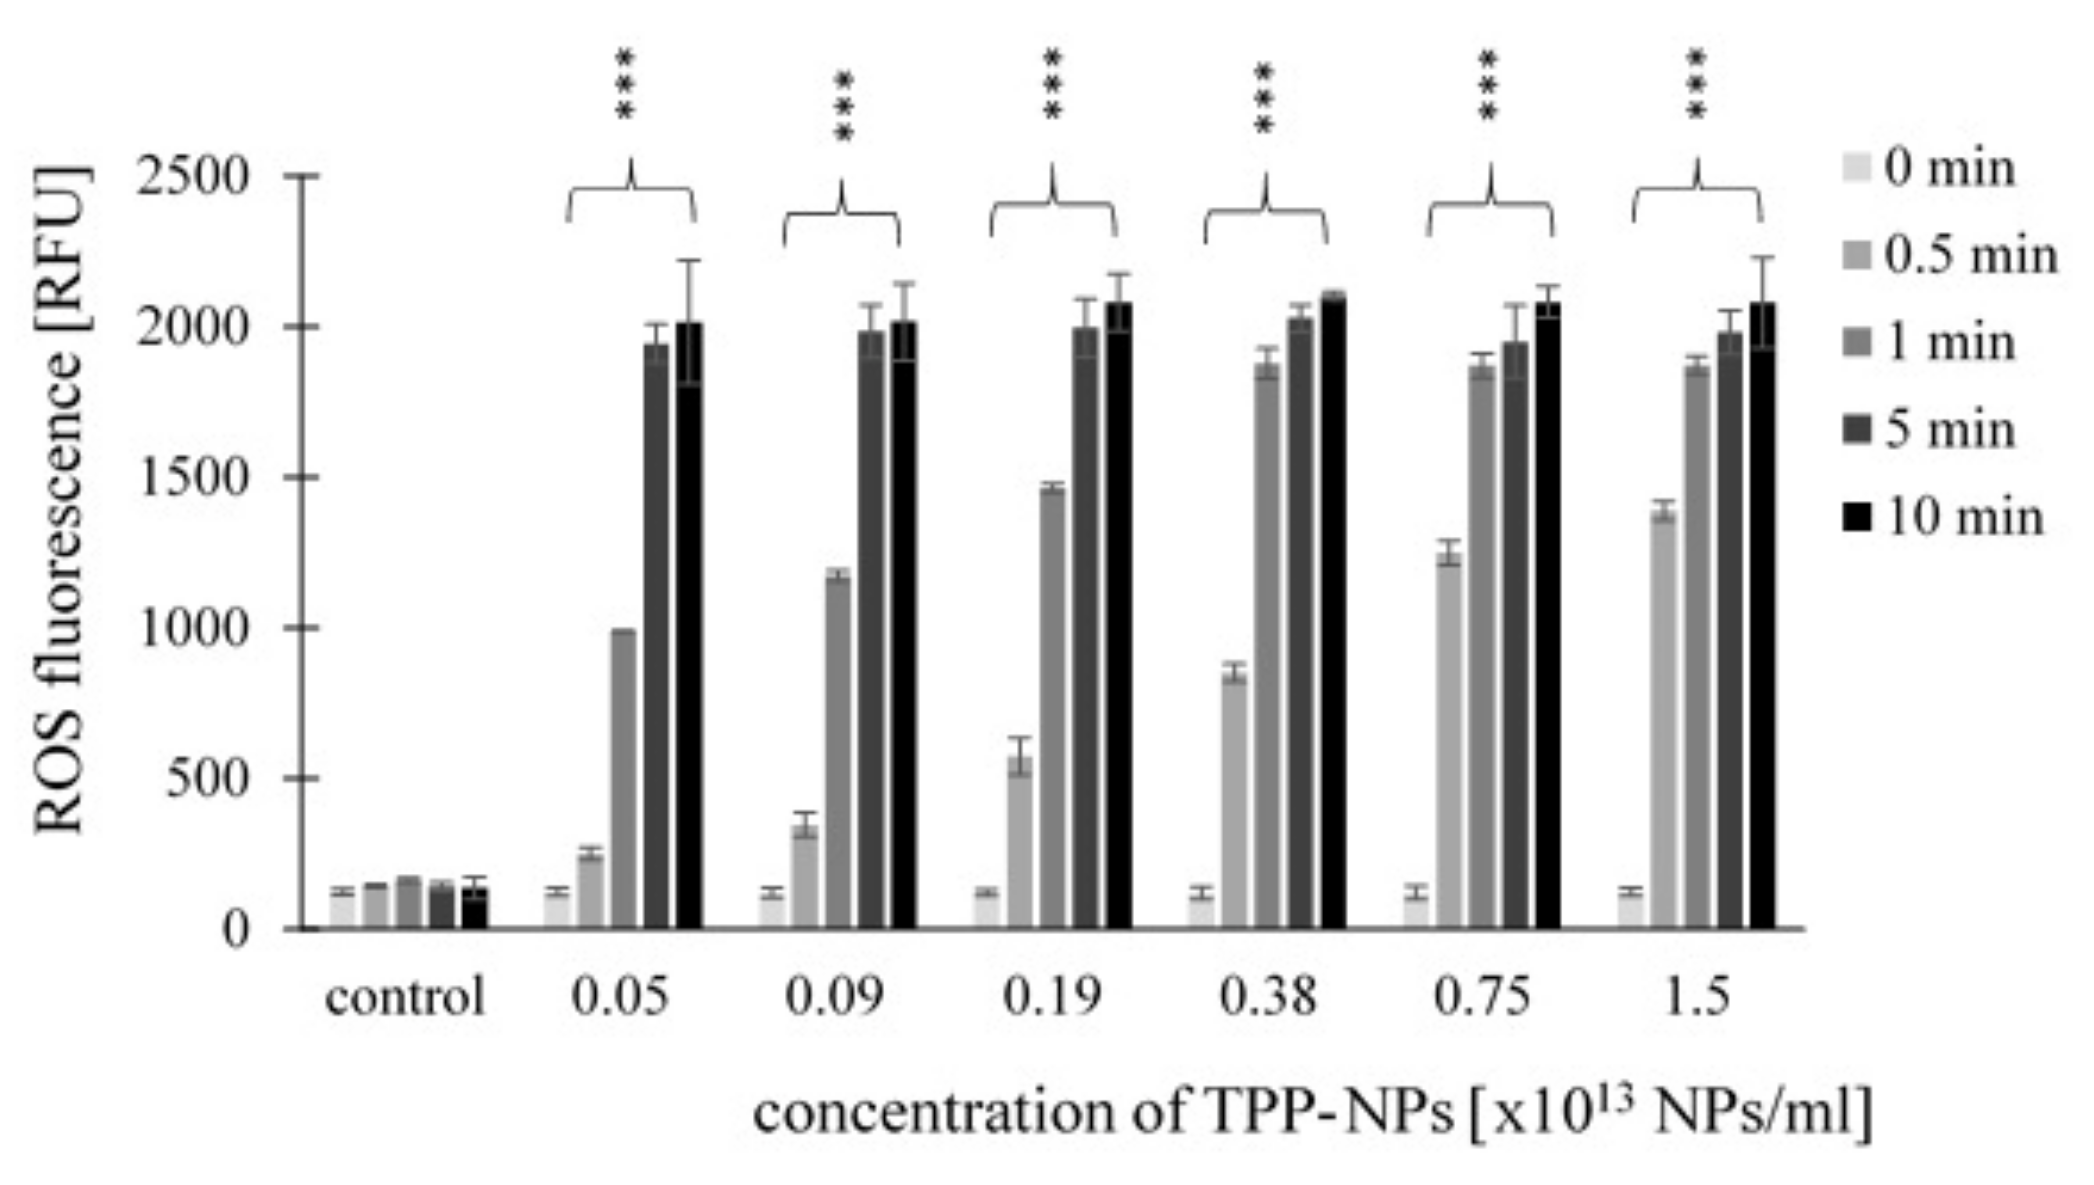
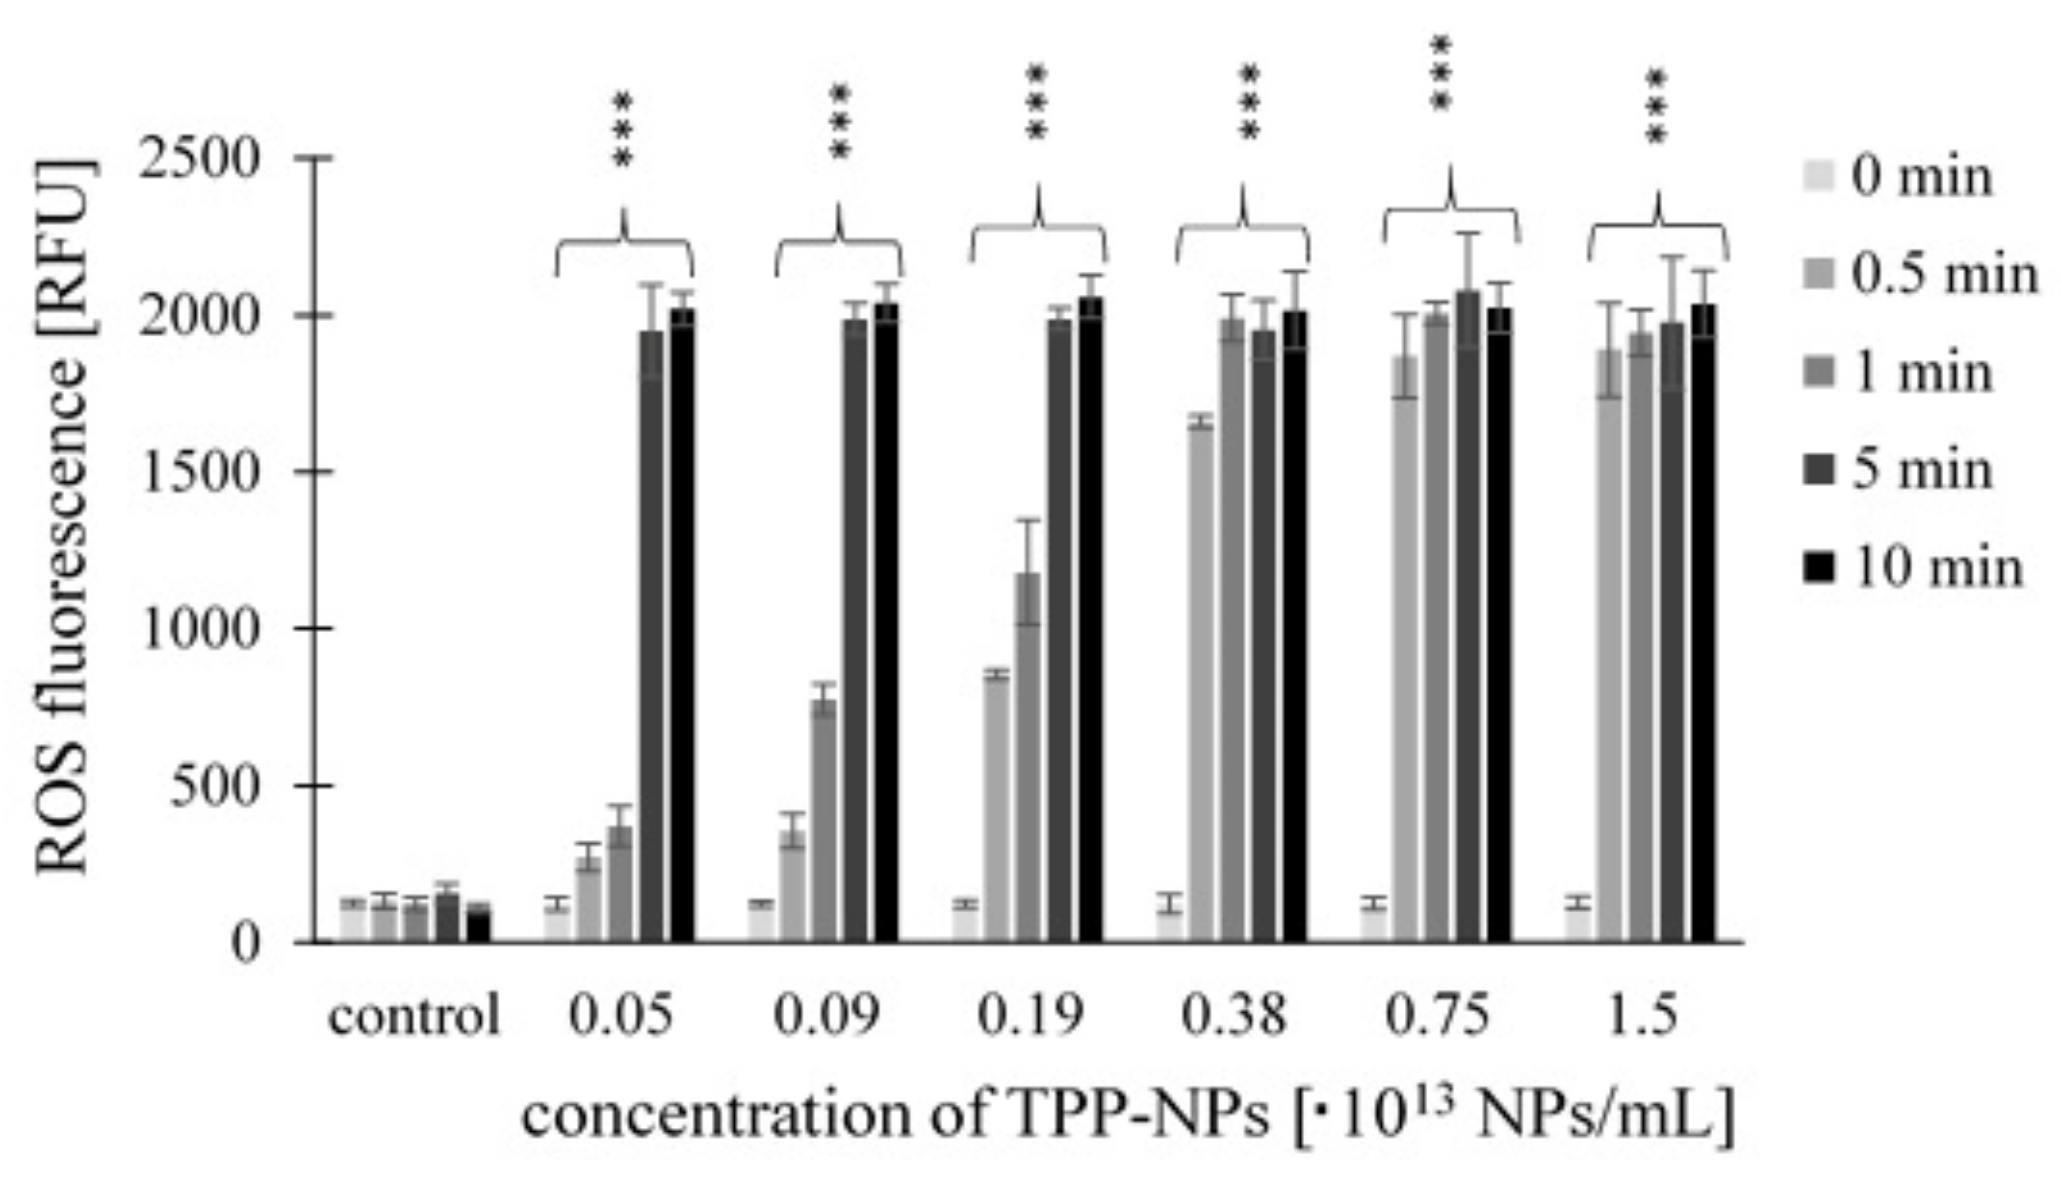
2.3. Measurement of ROS Production
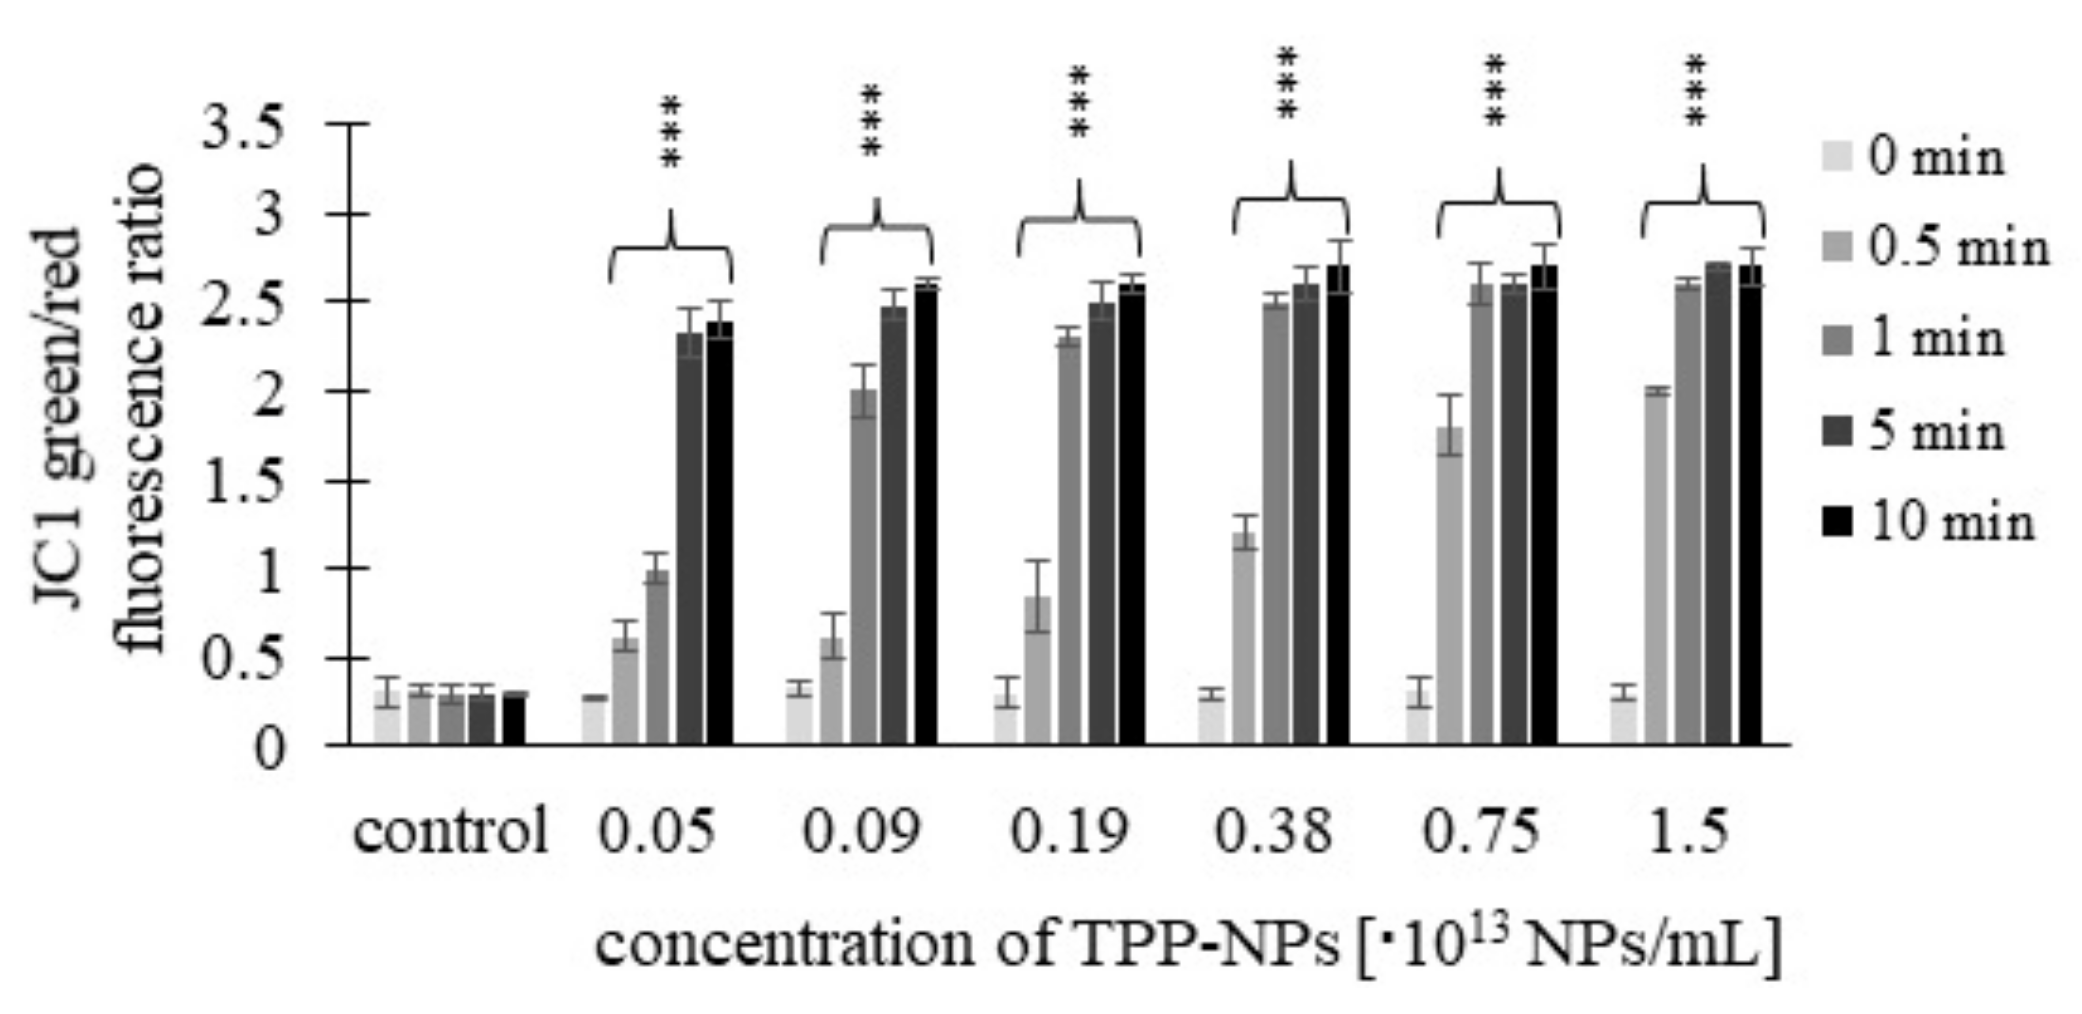
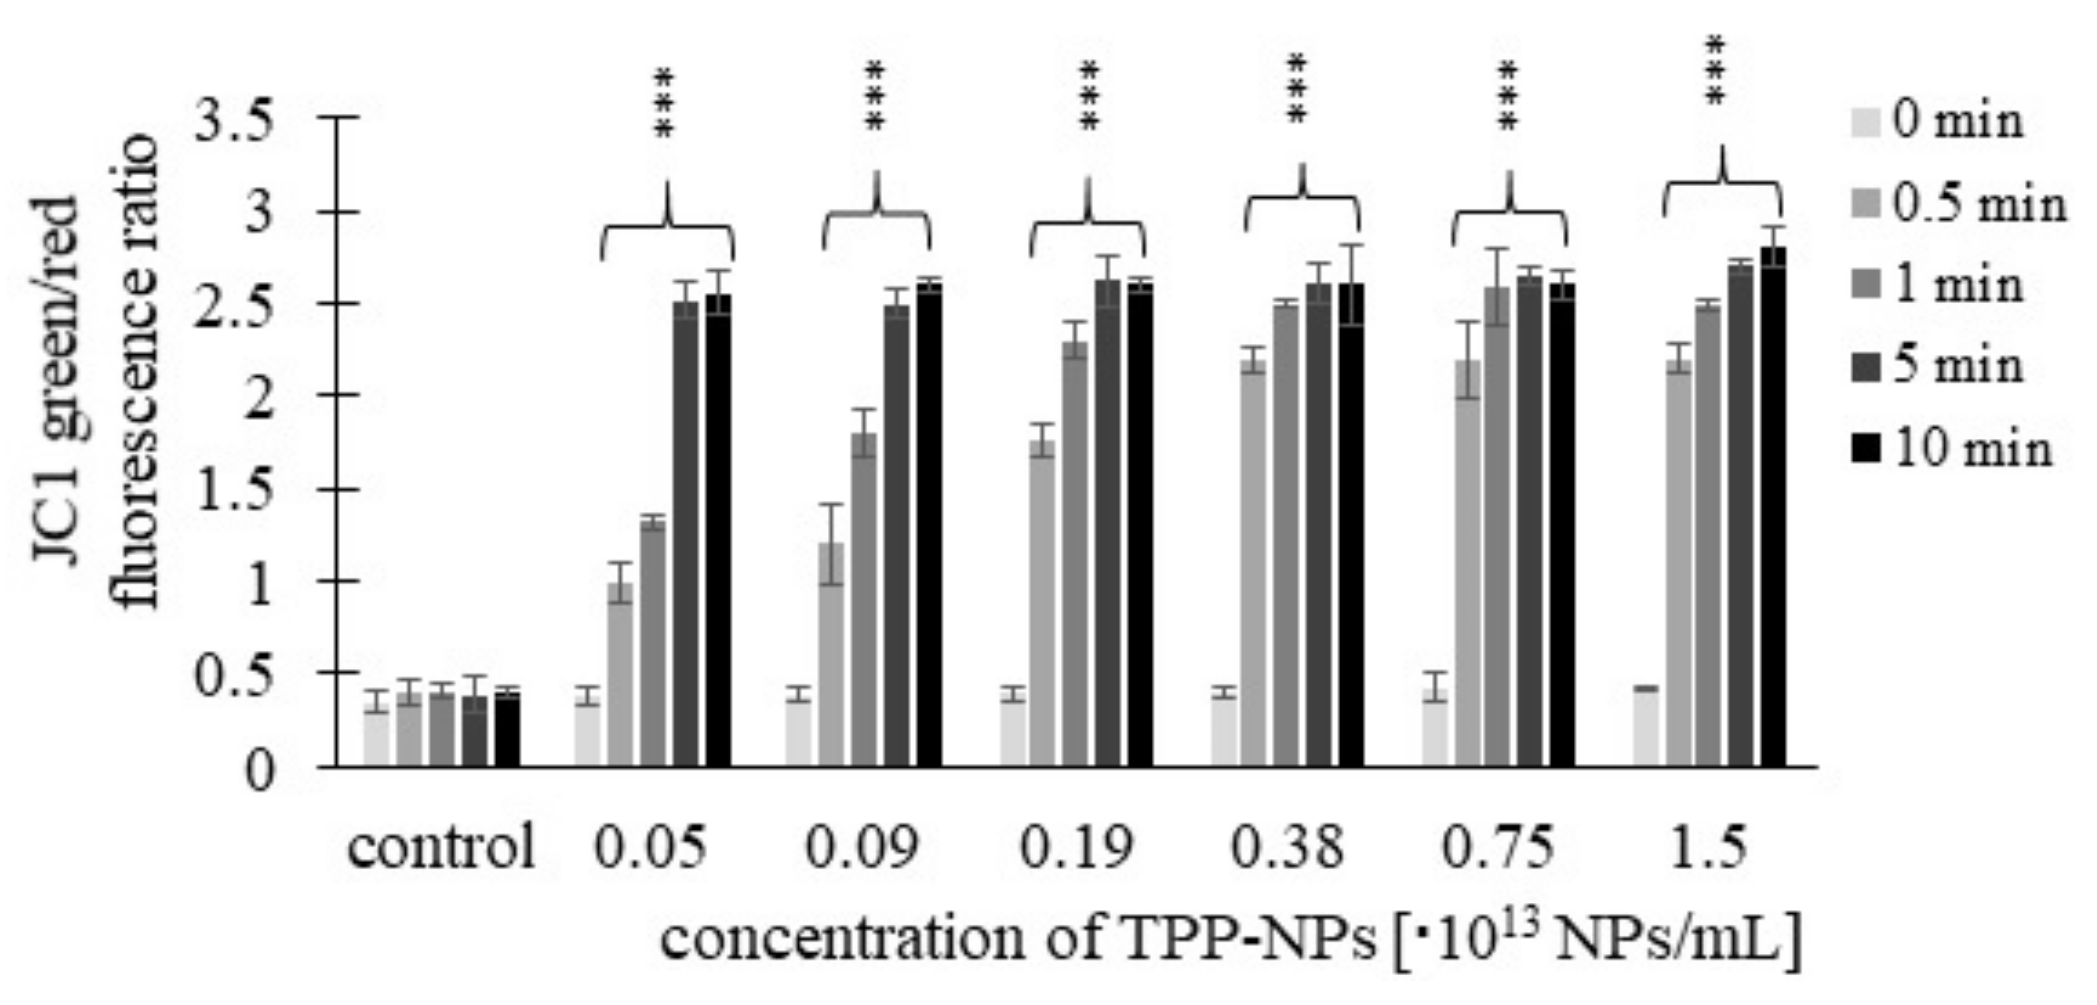
2.4. Mitochondrial Membrane Potential (MMP)
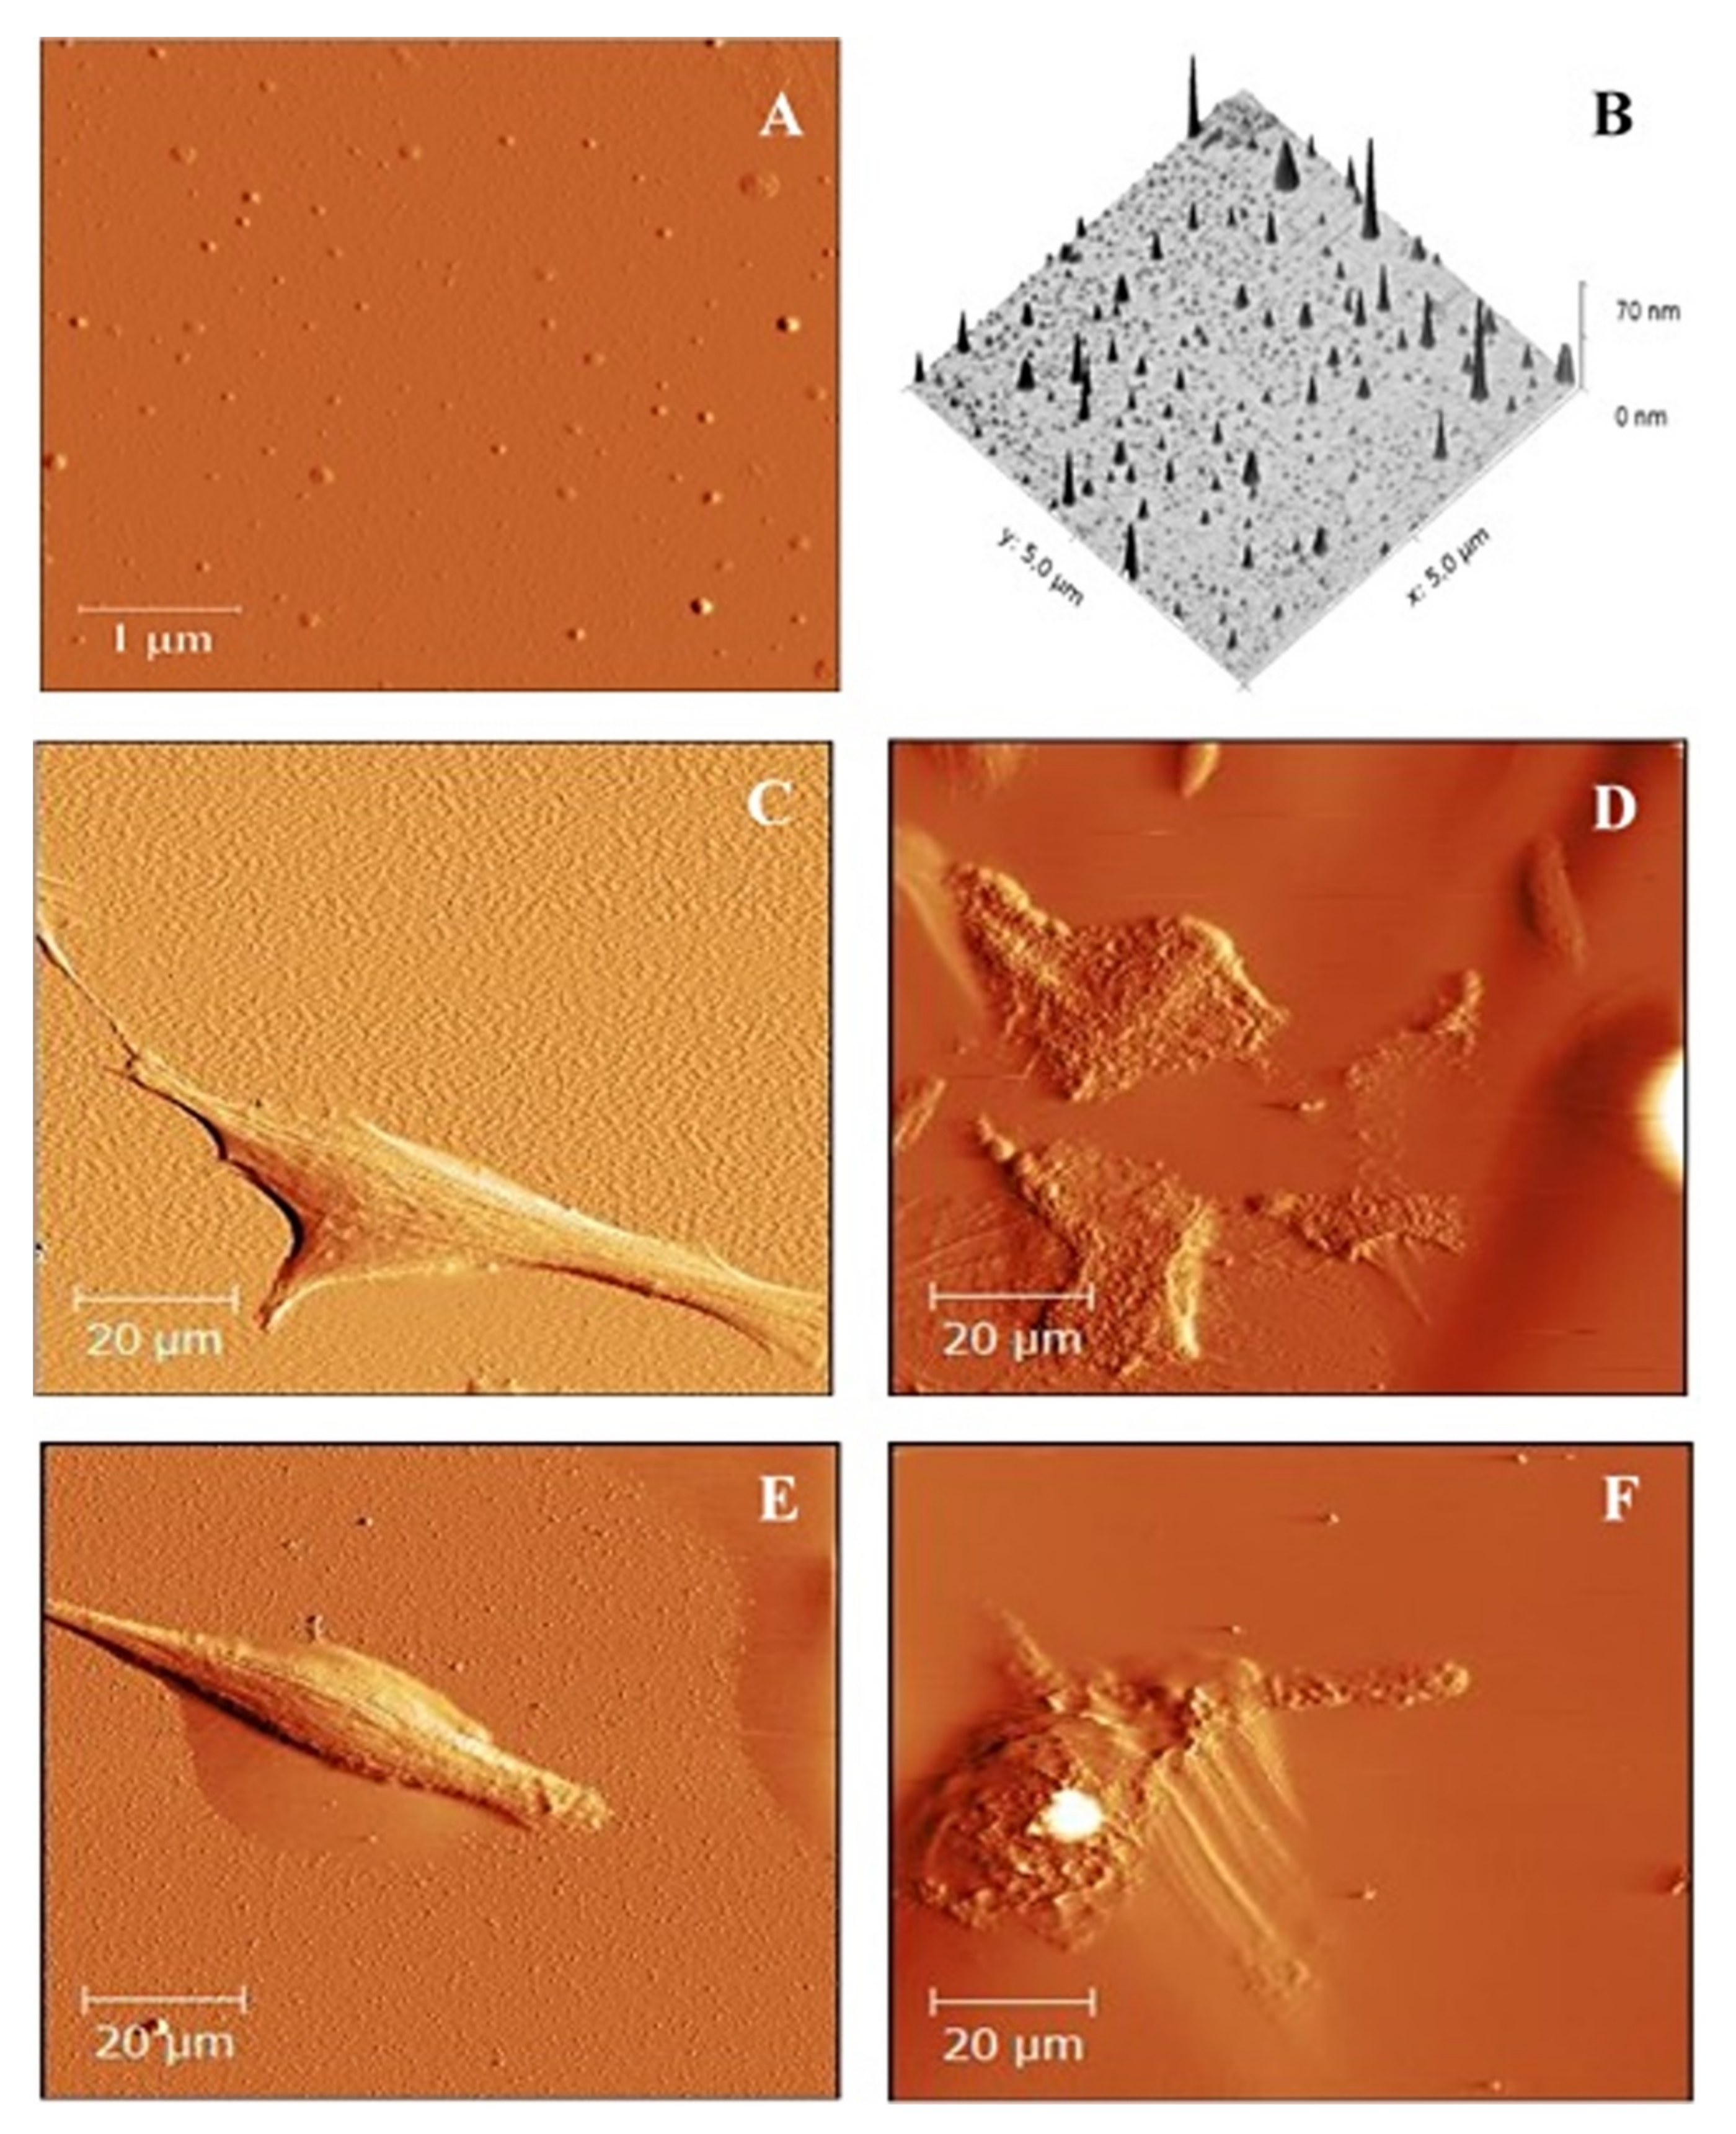
2.5. Atomic Force Microscope Image
3. Discussion
4. Materials and Methods
4.1. Cell Lines
4.2. Tested Samples
4.3. Light Source
4.4. Cell Cytotoxicity (MTT) Assay
4.5. ROS Production Measurement
4.6. Mitochondrial Membrane Potential (MMP) Assay
4.7. AFM Sample Preparation
4.8. AFM Imaging
4.9. Statistical Data Processing
5. Conclusions
Supplementary Materials
Author Contributions
Funding
Institutional Review Board Statement
Informed Consent Statement
Data Availability Statement
Acknowledgments
Conflicts of Interest
References
- Ackroyd, R.; Kelty, C.; Brown, N.; Reed, M. The History of Photodetection and Photodynamic Therapy. Photochem. Photobiol. 2001, 74, 656–669. [Google Scholar] [CrossRef]
- Triesscheijn, M.; Baas, P.; Schellens, J.H.M.; Stewart, F.A. Photodynamic Therapy in Oncology. Oncologist 2006, 11, 1034–1044. [Google Scholar] [CrossRef] [PubMed]
- Zhao, B.; He, Y.-Y. Recent advances in the prevention and treatment of skin cancer using photodynamic therapy. Expert Rev. Anticancer Therm. 2010, 10, 1797–1809. [Google Scholar] [CrossRef] [PubMed] [Green Version]
- Dougherty, T.J.; Gomer, C.J.; Henderson, B.W.; Jori, G.; Kessel, D.; Korbelik, M.; Moan, J.; Peng, Q. Photodynamic Therapy. J. Natl. Cancer Inst. 1998, 90, 889–905. [Google Scholar] [CrossRef] [Green Version]
- Olivo, M.; Bhuvaneswari, R.; Lucky, S.S.; Dendukuri, N.; Thong, P.S.-P. Targeted Therapy of Cancer Using Photodynamic Therapy in Combination with Multi-faceted Anti-Tumor Modalities. Pharmaceuticals 2010, 3, 1507–1529. [Google Scholar] [CrossRef] [Green Version]
- Debele, T.A.; Peng, S.; Tsai, H.-C. Drug Carrier for Photodynamic Cancer Therapy. Int. J. Mol. Sci. 2015, 16, 22094–22136. [Google Scholar] [CrossRef]
- Abrahamse, H.; Hamblin, M.R. New photosensitizers for photodynamic therapy. Biochem. J. 2016, 473, 347–364. [Google Scholar] [CrossRef] [Green Version]
- Mathews, M.S.; Angell-Petersen, E.; Bs, R.S.; Sun, C.-H.; Vo, V.; Hirschberg, H.; Madsen, S.J. The effects of ultra low fluence rate single and repetitive photodynamic therapy on glioma spheroids. Lasers Surg. Med. 2009, 41, 578–584. [Google Scholar] [CrossRef] [Green Version]
- Prasad, P.N. Polymer science and technology for new generation photonics and biophotonics. Curr. Opin. Solid State Mater. Sci. 2004, 8, 11–19. [Google Scholar] [CrossRef]
- Jain, K.K. Nanomedicine: Application of Nanobiotechnology in Medical Practice. Med. Princ. Pract. 2008, 17, 89–101. [Google Scholar] [CrossRef]
- Roduner, E. Size matters: Why nanomaterials are different. Chem. Soc. Rev. 2006, 35, 583–592. [Google Scholar] [CrossRef]
- Monge-Fuentes, V.; Muehlmann, L.A.; De Azevedo, R.B. Perspectives on the application of nanotechnology in photodynamic therapy for the treatment of melanoma. Nano Rev. 2014, 5, 24381. [Google Scholar] [CrossRef] [Green Version]
- Davis, M.E.; Chen, Z.G.; Shin, D.M. Nanoparticle therapeutics: An emerging treatment modality for cancer. Nanosci. Technol. 2009, 7, 239–250. [Google Scholar] [CrossRef]
- Konan-Kouakou, Y.; Boch, R.; Gurny, R.; Allémann, E. In vitro and in vivo activities of verteporfin-loaded nanoparticles. J. Control. Release 2005, 103, 83–91. [Google Scholar] [CrossRef]
- Master, A.; Livingston, M.; Gupta, A.S. Photodynamic nanomedicine in the treatment of solid tumors: Perspectives and challenges. J. Control. Release 2013, 168, 88–102. [Google Scholar] [CrossRef] [Green Version]
- Allison, R.R.; Mota, H.C.; Bagnato, V.S.; Sibata, C.H. Bio-nanotechnology and photodynamic therapy—State of the art review. Photodiagn. Photodyn. Ther. 2008, 5, 19–28. [Google Scholar] [CrossRef]
- Lismont, M.; Dreesen, L.; Wuttke, S. Metal-Organic Framework Nanoparticles in Photodynamic Therapy: Current Status and Perspectives. Adv. Funct. Mater. 2017, 27, 1606314. [Google Scholar] [CrossRef]
- Nakamura, Y.; Mochida, A.; Choyke, P.L.; Kobayashi, H. Nanodrug Delivery: Is the Enhanced Permeability and Retention Effect Sufficient for Curing Cancer? Bioconjug. Chem. 2016, 27, 2225–2238. [Google Scholar] [CrossRef]
- Hossen, S.; Hossain, M.K.; Basher, M.K.; Mia, M.N.H.; Rahman, M.T.; Uddin, M.J. Smart nanocarrier-based drug delivery systems for cancer therapy and toxicity studies: A review. J. Adv. Res. 2019, 15, 1–18. [Google Scholar] [CrossRef]
- Heldin, C.-H.; Rubin, K.; Pietras, K.; Östman, A. High interstitial fluid pressure—An obstacle in cancer therapy. Nat. Rev. Cancer 2004, 4, 806–813. [Google Scholar] [CrossRef]
- Panyam, J.; Zhou, W.; Prabha, S.; Sahoo, S.K.; Labhasetwar, V. Rapid endo-lysosomal escape of poly(DL-lactide-coglycolide) nanoparticles: Implications for drug and gene delivery. FASEB J. 2002, 16, 1217–1226. [Google Scholar] [CrossRef]
- Olivier, V.; Riviere, C.; Hindié, M.; Duval, J.-L.; Bomila-Koradjim, G.; Nagel, M.-D. Uptake of polystyrene beads bearing functional groups by macrophages and fibroblasts. Colloids Surf. B Biointerfaces 2004, 33, 23–31. [Google Scholar] [CrossRef]
- Yacobi, N.R.; DeMaio, L.; Xie, J.; Hamm-Alvarez, S.; Borok, Z.; Kim, K.-J.; Crandall, E.D. Polystyrene nanoparticle trafficking across alveolar epithelium. Nanomed. Nanotechnol. Biol. Med. 2008, 4, 139–145. [Google Scholar] [CrossRef]
- Prietl, B.; Meindl, C.; Roblegg, E.; Pieber, T.R.; Lanzer, G.; Fröhlich, E. Nano-sized and micro-sized polystyrene particles affect phagocyte function. Cell Biol. Toxicol. 2014, 30, 1–16. [Google Scholar] [CrossRef] [Green Version]
- Lunova, M.; Prokhorov, A.; Jirsa, M.; Hof, M.; Olżyńska, A.; Jurkiewicz, P.; Kubinova, S.; Lunov, O.; Dejneka, A. Nanoparticle core stability and surface functionalization drive the mTOR signaling pathway in hepatocellular cell lines. Sci. Rep. 2017, 7, 16049. [Google Scholar] [CrossRef] [Green Version]
- Mala, Z.; Zarska, L.; Malina, L.; Langova, K.; Vecerova, R.; Kolar, M.; Henke, P.; Mosinger, J.; Kolarova, H. Photodynamic efect of TPP encapsulated in polystyrene nanoparticles toward multi resistant pathogenic bacterial strains: AFM evaluation. Sci. Rep. 2021, 11, 6786. [Google Scholar] [CrossRef]
- Sledge, G.; Miller, K. Exploiting the hallmarks of cancer: The future conquest of breast cancer. Eur. J. Cancer 2003, 39, 1668–1675. [Google Scholar] [CrossRef]
- Zhou, Y.; Liang, X.; Dai, Z. Porphyrin-loaded nanoparticles for cancer theranostics. Nanoscale 2016, 8, 12394–12405. [Google Scholar] [CrossRef]
- Şueki, F.; Ruhi, M.K.; Gülsoy, M. The effect of curcumin in antitumor photodynamic therapy: In vitro experiments with Caco-2 and PC-3 cancer lines. Photodiagn. Photodyn. Ther. 2019, 27, 95–99. [Google Scholar] [CrossRef]
- Hanakova, A.; Bogdanová, K.; Tománková, K.; Binder, S.; Bajgar, R.; Langova, K.; Kolář, M.; Mosinger, J.; Kolarova, H. Study of photodynamic effects on NIH 3T3 cell line and bacteria. Biomed. Pap. 2014, 158, 201–207. [Google Scholar] [CrossRef] [Green Version]
- Žárská, L.; Malá, Z.; Langová, K.; Malina, L.; Binder, S.; Bajgar, R.; Kolářová, H. The effect of two porphyrine photosensitizers TMPyP and ZnTPPS4 for application in photodynamic therapy of cancer cells in vitro. Photodiagn. Photodyn. Ther. 2021, 34, 102224. [Google Scholar] [CrossRef] [PubMed]
- Gille, J.J.; Wotelboer, H.M.; Joenje, H. Effect of normobaric hyperoxia on antioxidant defenses of hela and CHO cells. Free Radic. Biol. Med. 1988, 4, 85–91. [Google Scholar] [CrossRef]
- Porta, C.; Moroni, M.; Guallini, P.; Torri, C.; Marzatico, F. Antioxidant enzymatic system and free radicals pathway in two different human cancer cell lines. Anticancer Res. 1996, 16, 2741–2747. [Google Scholar] [PubMed]
- Chang, M.-C.; Chan, C.-P.; Wang, Y.-J.; Lee, P.-H.; Chen, L.-I.; Tsai, Y.-L.; Lin, B.-R.; Wang, Y.-L.; Jeng, J.-H. Induction of necrosis and apoptosis to KB cancer cells by sanguinarine is associated with reactive oxygen species production and mitochondrial membrane depolarization. Toxicol. Appl. Pharmacol. 2007, 218, 143–151. [Google Scholar] [CrossRef] [PubMed]
- Kim, R.; Emi, M.; Tanabe, K.; Murakami, S.; Uchida, Y.; Arihiro, K. Regulation and interplay of apoptotic and non-apoptotic cell death. J. Pathol. 2006, 208, 319–326. [Google Scholar] [CrossRef] [PubMed]
- Baugh, S.D.P.; Yang, Z.; Leung, D.K.; Wilson, D.M.; Breslow, R. Cyclodextrin Dimers as Cleavable Carriers of Photodynamic Sensitizers. J. Am. Chem. Soc. 2001, 123, 12488–12494. [Google Scholar] [CrossRef] [PubMed]
- Sun, F.; Hamagawa, E.; Tsutsui, C.; Sakaguchi, N.; Kakuta, Y.; Tokumaru, S.; Kojo, S. Evaluation of oxidative stress during apoptosis and necrosis caused by d-galactosamine in rat liver. Biochem. Pharmacol. 2003, 65, 101–107. [Google Scholar] [CrossRef]
- Kubát, P.; Henke, P.; Raya, R.K.; Stepanek, M.; Mosinger, J. Polystyrene and Poly(ethylene glycol)-b-Poly(ε-caprolactone) Nanoparticles with Porphyrins: Structure, Size, and Photooxidation Properties. Langmuir 2019, 36, 302–310. [Google Scholar] [CrossRef]
- Kubát, P.; Henke, P.; Berzediová, V.; Štěpánek, M.; Lang, K.; Mosinger, J. Nanoparticles with Embedded Porphyrin Photosensitizers for Photooxidation Reactions and Continuous Oxygen Sensing. ACS Appl. Mater. Interfaces 2017, 9, 36229–36238. [Google Scholar] [CrossRef]
- Dolanský, J.; Henke, P.; Malá, Z.; Žárská, L.; Kubát, P.; Mosinger, J. Antibacterial nitric oxide- and singlet oxygen-releasing polystyrene nanoparticles responsive to light and temperature triggers. Nanoscale 2018, 10, 2639–2648. [Google Scholar] [CrossRef]
- Henke, P.; Kirakci, K.; Kubát, P.; Fraiberk, M.; Forstová, J.; Mosinger, J. Antibacterial, Antiviral, and Oxygen-Sensing Nanoparticles Prepared from Electrospun Materials. ACS Appl. Mater. Interfaces 2016, 8, 25127–25136. [Google Scholar] [CrossRef]


Publisher’s Note: MDPI stays neutral with regard to jurisdictional claims in published maps and institutional affiliations. |
© 2022 by the authors. Licensee MDPI, Basel, Switzerland. This article is an open access article distributed under the terms and conditions of the Creative Commons Attribution (CC BY) license (https://creativecommons.org/licenses/by/4.0/).
Share and Cite
Žárská, L.; Malá, Z.; Langová, K.; Malina, L.; Binder, S.; Bajgar, R.; Henke, P.; Mosinger, J.; Kolářová, H. Biological Evaluation of Photodynamic Effect Mediated by Nanoparticles with Embedded Porphyrin Photosensitizer. Int. J. Mol. Sci. 2022, 23, 3588. https://doi.org/10.3390/ijms23073588
Žárská L, Malá Z, Langová K, Malina L, Binder S, Bajgar R, Henke P, Mosinger J, Kolářová H. Biological Evaluation of Photodynamic Effect Mediated by Nanoparticles with Embedded Porphyrin Photosensitizer. International Journal of Molecular Sciences. 2022; 23(7):3588. https://doi.org/10.3390/ijms23073588
Chicago/Turabian StyleŽárská, Ludmila, Zuzana Malá, Kateřina Langová, Lukáš Malina, Svatopluk Binder, Robert Bajgar, Petr Henke, Jiří Mosinger, and Hana Kolářová. 2022. "Biological Evaluation of Photodynamic Effect Mediated by Nanoparticles with Embedded Porphyrin Photosensitizer" International Journal of Molecular Sciences 23, no. 7: 3588. https://doi.org/10.3390/ijms23073588
APA StyleŽárská, L., Malá, Z., Langová, K., Malina, L., Binder, S., Bajgar, R., Henke, P., Mosinger, J., & Kolářová, H. (2022). Biological Evaluation of Photodynamic Effect Mediated by Nanoparticles with Embedded Porphyrin Photosensitizer. International Journal of Molecular Sciences, 23(7), 3588. https://doi.org/10.3390/ijms23073588