
Role of C-Terminal Domain and Membrane Potential in the Mobility of Kv1.3 Channels in Immune Synapse Forming T Cells

 , , ,
, , ,  ,
, 
Abstract
:1. Introduction
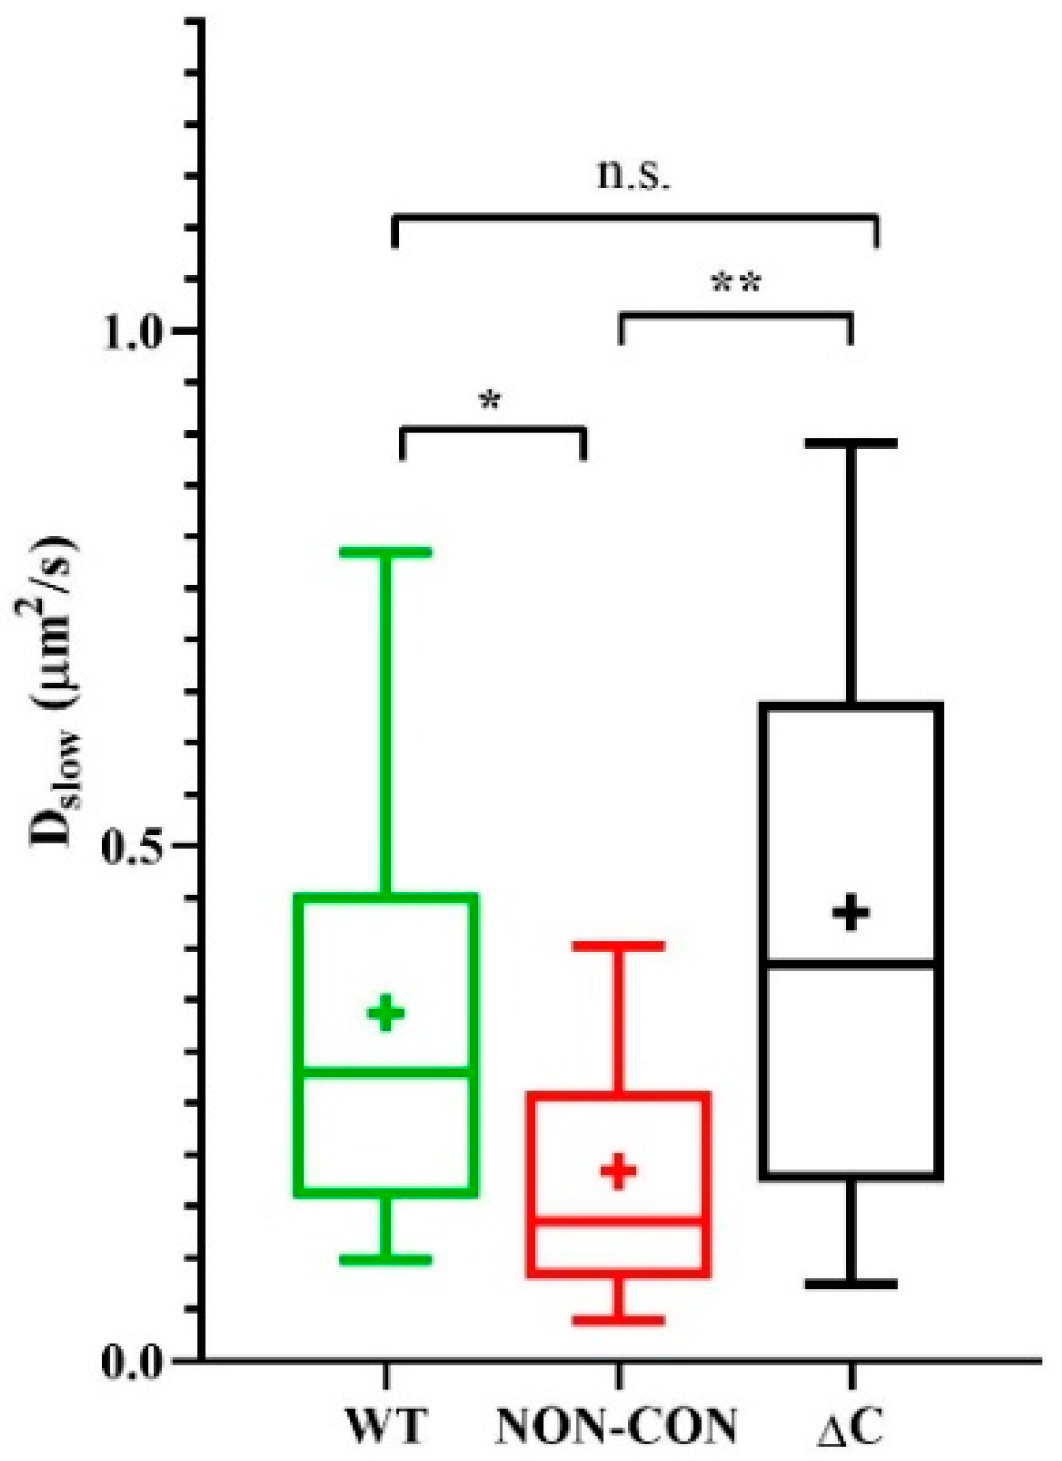
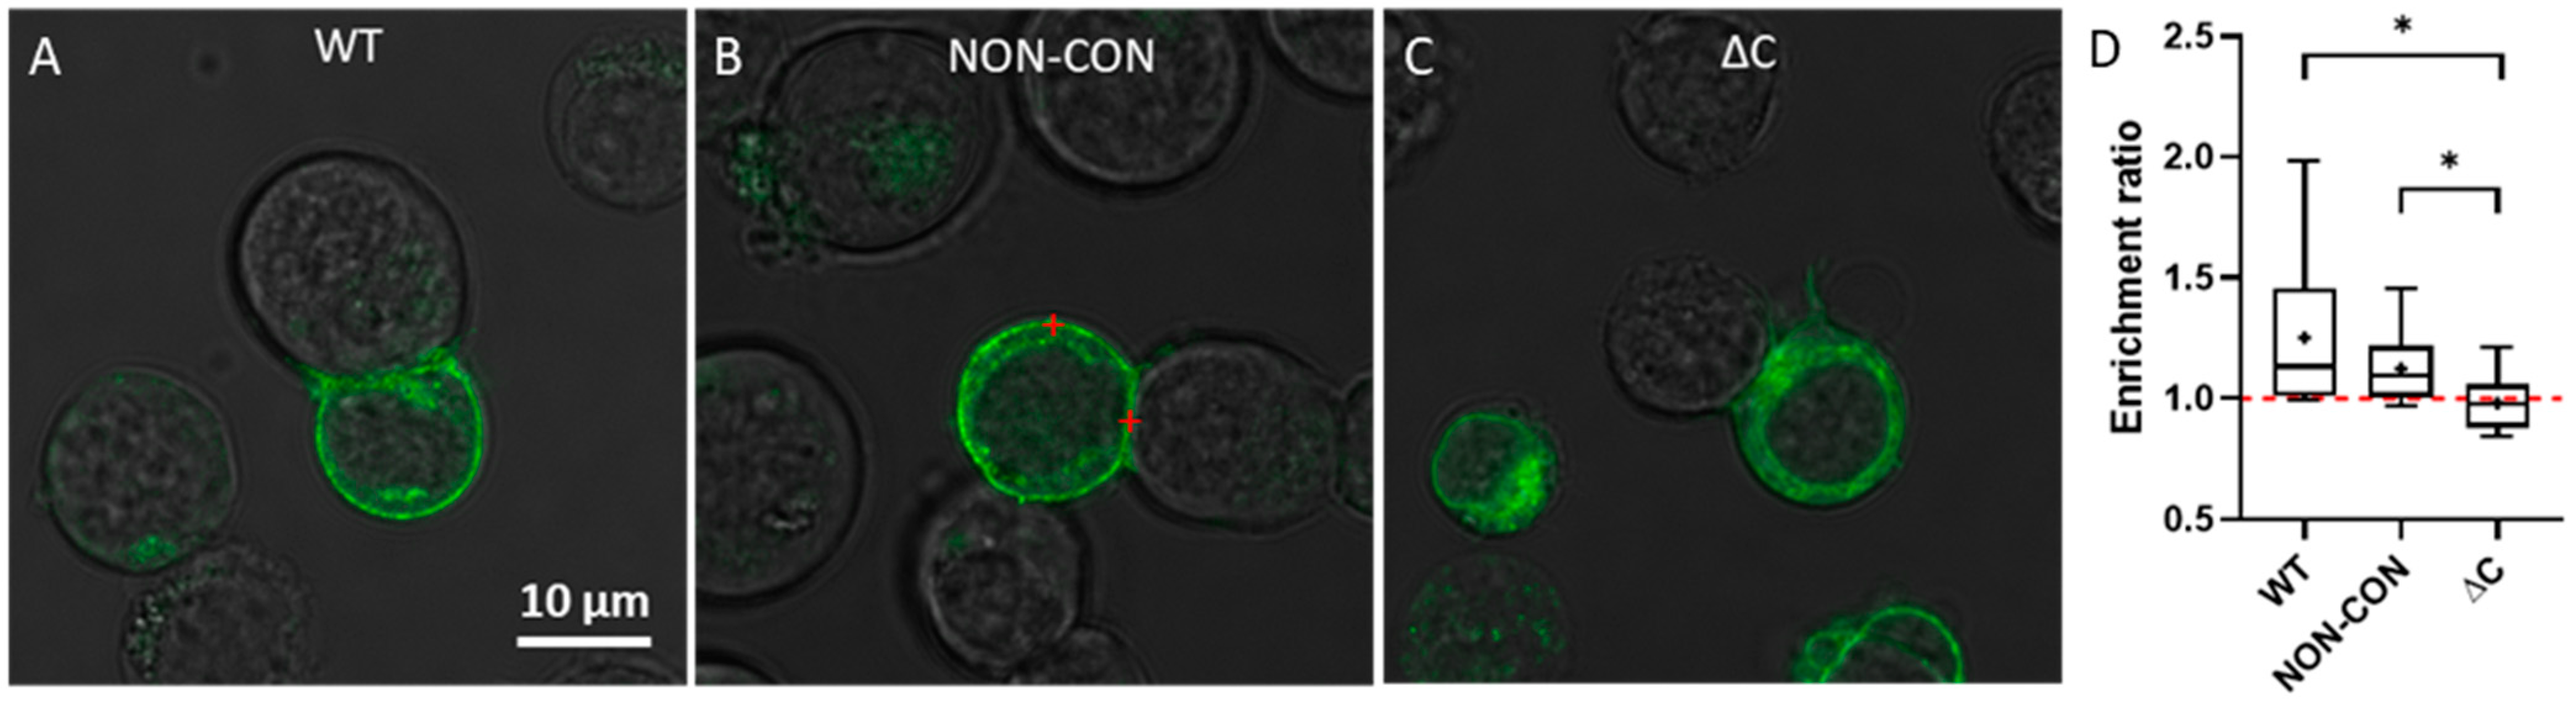
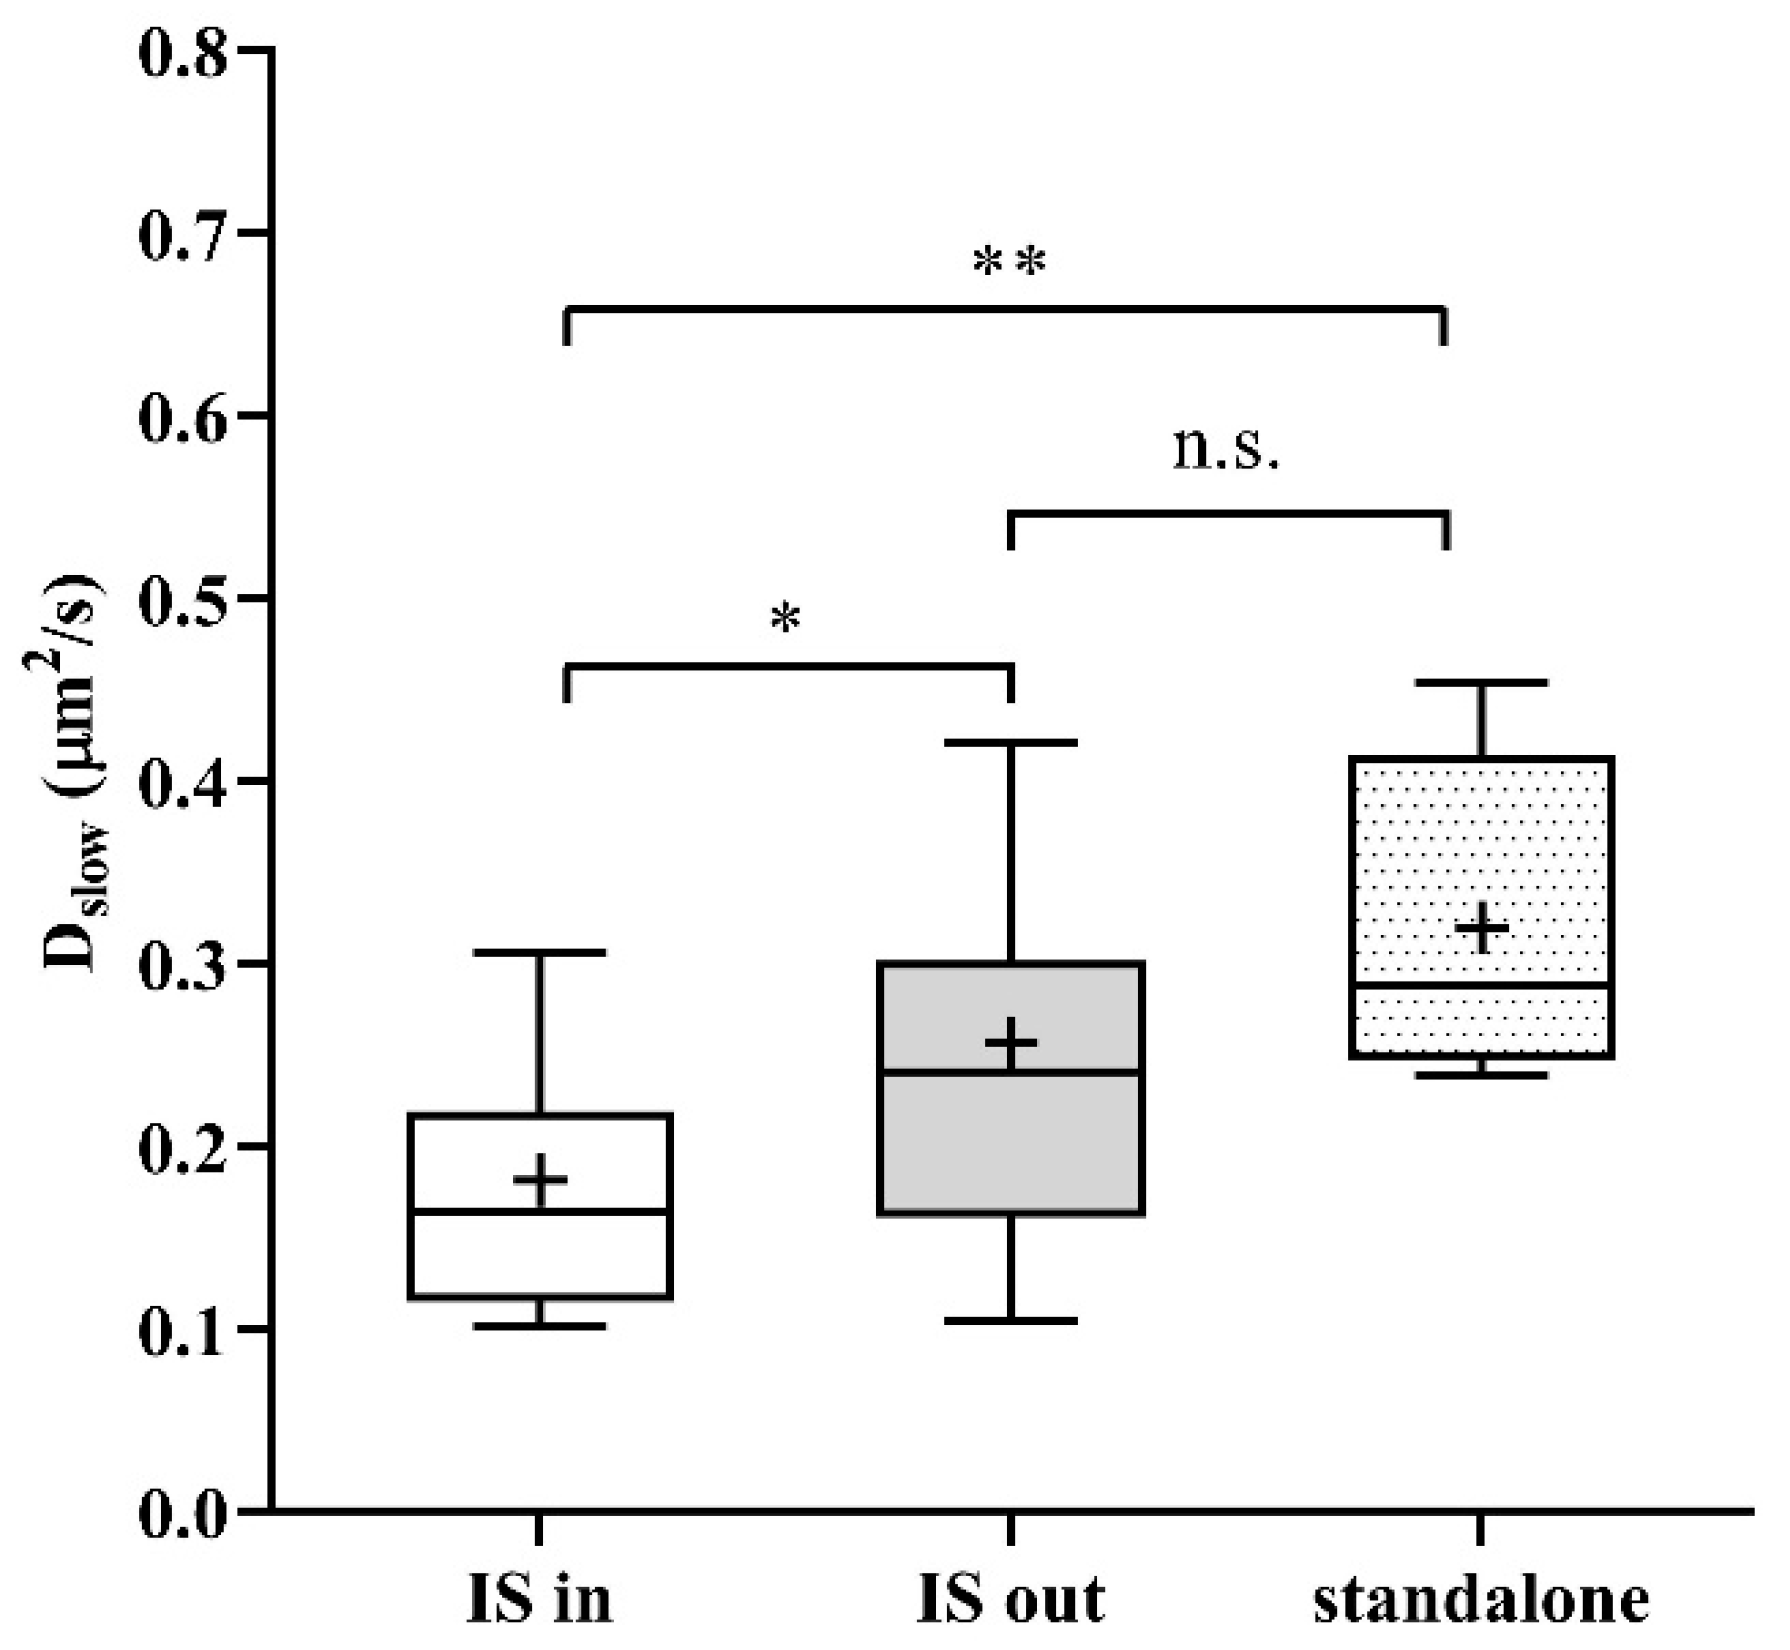
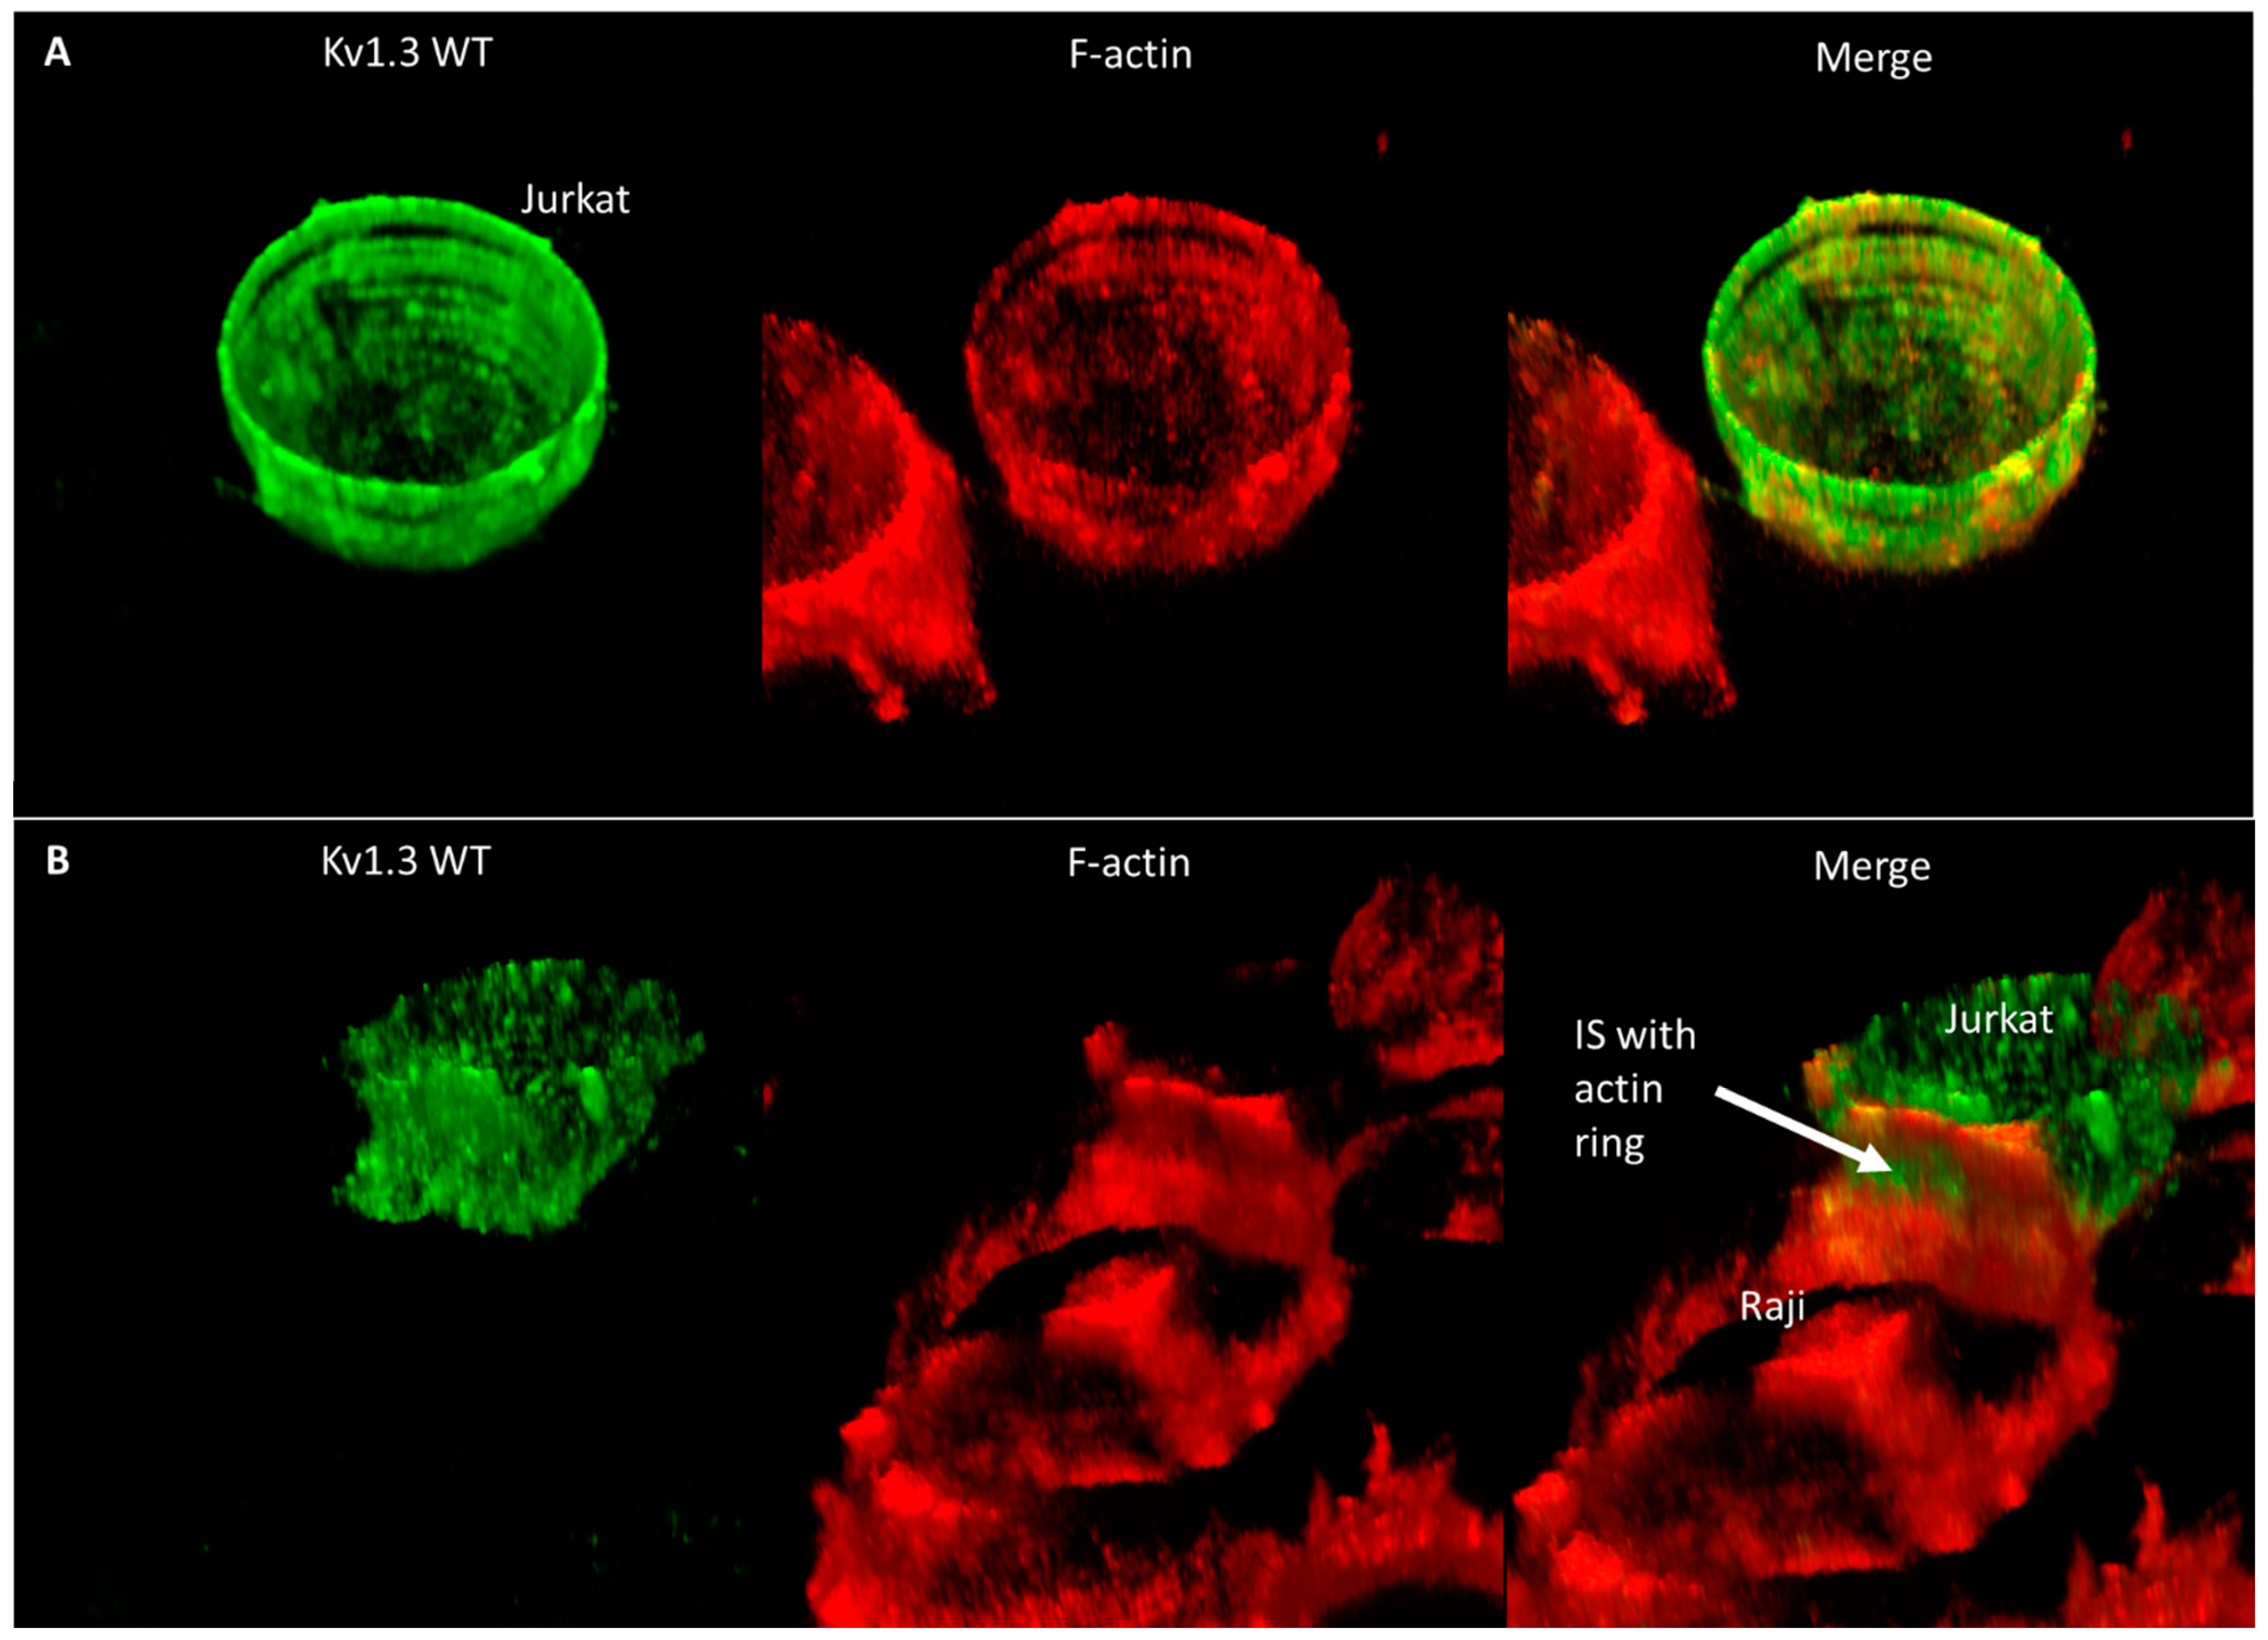
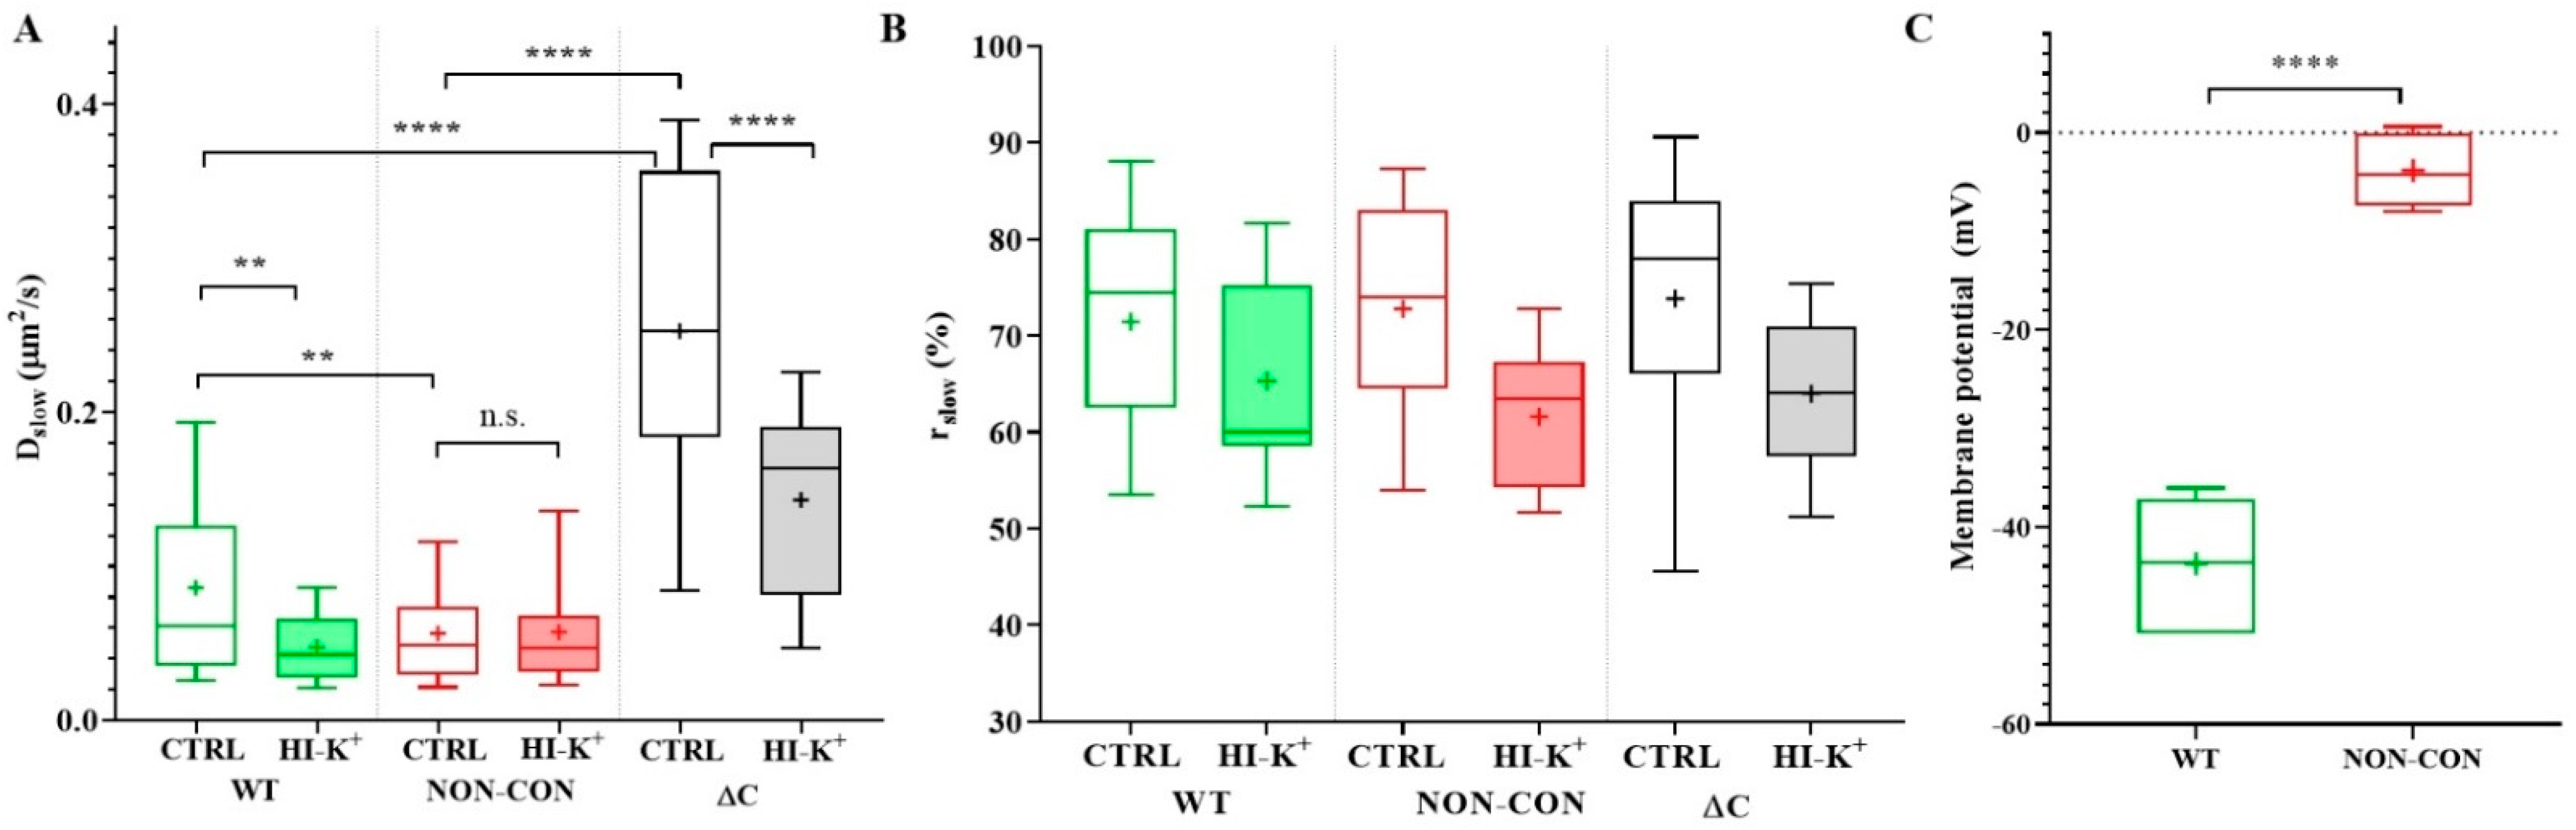
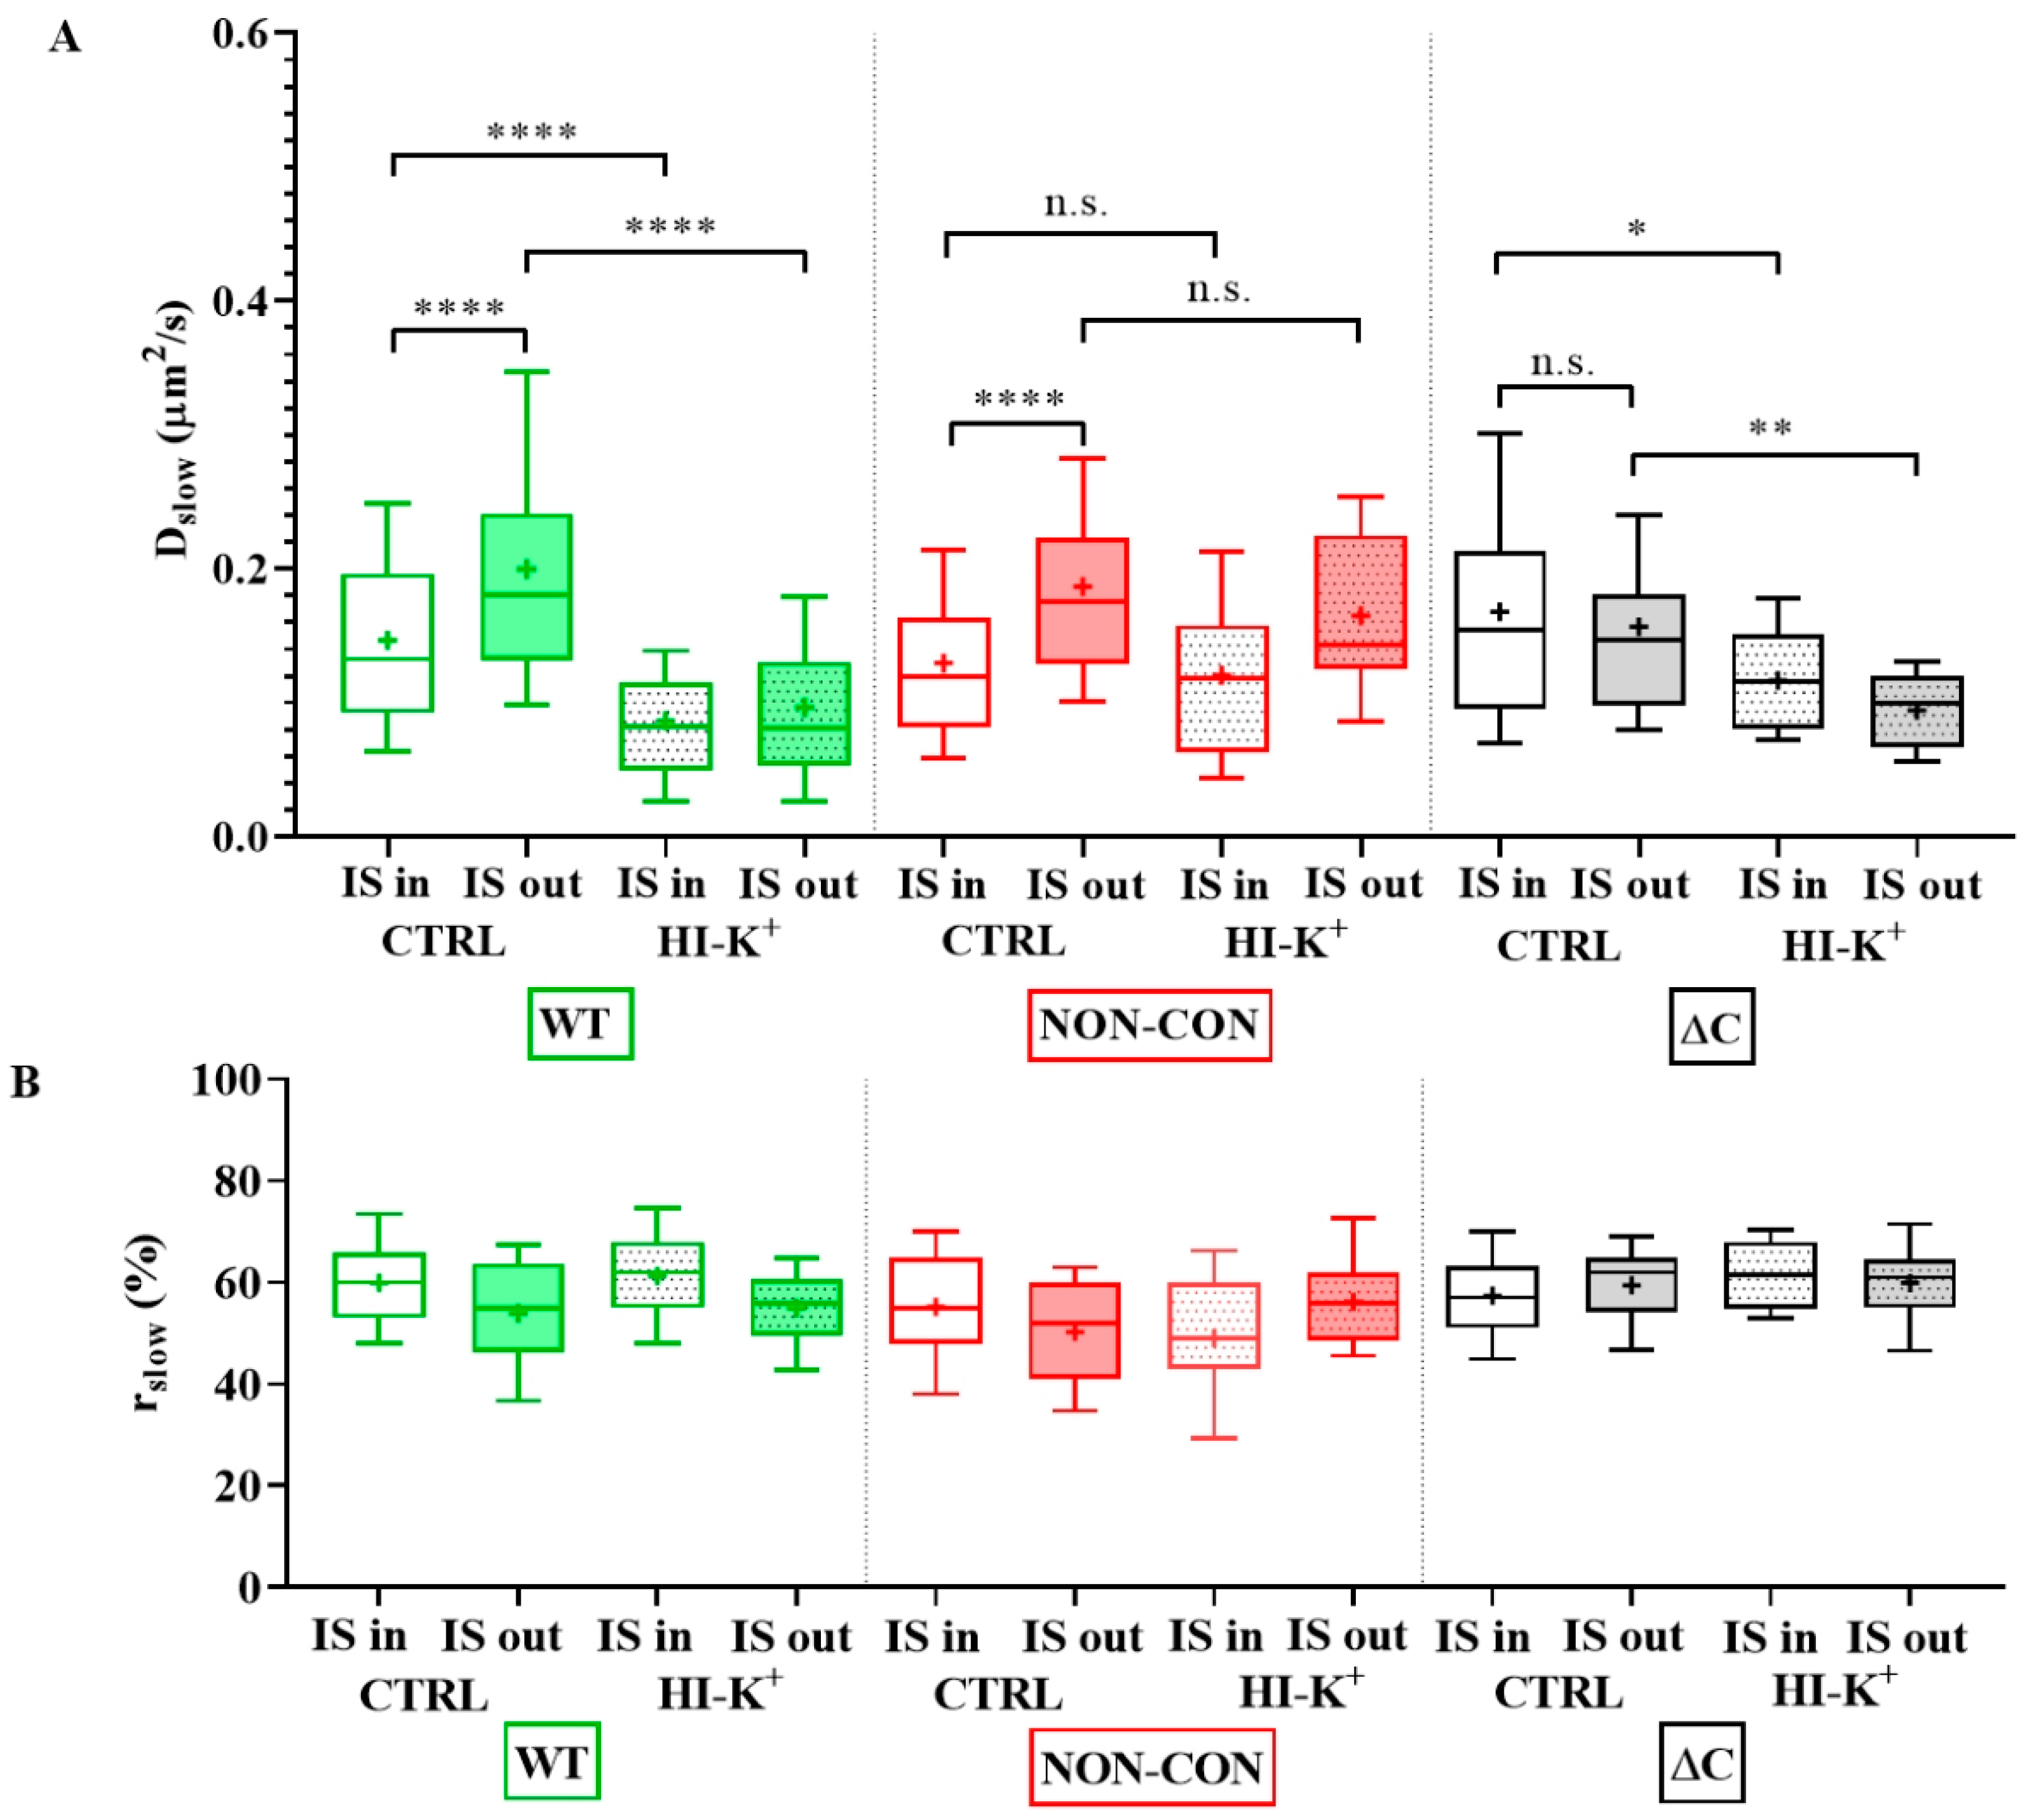
2. Results
3. Discussion
4. Materials and Methods
4.1. Cells and Cell Culture
4.2. Reagents, Fluorescence Labeling of Cells
4.3. Immunological Synapse (IS) Formation
4.4. Fluorescence Correlation Spectroscopy (FCS)
4.5. Electrophysiology
4.6. Confocal Imaging
4.7. Statistical Analysis
5. Conclusions
Supplementary Materials
Author Contributions
Funding
Institutional Review Board Statement
Informed Consent Statement
Data Availability Statement
Acknowledgments
Conflicts of Interest
References
- Bezanilla, F. How membrane proteins sense voltage. Nat. Rev. Mol. Cell. Biol. 2008, 9, 323–332. [Google Scholar] [CrossRef] [PubMed]
- Varga, Z.; Hajdu, P.; Panyi, G. Ion channels in T lymphocytes: An update on facts, mechanisms and therapeutic targeting in autoimmune diseases. Immunol. Lett. 2010, 130, 19–25. [Google Scholar] [CrossRef] [PubMed]
- Beeton, C.; Wulff, H.; Singh, S.; Botsko, S.; Crossley, G.; Gutman, G.A.; Cahalan, M.D.; Pennington, M.; Chandy, K.G. A novel fluorescent toxin to detect and investigate Kv1.3 channel up-regulation in chronically activated T lymphocytes. J. Biol. Chem. 2003, 278, 9928–9937. [Google Scholar] [CrossRef] [PubMed]
- Beeton, C.; Wulff, H.; Standifer, N.E.; Azam, P.; Mullen, K.M.; Pennington, M.W.; Kolski-Andreaco, A.; Wei, E.; Grino, A.; Counts, D.R.; et al. Kv1.3 channels are a therapeutic target for T cell-mediated autoimmune diseases. Proc. Natl. Acad. Sci. USA 2006, 103, 17414–17419. [Google Scholar] [CrossRef]
- Wang, X.; Li, G.; Guo, J.; Zhang, Z.; Zhang, S.; Zhu, Y.; Cheng, J.; Yu, L.; Ji, Y.; Tao, J. Kv1.3 Channel as a Key Therapeutic Target for Neuroinflammatory Diseases: State of the Art and Beyond. Front. Neurosci. 2019, 13, 1393. [Google Scholar] [CrossRef]
- Panyi, G.; Bagdány, M.; Bodnár, A.; Vámosi, G.; Szentesi, G.; Jenei, A.; Mátyus, L.; Varga, S.; Waldmann, T.A.; Gáspár, R.; et al. Colocalization and nonrandom distribution of Kv1.3 potassium channels and CD3 molecules in the plasma membrane of human T lymphocytes. Proc. Natl. Acad. Sci. USA 2003, 100, 2592–2597. [Google Scholar] [CrossRef]
- Torralba, D.; Martin-Cofreces, N.B.; Sanchez-Madrid, F. Mechanisms of polarized cell-cell communication of T lymphocytes. Immunol. Lett. 2019, 209, 11–20. [Google Scholar] [CrossRef]
- Panyi, G.; Vámosi, G.; Bacsó, Z.; Bagdány, M.; Bodnár, A.; Varga, Z.; Gáspár, R.; Mátyus, L.; Damjanovich, S. Kv1.3 potassium channels are localized in the immunological synapse formed between cytotoxic and target cells. Proc. Natl. Acad. Sci. USA 2004, 101, 1285–1290. [Google Scholar] [CrossRef]
- Nicolaou, S.A.; Neumeier, L.; Steckly, A.; Kucher, V.; Takimoto, K.; Conforti, L. Localization of Kv1.3 channels in the immunological synapse modulates the calcium response to antigen stimulation in T lymphocytes. J. Immunol. 2009, 183, 6296–6302. [Google Scholar] [CrossRef]
- Papp, F.; Hajdu, P.; Tajti, G.; Toth, A.; Nagy, E.; Fazekas, Z.; Kovacs, S.; Vámosi, G.; Varga, Z.; Panyi, G. Periodic Membrane Potential and Ca(2+) Oscillations in T Cells Forming an Immune Synapse. Int. J. Mol. Sci. 2020, 21, 1568. [Google Scholar] [CrossRef]
- Artym, V.V.; Petty, H.R. Molecular proximity of Kv1.3 voltage-gated potassium channels and β1-integrins on the plasma membrane of melanoma cells: Effects of cell adherence and channel blockers. J. Gen. Physiol. 2002, 120, 29–37. [Google Scholar] [CrossRef] [PubMed]
- Chandy, K.G.; Wulff, H.; Beeton, C.; Pennington, M.; Gutman, G.A.; Cahalan, M.D. K+ channels as targets for specific immunomodulation. Trends Pharmacol. Sci. 2004, 25, 280–289. [Google Scholar] [CrossRef] [PubMed]
- Gong, J.; Xu, J.; Bezanilla, M.; van Huizen, R.; Derin, R.; Li, M. Differential stimulation of PKC phosphorylation of potassium channels by ZIP1 and ZIP2. Science 1999, 285, 1565–1569. [Google Scholar] [CrossRef] [PubMed]
- Gulbins, E.; Szabo, I.; Baltzer, K.; Lang, F. Ceramide-Induced inhibition of T lymphocyte voltage-gated potassium channel is mediated by tyrosine kinases. Proc. Natl. Acad. Sci. USA 1997, 94, 7661–7666. [Google Scholar] [CrossRef]
- Hanada, T.; Lin, L.; Chandy, K.G.; Oh, S.S.; Chishti, A.H. Human homologue of the Drosophila discs large tumor suppressor binds to p56lck tyrosine kinase and Shaker type Kv1.3 potassium channel in T lymphocytes. J. Biol. Chem. 1997, 272, 26899–26904. [Google Scholar] [CrossRef]
- McCormack, T.; McCormack, K.; Nadal, M.S.; Vieira, E.; Ozaita, A.; Rudy, B. The effects of Shaker beta-subunits on the human lymphocyte K+ channel Kv1.3. J. Biol. Chem. 1999, 274, 20123–20126. [Google Scholar] [CrossRef]
- Panyi, G.; Vamosi, G.; Bodnar, A.; Gaspar, R.; Damjanovich, S. Looking through ion channels: Recharged concepts in T-cell signaling. Trends Immunol. 2004, 25, 565–569. [Google Scholar] [CrossRef]
- Matsushita, Y.; Ohya, S.; Itoda, H.; Kimura, T.; Suzuki, Y.; Yamamura, H.; Imaizumi, Y. Molecular mechanisms for Kv1.3 potassium channel current inhibition by CD3/CD28 stimulation in Jurkat T cells. Biochem. Biophys. Res. Commun. 2008, 374, 152–157. [Google Scholar] [CrossRef]
- Hajdu, P.; Varga, Z.; Pieri, C.; Panyi, G.; Gaspar, R. Cholesterol modifies the gating of Kv1.3 in human T lymphocytes. Pflugers Arch. 2003, 445, 674–682. [Google Scholar] [CrossRef]
- Burke, N.A.; Takimoto, K.; Li, D.; Han, W.; Watkins, S.C.; Levitan, E.S. Distinct structural requirements for clustering and immobilization of K+ channels by PSD-95. J. Gen. Physiol. 1999, 113, 71–80. [Google Scholar] [CrossRef]
- Won, S.; Levy, J.M.; Nicoll, R.A.; Roche, K.W. MAGUKs: Multifaceted synaptic organizers. Curr. Opin. Neurobiol. 2017, 43, 94–101. [Google Scholar] [CrossRef] [PubMed]
- Doczi, M.A.; Damon, D.H.; Morielli, A.D. A C-terminal PDZ binding domain modulates the function and localization of Kv1.3 channels. Exp. Cell Res. 2011, 317, 2333–2341. [Google Scholar] [CrossRef] [PubMed]
- Kim, E.; Sheng, M. Differential K+ channel clustering activity of PSD-95 and SAP97, two related membrane-associated putative guanylate kinases. Neuropharmacology 1996, 35, 993–1000. [Google Scholar] [CrossRef]
- Tiffany, A.M.; Manganas, L.N.; Kim, E.; Hsueh, Y.P.; Sheng, M.; Trimmer, J.S. PSD-95 and SAP97 exhibit distinct mechanisms for regulating K(+) channel surface expression and clustering. J. Cell Biol. 2000, 148, 147–158. [Google Scholar] [CrossRef] [PubMed]
- Szilágyi, O.; Boratko, A.; Panyi, G.; Hajdu, P. The role of PSD-95 in the rearrangement of Kv1.3 channels to the immunological synapse. Pflugers Arch. 2013, 465, 1341–1353. [Google Scholar] [CrossRef]
- Hajdu, P.; Martin, G.V.; Chimote, A.A.; Szilagyi, O.; Takimoto, K.; Conforti, L. The C-terminus SH3-binding domain of Kv1.3 is required for the actin-mediated immobilization of the channel via cortactin. Mol. Biol. Cell 2015, 26, 1640–1651. [Google Scholar] [CrossRef]
- Nagy, É.; Mocsár, G.; Sebestyén, V.; Volkó, J.; Papp, F.; Tóth, K.; Damjanovich, S.; Panyi, G.; Waldmann, T.A.; Bodnár, A.; et al. Membrane Potential Distinctly Modulates Mobility and Signaling of IL-2 and IL-15 Receptors in T Cells. Biophys. J. 2018, 114, 2473–2482. [Google Scholar] [CrossRef]
- Voros, O.; Szilagyi, O.; Balajthy, A.; Somodi, S.; Panyi, G.; Hajdu, P. The C-terminal HRET sequence of Kv1.3 regulates gating rather than targeting of Kv1.3 to the plasma membrane. Sci. Rep. 2018, 8, 5937. [Google Scholar] [CrossRef]
- Dross, N.; Spriet, C.; Zwerger, M.; Muller, G.; Waldeck, W.; Langowski, J. Mapping eGFP oligomer mobility in living cell nuclei. PLoS ONE 2009, 4, e5041. [Google Scholar] [CrossRef]
- Bartok, A.; Toth, A.; Somodi, S.; Szanto, T.G.; Hajdu, P.; Panyi, G.; Varga, Z. Margatoxin is a non-selective inhibitor of human Kv1.3 K+ channels. Toxicon 2014, 87, 6–16. [Google Scholar] [CrossRef]
- Rodstrom, K.E.; Regenthal, P.; Lindkvist-Petersson, K. Structure of Staphylococcal Enterotoxin E in Complex with TCR Defines the Role of TCR Loop Positioning in Superantigen Recognition. PLoS ONE 2015, 10, e0131988. [Google Scholar] [CrossRef] [PubMed]
- Kenesei, A.; Volkó, J.; Szalóki, N.; Mocsár, G.; Jambrovics, K.; Balajthy, Z.; Bodnár, A.; Tóth, K.; Waldmann, T.A.; Vámosi, G. IL-15 Trans-Presentation Is an Autonomous, Antigen-Independent Process. J. Immunol. 2021, 207, 2489–2500. [Google Scholar] [CrossRef] [PubMed]
- Vamosi, G.; Bodnár, A.; Vereb, G.; Jenei, A.; Goldman, C.K.; Langowski, J.; Tóth, K.; Mátyus, L.; Szöllösi, J.; Waldmann, T.A.; et al. IL-2 and IL-15 receptor alpha-subunits are coexpressed in a supramolecular receptor cluster in lipid rafts of T cells. Proc. Natl. Acad. Sci. USA 2004, 101, 11082–11087. [Google Scholar] [CrossRef] [PubMed]
- Vereb, G.; Matkó, J.; Vámosi, G.; Ibrahim, S.M.; Magyar, E.; Varga, S.; Szöllosi, J.; Jenei, A.; Gáspár, R.; Waldmann, T.A.; et al. Cholesterol-Dependent clustering of IL-2Ralpha and its colocalization with HLA and CD48 on T lymphoma cells suggest their functional association with lipid rafts. Proc. Natl. Acad. Sci. USA 2000, 97, 6013–6018. [Google Scholar] [CrossRef]
- Serrano-Albarras, A.; Estadella, I.; Cirera-Rocosa, S.; Navarro-Perez, M.; Felipe, A. Kv1.3: A multifunctional channel with many pathological implications. Expert Opin. Ther. Targets 2018, 22, 101–105. [Google Scholar] [CrossRef]
- Perez-Garcia, M.T.; Cidad, P.; Lopez-Lopez, J.R. The secret life of ion channels: Kv1.3 potassium channels and proliferation. Am. J. Physiol. Cell. Physiol. 2018, 314, C27–C42. [Google Scholar] [CrossRef]
- Mocsár, G.; Volkó, J.; Rönnlund, D.; Widengren, J.; Nagy, P.; Szöllősi, J.; Tóth, K.; Goldman, C.K.; Damjanovich, S.; Waldmann, T.A.; et al. MHC I Expression Regulates Co-clustering and Mobility of Interleukin-2 and -15 Receptors in T Cells. Biophys. J. 2016, 111, 100–112. [Google Scholar] [CrossRef]
- Yang, M.; Brackenbury, W.J. Membrane potential and cancer progression. Front. Physiol. 2013, 4, 185. [Google Scholar] [CrossRef]
- Levite, M.; Cahalon, L.; Peretz, A.; Hershkoviz, R.; Sobko, A.; Ariel, A.; Desai, R.; Attali, B.; Lider, O. Extracellular K(+) and opening of voltage-gated potassium channels activate T cell integrin function: Physical and functional association between Kv1.3 channels and beta1 integrins. J. Exp. Med. 2000, 191, 1167–1176. [Google Scholar] [CrossRef]
- Cidad, P.; Jimenez-Perez, L.; Garcia-Arribas, D.; Miguel-Velado, E.; Tajada, S.; Ruiz-McDavitt, C.; Lopez-Lopez, J.R.; Perez-Garcia, M.T. Kv1.3 channels can modulate cell proliferation during phenotypic switch by an ion-flux independent mechanism. Arterioscler. Thromb Vasc. Biol. 2012, 32, 1299–1307. [Google Scholar] [CrossRef]
- Baker, J.A.; Wong, W.C.; Eisenhaber, B.; Warwicker, J.; Eisenhaber, F. Charged residues next to transmembrane regions revisited: “Positive-inside rule” is complemented by the “negative inside depletion/outside enrichment rule”. BMC Biol. 2017, 15, 66. [Google Scholar] [CrossRef] [PubMed]
- Boyd, D.; Beckwith, J. The role of charged amino acids in the localization of secreted and membrane proteins. Cell 1990, 62, 1031–1033. [Google Scholar] [CrossRef]
- Hartzell, C.A.; Jankowska, K.I.; Burkhardt, J.K.; Lewis, R.S. Calcium influx through CRAC channels controls actin organization and dynamics at the immune synapse. eLife 2016, 5, e14850. [Google Scholar] [CrossRef] [PubMed]
- Gaus, K.; Chklovskaia, E.; Fazekas de St Groth, B.; Jessup, W.; Harder, T. Condensation of the plasma membrane at the site of T lymphocyte activation. J. Cell Biol. 2005, 171, 121–131. [Google Scholar] [CrossRef]
- Tóth, Á.; Szilagyi, O.; Krasznai, Z.; Panyi, G.; Hajdu, P. Functional consequences of Kv1.3 ion channel rearrangement into the immunological synapse. Immunol. Lett. 2009, 125, 15–21. [Google Scholar] [CrossRef]
- Barnstable, C.J.; Bodmer, W.F.; Brown, G.; Galfre, G.; Milstein, C.; Williams, A.F.; Ziegler, A. Production of monoclonal antibodies to group A erythrocytes, HLA and other human cell surface antigens-new tools for genetic analysis. Cell 1978, 14, 9–20. [Google Scholar] [CrossRef]
- Mocsar, G.; Kreith, B.; Buchholz, J.; Krieger, J.W.; Langowski, J.; Vamosi, G. Note: Multiplexed multiple-tau auto- and cross-correlators on a single field programmable gate array. Rev. Sci. Instrum. 2012, 83, 046101. [Google Scholar] [CrossRef]
- Krieger, J.W.; Singh, A.P.; Bag, N.; Garbe, C.S.; Saunders, T.E.; Langowski, J.; Wohland, T. Imaging fluorescence (cross-) correlation spectroscopy in live cells and organisms. Nat. Protoc. 2015, 10, 1948–1974. [Google Scholar] [CrossRef]
- Krieger, J.; Langowski, J. QuickFit 3.0 (Status: Beta, Compiled: 2015-03-18, SVN: 3891): A Data Evaluation Application for Biophysics. 2015. Available online: http://www.dkfz.de/Macromol/quickfit/ (accessed on 1 August 2020).
- Haupts, U.; Maiti, S.; Schwille, P.; Webb, W.W. Dynamics of fluorescence fluctuations in green fluorescent protein observed by fluorescence correlation spectroscopy. Proc. Natl. Acad. Sci. USA 1998, 95, 13573–13578. [Google Scholar] [CrossRef]
- Widengren, J.; Rigler, R.; Mets, U. Triplet-State monitoring by fluorescence correlation spectroscopy. J. Fluoresc. 1994, 4, 255–258. [Google Scholar] [CrossRef]
- Widengren, J.; Mets, Ü.; Rigler, R. Fluorescence correlation spectroscopy of triplet state in solution: A theoretical and experimental study. J. Phys. Chem. 1995, 99, 13368–13379. [Google Scholar] [CrossRef]
- Vamosi, G.; Friedlander-Brock, E.; Ibrahim, S.M.; Brock, R.; Szollosi, J.; Vereb, G. EGF Receptor Stalls upon Activation as Evidenced by Complementary Fluorescence Correlation Spectroscopy and Fluorescence Recovery after Photobleaching Measurements. Int. J. Mol. Sci. 2019, 20, 3370. [Google Scholar] [CrossRef] [PubMed]
- Petrasek, Z.; Schwille, P. Precise measurement of diffusion coefficients using scanning fluorescence correlation spectroscopy. Biophys. J. 2008, 94, 1437–1448. [Google Scholar] [CrossRef] [PubMed]


| Diffusion Coefficient (µm2/s) | ||||||||||
|---|---|---|---|---|---|---|---|---|---|---|
| WT | Non-Conducting | ΔC | ||||||||
| IS in | IS out | Standalone | IS in | IS out | Standalone | IS in | IS out | Standalone | ||
| Kv1.3 | standard solution | 0.15 ± 0.069 (115) | 0.2 ± 0.11 (98) | 0.086 ± 0.061 (89) | 0.13 ± 0.062 (96) | 0.19 ± 0.079 (91) | 0.056 ± 0.037 (68) | 0.17 ± 0.095 (101) | 0.16 ± 0.073 (91) | 0.25 ± 0.11 (65) |
| high K+ solution | 0.09 ± 0.05 (45) | 0.1 ± 0.055 (42) | 0.048 ± 0.022 (35) | 0.12 ± 0.062 (35) | 0.17 ± 0.06 (35) | 0.057 ± 0.037 (25) | 0.12 ± 0.04 (34) | 0.1 ± 0.03 (32) | 0.143 ± 0.063 (23) | |
| standard solution | 0.15 ± 0.01 (10) | 0.18 ± 0.09 (13) | 0.07 ± 0.02 (20) | 0.149 ± 0.1 (9) | 0.187 ± 0.09 (13) | 0.04 ± 0.028 (7) | 0.12 ± 0.045 (12) | 0.136 ± 0.016 (7) | 0.21 ± 0.066 (7) | |
| MgTx | 0.06 ± 0.03 (13) | 0.09 ± 0.055 (11) | 0.053 ± 0.021 (15) | 0.11 ± 0.08 (12) | 0.15 ± 0.06 (9) | 0.05 ± 0.012 (8) | 0.099 ± 0.03 (14) | 0.097 ± 0.03 (7) | 0.11 ± 0.04 (8) | |
| in D10 cells * | 0.021 ± 0.007 (15) | 0.070 ± 0.007 (15) | ||||||||
| MHC I | standard solution | 0.34 ± 0.23 (27) | 0.18 ± 0.13 (25) | 0.44 ± 0.31 (24) | ||||||
| DiIC18 | standard solution | 0.54 ± 0.38 (19) | 0.68 ± 0.29 (25) | 0.72 ± 0.28 (28) | ||||||
| IL-2Rα | standard solution | 0.18 ± 0.09 (30) | 0.25 ± 0.137 (30) | 0.32 ± 0.087 (9) | ||||||
Publisher’s Note: MDPI stays neutral with regard to jurisdictional claims in published maps and institutional affiliations. |
© 2022 by the authors. Licensee MDPI, Basel, Switzerland. This article is an open access article distributed under the terms and conditions of the Creative Commons Attribution (CC BY) license (https://creativecommons.org/licenses/by/4.0/).
Share and Cite
Sebestyén, V.; Nagy, É.; Mocsár, G.; Volkó, J.; Szilágyi, O.; Kenesei, Á.; Panyi, G.; Tóth, K.; Hajdu, P.; Vámosi, G. Role of C-Terminal Domain and Membrane Potential in the Mobility of Kv1.3 Channels in Immune Synapse Forming T Cells. Int. J. Mol. Sci. 2022, 23, 3313. https://doi.org/10.3390/ijms23063313
Sebestyén V, Nagy É, Mocsár G, Volkó J, Szilágyi O, Kenesei Á, Panyi G, Tóth K, Hajdu P, Vámosi G. Role of C-Terminal Domain and Membrane Potential in the Mobility of Kv1.3 Channels in Immune Synapse Forming T Cells. International Journal of Molecular Sciences. 2022; 23(6):3313. https://doi.org/10.3390/ijms23063313
Chicago/Turabian StyleSebestyén, Veronika, Éva Nagy, Gábor Mocsár, Julianna Volkó, Orsolya Szilágyi, Ádám Kenesei, György Panyi, Katalin Tóth, Péter Hajdu, and György Vámosi. 2022. "Role of C-Terminal Domain and Membrane Potential in the Mobility of Kv1.3 Channels in Immune Synapse Forming T Cells" International Journal of Molecular Sciences 23, no. 6: 3313. https://doi.org/10.3390/ijms23063313
APA StyleSebestyén, V., Nagy, É., Mocsár, G., Volkó, J., Szilágyi, O., Kenesei, Á., Panyi, G., Tóth, K., Hajdu, P., & Vámosi, G. (2022). Role of C-Terminal Domain and Membrane Potential in the Mobility of Kv1.3 Channels in Immune Synapse Forming T Cells. International Journal of Molecular Sciences, 23(6), 3313. https://doi.org/10.3390/ijms23063313