
Antitumor Activity against A549 Cancer Cells of Three Novel Complexes Supported by Coating with Silver Nanoparticles

 ,
, 
 , , ,
, , ,
Abstract
:1. Introduction
2. Results and Discussion
2.1. Synthesis
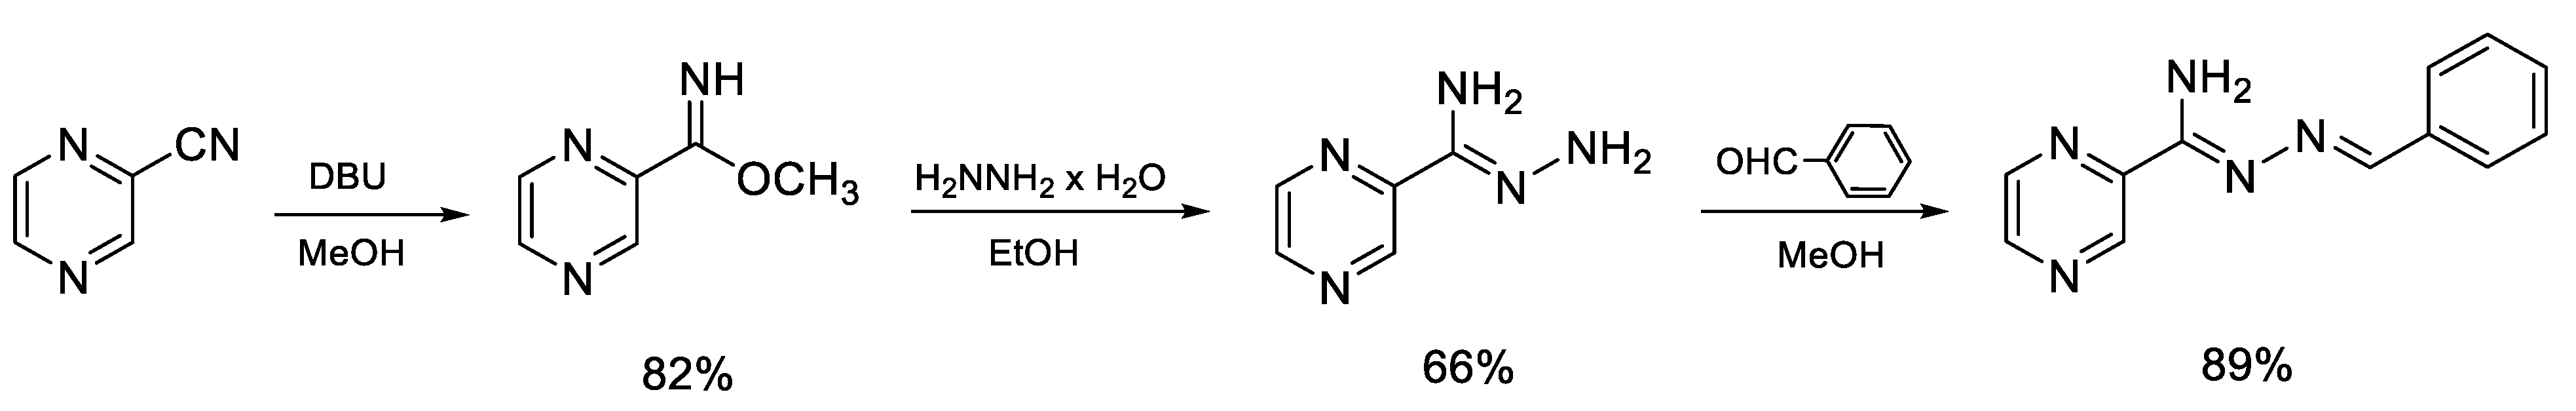
2.1.1. Synthesis of the Compound L
Synthesis of Methyl Pyrazine-2-carbimidate
Synthesis of Pyrazine-2-carbohydrazonamide
Synthesis of N′-Benzylidenepyrazine-2-carbohydrazonamide
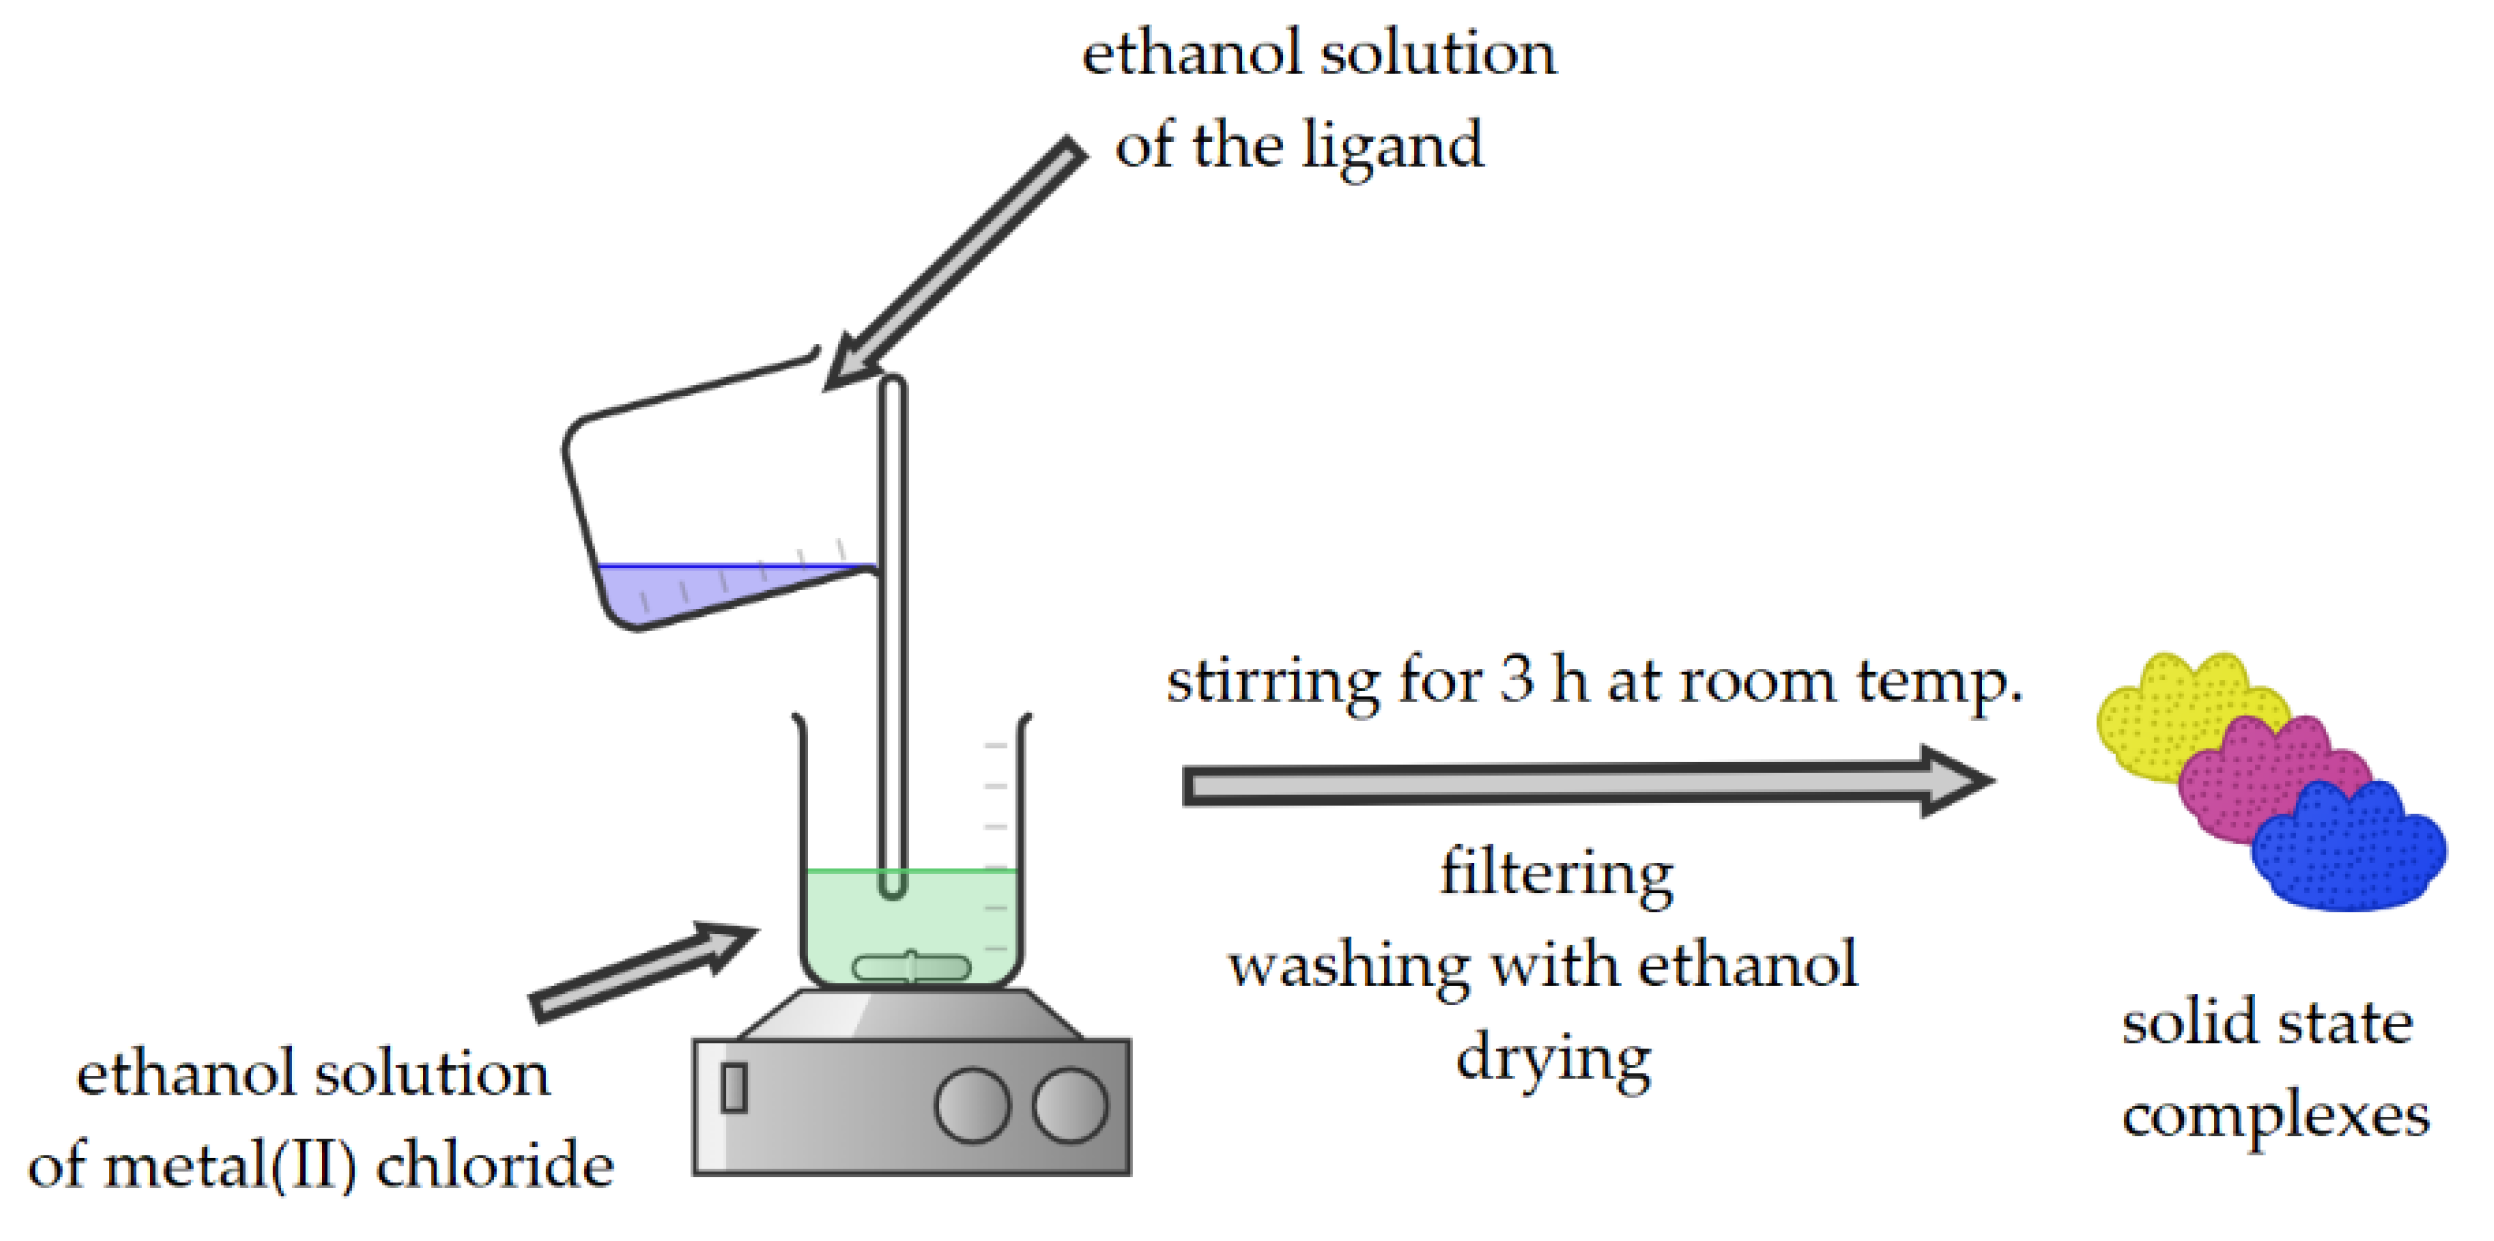
2.1.2. Synthesis of Coordination Compounds
- Cu(L)Cl2→(C12H11N5CuCl2) (359.70 g/mol) (yield: 75.2%), anal. calc. (%): Cu, 17.66; C, 40.07; H, 3.09; N, 19.47. found (%): Cu, 18.16; C, 40.01; H, 3.29; N, 19.39.
- Zn(L)Cl2→(C12H11N5ZnCl2) (361.56 g/mol) (yield: 72.8%), anal. calc. (%): Zn, 18.09; C, 39.86; H, 3.07; N, 19.37. found (%): Zn, 18.80; C, 39.98; H, 3.18; N, 19.45.
- Cd(L)Cl2→(C12H11N5CdCl2) (408.57 g/mol) (yield: 99.1%), anal. calc. (%): Cd, 27.51; C, 35.27; H, 2.72; N, 17.15. found (%): Cd, 26.80; C, 35.04; H, 3.00; N, 17.00.
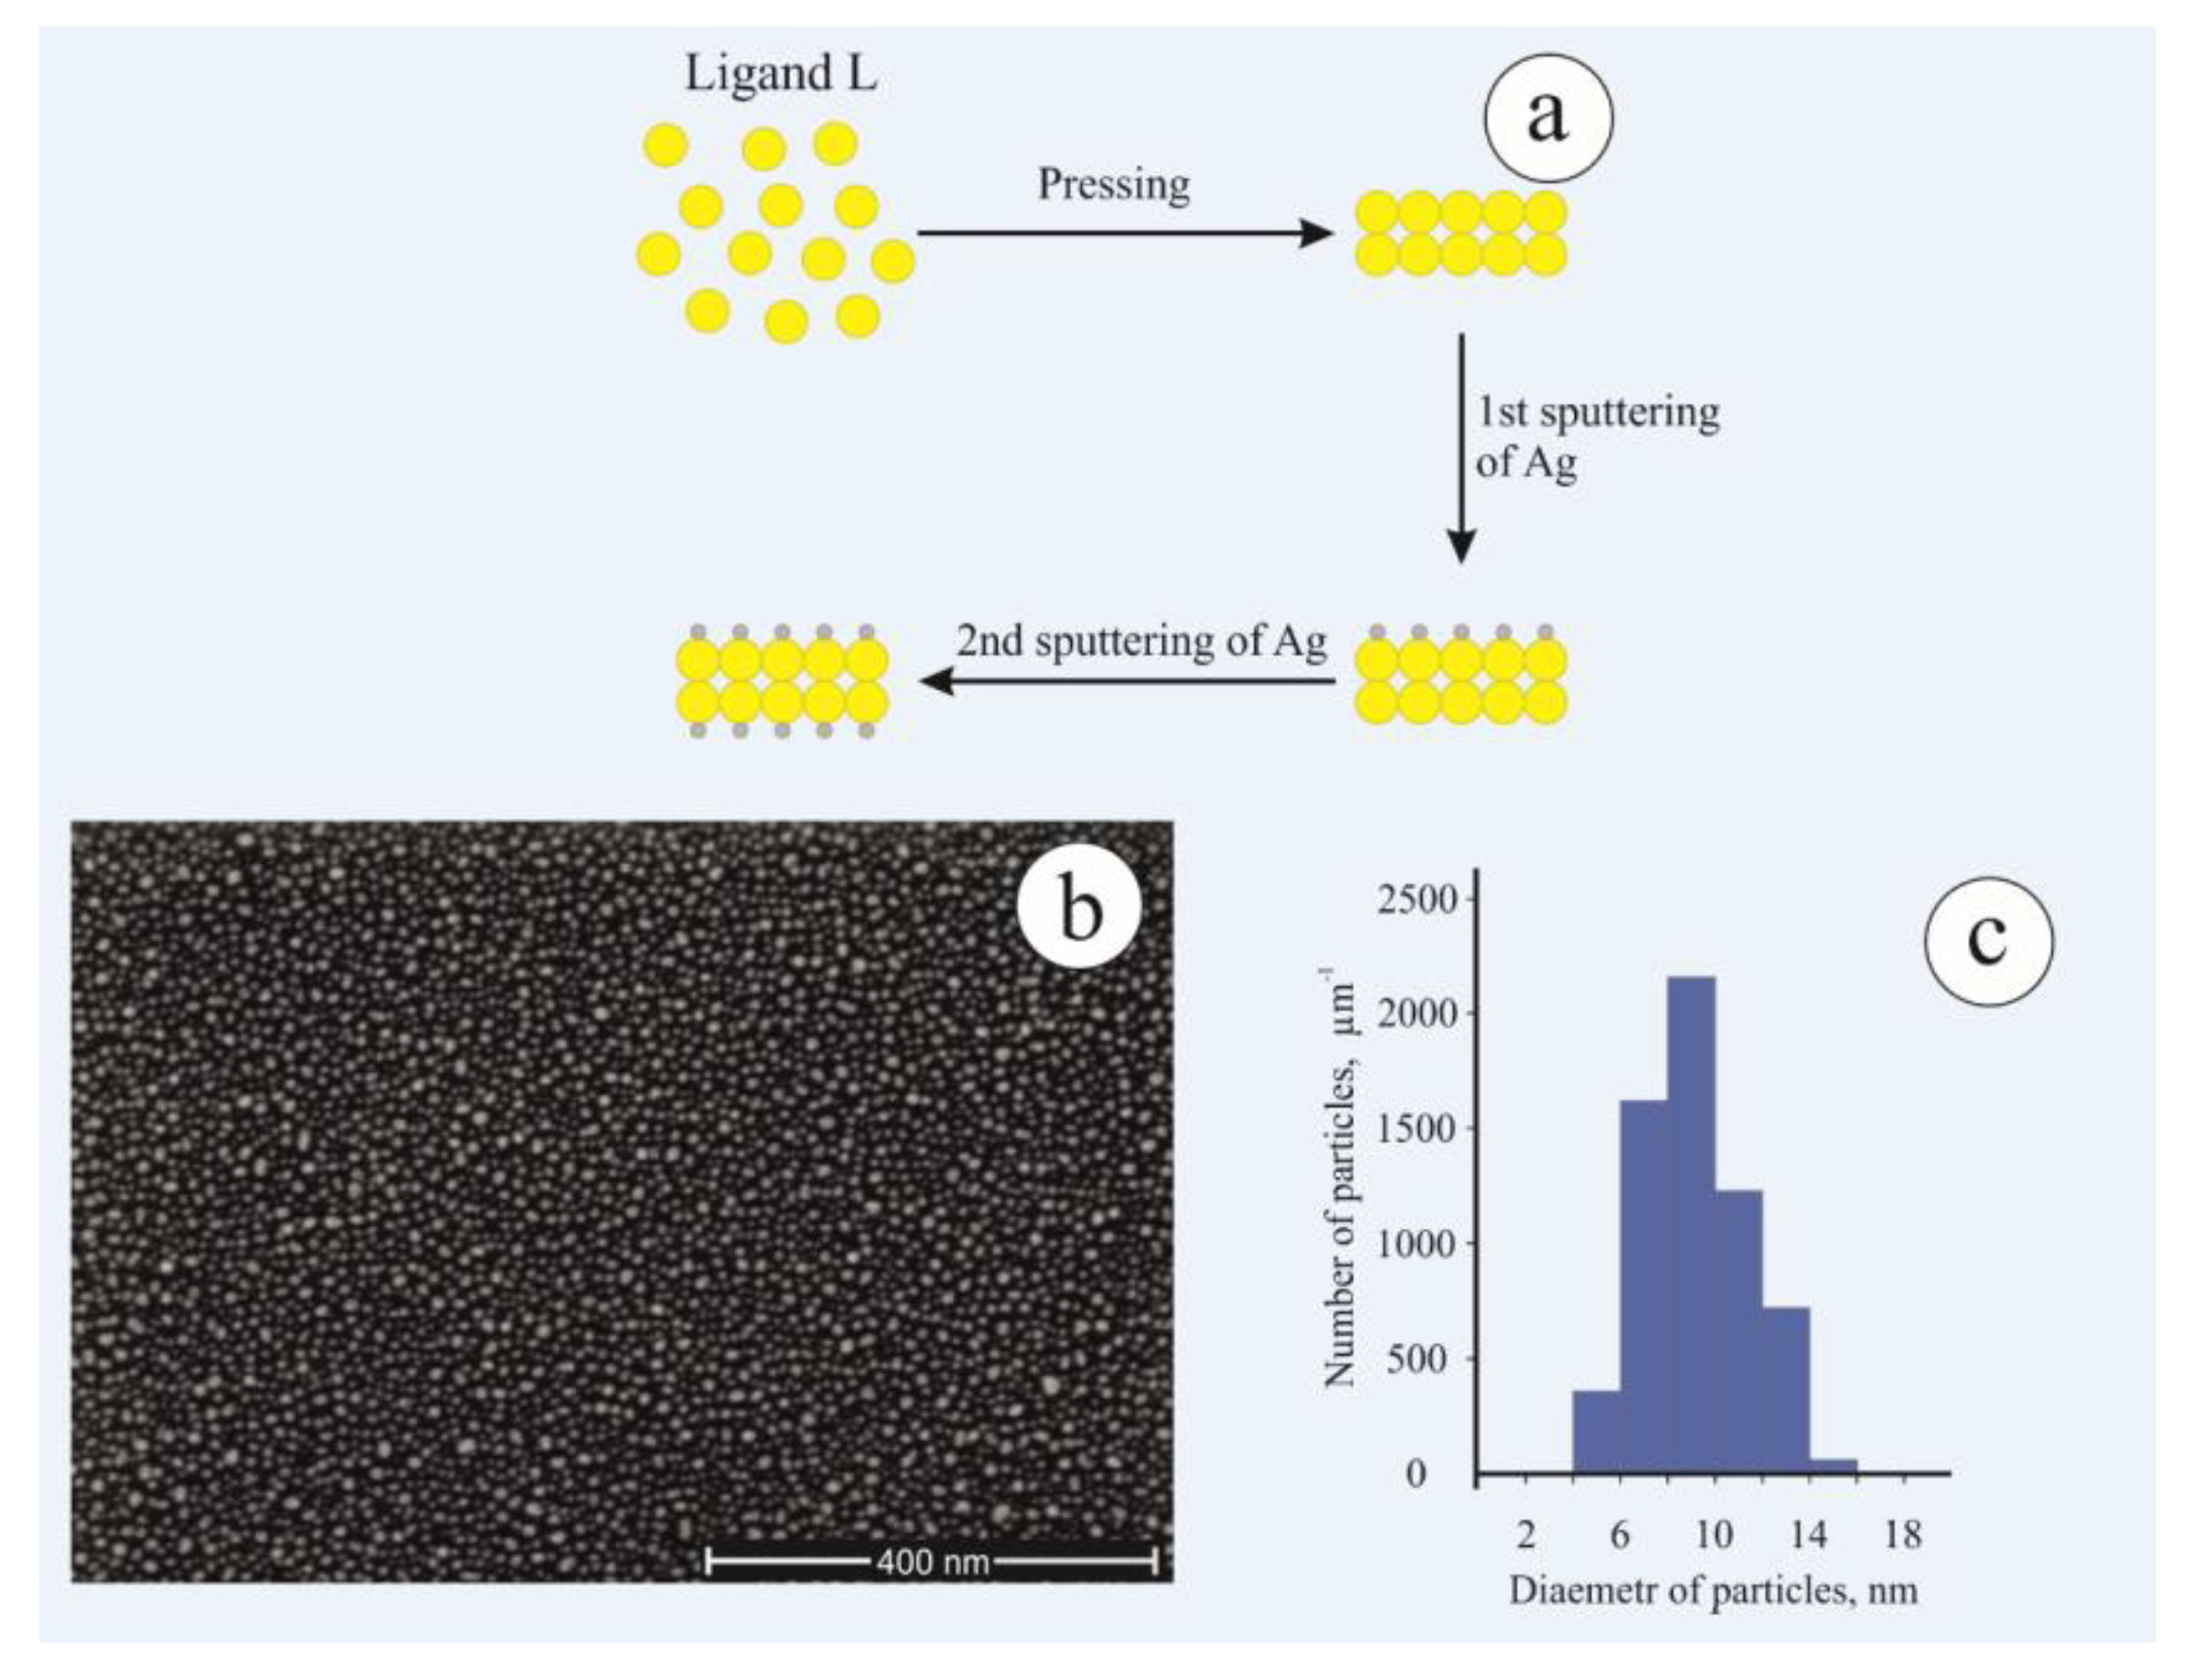
2.1.3. Formation of Silver Nanoparticles
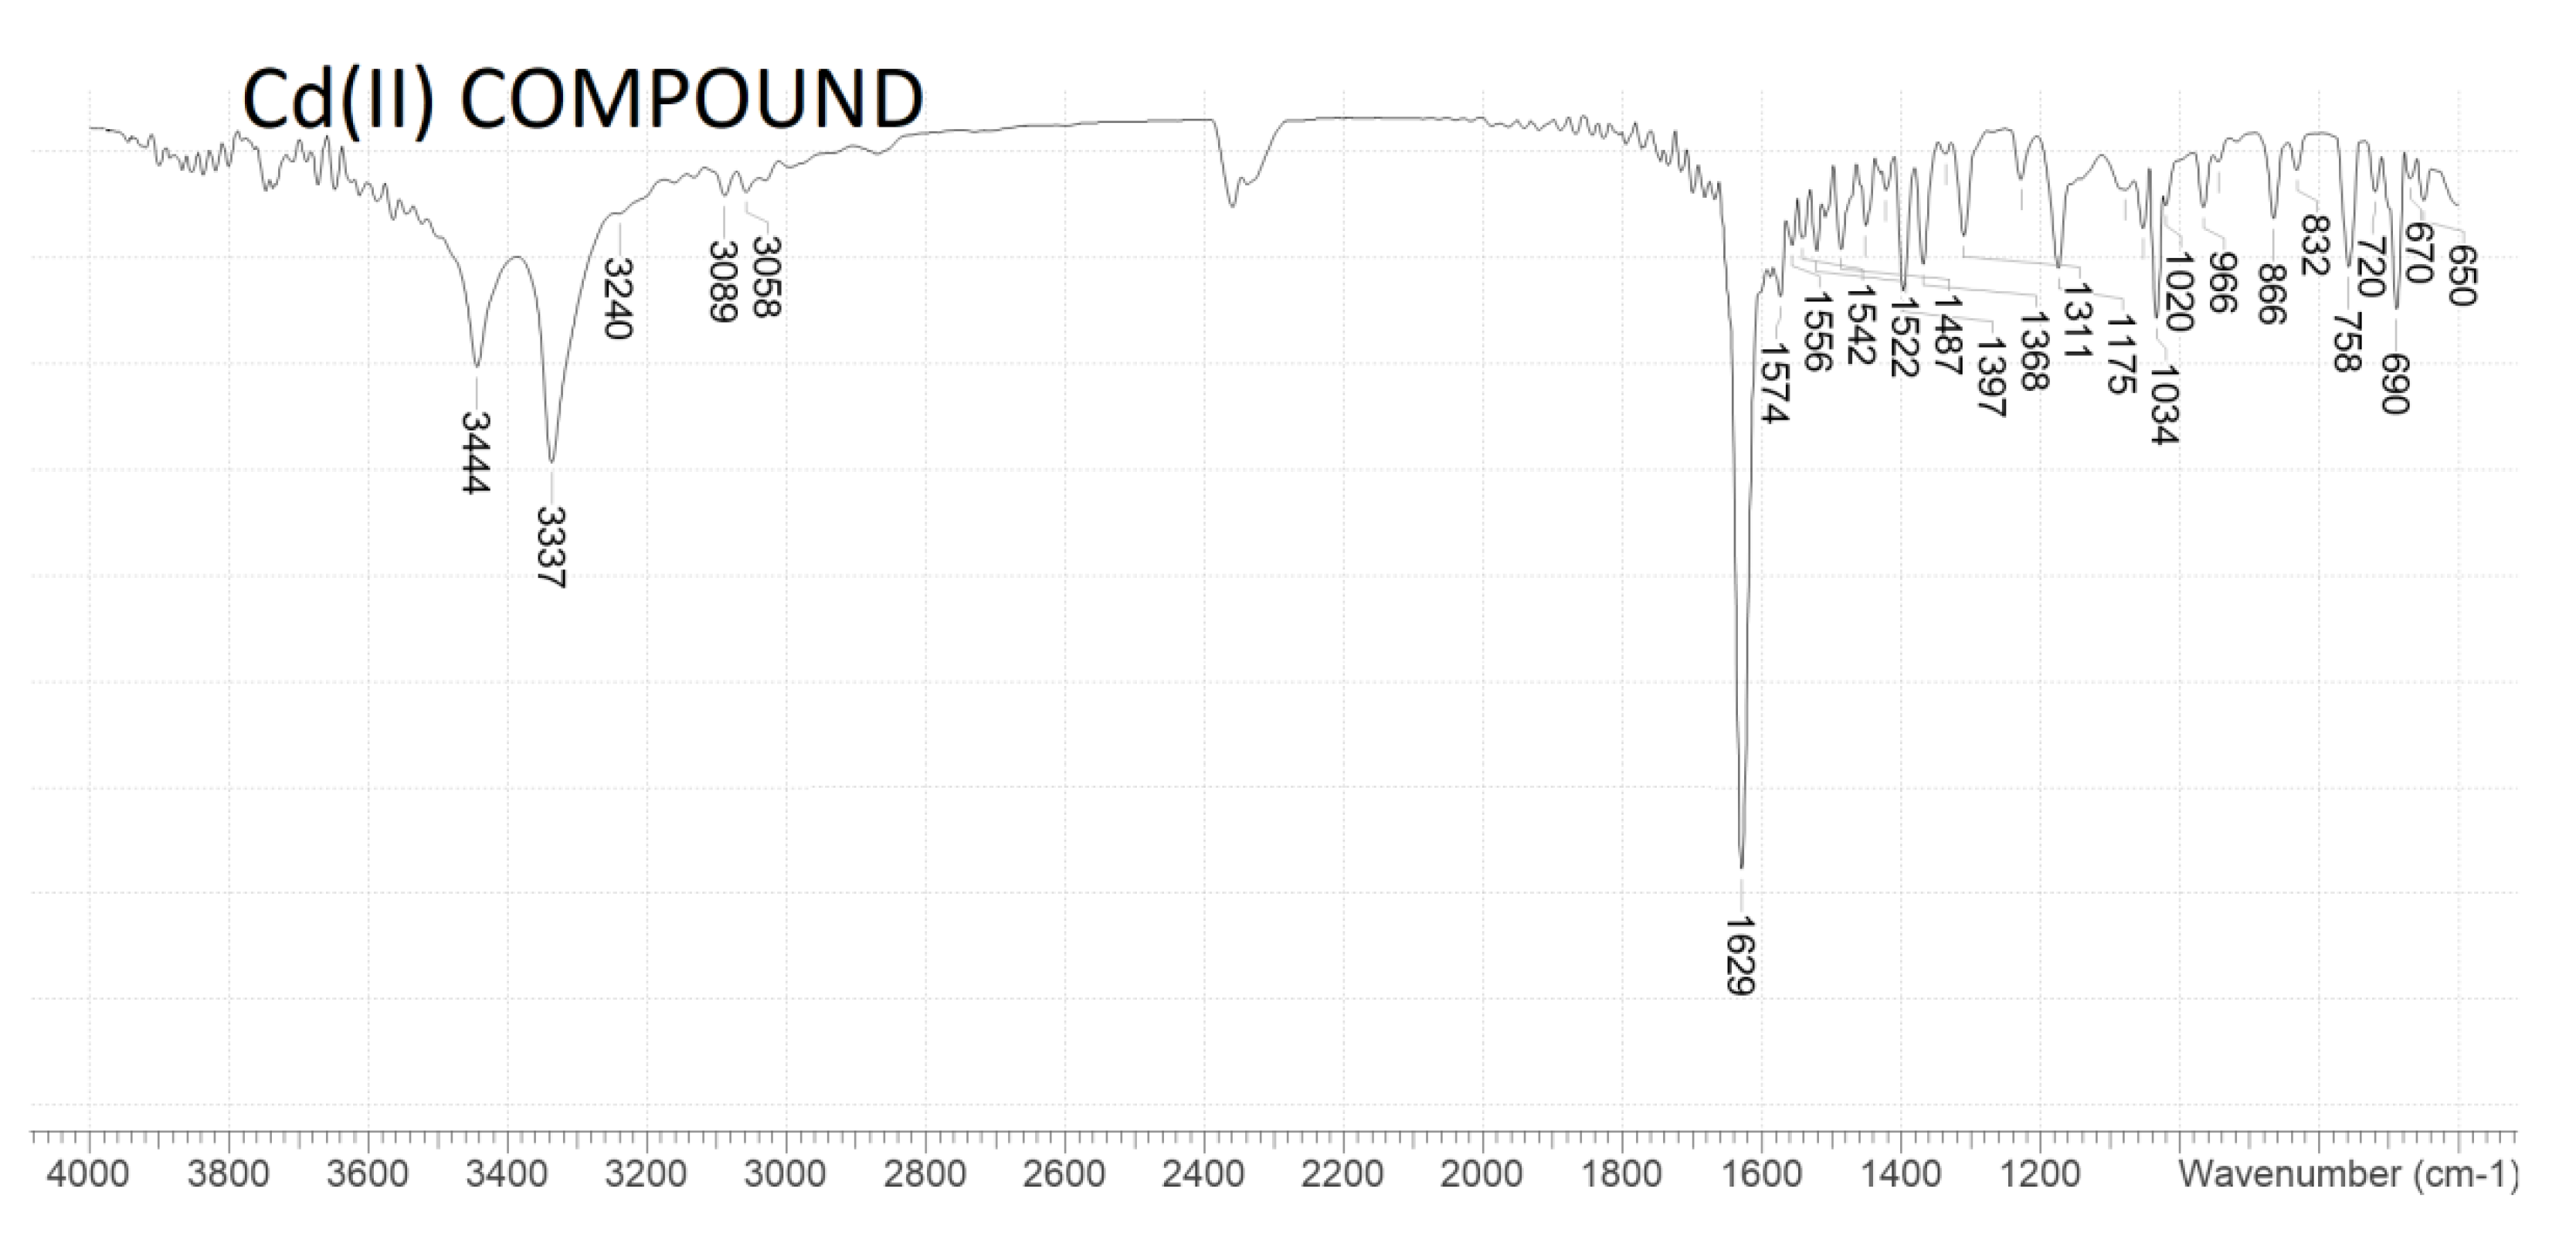
2.2. FTIR Spectra
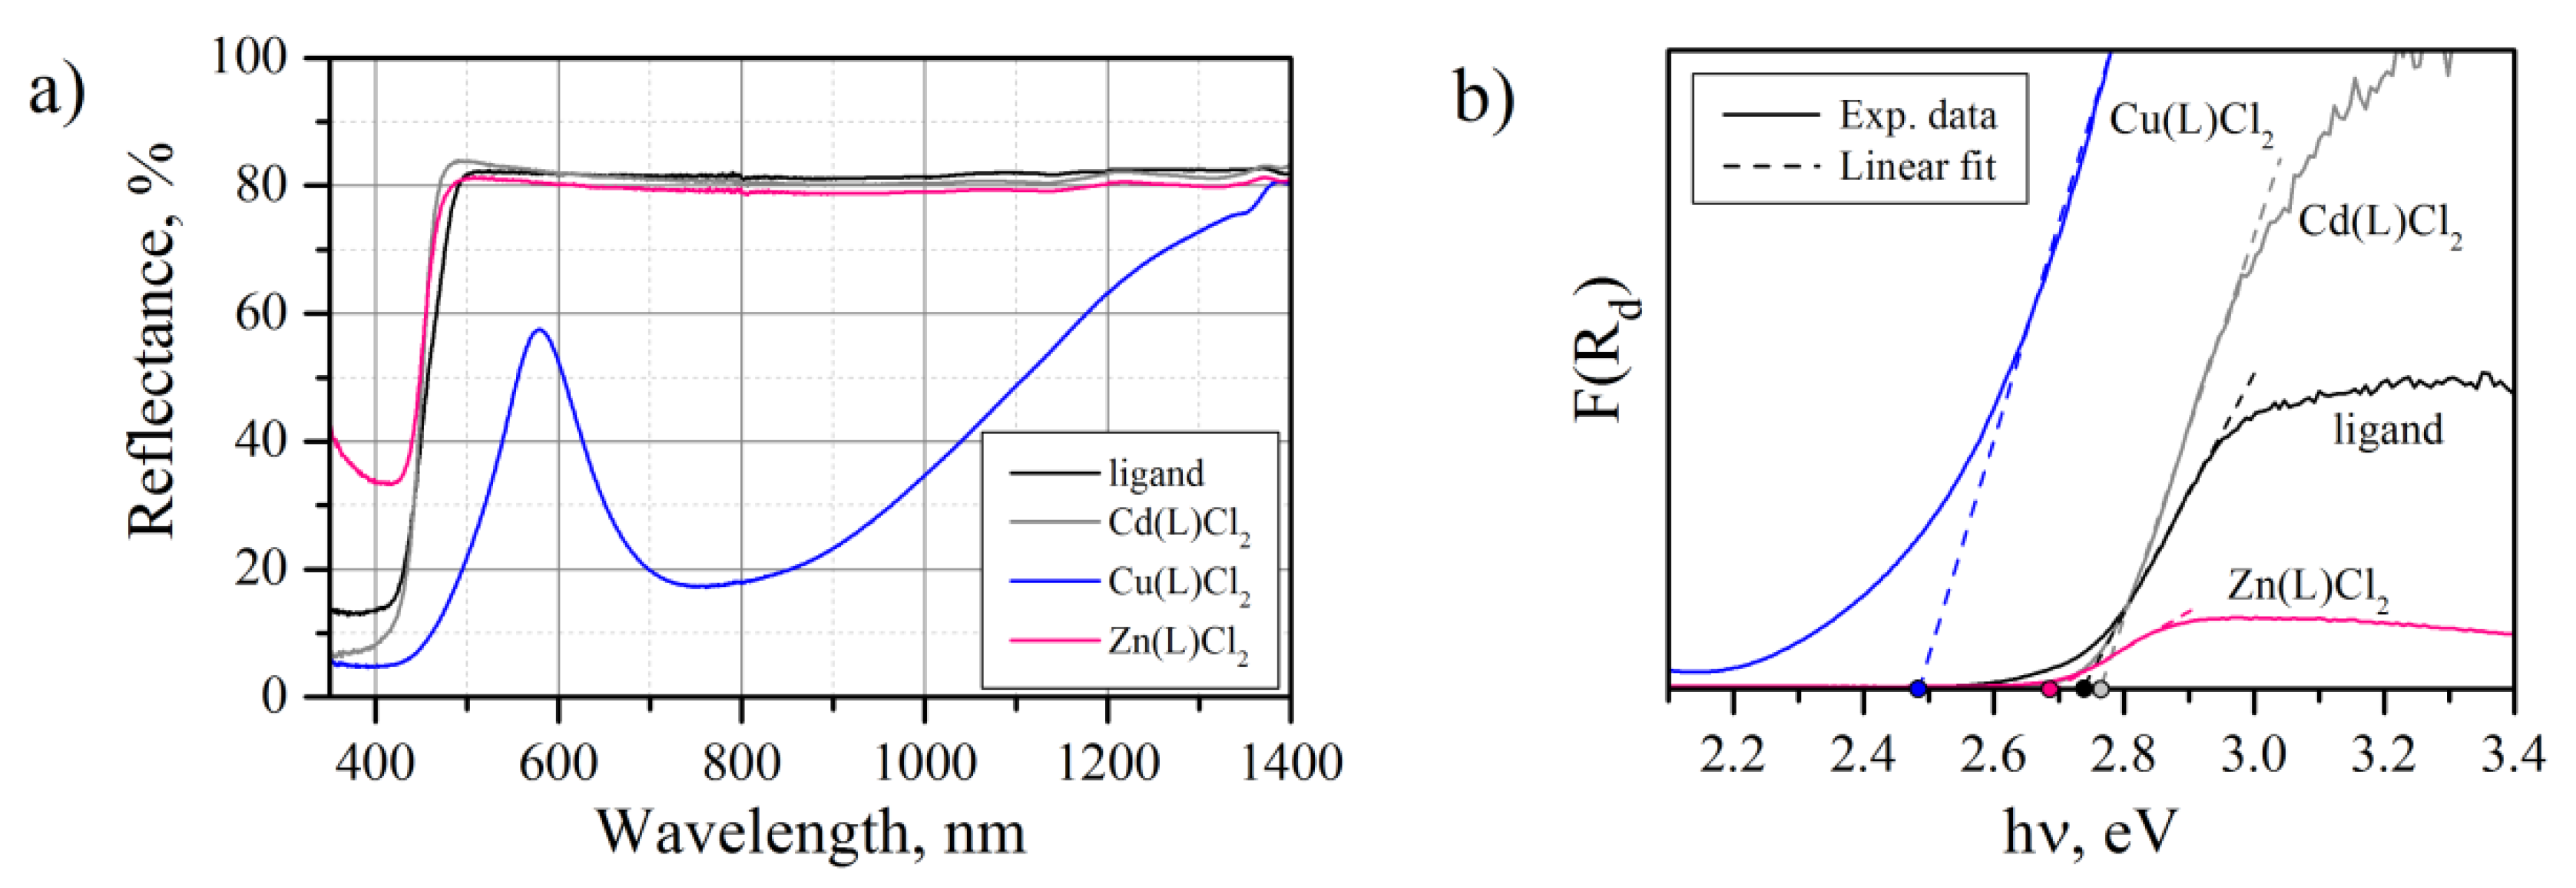
2.3. UV–VIS–NIR
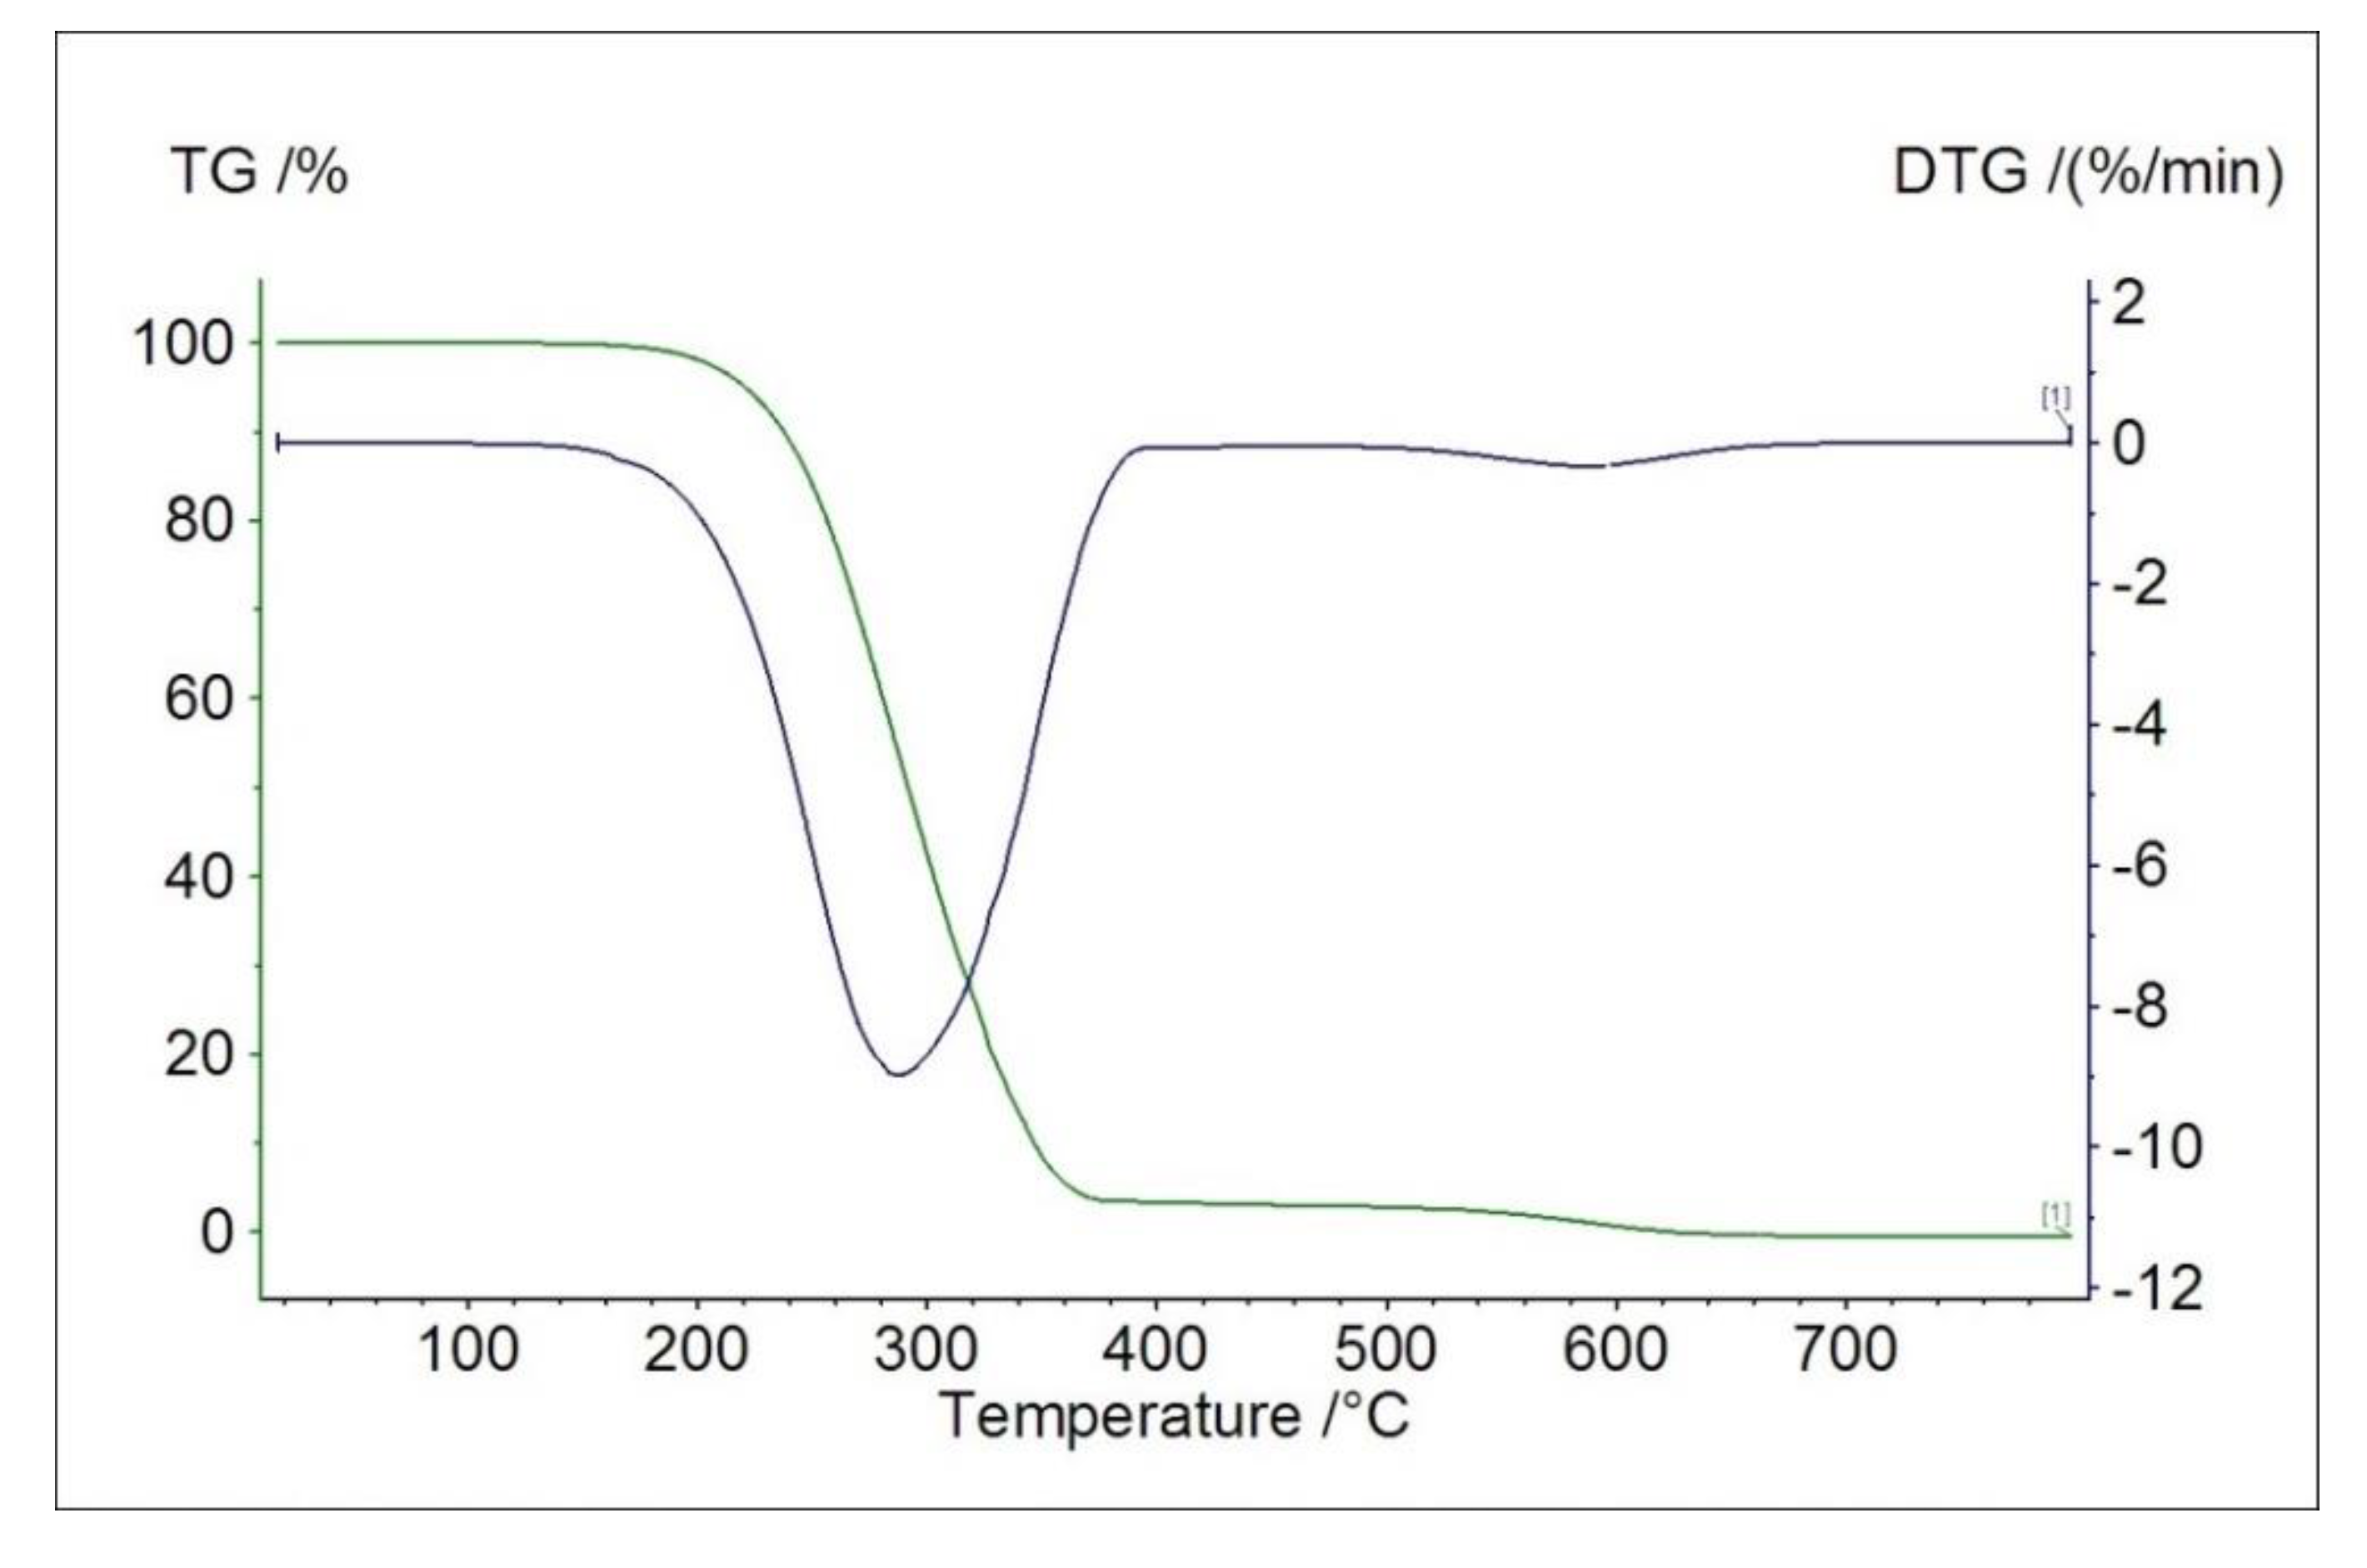
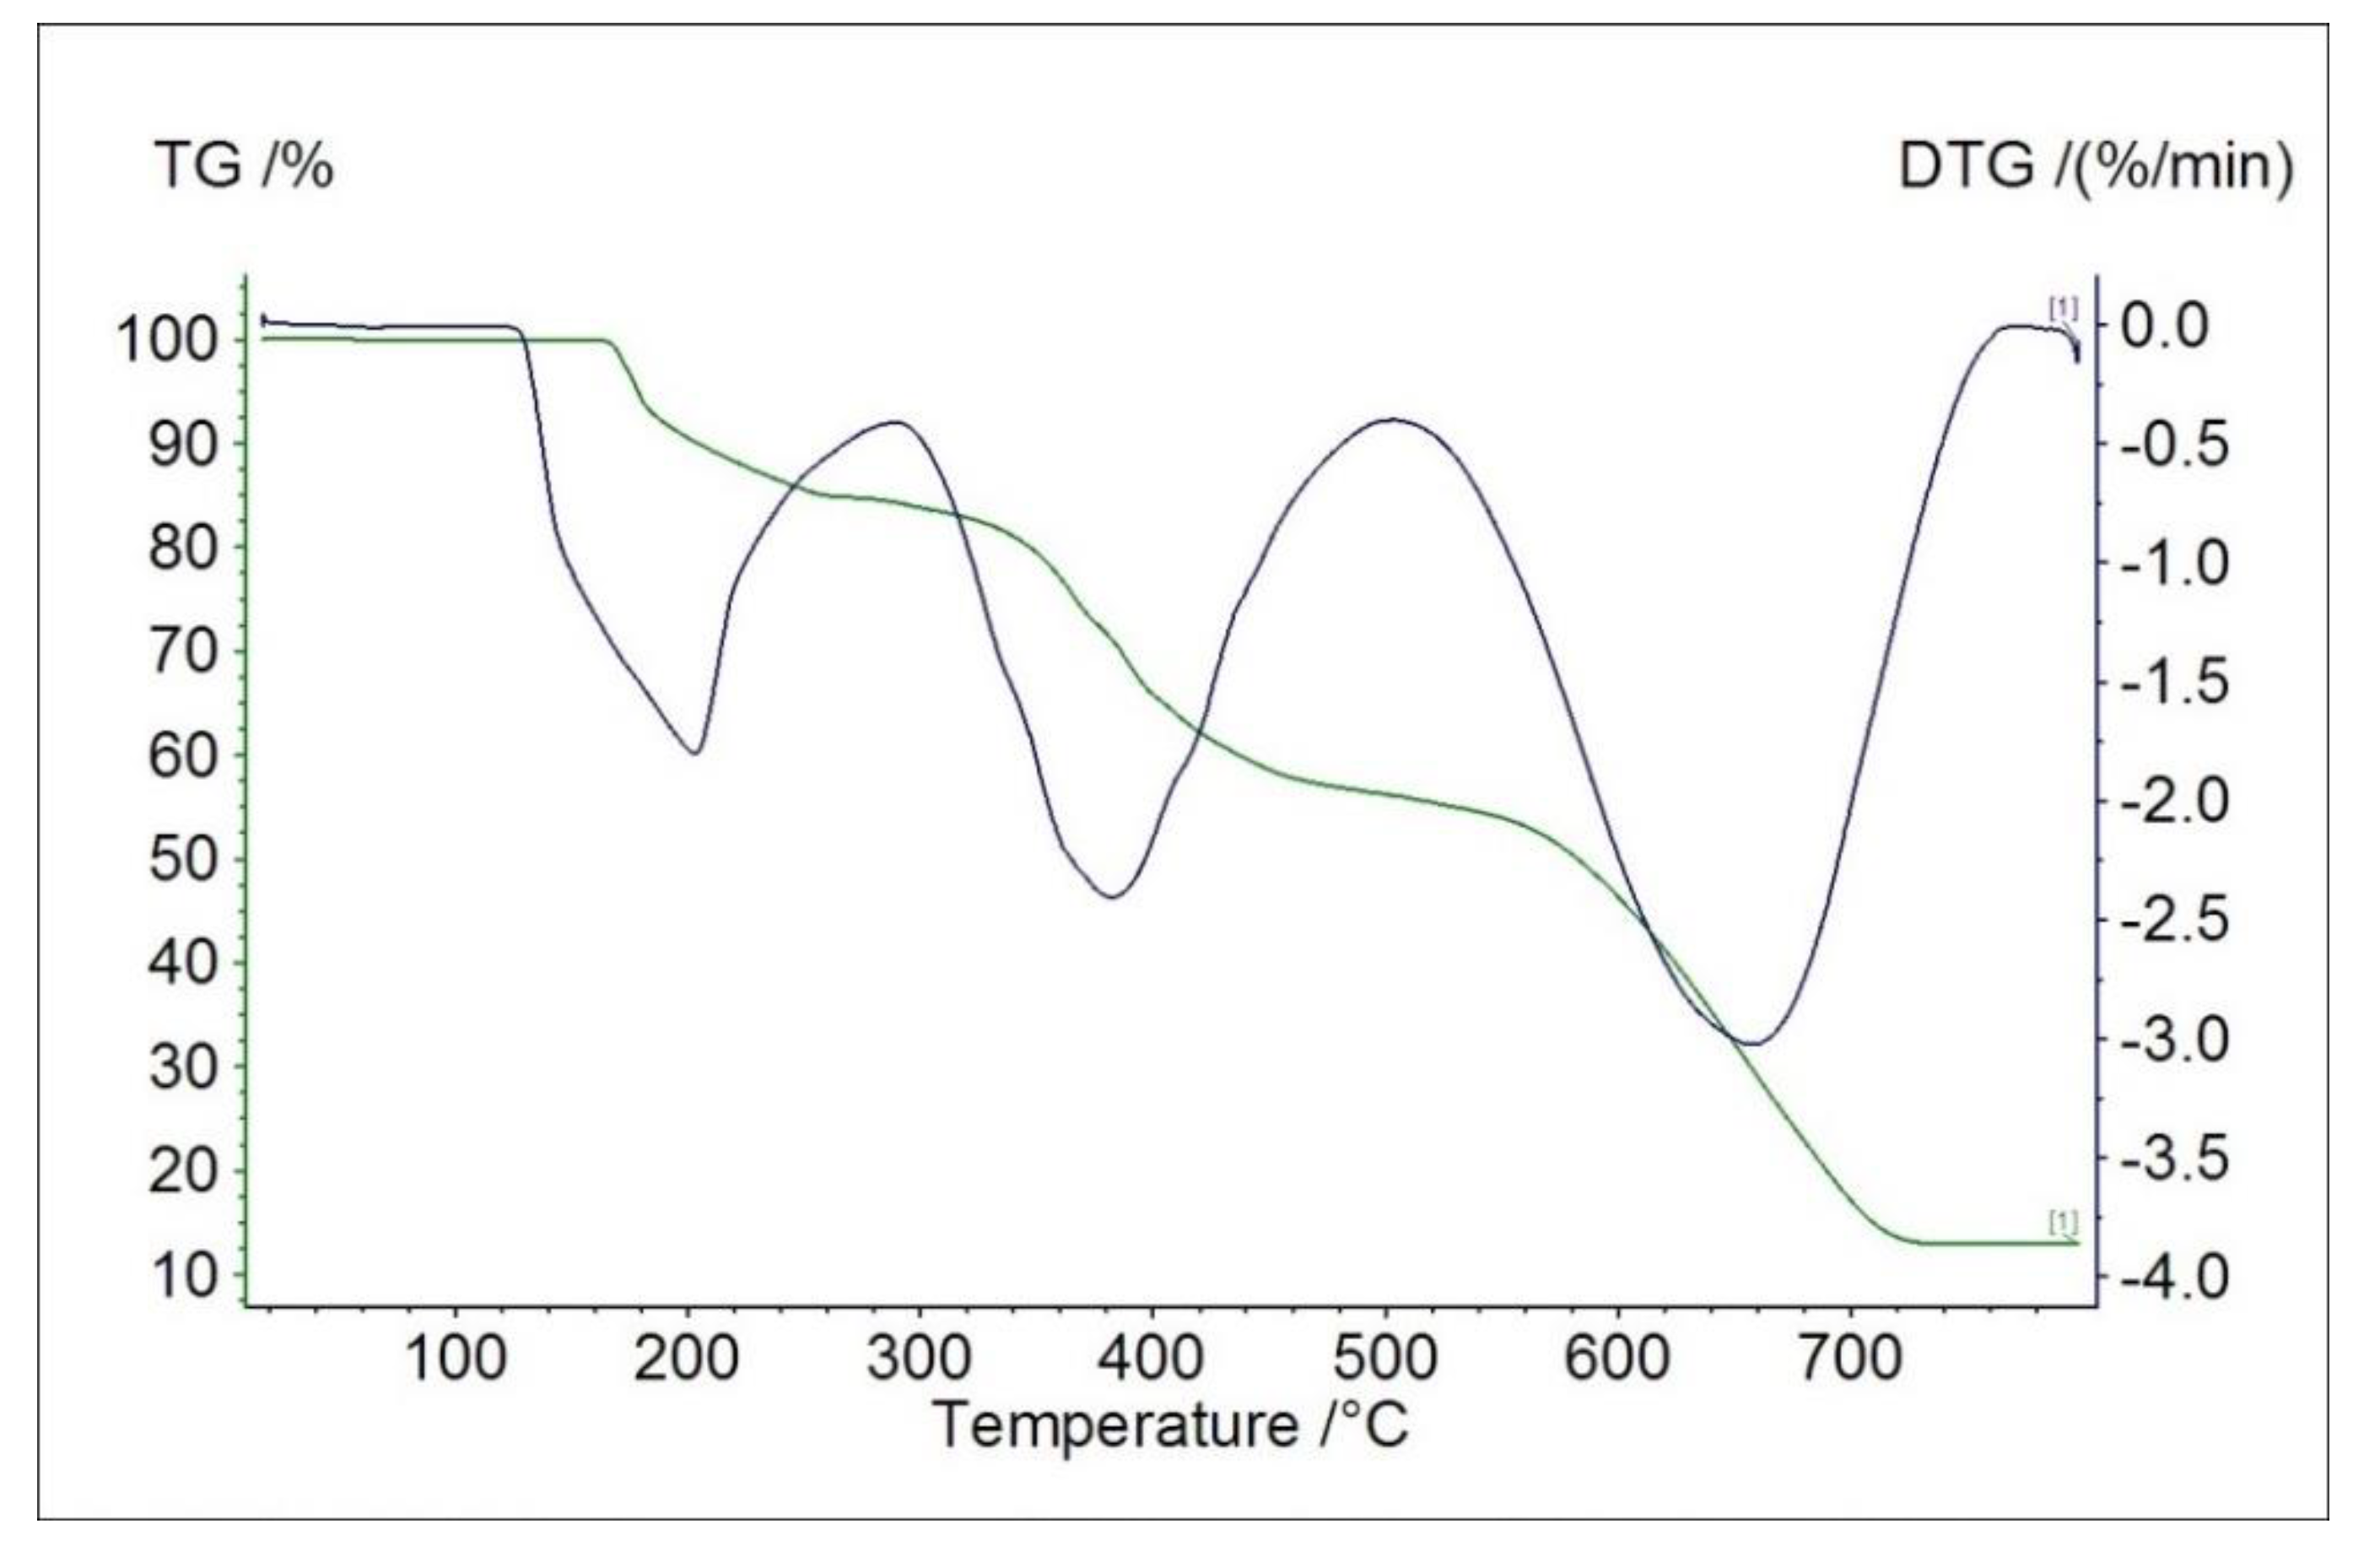
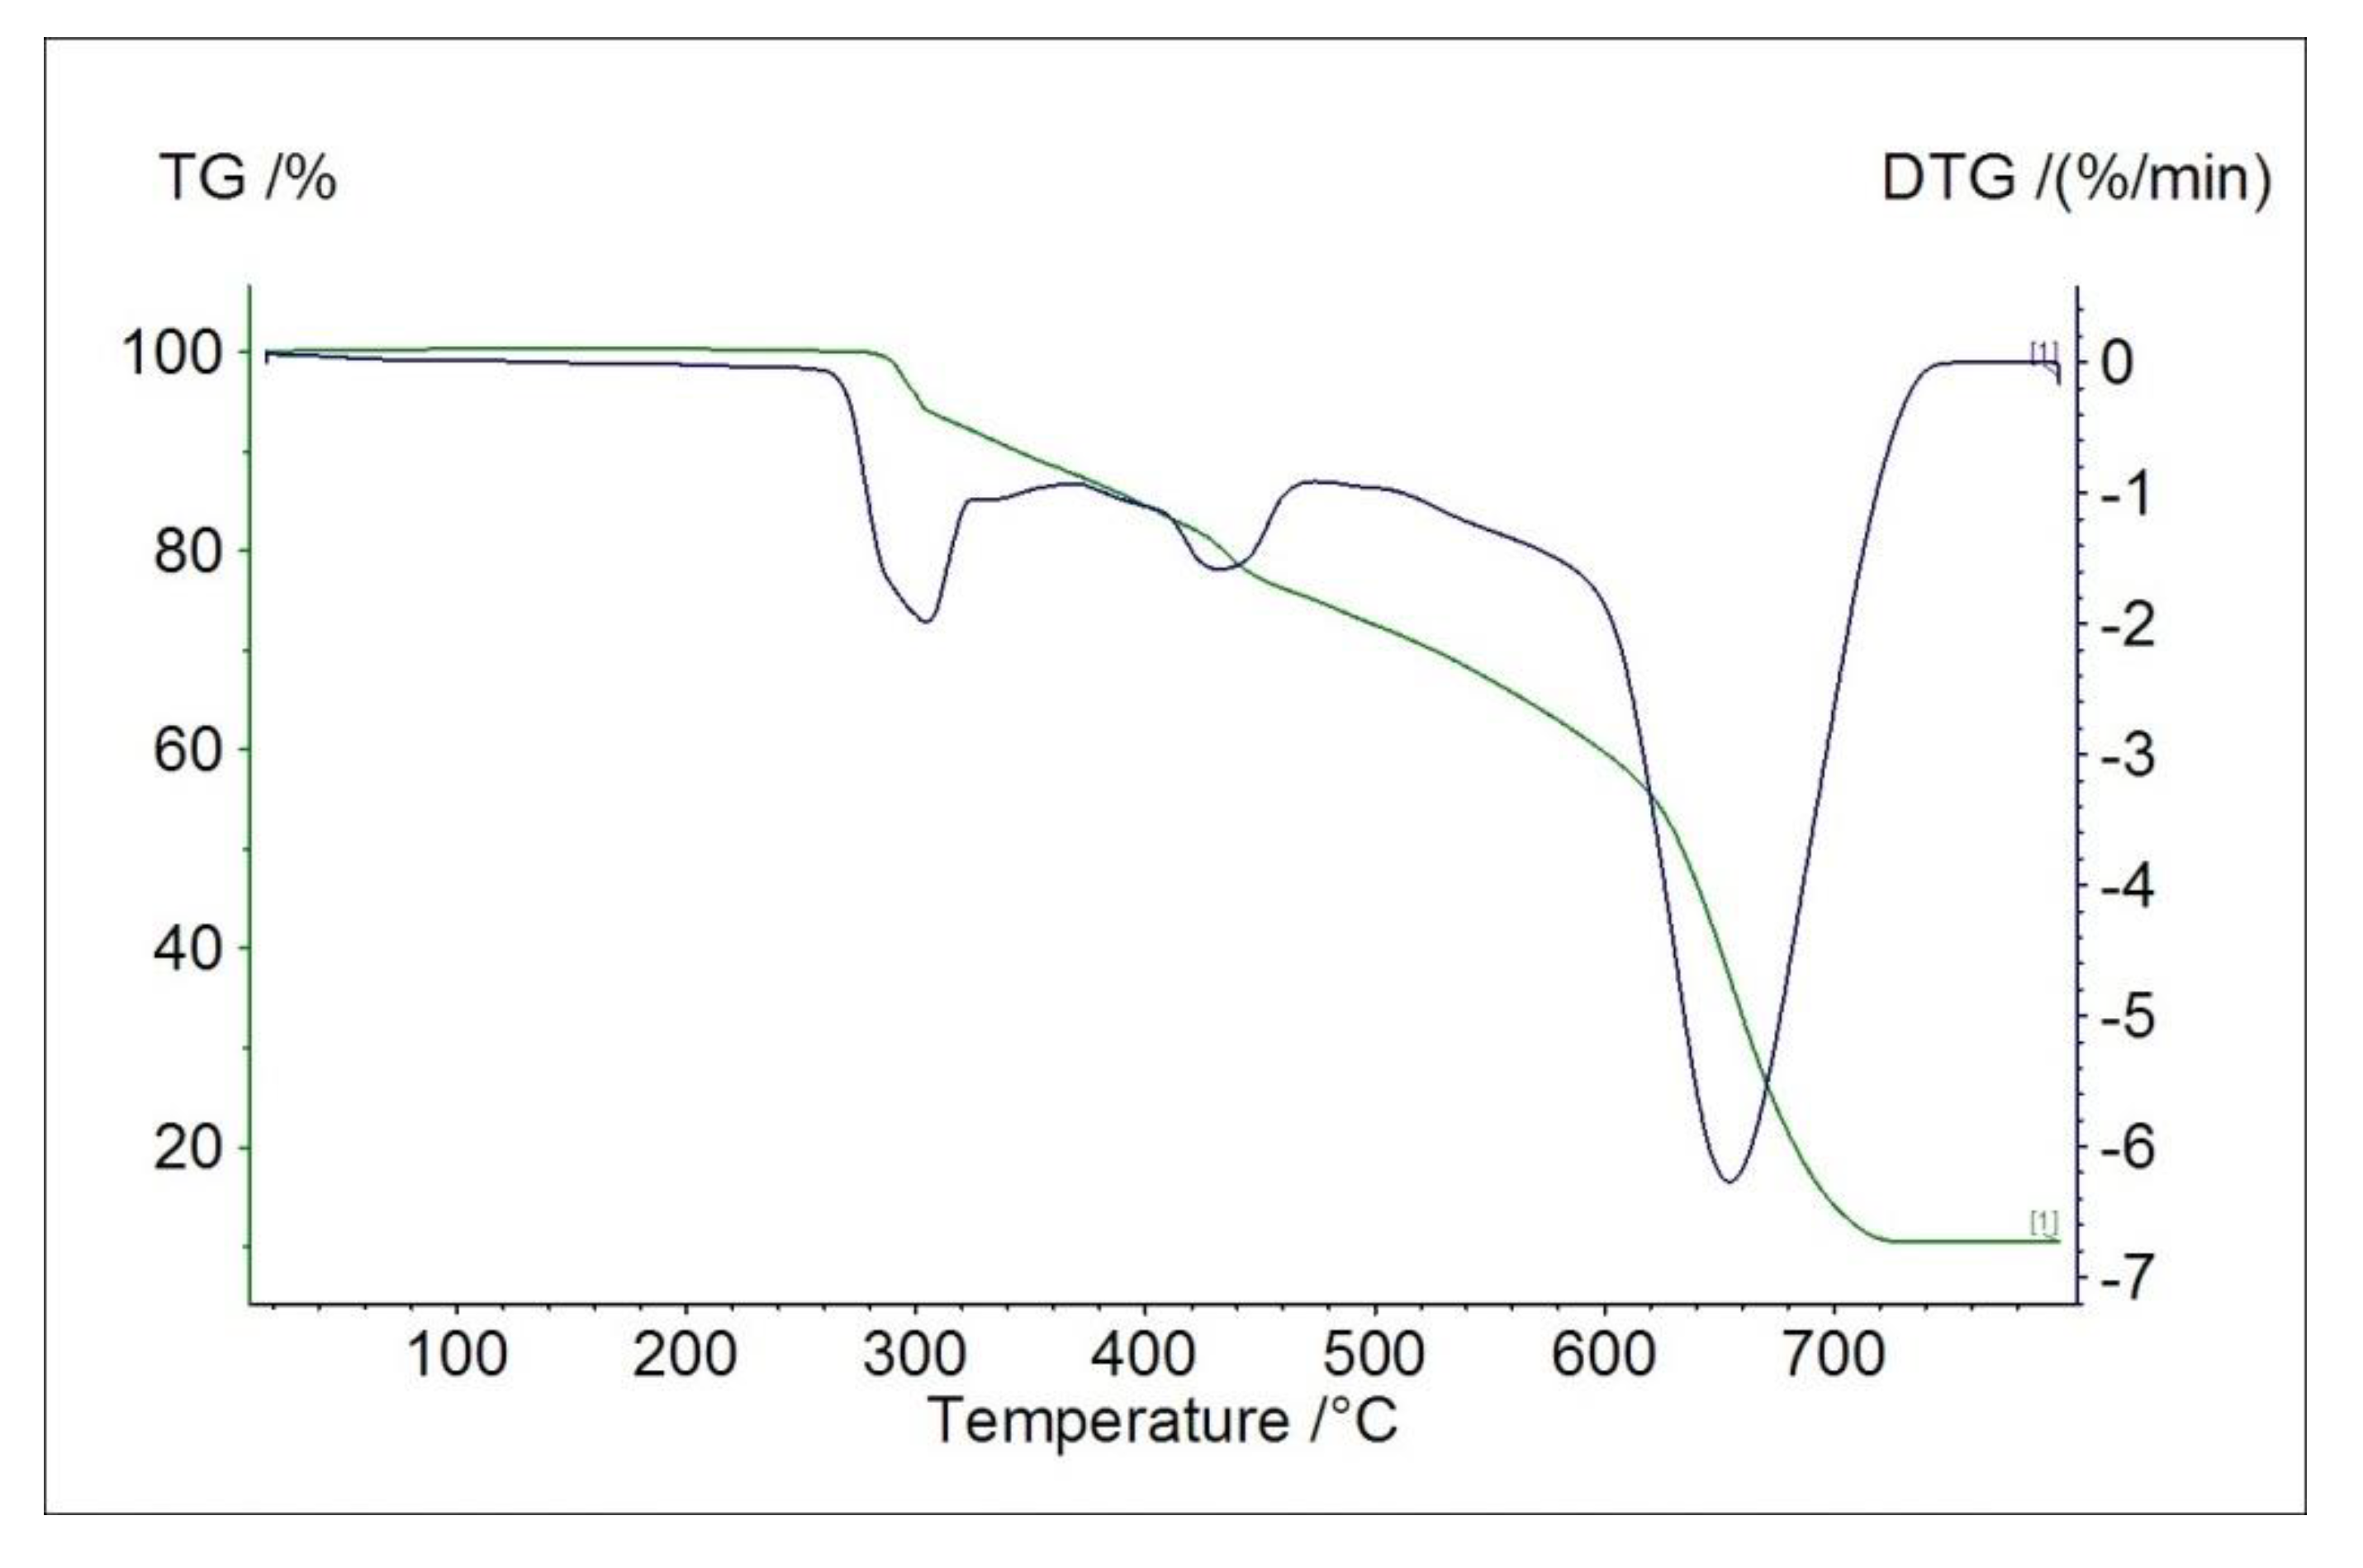
2.4. Thermal Studies in Air
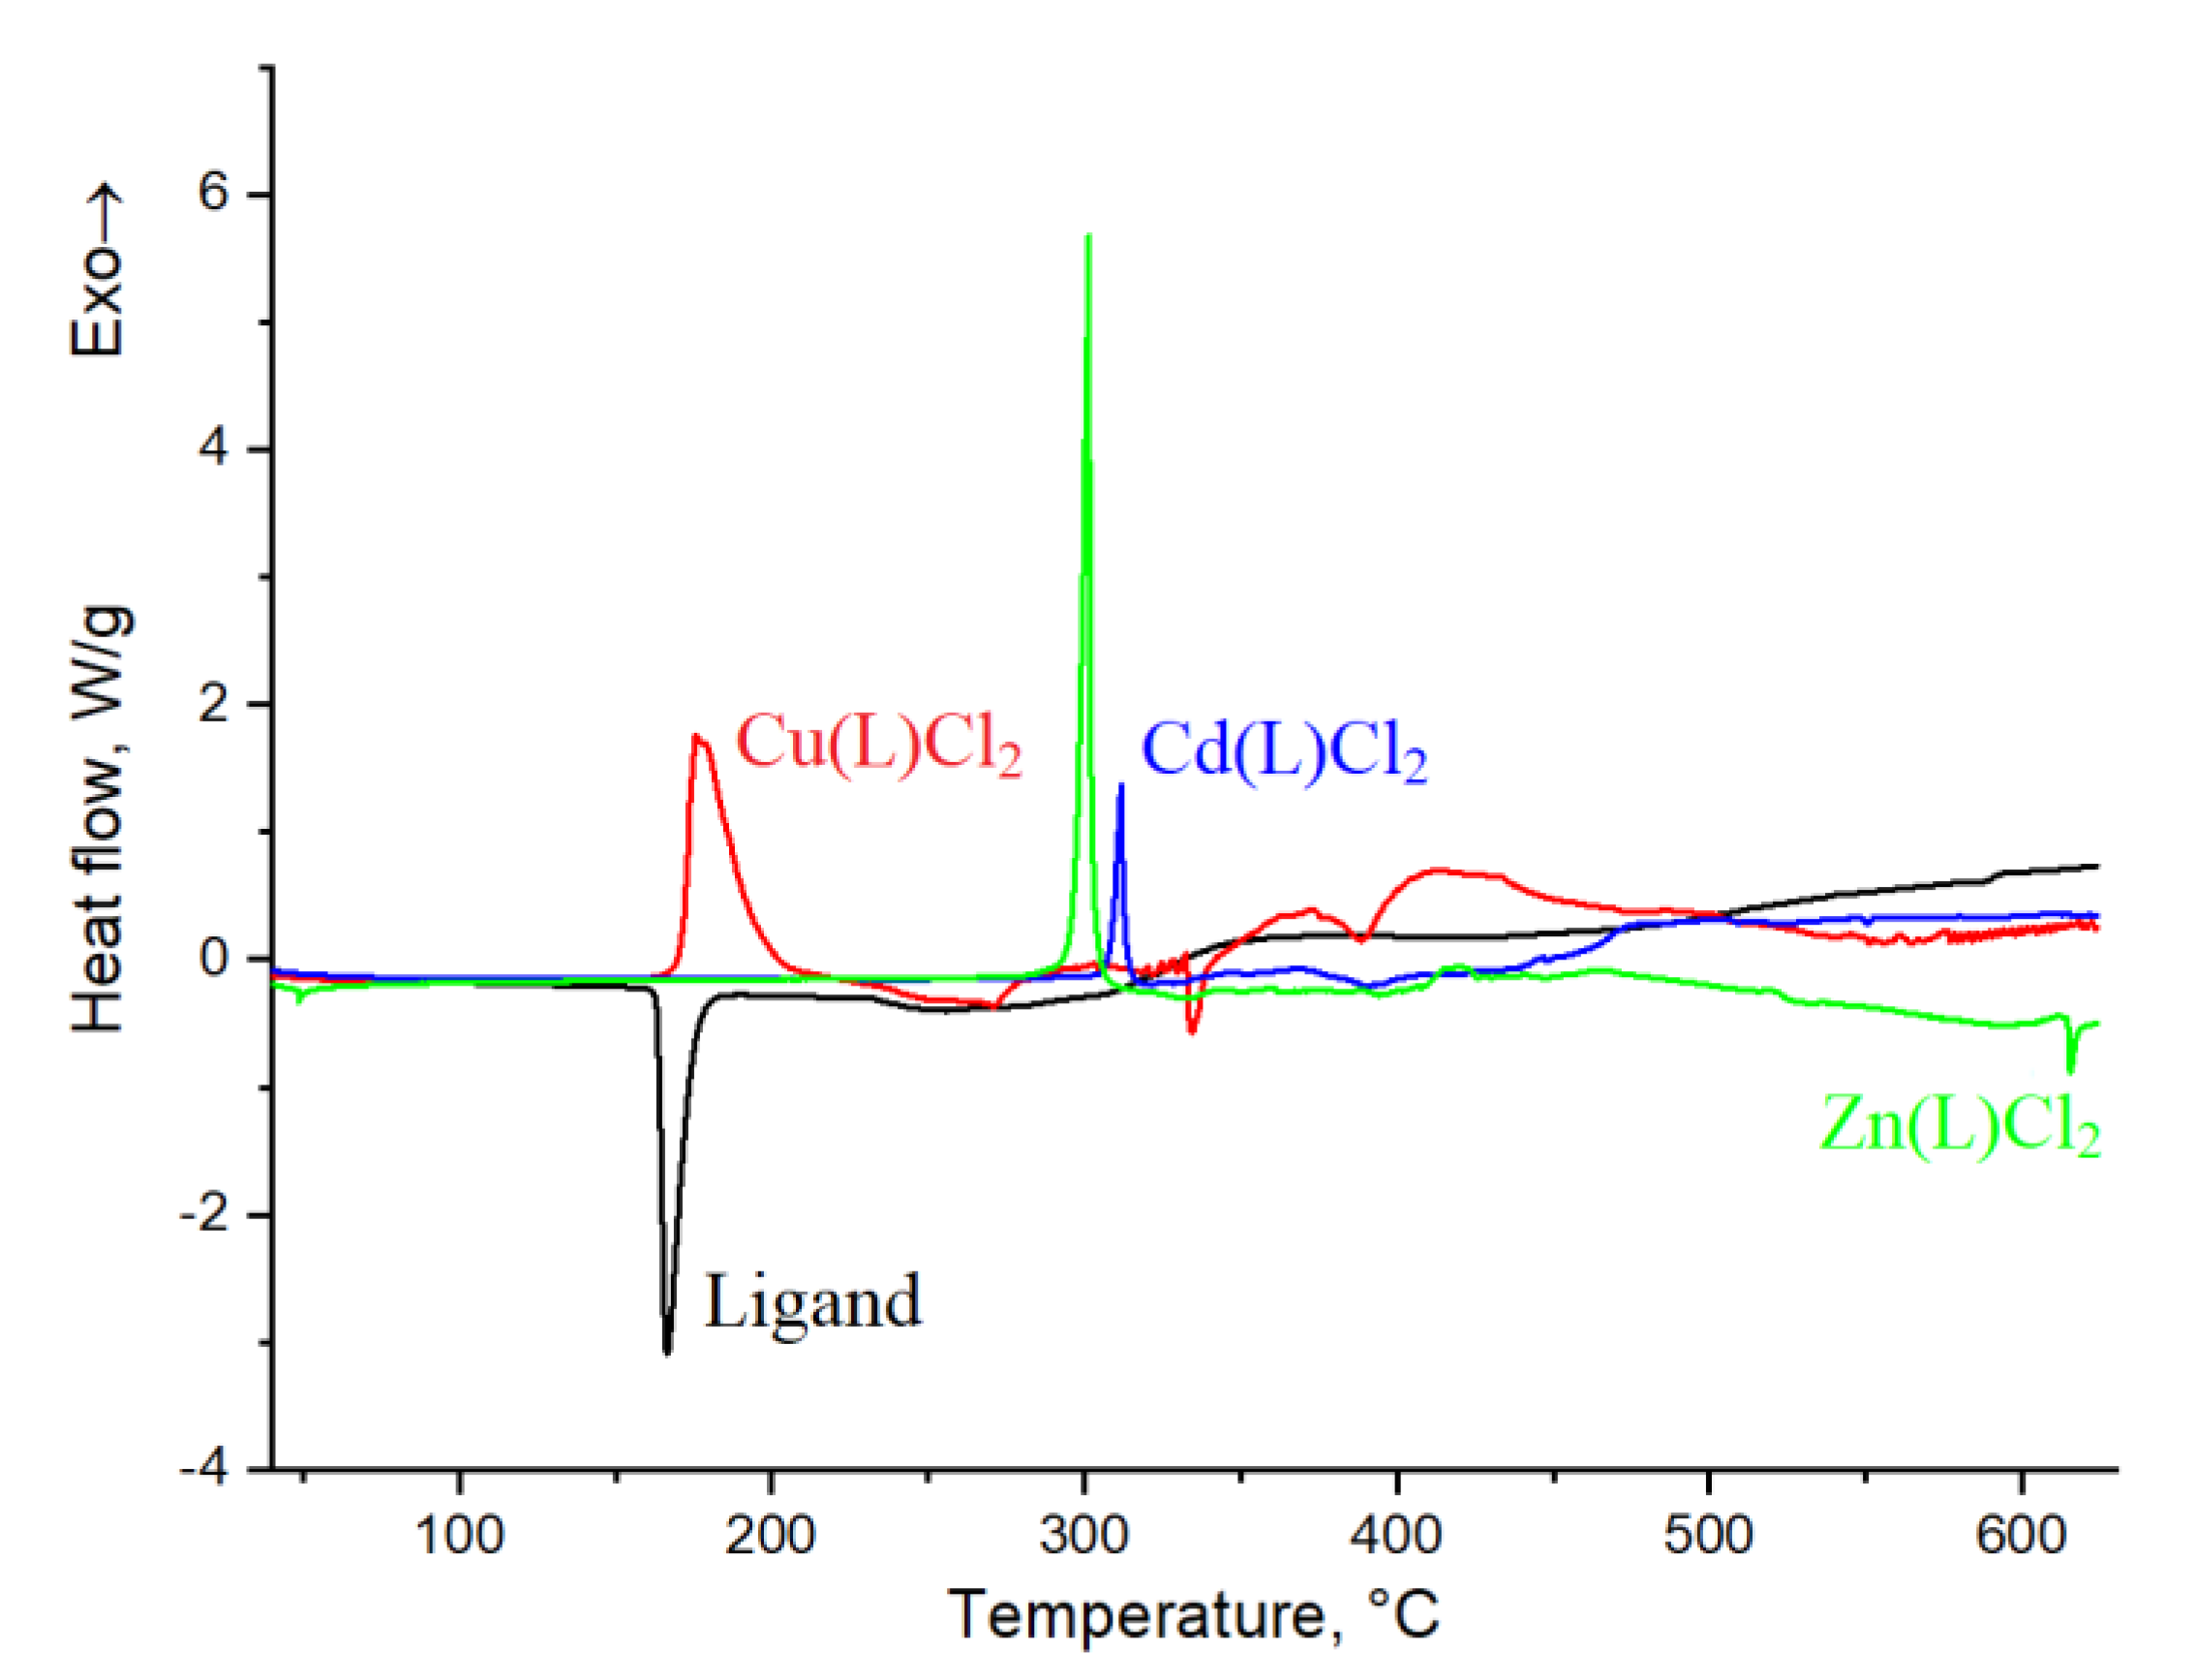
2.5. DSC Study
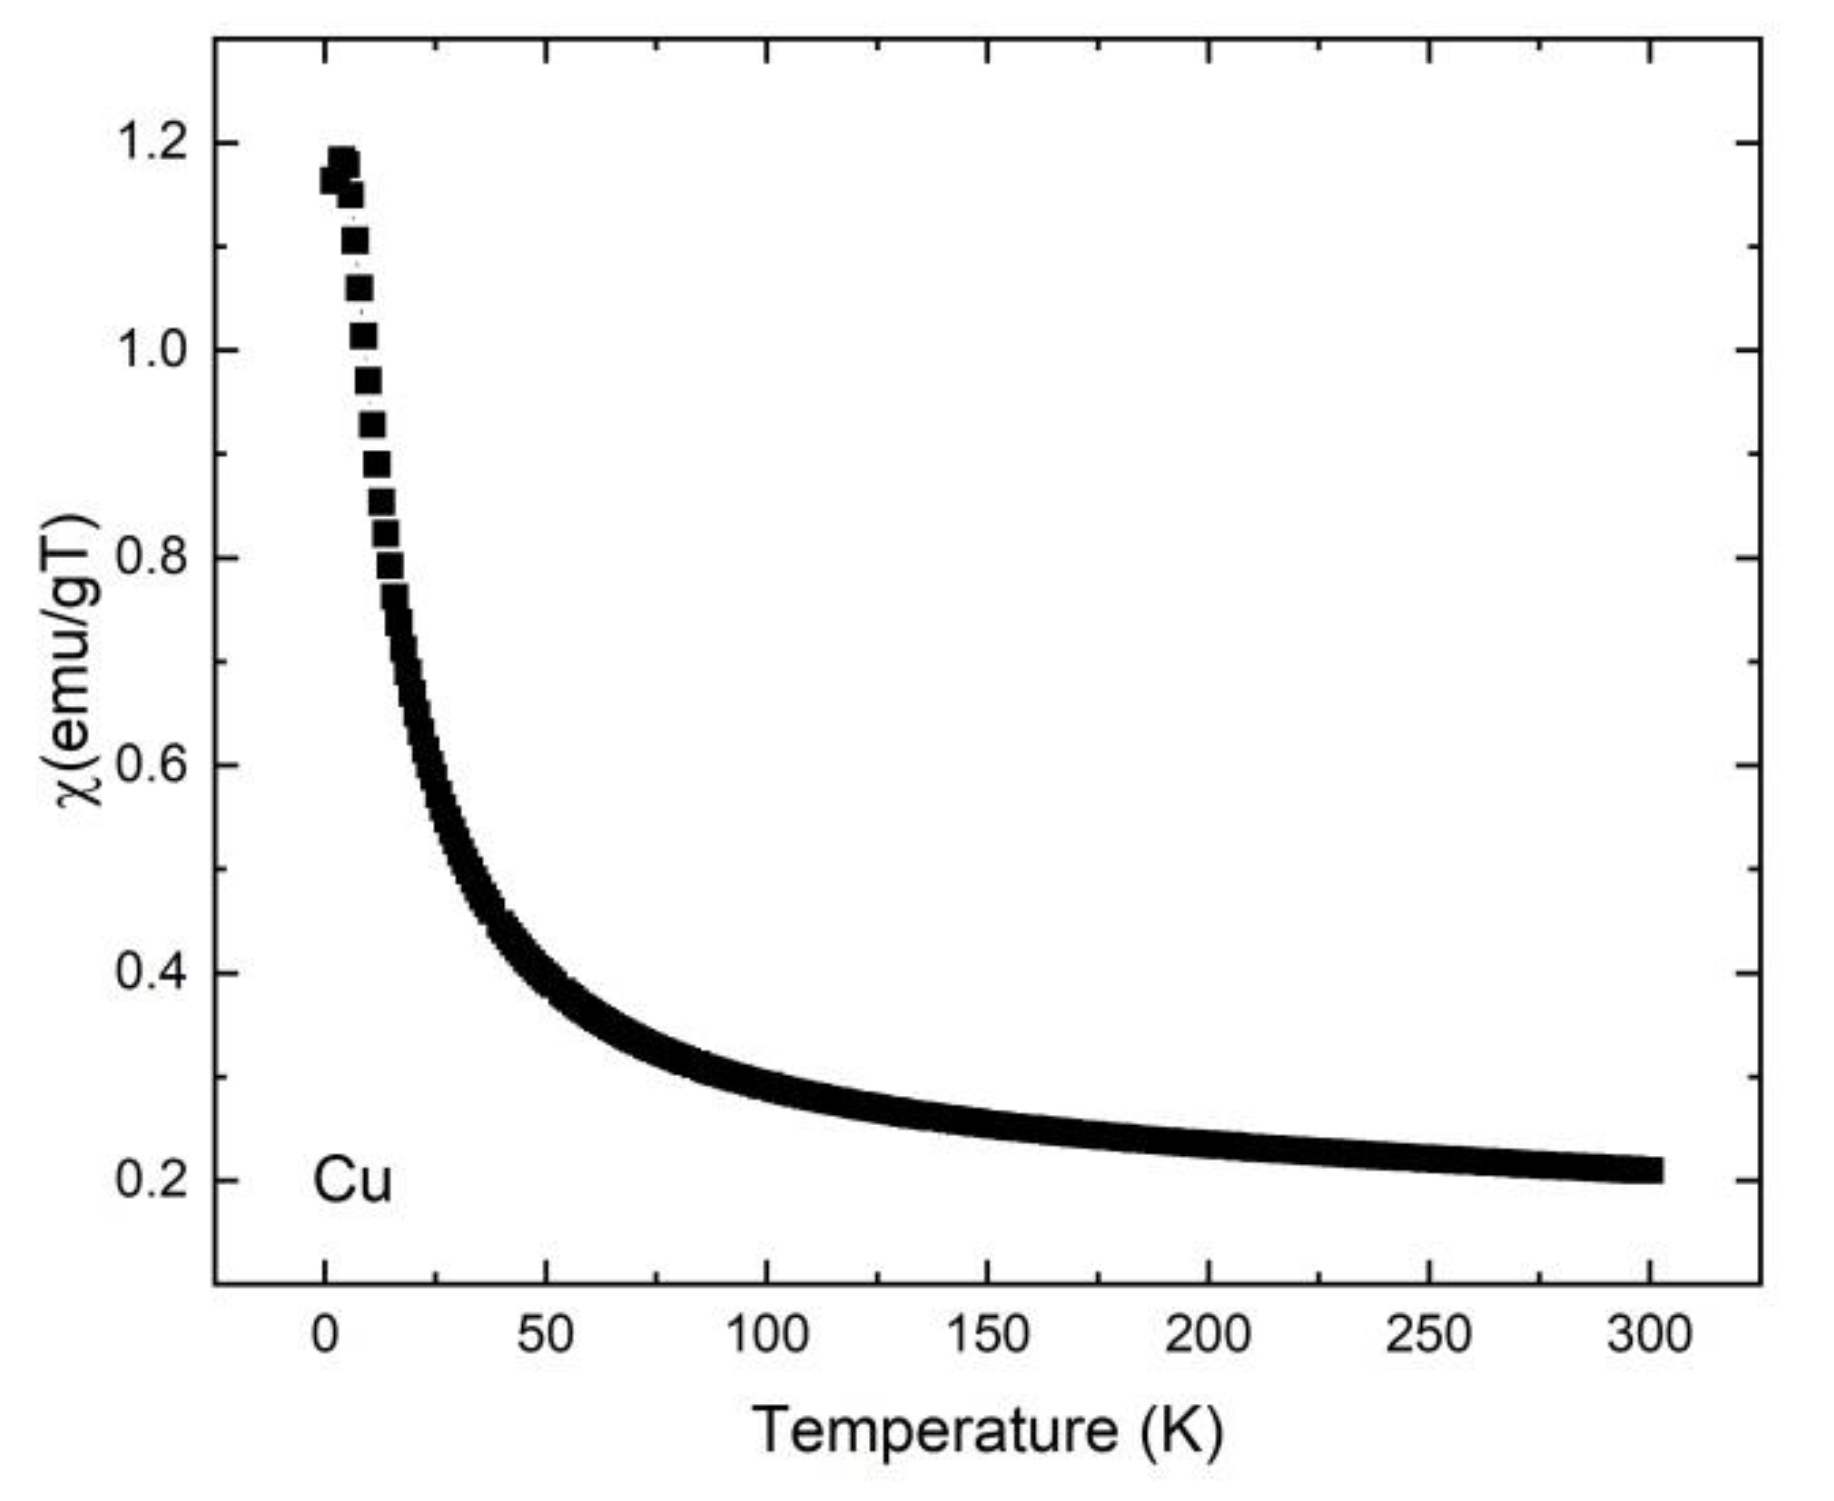
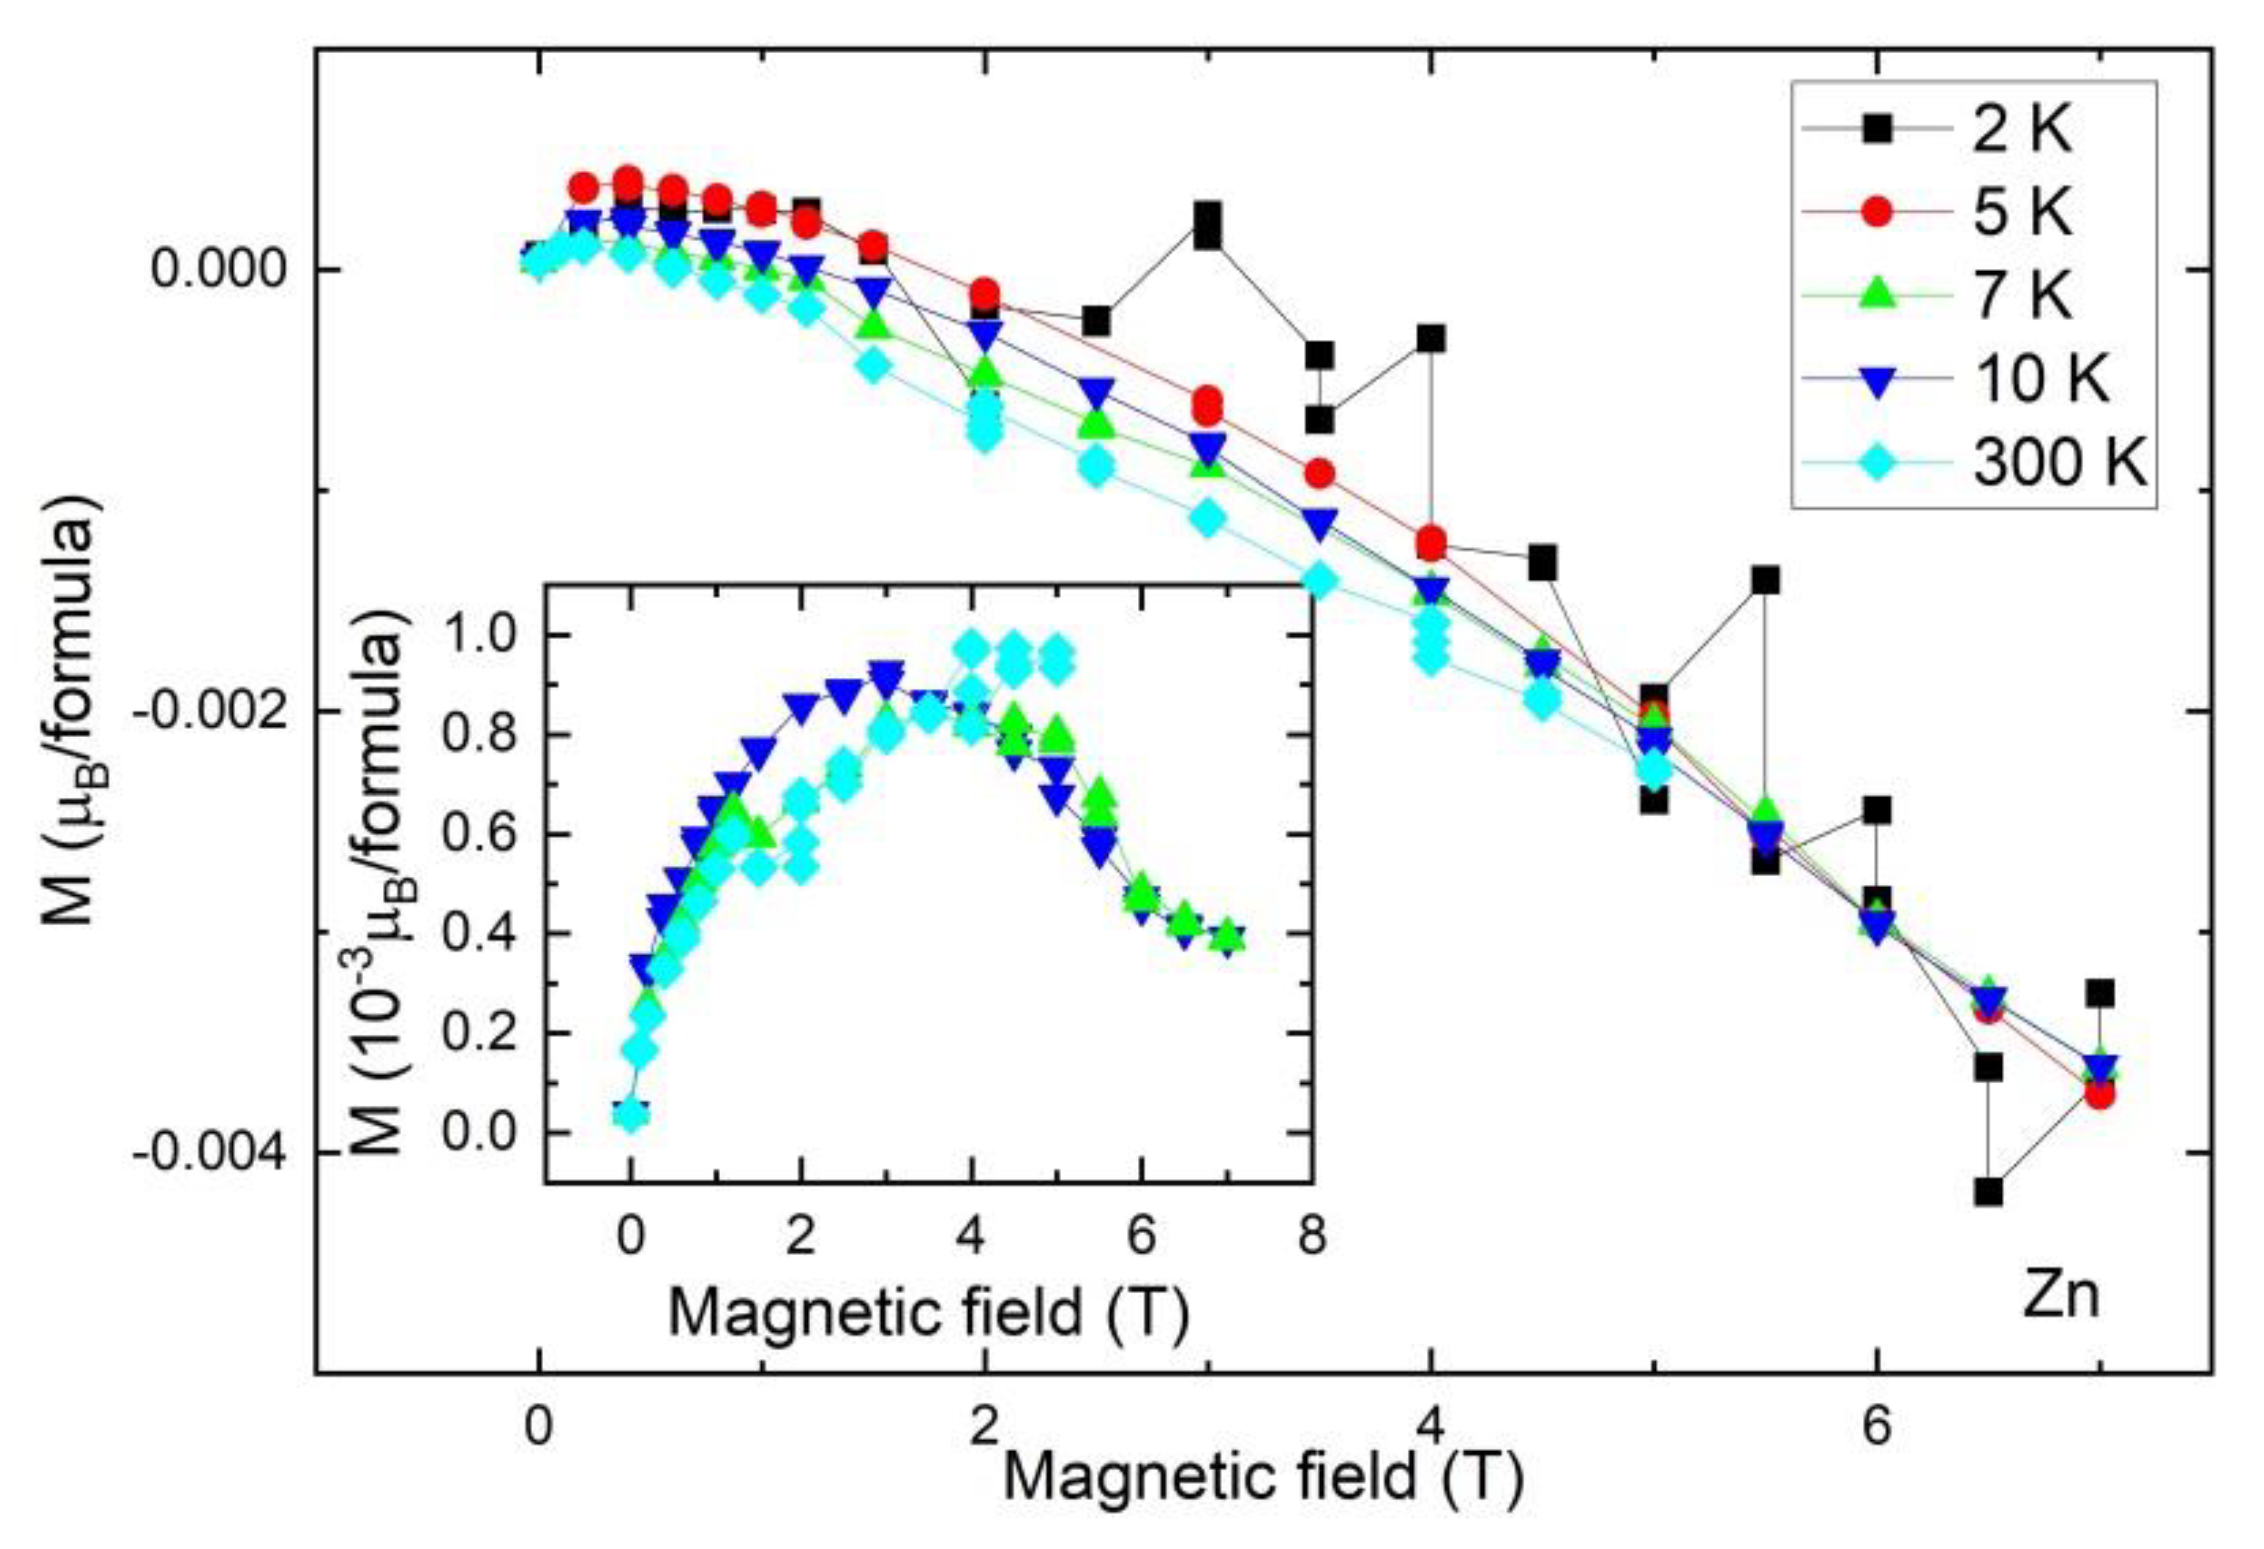
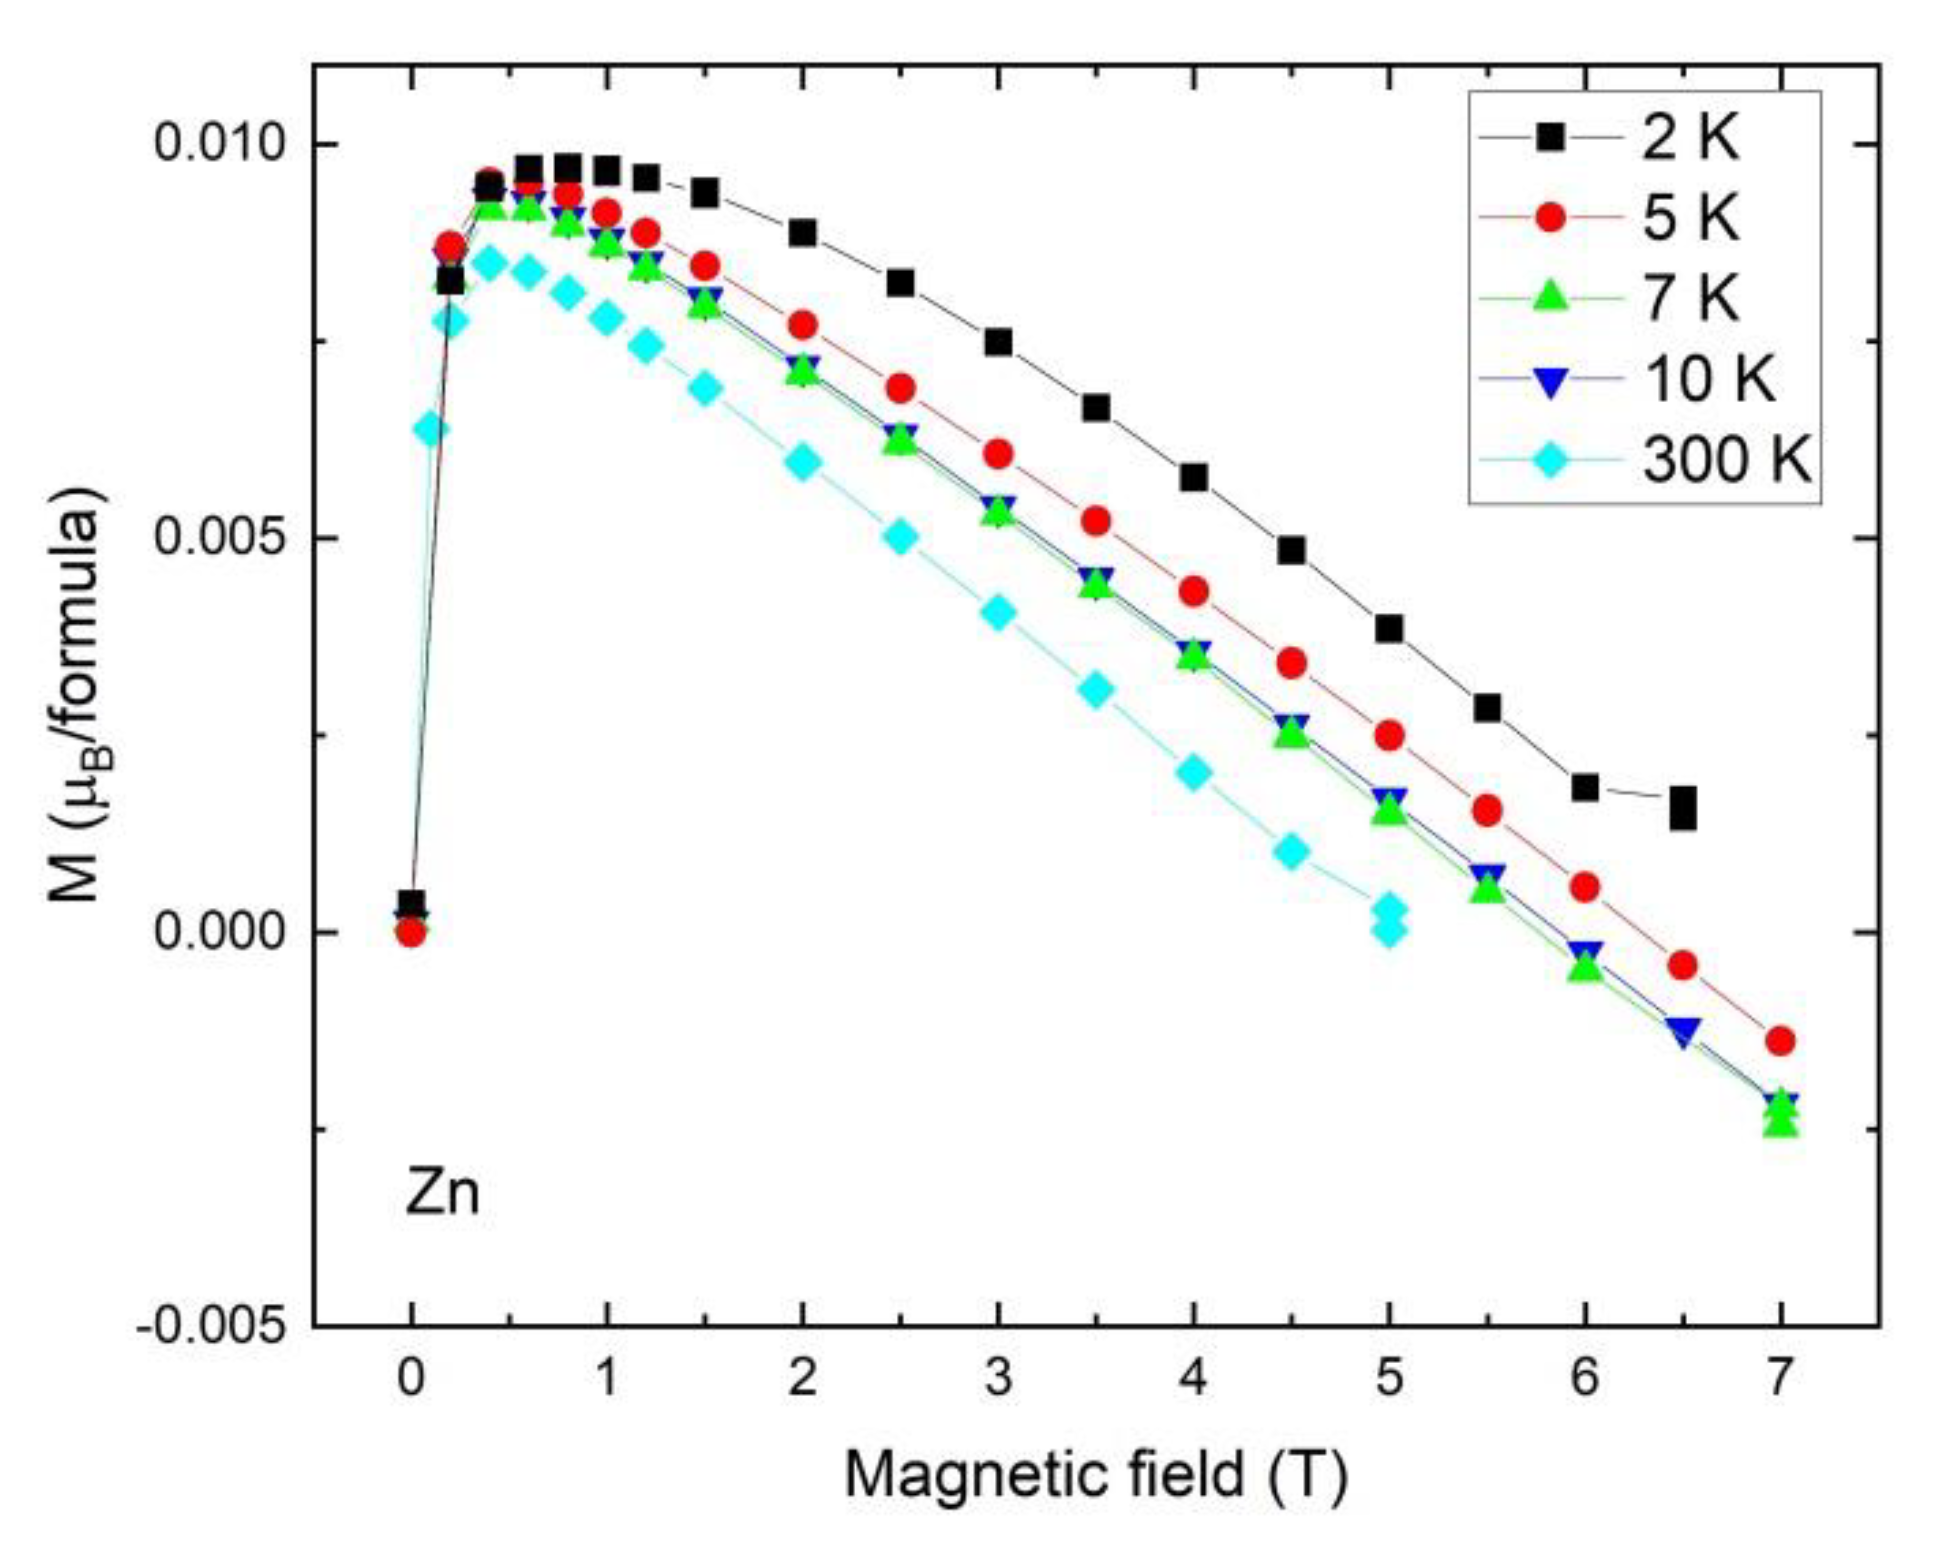
2.6. Magnetic Study
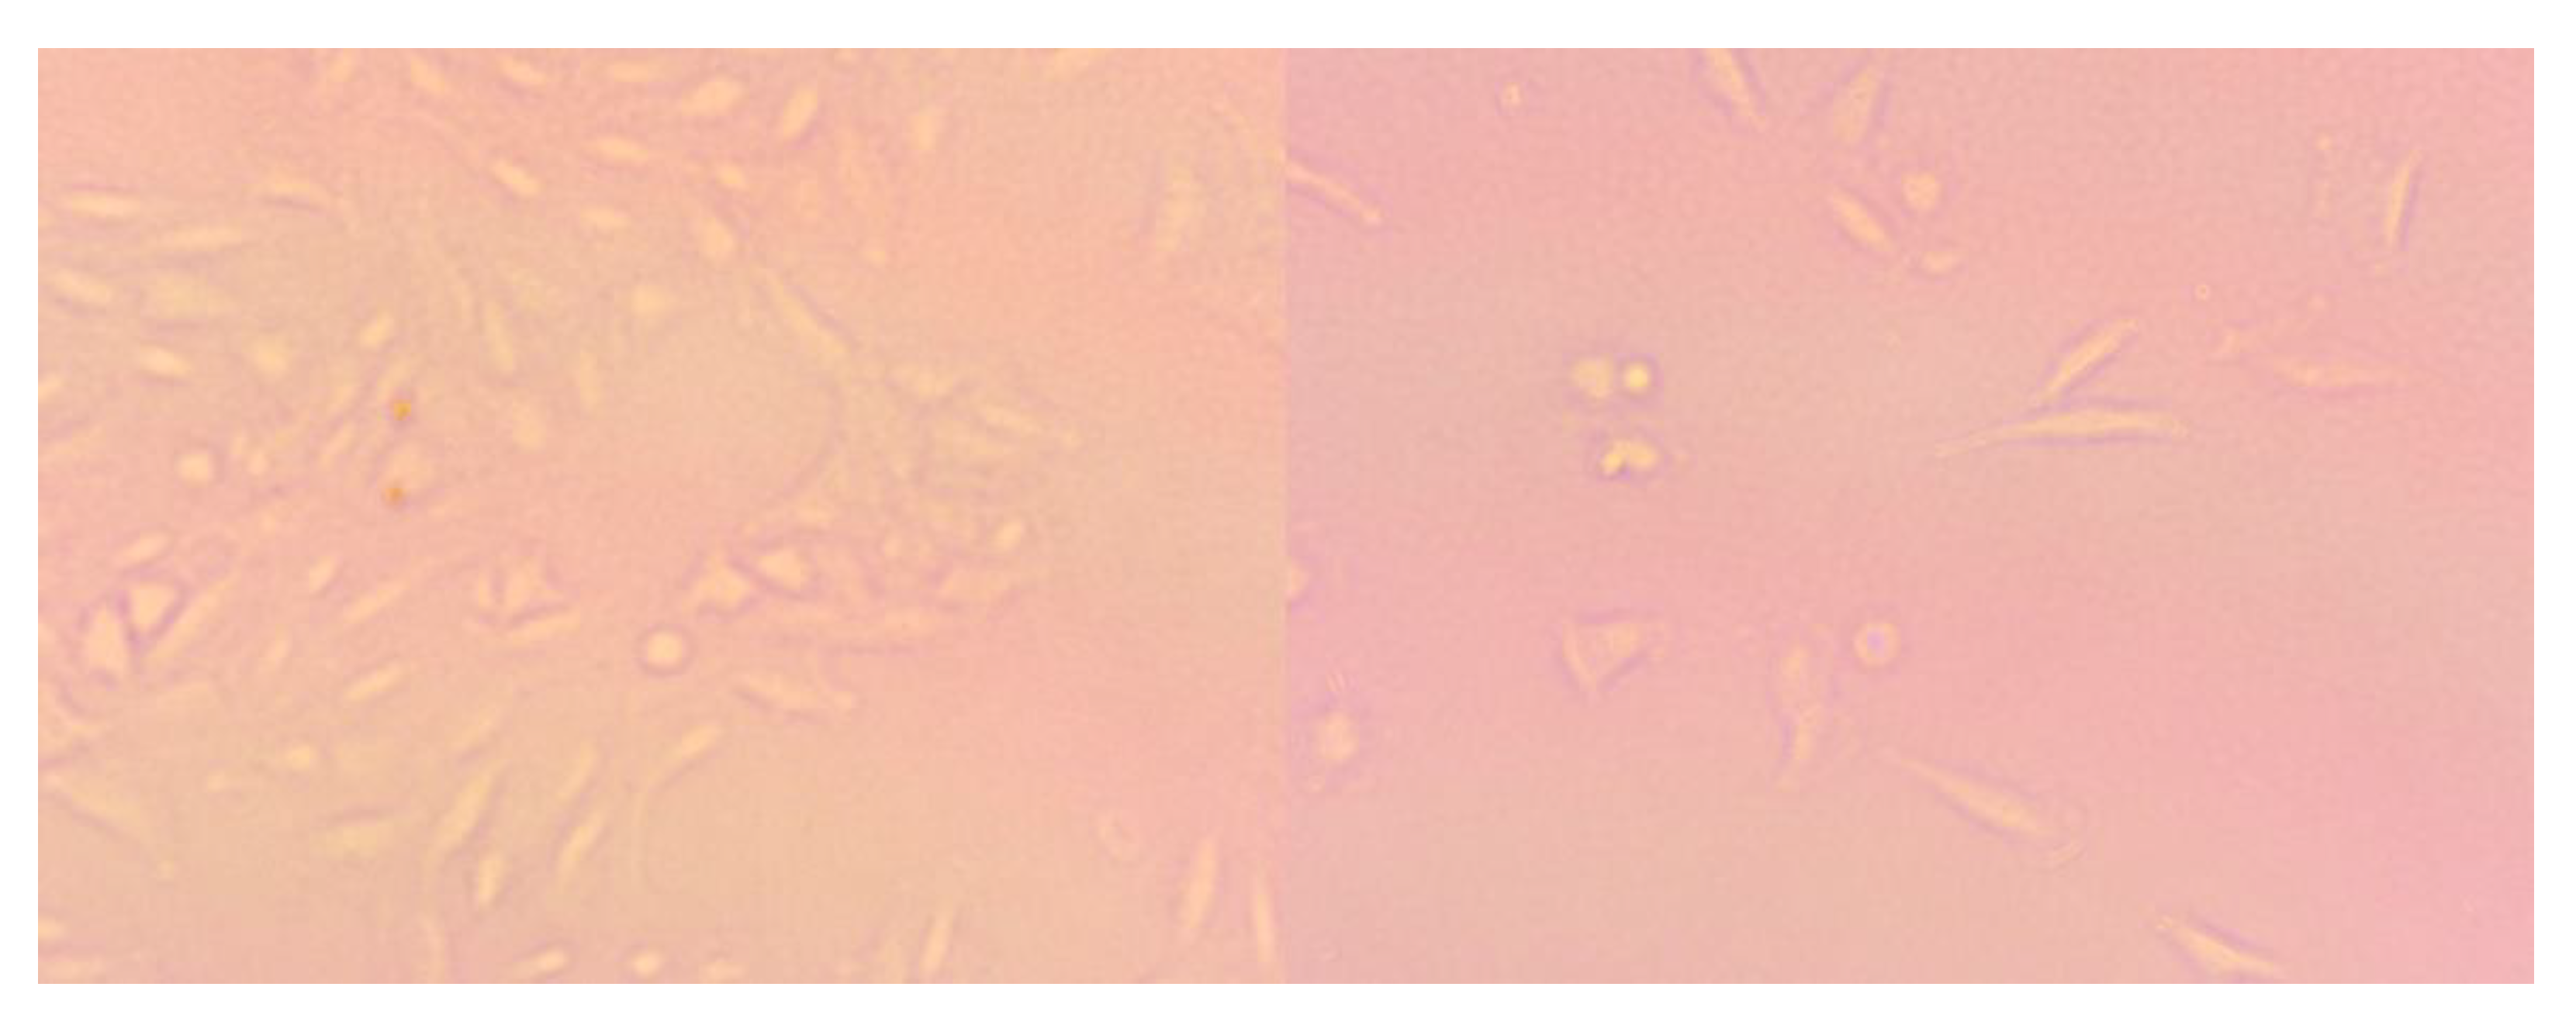
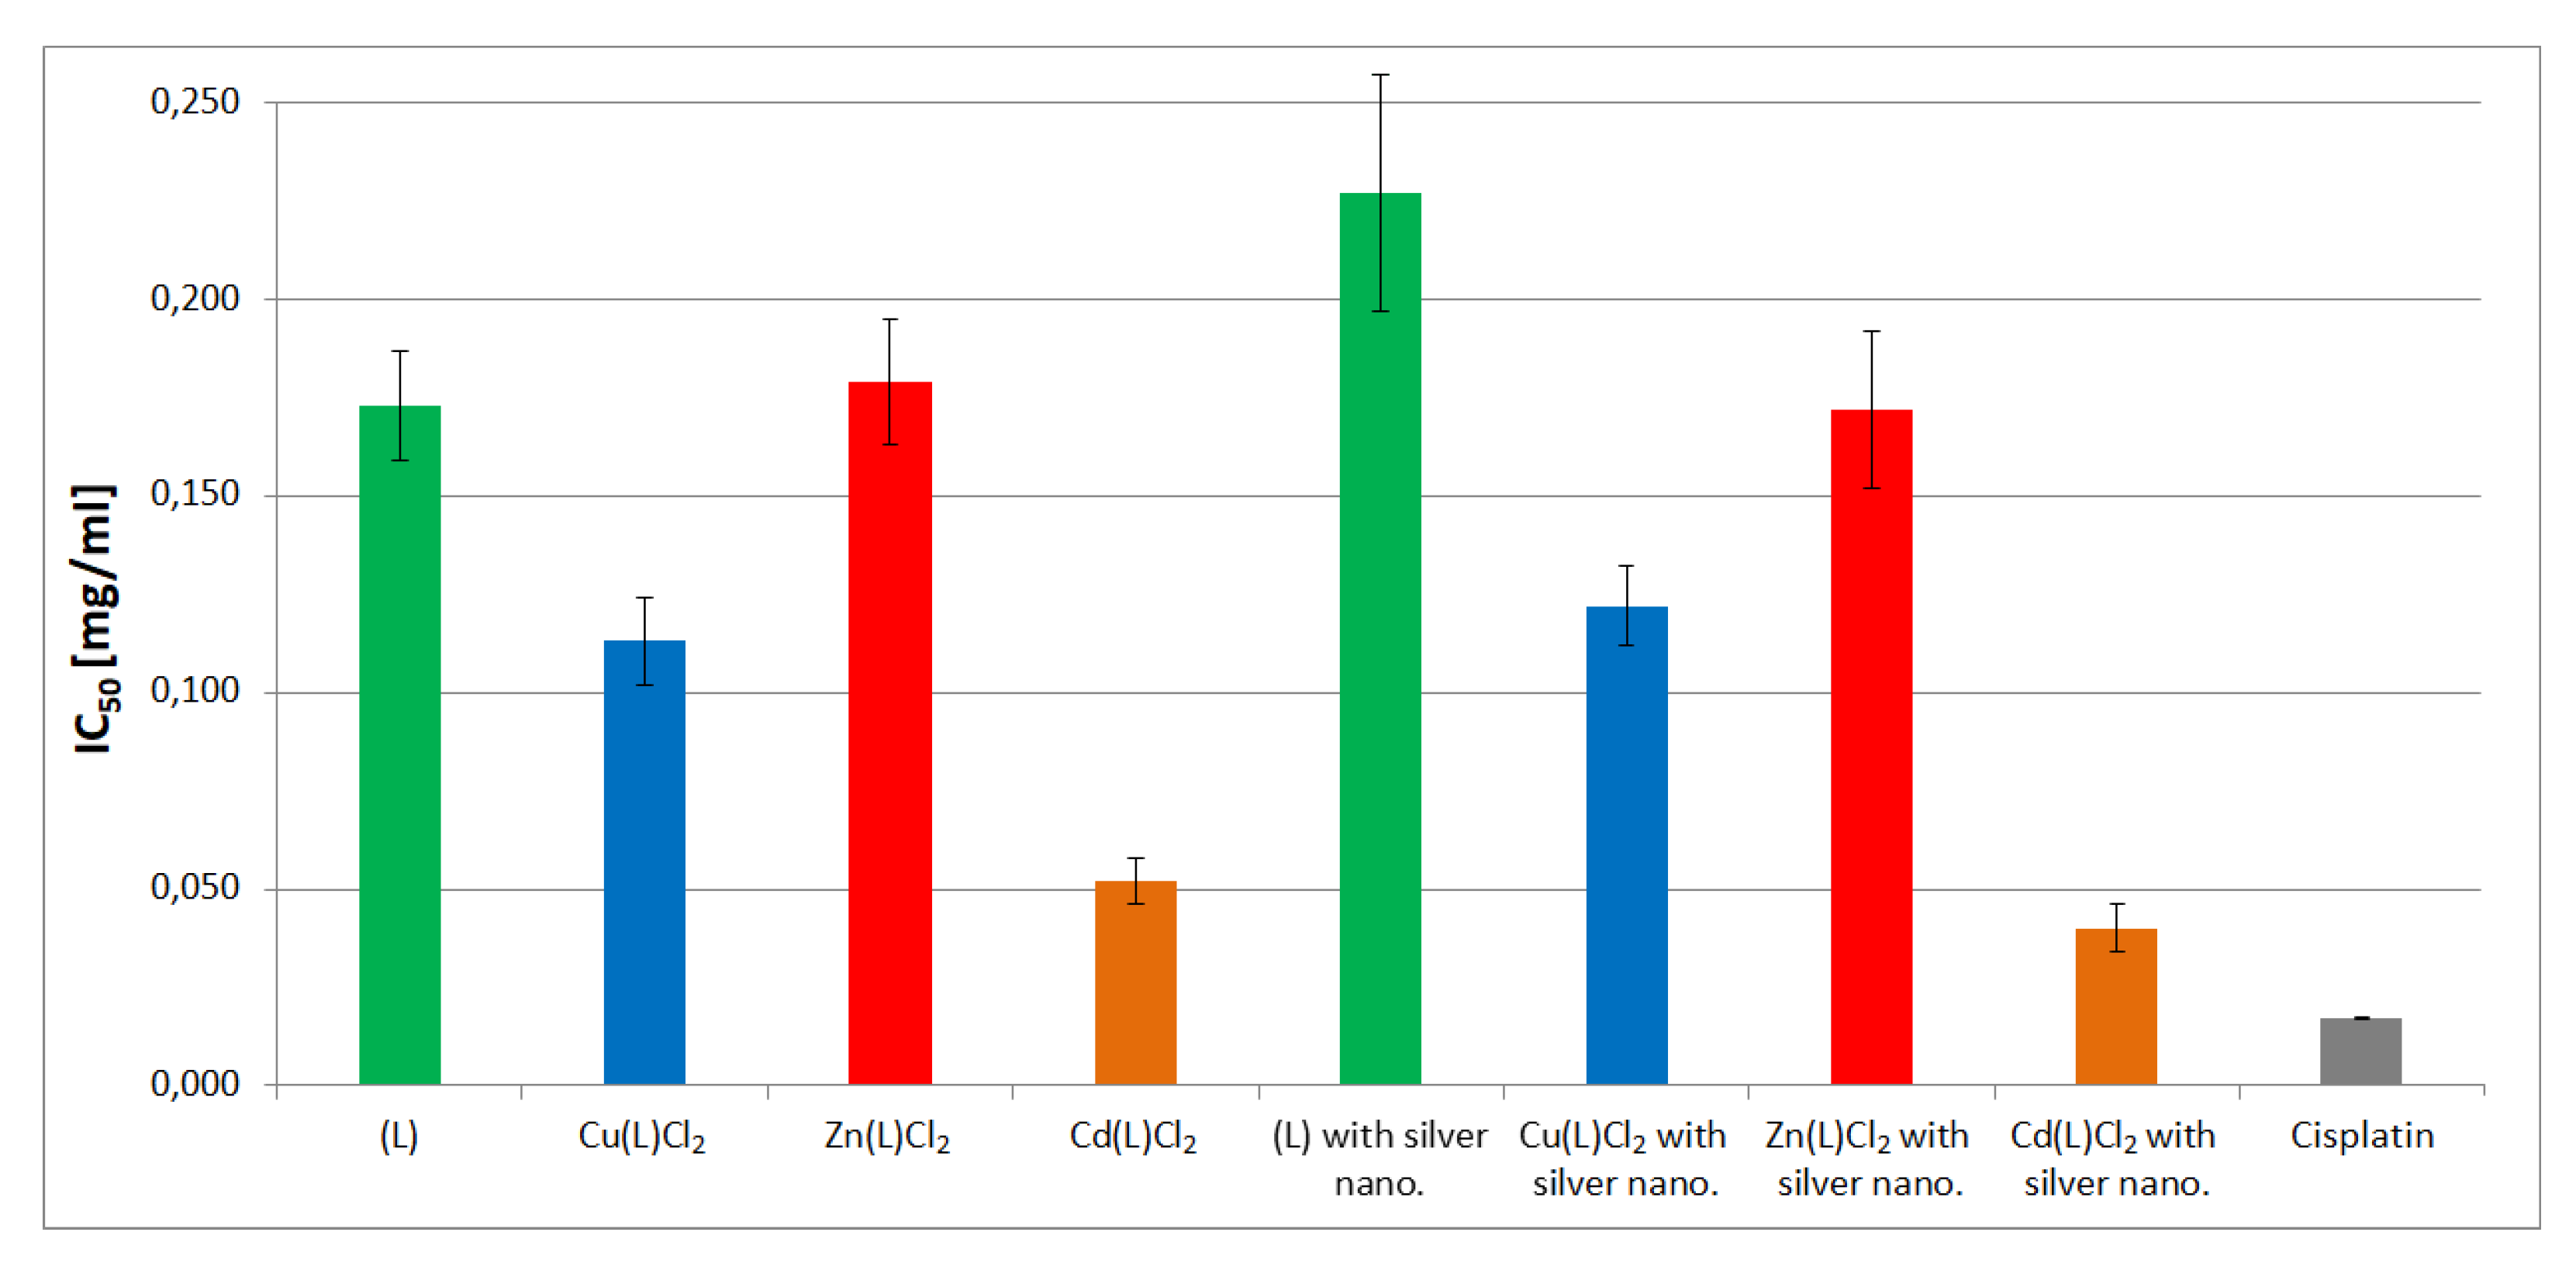
2.7. MTT Cytotoxicity Assay
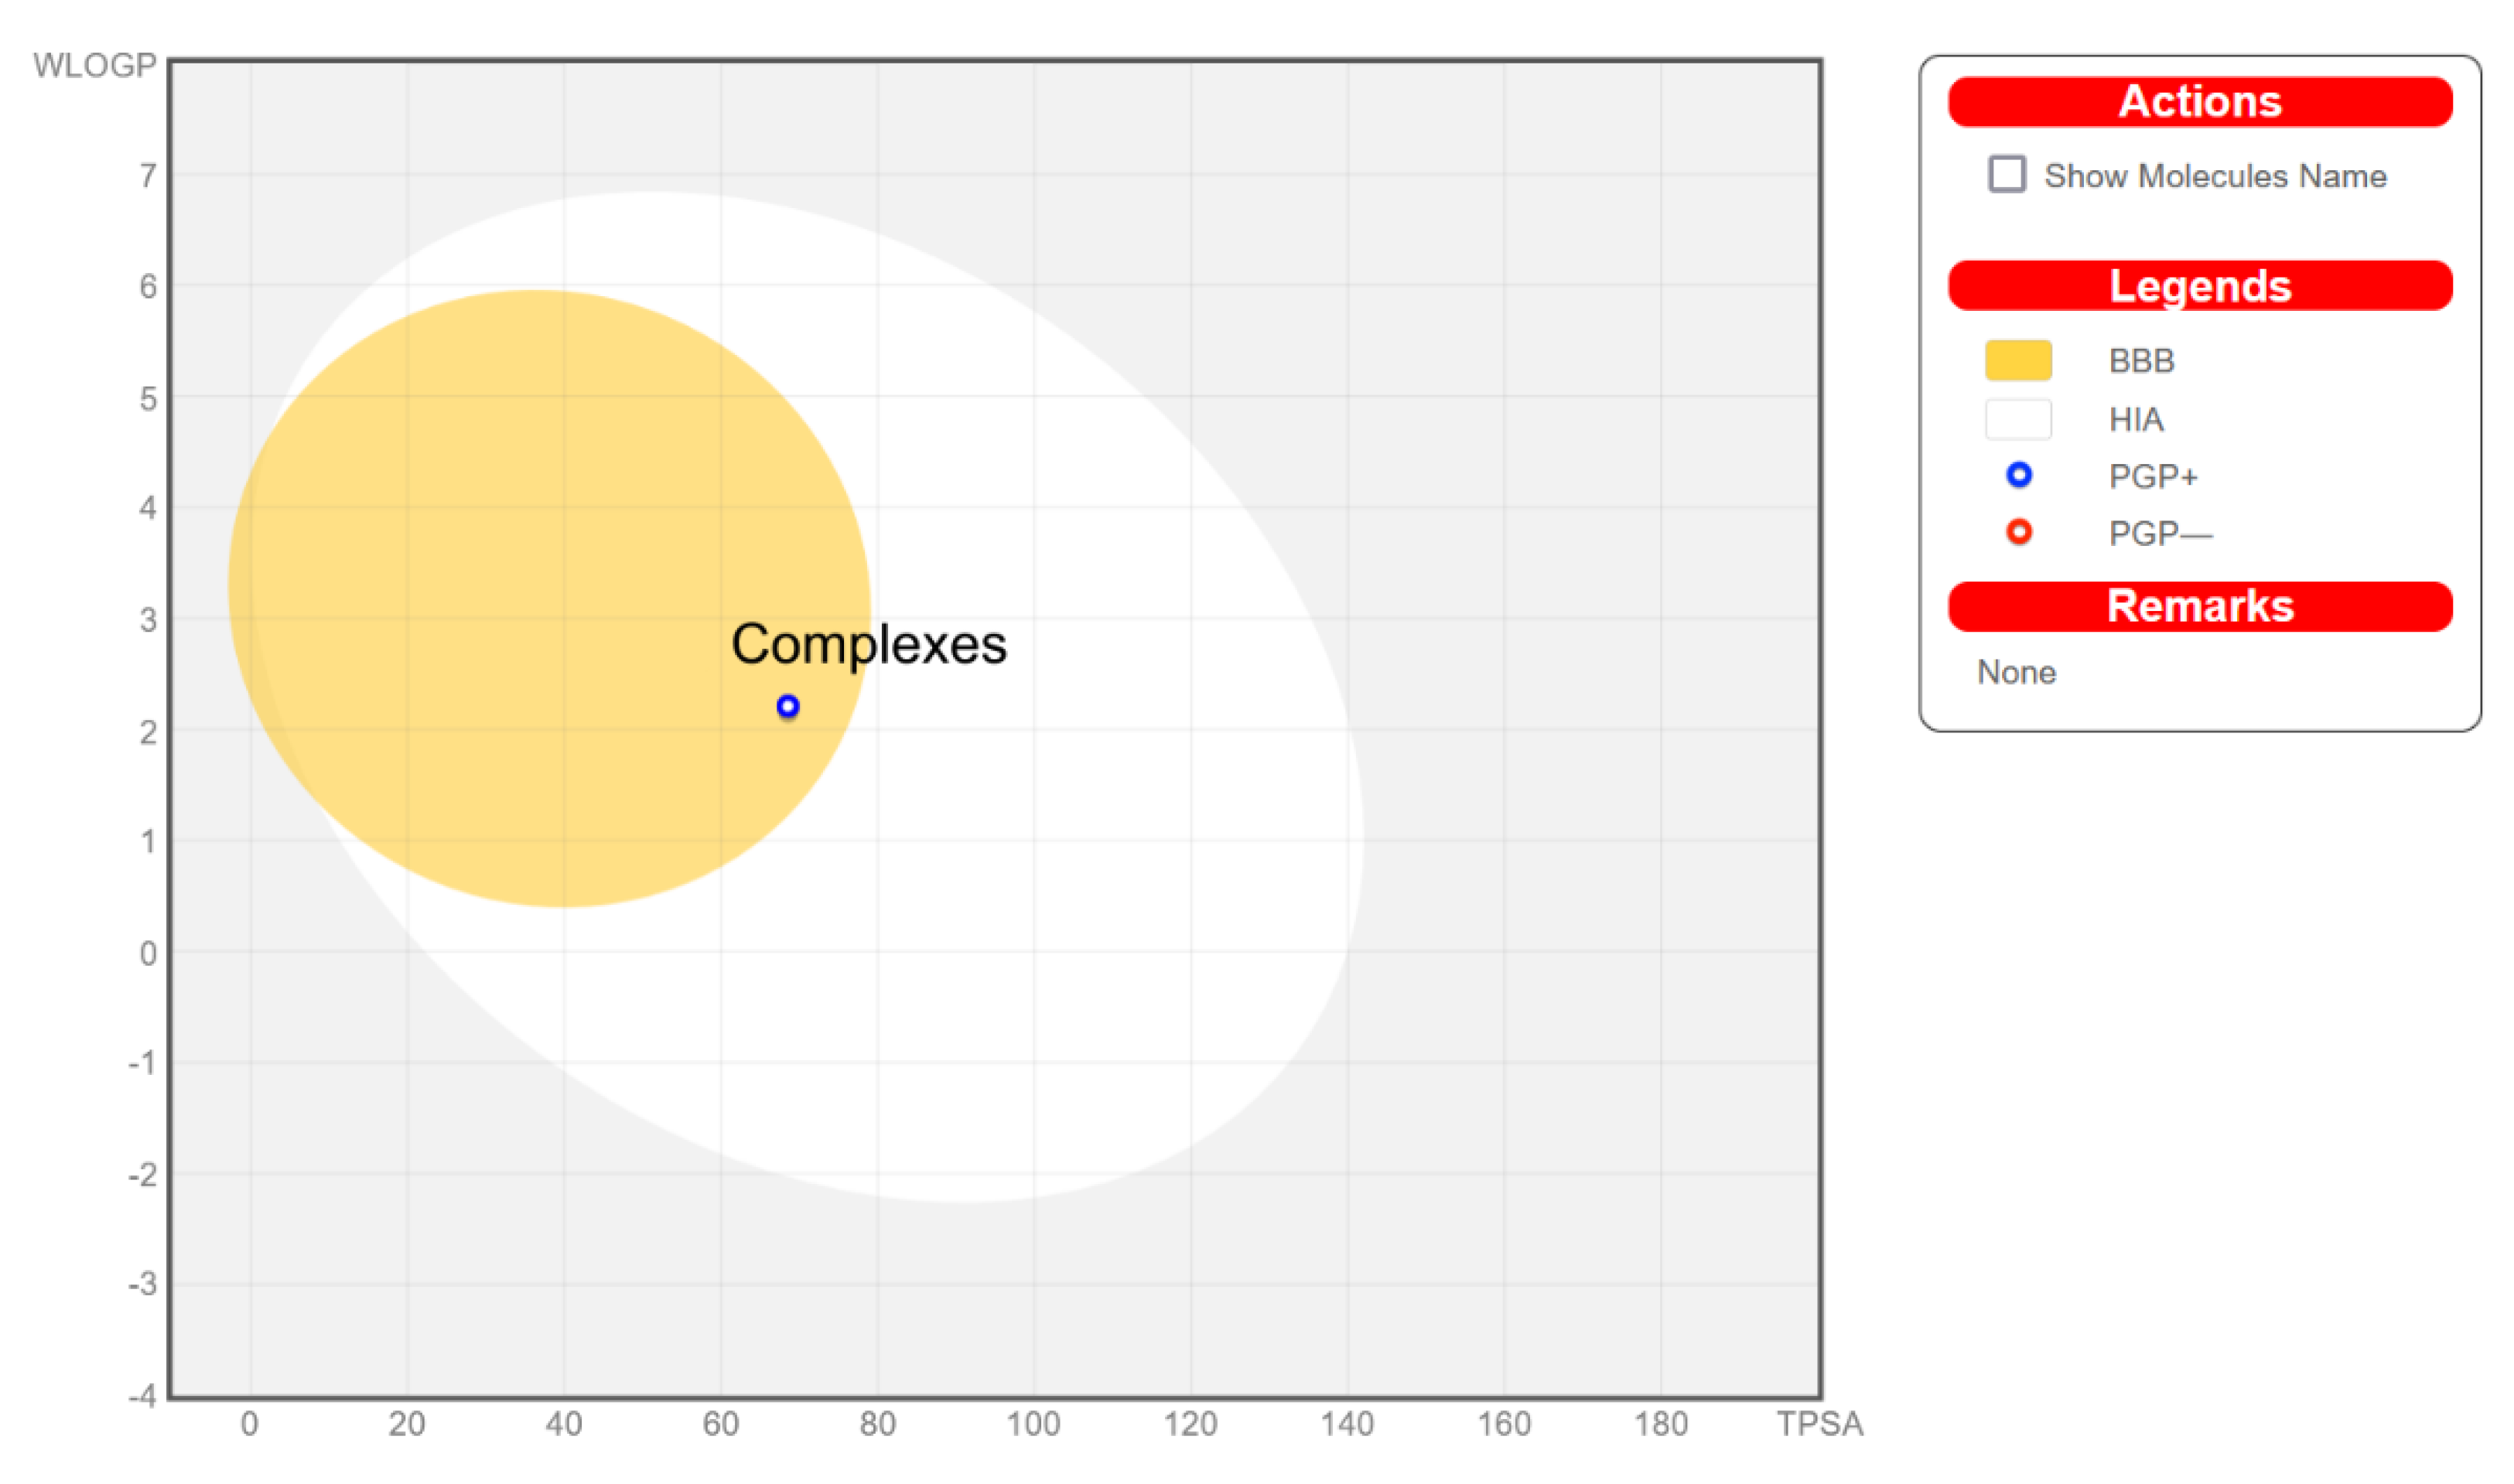
2.8. ADME Analysis
3. Materials and Methods
3.1. Chemistry
3.2. ADMET Analysis
3.3. Biological Assays
3.3.1. Cell Culture
3.3.2. Cytotoxicity Assay
4. Conclusions
Author Contributions
Funding
Institutional Review Board Statement
Informed Consent Statement
Acknowledgments
Conflicts of Interest
References
- Henley, S.J.; Richards, T.B.; Underwood, J.M.; Eheman, C.R.; Plescia, M.; McAfee, T.A. Lung cancer incidence trends among men and women—United States, 2005–2009. MMWR. Morb. Mortal. Wkly. Rep. 2014, 63, 1–5. [Google Scholar] [PubMed]
- Risch, A.; Plass, C. Lung cancer epigenetics and genetics. Int. J. Cancer 2008, 123, 1–7. [Google Scholar] [CrossRef] [PubMed]
- Anush, S.M.; Vishalakshi, B.; Kalluraya, B.; Manju, N. Synthesis of pyrazole-based Schiff bases of Chitosan: Evaluation of antimicrobial activity. Int. J. Biol. Macromol. 2018, 119, 446–452. [Google Scholar] [CrossRef] [PubMed]
- Li, Q.; Zhang, C.; Tan, W.; Gu, G.; Guo, Z. Novel amino-pyridine functionalized chitosan quaternary ammonium derivatives: Design, synthesis, and antioxidant activity. Molecules 2017, 22, 156. [Google Scholar] [CrossRef] [PubMed] [Green Version]
- Wang, R.M.; He, N.P.; Song, P.F.; He, Y.F.; Ding, L.; Lei, Z. Preparation of low-molecular-weight chitosan derivative zinc complexes and their effect on the growth of liver cancer cells in vitro. Pure Appl. Chem. 2009, 81, 2397–2405. [Google Scholar] [CrossRef]
- Wang, R.M.; He, N.P.; Song, P.F.; He, Y.F.; Ding, L.; Lei, Z.Q. Preparation of nano-chitosan Schiff-base copper complexes and their anticancer activity. Polym. Adv. Technol. 2009, 20, 959–964. [Google Scholar] [CrossRef]
- Singh, K.; Raparia, S.; Surain, P. Co(II), Ni(II), Cu(II) and Zn(II) Complexes of 4-(4-cyanobenzylideneamino)-3-mercapto-5-oxo-1,2,4-triazine: Synthesis, characterization and biological studies. Med. Chem. Res. 2015, 24, 2336–2346. [Google Scholar] [CrossRef]
- Lal, S.; Arora, S.; Rani, S.; Kumar, P.; Dabas, P.; Malik, J. Synthesis and characterization of water-soluble chitosan derivatives: Spectral, thermal and biological studies. J. Macromol. Sci. Part A Pure Appl. Chem. 2020, 57, 791–799. [Google Scholar] [CrossRef]
- Baruah, S.; Aier, M.; Puzari, A. (S)-4-(4-aminobenzyl)-2-oxazolidinone based 2-azetidinones for antimicrobial application and luminescent sensing of divalent metal cations. J. Heterocycl. Chem. 2020, 57, 2498–2511. [Google Scholar] [CrossRef]
- Jose, P.A.; Sankarganesh, M.; Raja, J.D.; Senthilkumar, G.S. Synthesis of methoxy substituted pyrimidine derivative imine stabilized copper nanoparticles in organic phase and its biological evaluation. J. Mol. Liq. 2020, 305, 112821. [Google Scholar] [CrossRef]
- Darweesh, Z.H.; Al-Amery, M.H.A.; Karem, L.K.A. Synthesis, characterization, antioxidant, anticancer human studies and biological activity of mixed ligand complexes using schiff base ligand and histidine. Biochem. Cell. Arch. 2020, 20, 2513–2521. [Google Scholar] [CrossRef]
- Zhang, S.M.; Zhang, H.Y.; Qin, Q.P.; Fei, J.W.; Zhang, S.H. Syntheses, crystal structures and biological evaluation of two new Cu(II) and Co(II) complexes based on (E)-2-(((4H-1,2,4-triazol-4-yl)imino)methyl)-6-methoxyphenol. J. Inorg. Biochem. 2019, 193, 52–59. [Google Scholar] [CrossRef] [PubMed]
- Tumer, M.; Tumer, F.; Kose, M.; Gungor, S.A.; Akar, S.; Demirtas, İ.; Ceyhan, G. Structural characterizations, photophysical and biological properties of Disperse black 9 dye and π-extended imine derivatives. Dyes Pigment. 2018, 154, 62–74. [Google Scholar] [CrossRef]
- Vaseghi, S.; Yousefi, M.; Shokrzadeh, M.; Hossaini, Z.; Hosseini-khah, Z.; Emami, S. Synthesis, computational study and cytotoxicity of 4-hydroxycoumarin-derived imines/enamines. Mol. Divers. 2021, 25, 1011–1024. [Google Scholar] [CrossRef] [PubMed]
- Iwanejko, J.; Samadaei, M.; Pinter, M.; Senfter, D.; Madlener, S.; Kochel, A.; Rohr-Udilova, N.; Wojaczyńska, E. Cytotoxic Activity of Piperazin-2-One-Based Structures: Cyclic Imines, Lactams, Aminophosphonates, and Their Derivatives. Materials 2021, 14, 2138. [Google Scholar] [CrossRef]
- Iacopetta, D.; Lappano, R.; Mariconda, A.; Ceramella, J.; Sinicropi, M.S.; Saturnino, C.; Talia, M.; Cirillo, F.; Martinelli, F.; Puoci, F.; et al. Newly synthesized imino-derivatives analogues of resveratrol exert inhibitory effects in breast tumor cells. Int. J. Mol. Sci. 2020, 21, 7797. [Google Scholar] [CrossRef] [PubMed]
- Yan, Y.; Warren, S.C.; Fuller, P.; Grzybowski, B.A. Chemoelectronic circuits based on metal nanoparticles. Nat. Nanotechnol. 2016, 11, 603–608. [Google Scholar] [CrossRef] [PubMed]
- Zhang, W.; Saliba, M.; Stranks, S.D.; Sun, Y.; Shi, X.; Wiesner, U.; Snaith, H.J. Enhancement of perovskite-based solar cells employing core-shell metal nanoparticles. Nano Lett. 2013, 13, 4505–4510. [Google Scholar] [CrossRef] [PubMed] [Green Version]
- Wang, Y.J.; Zhao, N.; Fang, B.; Li, H.; Bi, X.T.; Wang, H. Carbon-Supported Pt-Based Alloy Electrocatalysts for the Oxygen Reduction Reaction in Polymer Electrolyte Membrane Fuel Cells: Particle Size, Shape, and Composition Manipulation and Their Impact to Activity. Chem. Rev. 2015, 115, 3433–3467. [Google Scholar] [CrossRef] [Green Version]
- Ho, K.H.; Shang, A.; Shi, F.; Lo, T.W.; Yeung, P.H.; Yu, Y.S.; Zhang, X.; Wong, K.Y.; Lei, D.Y. Plasmonic Au/TiO2-Dumbbell-On-Film Nanocavities for High-Efficiency Hot-Carrier Generation and Extraction. Adv. Funct. Mater. 2018, 28, 1800383. [Google Scholar] [CrossRef]
- Ghiuță, I.; Cristea, D. Silver Nanoparticles for Delivery Purposes; Elsevier Ltd.: Amsterdam, The Netherlands, 2020; ISBN 9780081029855. [Google Scholar]
- Yaqoob, S.B.; Adnan, R.; Khan, R.M.R.; Rashid, M. Gold, Silver, and Palladium Nanoparticles: A Chemical Tool for Biomedical Applications. Front. Chem. 2020, 8, 376. [Google Scholar] [CrossRef] [PubMed]
- Salleh, A.; Naomi, R.; Utami, N.D.; Mohammad, A.W.; Mahmoudi, E.; Mustafa, N.; Fauzi, M.B. The potential of silver nanoparticles for antiviral and antibacterial applications: A mechanism of action. Nanomaterials 2020, 10, 1566. [Google Scholar] [CrossRef] [PubMed]
- Wang, P.; Tang, H.; Zhang, P. Plasmonic Nanoparticle-based Hybrid Photosensitizers with Broadened Excitation Profile for Photodynamic Therapy of Cancer Cells. Sci. Rep. 2016, 6, 2–9. [Google Scholar] [CrossRef] [PubMed] [Green Version]
- Aghatabay, N.M.; Neshat, A.; Karabiyik, T.; Somer, M.; Haciu, D.; Dülger, B. Synthesis, characterization and antimicrobial activity of Fe(II), Zn(II), Cd(II) and Hg(II) complexes with 2,6-bis(benzimidazol-2-yl) pyridine ligand. Eur. J. Med. Chem. 2007, 42, 205–213. [Google Scholar] [CrossRef] [PubMed]
- Bansal, Y.; Silakari, O. The therapeutic journey of benzimidazoles: A review. Bioorg. Med. Chem. 2012, 20, 6208–6236. [Google Scholar] [CrossRef] [PubMed]
- Wang, M.D.; Shin, D.M.; Simons, J.W.; Nie, S. Nanotechnology for targeted cancer therapy. Expert Rev. Anticancer Ther. 2007, 7, 833–837. [Google Scholar] [CrossRef] [PubMed]
- Manasi, D.; Chandana, M.; Sanjeeb, K. Ligand-based targeted therapy for cancer tissue. Expert Opin. Drug Deliv. 2009, 6, 285–304. [Google Scholar]
- Parveen, S.; Sahoo, S.K. Nanomedicine: Clinical applications of polyethylene glycol conjugated proteins and drugs. Clin. Pharmacokinet. 2006, 45, 965–988. [Google Scholar] [CrossRef]
- Parveen, S.; Sahoo, S.K. Polymeric nanoparticles for cancer therapy. J. Drug Target. 2008, 16, 108–123. [Google Scholar] [CrossRef]
- Kam, N.W.S.; Dai, H. Carbon nanotubes as intracellular protein transporters: Generality and biological functionality. J. Am. Chem. Soc. 2005, 127, 6021–6026. [Google Scholar] [CrossRef] [Green Version]
- Misra, R.; Acharya, S.; Sahoo, S.K. Cancer nanotechnology: Application of nanotechnology in cancer therapy. Drug Discov. Today 2010, 15, 842–850. [Google Scholar] [CrossRef] [PubMed]
- Bray, F.; Ferlay, J.; Soerjomataram, I.; Siegel, R.L.; Torre, L.A.; Jemal, A. Global cancer statistics 2018: GLOBOCAN estimates of incidence and mortality worldwide for 36 cancers in 185 countries. CA. Cancer J. Clin. 2018, 68, 394–424. [Google Scholar] [CrossRef] [PubMed] [Green Version]
- Foks, H.; Janowiec, M. Badania nad pochodnymi pirazyny: 14. Synteza i działanie tuberkulostatyczne pirazynoamidrazonów. Acta Pol. Pharm. 1979, 36, 155–160. [Google Scholar] [PubMed]
- Foks, H.; Buraczewska, M.; Manowska, W.; Sawlewicz, J. Investigation on pyrazine derivatives. Part 1. Synthesis and tuberculostatic action of pyrazinamidrazone 6-chloropyrazinamidrazone and their condensation products with aldehydes and ketones. Diss. Pharm. 1971, 23, 49–58. [Google Scholar]
- Simmons, E.L. Diffuse reflectance spectroscopy: A comparison of the theories. Appl. Opt. 1975, 14, 1380. [Google Scholar] [CrossRef] [PubMed]
- López, R.; Gómez, R. Band-gap energy estimation from diffuse reflectance measurements on sol-gel and commercial TiO2: A comparative study. J. Sol-Gel Sci. Technol. 2012, 61, 1–7. [Google Scholar] [CrossRef]
- Zhou, S.; Shen, S.; Zhao, D.; Zhang, Z.; Yan, S. Evaporation and decomposition of eutectics of cupric chloride and sodium chloride. J. Therm. Anal. Calorim. 2017, 129, 1445–1452. [Google Scholar] [CrossRef]
- Xue, L.; Zhao, F.Q.; Xing, X.L.; Zhou, Z.M.; Wang, K.; Gao, H.X.; Yi, J.H.; Xu, S.Y.; Hu, R.Z. Thermal behavior of 1,2,3-triazole nitrate. J. Therm. Anal. Calorim. 2011, 104, 999–1004. [Google Scholar] [CrossRef]
- Thiagarajan, S.K.; Perumal, K.V.; Shafie, N.H.; Kadir, K.K.A.; Bahari, H. Anti-Proliferative and Apoptotic Induction Effect of Elateriospermum Extract on Human Lung Cancer Cell Line A549. Proceedings 2020, 61, 4. [Google Scholar] [CrossRef]
- Pallavi, S.S.; Rudayni, H.A.; Bepari, A.; Niazi, S.K.; Nayaka, S. Green synthesis of Silver nanoparticles using Streptomyces hirsutus strain SNPGA-8 and their characterization, antimicrobial activity, and anticancer activity against human lung carcinoma cell line A549. Saudi J. Biol. Sci. 2022, 29, 228–238. [Google Scholar] [CrossRef]
- Baker, A.; Iram, S.; Syed, A.; Elgorban, A.M.; Bahkali, A.H.; Ahmad, K.; Khan, M.S.; Kim, J. Fruit Derived Potentially Bioactive Bioengineered Silver Nanoparticles. Int. J. Nanomed. 2021, 16, 7711–7726. [Google Scholar] [CrossRef] [PubMed]
- Ahamed, M.; Akhtar, M.J.; Khan, M.A.M.; Alhadlaq, H.A. A Novel Green Preparation of Ag/RGO Nanocomposites with Highly Effective Anticancer Performance. Polymers 2021, 13, 3350. [Google Scholar] [CrossRef] [PubMed]
- Genchi, G.; Sinicropi, M.S.; Lauria, G.; Carocci, A.; Catalano, A. The effects of cadmium toxicity. Int. J. Environ. Res. Public Health 2020, 17, 3782. [Google Scholar] [CrossRef] [PubMed]
- Ndagi, U.; Mhlongo, N.; Soliman, M.E. Metal complexes in cancer therapy—An update from drug design perspective. Drug Des. Devel. Ther. 2017, 11, 599–616. [Google Scholar] [CrossRef] [PubMed] [Green Version]
- Wolfram, J.; Zhu, M.; Yang, Y.; Shen, J.; Gentile, E.; Paolino, D.; Fresta, M.; Nie, G.; Chen, C.; Shen, H.; et al. Safety of nanoparticles in medicine HHS Public Access This mini-review addresses the safety considerations for nanoparticles in medicine. Curr. Drug Targets 2015, 16, 1671–1681. [Google Scholar] [CrossRef] [PubMed] [Green Version]
- Daina, A.; Michielin, O.; Zoete, V. SwissADME: A free web tool to evaluate pharmacokinetics, drug-likeness and medicinal chemistry friendliness of small molecules. Sci. Rep. 2017, 7, 42717. [Google Scholar] [CrossRef] [PubMed] [Green Version]
- Daina, A.; Michielin, O.; Zoete, V. iLOGP: A simple, robust, and efficient description of n-octanol/water partition coefficient for drug design using the GB/SA approach. J. Chem. Inf. Model. 2014, 54, 3284–3301. [Google Scholar] [CrossRef] [PubMed]
- Daina, A.; Zoete, V. A BOILED-Egg To Predict Gastrointestinal Absorption and Brain Penetration of Small Molecules. ChemMedChem 2016, 11, 1117–1121. [Google Scholar] [CrossRef] [PubMed] [Green Version]
- Lipinski, C.A.; Lombardo, F.; Dominy, B.W.; Feeney, P.J. Experimental and computational approaches to estimate solubility and permeability in drug discovery and development settings. Adv. Drug Deliv. Rev. 2012, 64, 4–17. [Google Scholar] [CrossRef]
- Ghose, A.K.; Viswanadhan, V.N.; Wendoloski, J.J. A knowledge-based approach in designing combinatorial or medicinal chemistry libraries for drug discovery. 1. A qualitative and quantitative characterization of known drug databases. J. Comb. Chem. 1999, 1, 55–68. [Google Scholar] [CrossRef]
- Egan, W.J.; Merz, K.M.; Baldwin, J.J. Prediction of drug absorption using multivariate statistics. J. Med. Chem. 2000, 43, 3867–3877. [Google Scholar] [CrossRef] [PubMed]
- Veber, D.F.; Johnson, S.R.; Cheng, H.Y.; Smith, B.R.; Ward, K.W.; Kopple, K.D. Molecular properties that influence the oral bioavailability of drug candidates. J. Med. Chem. 2002, 45, 2615–2623. [Google Scholar] [CrossRef] [PubMed]
- Muegge, I.; Heald, S.L.; Brittelli, D. Simple selection criteria for drug-like chemical matter. J. Med. Chem. 2001, 44, 1841–1846. [Google Scholar] [CrossRef] [PubMed]
- Yang, H.; Lou, C.; Sun, L.; Li, J.; Cai, Y.; Wang, Z.; Li, W.; Liu, G.; Tang, Y. AdmetSAR 2.0: Web-service for prediction and optimization of chemical ADMET properties. Bioinformatics 2019, 35, 1067–1069. [Google Scholar] [CrossRef] [PubMed]
- Banerjee, P.; Eckert, A.O.; Schrey, A.K.; Preissner, R. ProTox-II: A webserver for the prediction of toxicity of chemicals. Nucleic Acids Res. 2018, 46, W257–W263. [Google Scholar] [CrossRef] [PubMed] [Green Version]
- Plumb, J.A. Cell sensitivity assays: Clonogenic assay. Methods Mol. Med. 2004, 88, 159–164. [Google Scholar] [CrossRef] [PubMed]
- Lee, J.; Peña, M.M.; Nose, Y.; Thiele, D.J. Biochemical characterization of the human copper transporter Ctr1. J. Biol. Chem. 2002, 277, 4380–4387. [Google Scholar] [CrossRef] [PubMed] [Green Version]
- Veronesi, G.; Deniaud, A.; Gallon, T.; Jouneau, P.-H.; Villanova, J.; Delangle, P.; Carrière, M.; Kieffer, I.; Charbonnier, P.; Mintz, E.; et al. Visualization, quantification and coordination of Ag+ ions released from silver nanoparticles in hepatocytes. Nanoscale 2016, 8, 17012–17021. [Google Scholar] [CrossRef] [PubMed] [Green Version]
- Foldbjerg, R.; Jiang, X.; Miclăuş, T.; Chen, C.; Autrup, H.; Beer, C. Silver nanoparticles—Wolves in sheep’s clothing? Toxicol. Res. 2015, 4, 563–575. [Google Scholar] [CrossRef]
- Medici, S.; Peana, M.; Crisponi, G.; Nurchi, V.M.; Lachowicz, J.I.; Remelli, M.; Zoroddua, M.A. Silver coordination compounds: A new horizon in medicine. Coord. Chem. Rev. 2016, 327, 349–359. [Google Scholar] [CrossRef]
- Holmila, R.J.; Vance, S.A.; King, S.B.; Tsang, A.W.; Singh, R.; Furdui, C.M. Silver nanoparticles induce mitochondrial protein oxidation in lung cells impacting cell cycle and proliferation. Antioxidants 2019, 8, 552. [Google Scholar] [CrossRef] [PubMed] [Green Version]
- Swanner, J.; Mims, J.; Carroll, D.L.; Akman, S.A.; Furdui, C.M.; Torti, S.V.; Singh, R.N. Differential cytotoxic and radiosensitizing effects of silver nanoparticles on triple-negative breast cancer and non-triple-negative breast cells. Int. J. Nanomed. 2015, 10, 3937–3953. [Google Scholar] [CrossRef] [Green Version]
- Simard, J.; Durocher, I.; Girard, D. Silver nanoparticles induce irremediable endoplasmic reticulum stress leading to unfolded protein response dependent apoptosis in breast cancer cells. Apoptosis Int. J. Program Cell Death 2016, 21, 1279–1290. [Google Scholar] [CrossRef] [PubMed]
- Kremer, M.L. Mechanism of the Fenton reaction. Evidence for a new intermediate. Phys. Chem. Chem. Phys. 1999, 1, 3595–3605. [Google Scholar] [CrossRef]
- Hernandes, M.S.; Britto, L.R. NADPH oxidase and neurodegeneration. Curr. Neuropharmacol. 2012, 10, 321–327. [Google Scholar] [CrossRef] [PubMed]
- Fatfat, M.; Merhi, R.A.; Rahal, O.; Stoyanovsky, D.A.; Zaki, A.; Haidar, H.; Kagan, V.E.; Gali-Muhtasib, H.; Machaca, K. Copper Chelation Selectively Kills Colon Cancer Cells through Redox Cycling and Generation of Reactive Oxygen Species. BMC Cancer 2014, 14, 527. [Google Scholar] [CrossRef] [PubMed] [Green Version]
- Rohde, M.M.; Snyder, C.M.; Sloop, J.; Solst, S.R.; Donati, G.L.; Spitz, D.R.; Furdui, C.M.; Singh, R. The mechanism of cell death induced by silver nanoparticles is distinct from silver cations. Part Fibre Toxicol. 2021, 18, 37. [Google Scholar] [CrossRef]
- Ebrahiminezhad, A.; Raee, M.J.; Manafi, Z.; Sotoodeh Jahromi, A.; Ghasemi, Y. Ancient and Novel Forms of Silver in Medicine and Biomedicine. J. Adv. Med. Sci. Appl. Technol. 2016, 2, 122. [Google Scholar] [CrossRef] [Green Version]
- Kanniah, P.; Chelliah, P.; Thangapandi, J.R.; Gnanadhas, G.; Mahendran, V.; Robert, M. Green synthesis of antibacterial and cytotoxic silver nanoparticles by Piper nigrum seed extract and development of antibacterial silver based chitosan nanocomposite. Int. J. Biol. Macromol. 2021, 189, 18–33. [Google Scholar] [CrossRef]
- Chugh, H.; Sood, D.; Chandra, I.; Tomar, V.; Dhawan, G.; Chandra, R. Role of gold and silver nanoparticles in cancer nano-medicine. Artif. Cells Nanomed. Biotechnol. 2018, 46, 1210–1220. [Google Scholar] [CrossRef] [PubMed]


| Sample | Ligand | Cu(L)Cl2 | Zn(L)Cl2 | Cd(L)Cl2 |
|---|---|---|---|---|
| Eg, eV | 2.74 | 2.48 | 2.69 | 2.76 |
| Material | Mass Loss after 1st Measurement/% | Thermal Effect/°C | |||
|---|---|---|---|---|---|
| Type | Onset | Max | Endset | ||
| L | 98.6 | Endo | 162.2 | 166.6 | 179.8 |
| Cu(L)Cl2 | 50.0 | Exo | 165.5 | 176.0 | 209.4 |
| Endo | 332.0 | 334.5 | 343.3 | ||
| Endo | 376.7 | 388.0 | 404.2 | ||
| Zn(L)Cl2 | 33.2 | Exo | 293.3 | 301.6 | 306.7 |
| Endo | 614.4 | 615.4 | 618.5 | ||
| Cd(L)Cl2 | 56.3 | Exo | 304.8 | 311.5 | 318.4 |
| Compound | IC50 (mg/mL) |
|---|---|
| Ligand (L) | 0.173 ± 0.014 |
| Cu(L)Cl2 | 0.113 ± 0.011 |
| Zn(L)Cl2 | 0.179 ± 0.016 |
| Cd(L)Cl2 | 0.052 ± 0.006 |
| Ligand (L) with silver nanoparticles | 0.227 ± 0.030 |
| Cu(L)Cl2 with silver nanoparticles | 0.122 ± 0.010 |
| Zn(L)Cl2 with silver nanoparticles | 0.172 ± 0.020 |
| Cd(L)Cl2 with silver nanoparticles | 0.040 ± 0.006 |
Publisher’s Note: MDPI stays neutral with regard to jurisdictional claims in published maps and institutional affiliations. |
© 2022 by the authors. Licensee MDPI, Basel, Switzerland. This article is an open access article distributed under the terms and conditions of the Creative Commons Attribution (CC BY) license (https://creativecommons.org/licenses/by/4.0/).
Share and Cite
Czylkowska, A.; Rogalewicz, B.; Szczesio, M.; Raducka, A.; Gobis, K.; Szymański, P.; Czarnecka, K.; Camargo, B.C.; Szczytko, J.; Babich, A.; et al. Antitumor Activity against A549 Cancer Cells of Three Novel Complexes Supported by Coating with Silver Nanoparticles. Int. J. Mol. Sci. 2022, 23, 2980. https://doi.org/10.3390/ijms23062980
Czylkowska A, Rogalewicz B, Szczesio M, Raducka A, Gobis K, Szymański P, Czarnecka K, Camargo BC, Szczytko J, Babich A, et al. Antitumor Activity against A549 Cancer Cells of Three Novel Complexes Supported by Coating with Silver Nanoparticles. International Journal of Molecular Sciences. 2022; 23(6):2980. https://doi.org/10.3390/ijms23062980
Chicago/Turabian StyleCzylkowska, Agnieszka, Bartłomiej Rogalewicz, Małgorzata Szczesio, Anita Raducka, Katarzyna Gobis, Paweł Szymański, Kamila Czarnecka, Bruno Cury Camargo, Jacek Szczytko, Alexey Babich, and et al. 2022. "Antitumor Activity against A549 Cancer Cells of Three Novel Complexes Supported by Coating with Silver Nanoparticles" International Journal of Molecular Sciences 23, no. 6: 2980. https://doi.org/10.3390/ijms23062980