1. Introduction
Bone is a metabolically active and dynamic organ that remodels throughout life by coordinated activities of bone-resorbing osteoclasts and bone-forming osteoblasts. Mechanical loading plays an important role in the maintenance of bone density, but knowledge of the cellular and molecular biology of mechanosensing remains limited. Mature bone is removed by remodeling that occurs as an adaptive response to different factors, including mechanical loading and replacement of damaged bone following micro- and macrofractures. Studies [
1,
2] have uncovered the initial molecular mechanisms of
ZIC1 osteocyte actions and implicated a role in human bone pathophysiology. Previously,
ZIC1 had been related to craniofacial developmental defects [
3]. Its function was further assessed in a large-scale GWAS meta-analysis focusing specifically on BMD variation in the skull, finding 4 novel loci among 59 with genome-wide significance, including
ZIC1 [
4]. The gene was further screened in zebrafish crispants that displayed low skull BMD and abnormal suture patterning [
4].
Both osteogenic cell types, osteoblasts and osteocytes, act as mechanosensors and transduce mechanical loading forces into inter- and intracellular biochemical signals [
5]. Osteocytes, the most abundant cell type, have many unique characteristics that make them ideal mechanosensors [
6,
7,
8]. In addition to their large number and special distribution in bone, the cells show special morphological features and cell–cell connectivity with each other and several other types of bone cells [
7]. The molecular details of how external mechanical load is transmitted to individual cells and specifically to osteocytes have not yet been established. Furthermore, how mechanical loading contributes to the etiology of postmenopausal osteoporosis, a condition of increased bone resorption and fragile bones, is not yet fully elucidated.
The relative significance and contribution of the force, arising from fluid and tissue tethering, in transmitting macroscopic mechanical loading to the microscopic cellular level is uncertain. In addition, mechanical forces acting upon bone generate electrical potentials [
9], but their possible physiological importance in influencing the activity of bone cells is unknown.
Skeletal cells, osteoblasts and especially osteocytes respond to mechanical loading by producing a variety of cascading biochemical signals, a process whereby mechanical stress is translated to a biological response [
5,
10,
11]. Mechanically activated osteocytes and osteoblasts modulate several signaling systems; among these, the Wnt/β-catenin pathway clearly plays a powerful role in the regulation of bone mass and new bone formation [
12,
13]. Previously, it was reported that the zinc finger protein of the cerebellum (
ZIC1) may mediate fluid-flow-shear-stress-induced modulation by activating the TCF/LEF transcription factor in cell culture [
1]. ZIC proteins have been shown to be potential modulators of the hedgehog-mediated signaling pathway and can interact with all GLI proteins, including the repressive form. GLI proteins function downstream of the hedgehog signaling pathway and act as both transcriptional activators and repressors [
14,
15]. How mechanical loading influences the epigenetic and genetic mechanisms and its downstream effect on the skeletal cell transcriptome and protein translation is, however, not known.
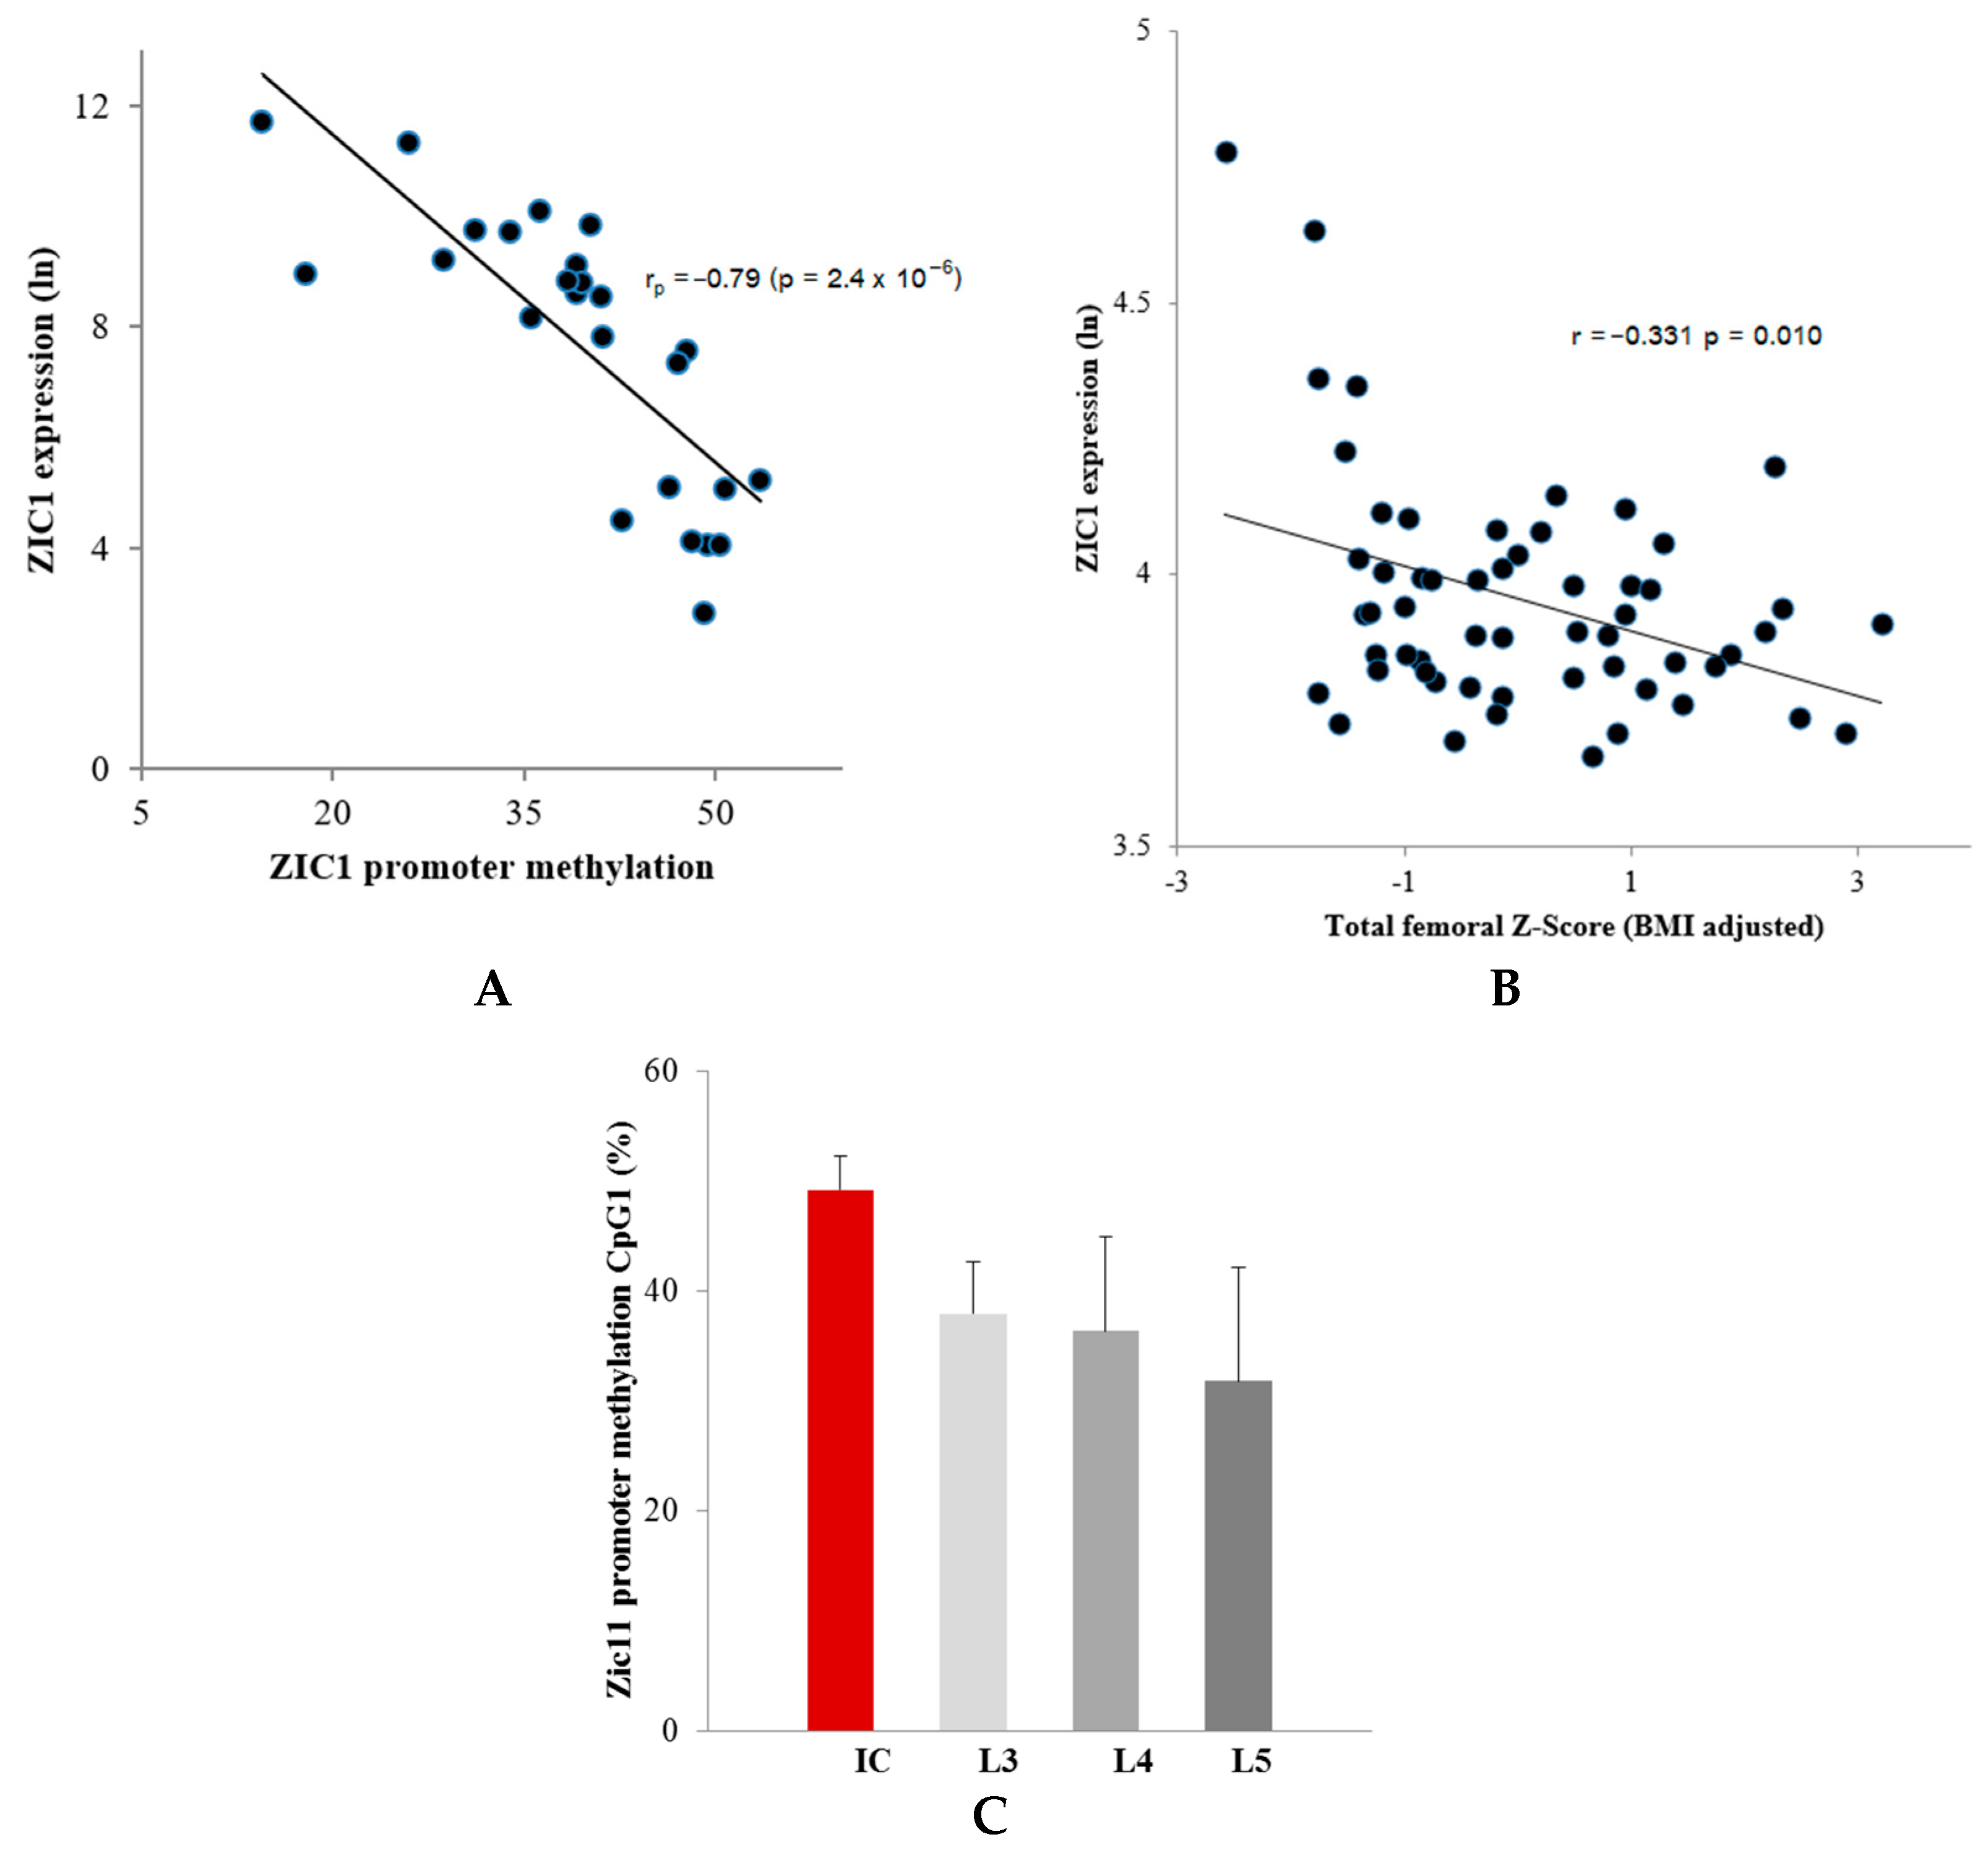
This study investigated whether modulation of the ZIC1 transcription factor at skeletal sites of high stress in postmenopausal healthy and osteoporotic women was accompanied by DNA methylation changes measured in trabecular bone biopsies. ZIC1 promoter methylation was significantly lower in bone taken from the lumbar spine compared to the relatively less mechanically stressed os ilium. The extent of DNA methylation of ZIC1 was linearly negatively correlated with ZIC1 expression. ZIC1 mRNA levels in biopsies from the iliac of postmenopausal women showed significant inverse correlation with BMD and were significantly higher in women with osteoporosis than in healthy controls. ZIC1 promoter methylation was also correlated with ZIC1 mRNA levels in bone cell cultures, which corroborates its intracellular role in mechanosensing and bone turnover.
3. Discussion
It is generally accepted that external loading influences bone cells in two main ways: as a shear force and through cellular deformation [
18,
19]. The bone matrix, a heterogeneous structure, may act as a stress conductor and amplify the strain experienced by the osteocytes by as much as 15-fold compared to that experienced by the macroscopic bone [
18,
19,
20].
We therefore studied bone biopsies taken from high or low mechanical loading sites representing elevated and suppressed bone turnover, respectively, and found a close negative correlation between ZIC1 promoter methylation and gene expression. At the site of high loading and increased bone turnover, ZIC1 mRNA expression was elevated, and ZIC1 promoter methylation was reduced. In contrast, in the iliac bone, a site of low mechanical loading, ZIC1 mRNA expression was substantially lower. A strong correlation between ZIC1 expression and transcripts characteristically expressed in osteoblasts, osteocytes and osteoclasts was documented. We then investigated a possible association between the transcription factor and osteoporosis and BMD in transiliac bone biopsies from postmenopausal Norwegian women and found a negative correlation between total, spinal and hip BMD Z-scores, respectively, and ZIC1 expression. The correlation was even stronger when BMD was adjusted for BMI variation. Therefore, this is the first study to link skeletal epigenetic changes with mechanical stresses and associated increase in bone turnover. The study also demonstrates an association between ZIC1 expression, the degree of ZIC1 promoter methylation, bone turnover and BMD.
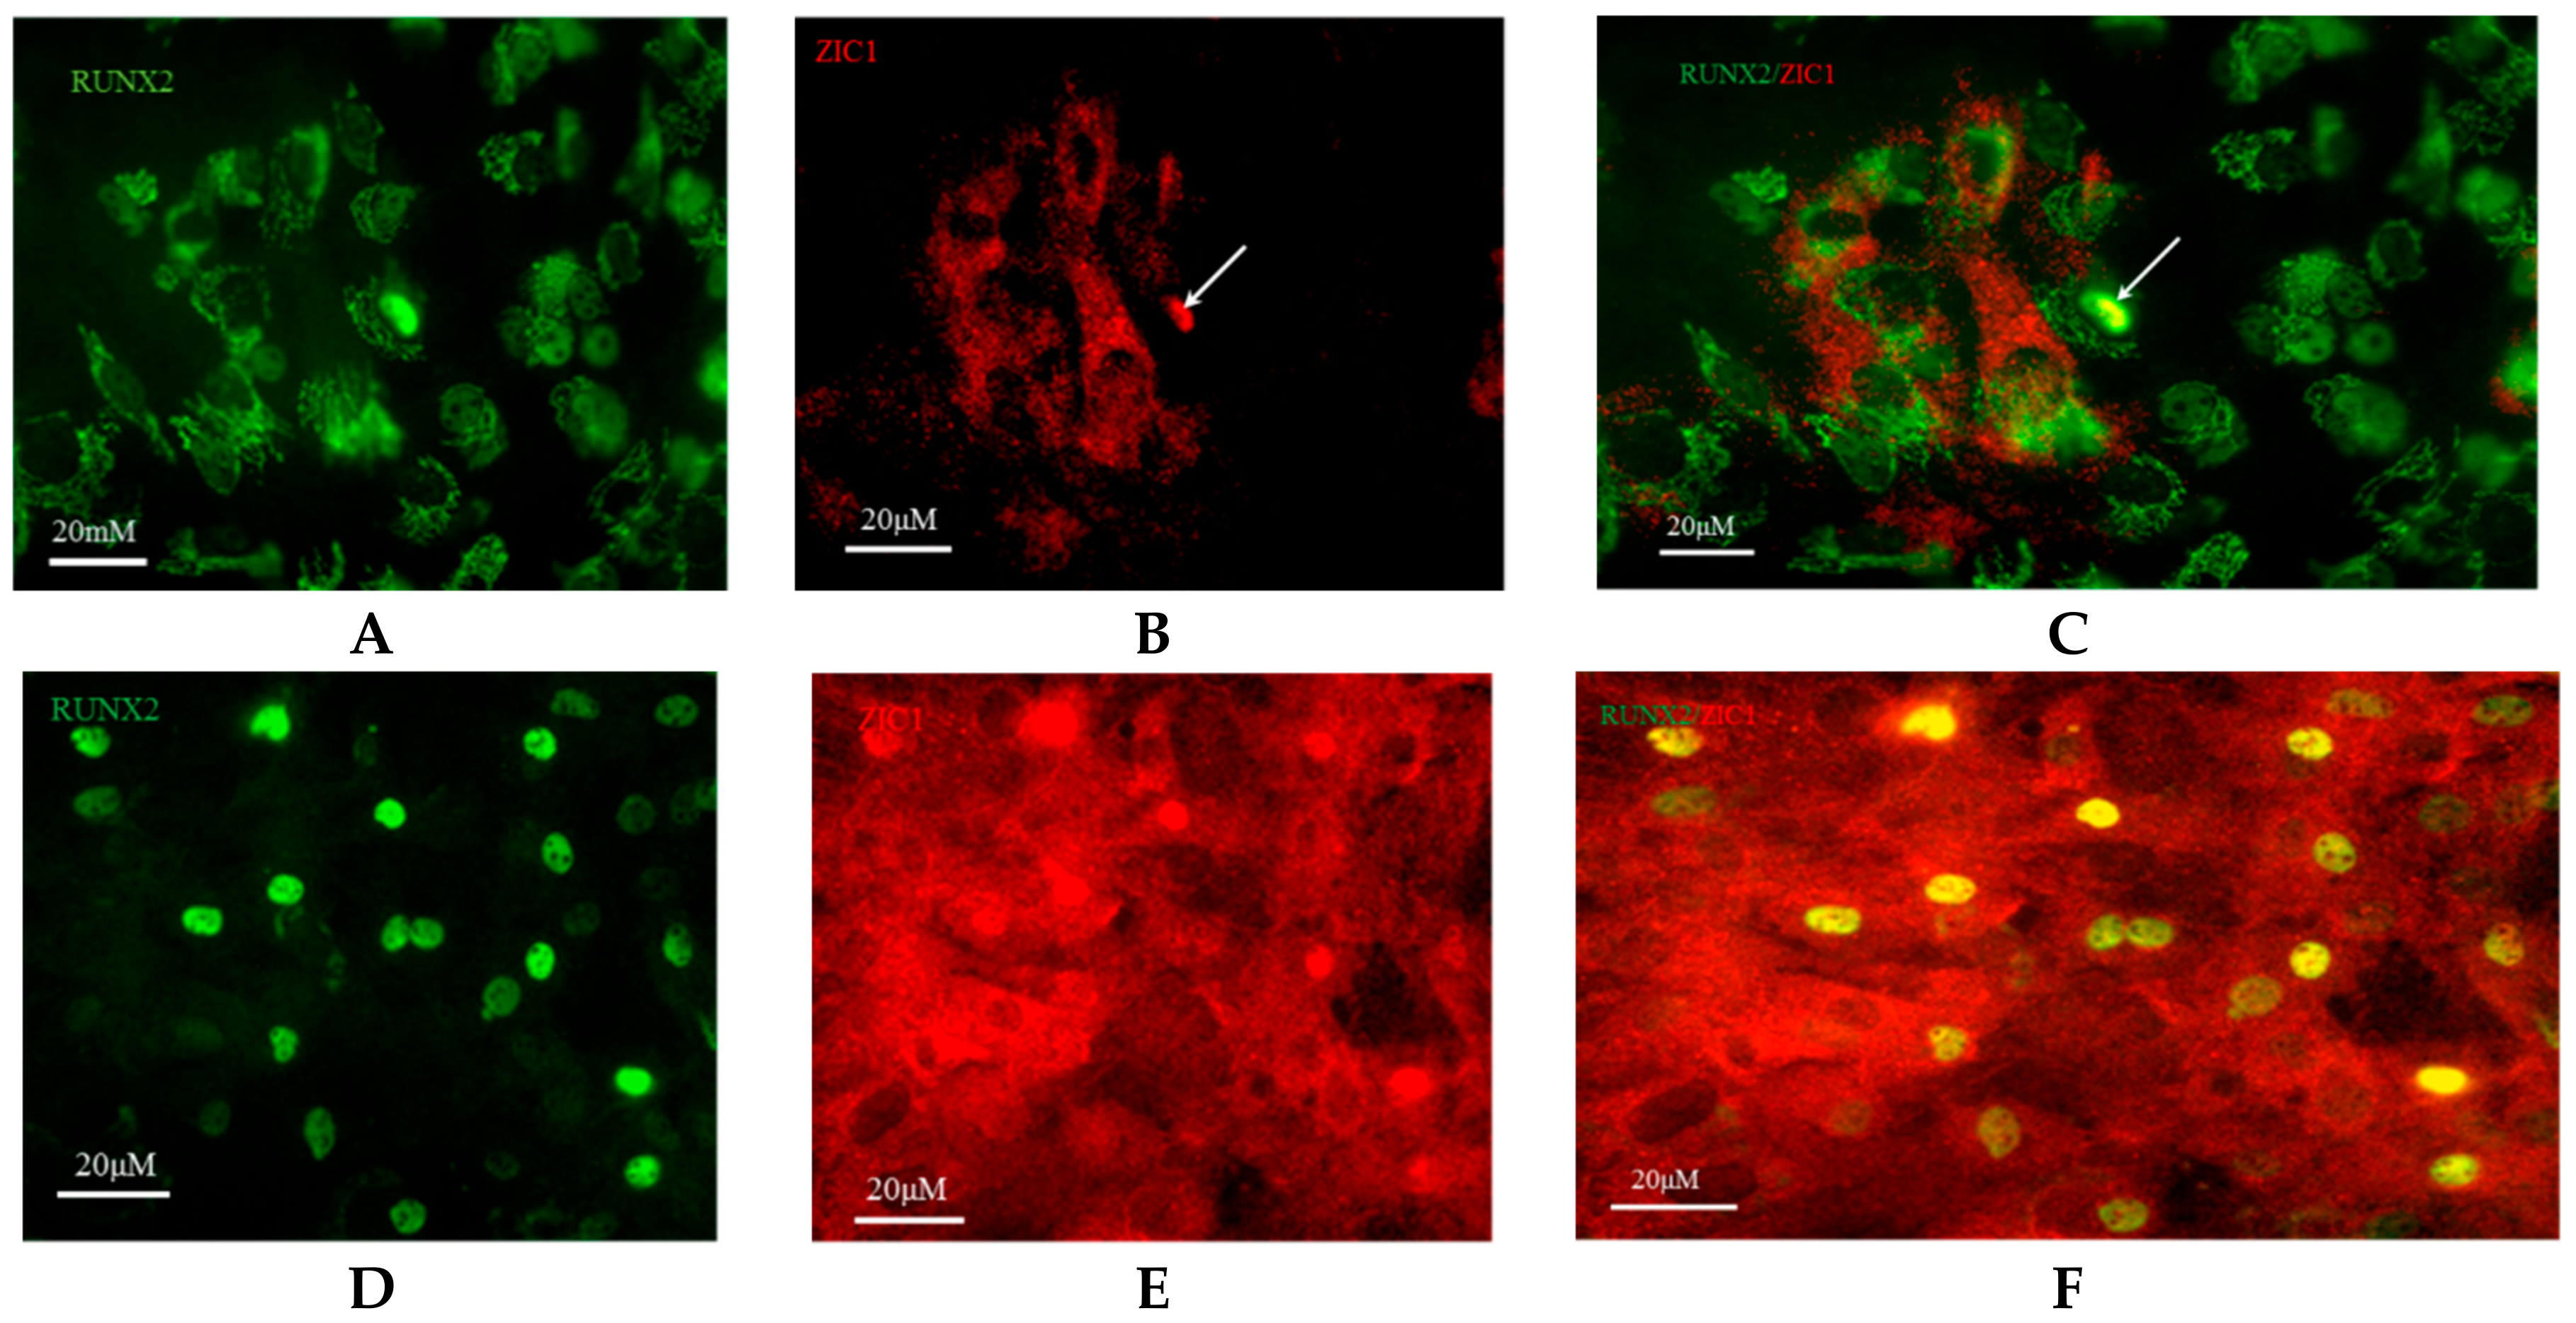
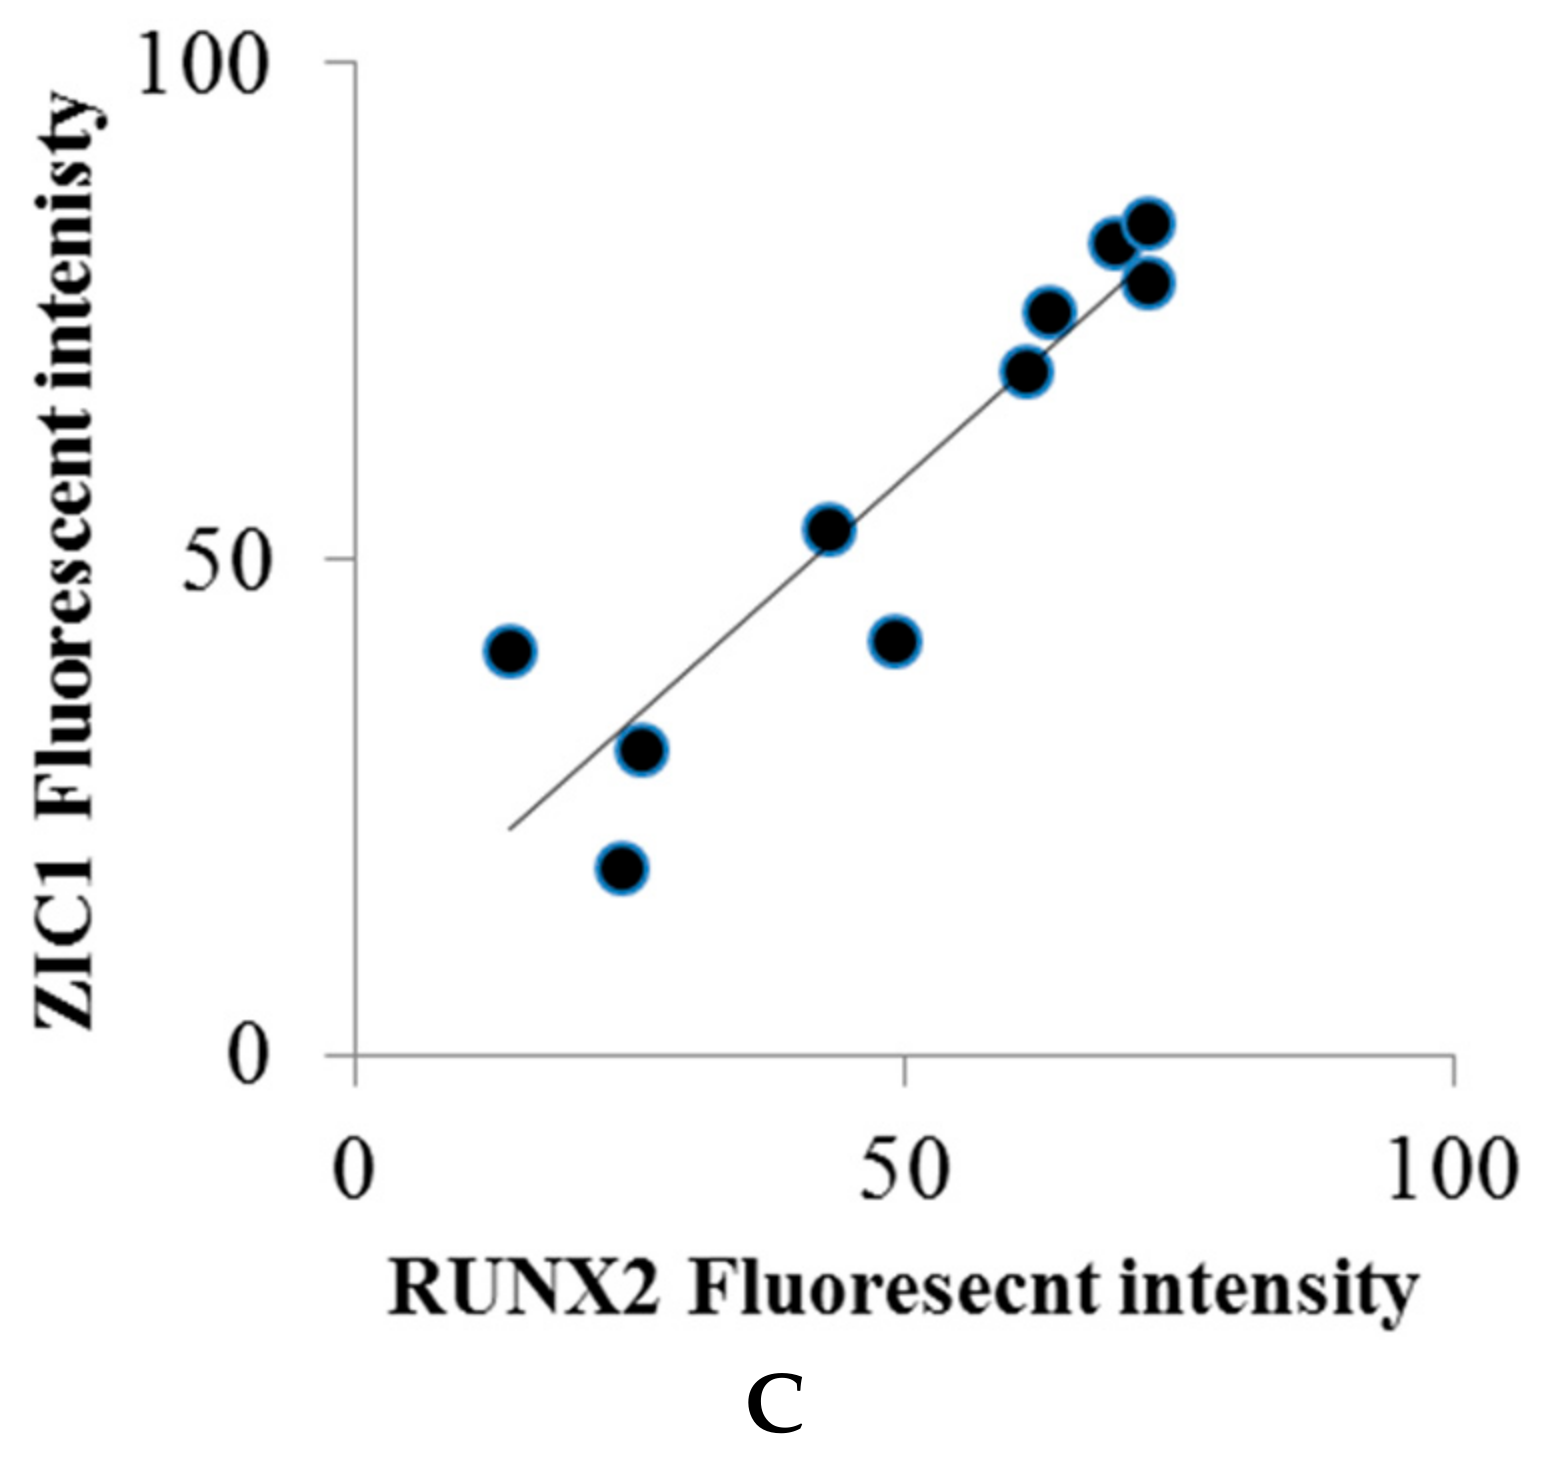
To corroborate ex vivo observations in human bone biopsies, we studied the effects of mechanical stresses (FSS) on the modulation of key osteogenic genes,
ZIC1 mRNA expression and its promoter methylation in cultured cells. We asked whether mechanical stress could upregulate
ZIC1 mRNA in isolated rat osteoprogenitor cells, whcih possess osteogenic potential and affect the osteogenic response. The transcriptional response of the cells to FSS in a two-armed study (mechanically strained vs. static cells) was carried out to rule out factors other than FSS affecting the osteogenic response of the cells. Following the application of mechanical strain, the expression of genes associated with osteogenic differentiation (
Alp,
Runx2 and
Col1a1) and genes of interest that might play a role in mediating the effect of FSS (
Taz,
Gli3 and
Zic1) were determined (
Figure 3A–C). Immunocytochemical localization of
ZIC1 and
RUNX2 in rat osteoprogenitor cells subjected to FSS was further compared with controls and showed increased
ZIC1 and
RUNX2 levels. Intense staining for
RUNX2 was found in the nuclei, and we also demonstrated a significant
ZIC1 co-localisation (
Figure 4A–F). The fluorescent intensity of
ZIC1 and
RUNX2 in the cells was found to be significantly positively correlated (
Figure 5C). A comparative analysis of the expression of osteogenic marker genes and
Zic1 in rat osteoprogenitor cells subjected to FSS with static controls suggested that FSS was essential for the induction, promotion and maintenance of an osteogenic phenotype in ROPs (rat osteoprogenitors). Furthermore, FSS leads
to ZIC mRNA induction.
It was notable that
ZIC1 promoter methylation was markedly distinct at 20 CpG sites between loaded LS and unloaded IB bone and presented a strong negative correlation with
ZIC1 mRNA levels (
Table 1A,B) (
Figure 1A). The expression of
ZIC1 was also strongly inversely correlated with age and BMI-adjusted BMD in postmenopausal women. This may be explained by
ZIC1 as an important sensor molecule in coupling bone stress to biological responses regulating bone remodeling.
ZIC1 may respond to increased load with enhanced gene transcription. Osteocytes/osteoblasts in osteoporotic subjects (OP) with thinner and fewer trabeculae endure enhanced load and possibly microfractures and respond to this by increased
ZIC1 transcriptional activity, possibly as a result of hypo methylation. We attempted to corroborate this hypothesis with our experiments using osteogenic cell cultures.
The importance and relevance of DNA methylation of genes involved in bone metabolism are underscored by several papers demonstrating associations. For example, we have previously shown that DNA methylation of SOST in bone is associated with fracture risk PMID: 25155887. Additionally, as reviewed PMID: 33569383, PMID: 33921902 several osteogenic differentiation markers and genes involved in bone metabolism have been shown to be regulated by DNA methylation, including RUNX2, SP7(OSX), ALP, RANKL, and OPG.
It has been previously shown that a shear-stress-induced increase in T-cell factor/lymphoid enhancer factor transcriptional activity in osteogenic cells was abolished by
ZIC1 silencing, implying that
ZIC1 has an important role in shear flow mechanotransduction [
1]. In order to establish whether observed changes in
ZIC1 epigenetic promoter and accompanying increased
ZIC1 mRNA expression were causally linked to mechanical loading, we subjected rat osteogenic cells and human osteoblast-like cells (SAOS2) to FSS.
SAOS2 and HSF cells were used to study ZIC1 promotor methylation before and after 12 h of fluid shear stress, conditions proven to activate the osteogenic response, but induced no statistical differences in either cell type. For the reasons unknown, the degree of basal ZIC1 promoter methylation differed markedly between the two cell types, as did ZIC1 expression. It is possible that FSS, over hours, may not represent a suitable in vitro model for DNA methylation caused by inductive stress. However, in vivo bone anabolic response can never be fully mimicked in in vitro cell culture experiments. This is particularly the case when it involves regulation of complex signal–transductions reactions as initiated by ZIC1 activation of osteocytes located in bone lacunae.
Despite considerable progress in identifying mechanosensing and mechanotransduction-signaling molecules and pathways, there is a lack of knowledge as to how the transmitted information from the membrane is converted into transcriptional changes. An earlier comparison [
2] of global gene expression using microarrays (human Affymetrix gene chip) in human bone samples from sites that experience high and low levels of mechanical stress, lumbar spine and iliac crest, respectively, revealed that
ZIC1 was significantly upregulated in the lumbar spine compared to the iliac crest. More recently, we showed that that the zinc finger protein of the cerebellum (
ZIC1) plays an important role in shear flow mechanotransduction in osteocytes and osteoblasts, as well as activation of the primary cilia to mechanotransduction in bone [
1]. Therefore, we investigated whether stress-related increased expression of
ZIC1 was accompanied by epigenetic changes by comparing
ZIC1 promoter DNA methylation in male iliac crest and lumbar spine. Trabecular bone was used, as it has an extensive surface representing the main site of bone metabolic activity.
ZIC1 promoter methylation was significantly lower in the lumbar spine than in the iliac crest, and the extent of DNA demethylation was linearly negatively correlated with
ZIC1 gene expression (
Table 1A,
Figure 1A).
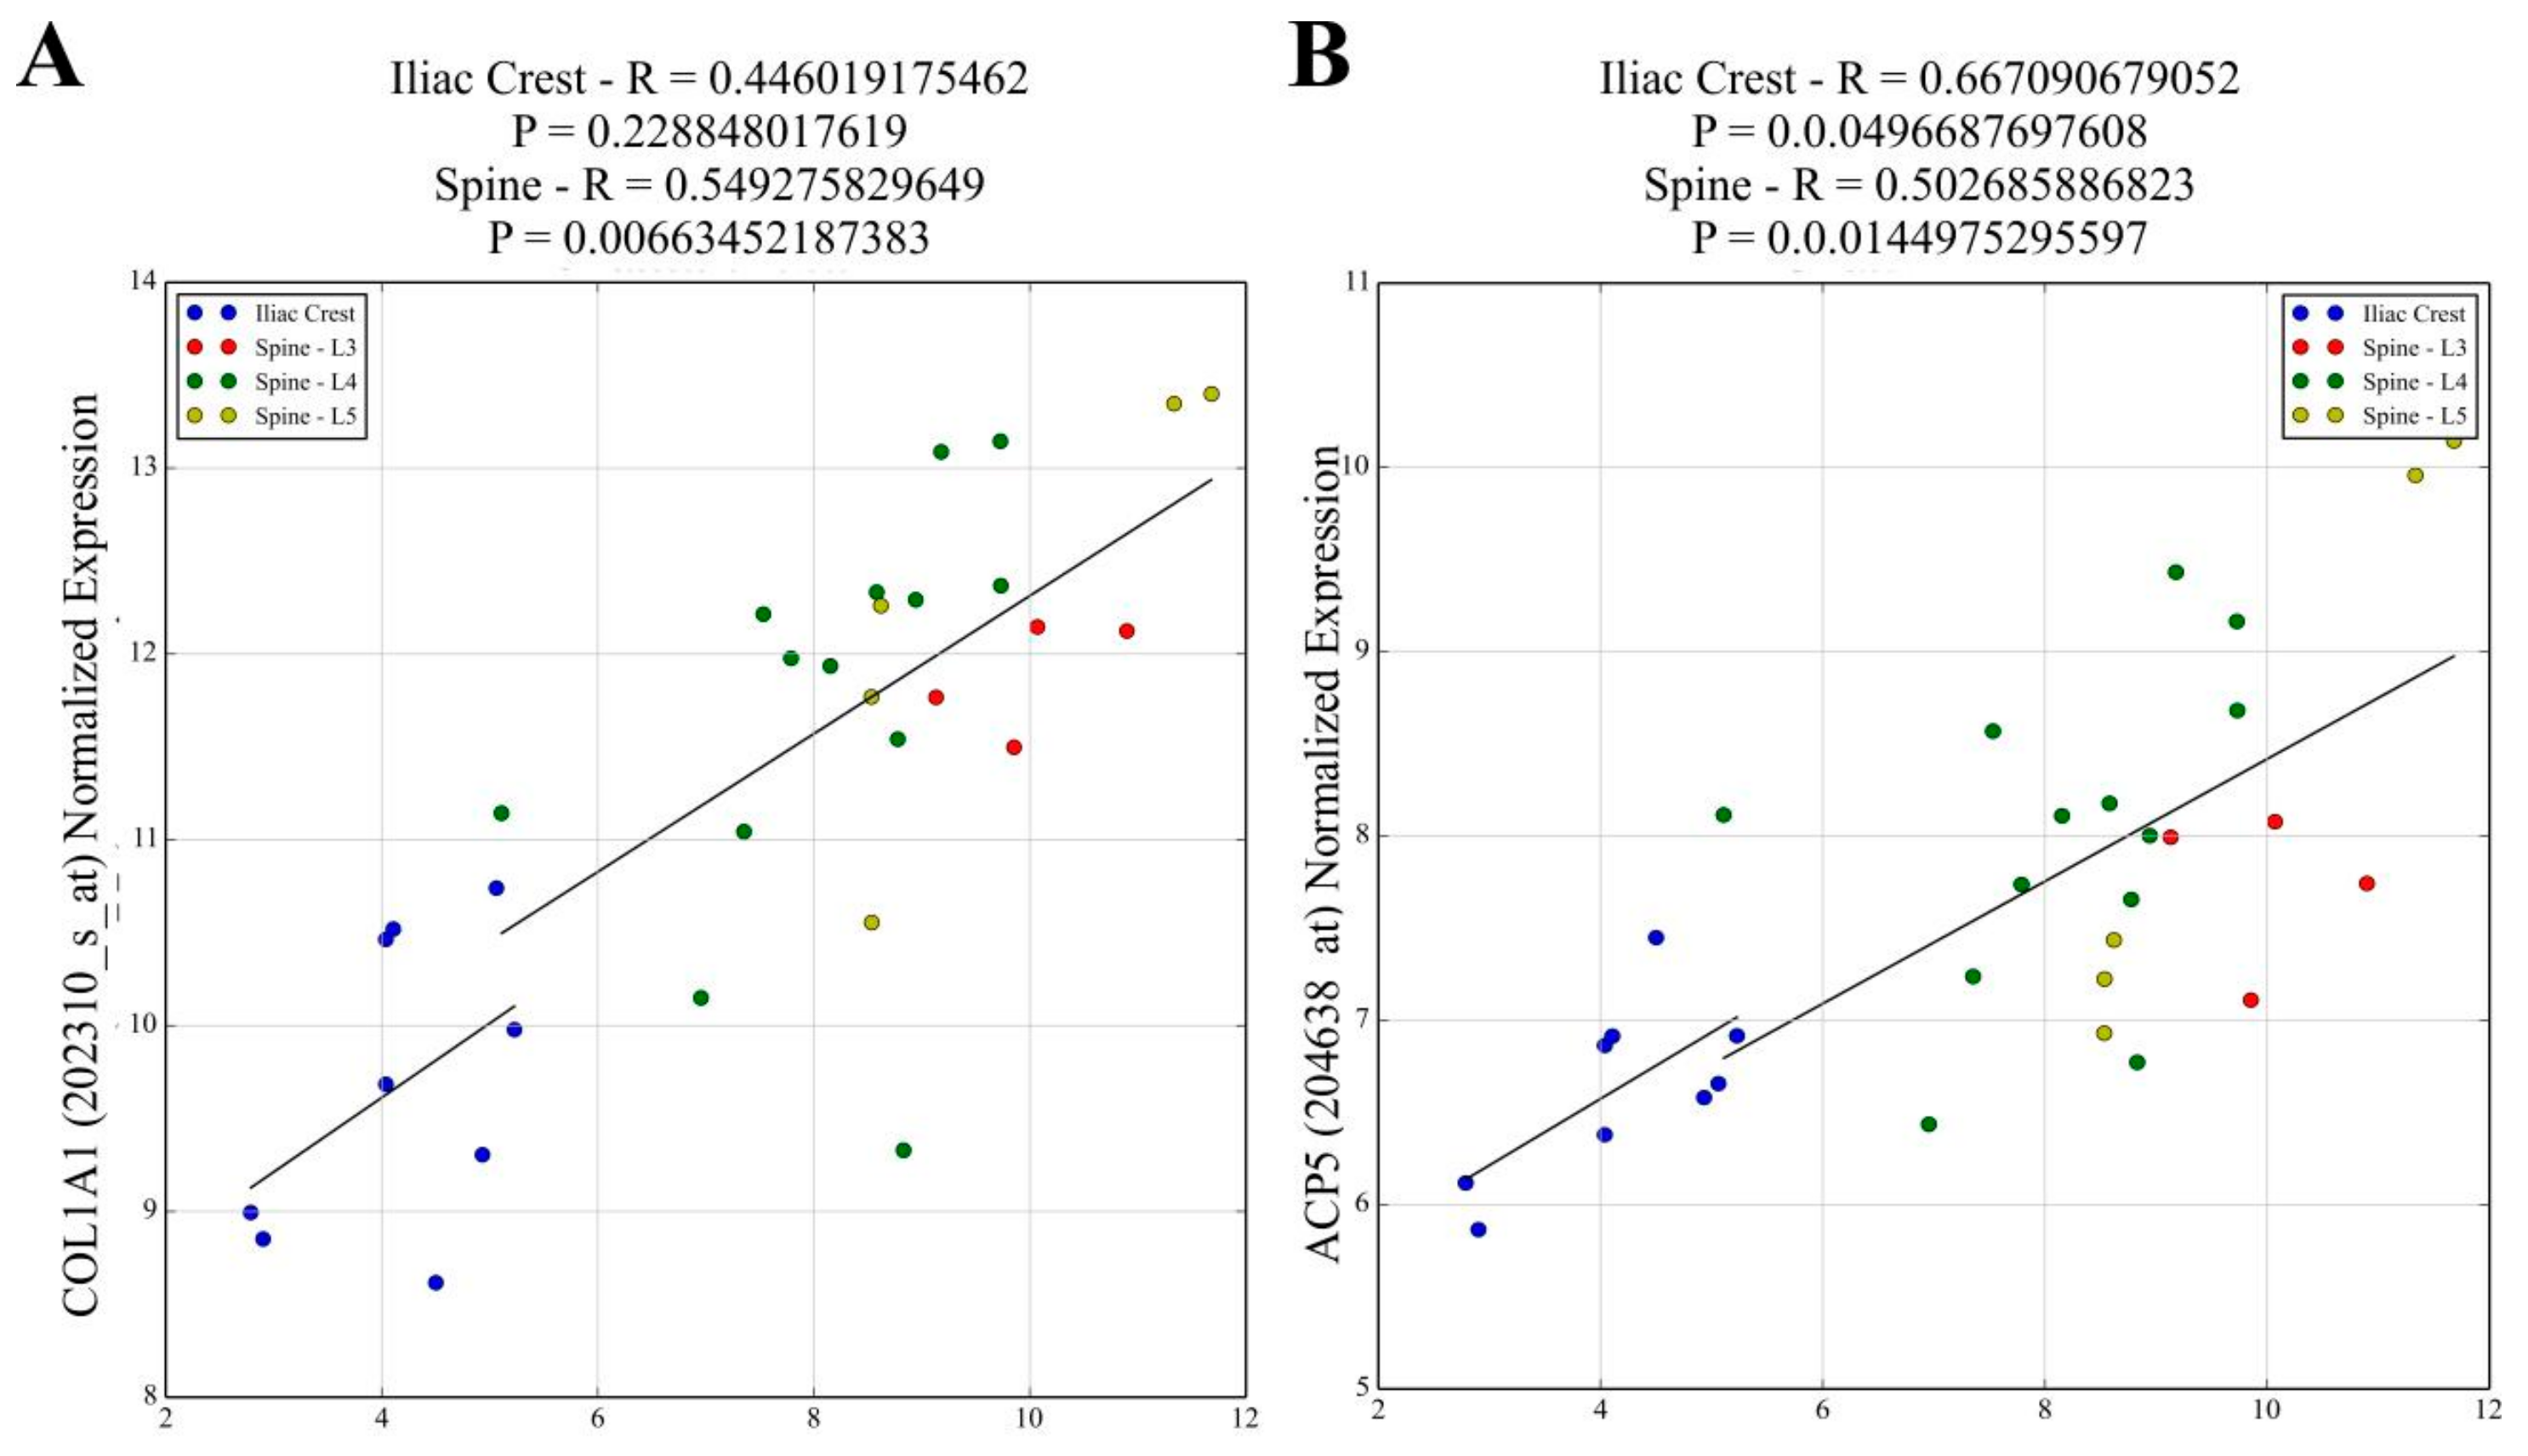
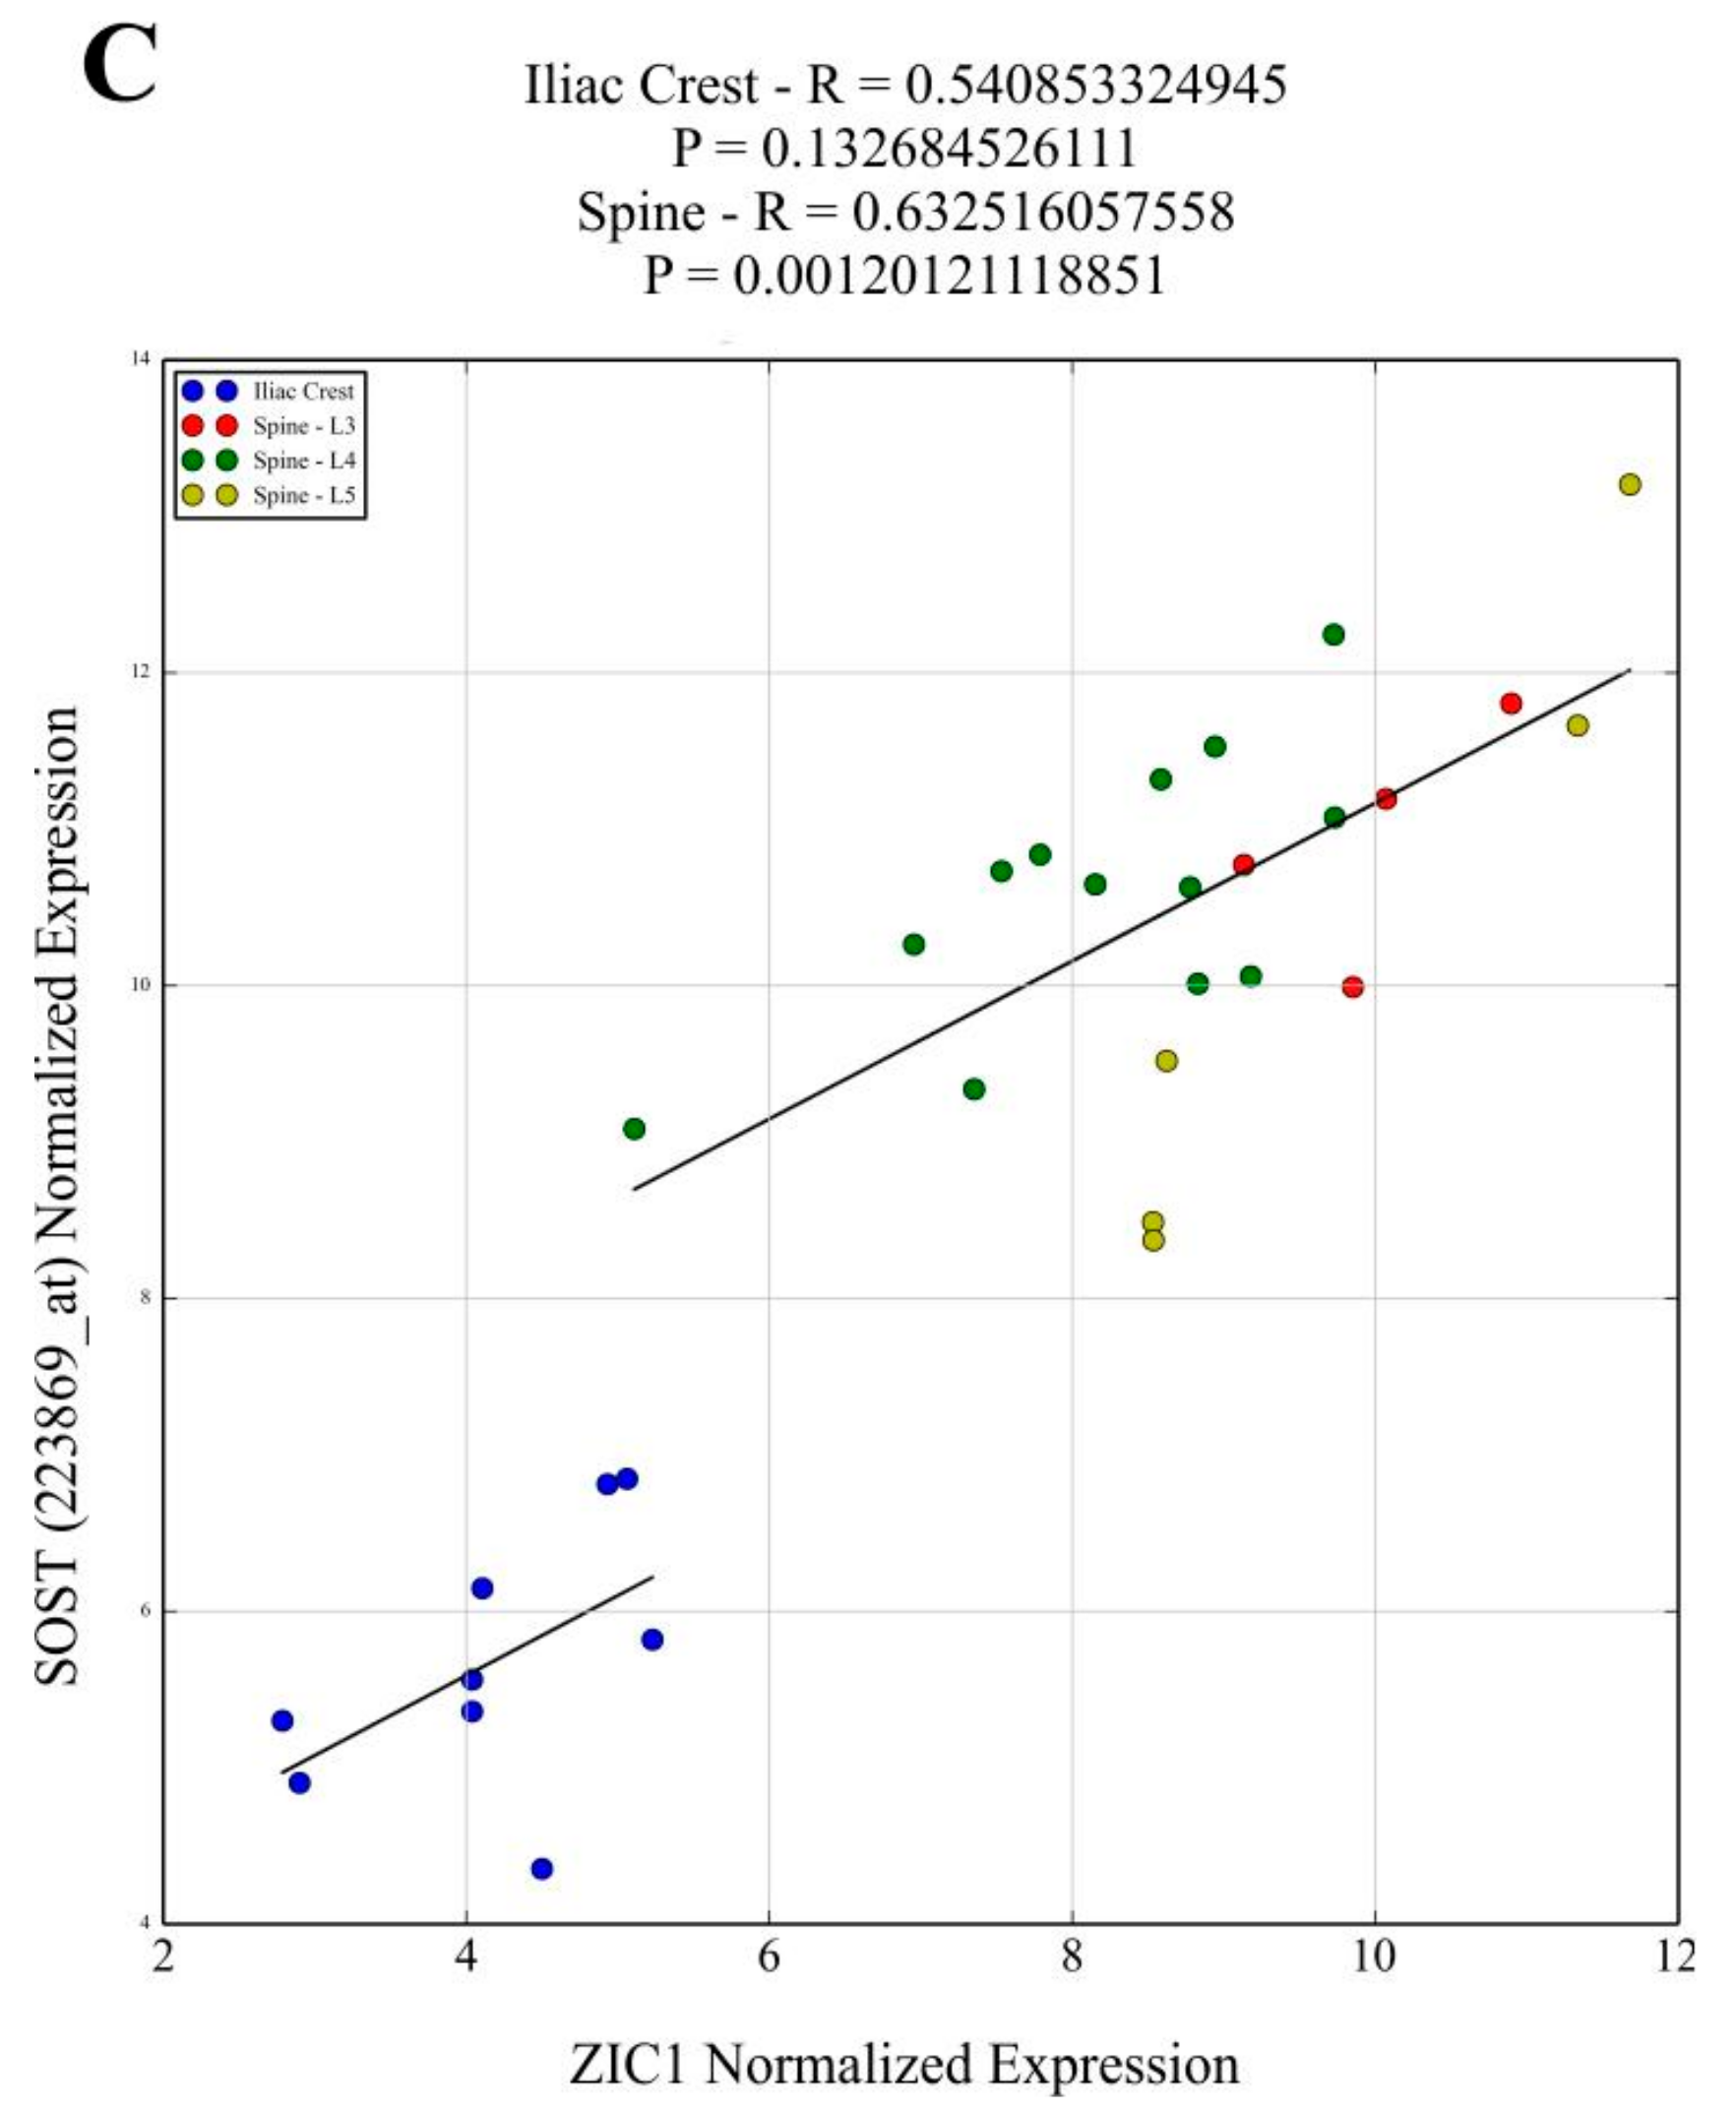
The
ZIC1 expression in human trabecular bone was positively correlated with osteoinductive bone morphogenetic protein 2 (
BMP2) (
Supplementary Figure S1A). The possible role of ZIC1 in promoting osteogenesis was underlined by its significant positive correlation with transcripts characteristically associated with osteogenic cells, osteocytes (
SOST,
DKK1 and
PDPN) and osteoblasts (
COL1A1,
BGLAP,
SPP1,
CDH11 and
PTHR1) and common to both cell types (
RUNX2,
IBSP and
MEPE) (
Figure 2 and
Supplementary Figure S1). A few transcripts associated with osteoclast activity showed positive correlation (
CTSK and
ARC5) with
ZIC1 expression, whereas
OSCAR showed inverse correlation (
Supplementary Figure S1B). The observations reported in this paper combined with those from earlier work establish that
ZIC1 upregulation at sites of high stress and high bone turnover has an important role in mechanical-stress-induced increases in osteogenic differentiation and osteoblast and osteocyte activity. The present data suggest that this increase in
ZIC1 expression in human trabecular bone was the result of reduced methylation at its promoter region.
Finally, the results also suggest that increased mechanical loading and stress present in the fewer and thinner trabeculae in osteoporotic bone with ensuing reduced
ZIC1 promoter methylation is likely a compensatory mechanism aiming to increase
ZIC1 transcription and bone formation. Additionally, the expression of
SOST/sclerostin, an important negative regulator of the Wnt receptor anabolic pathway, is compensatory reduced at the mRNA and protein level in osteoporotics, accompanied by hypermethylation of its promotor [
21]. Since
ZIC1 expression is increased, whereas
SOST expression is reduced at low BMD, a positive correlation between
SOST and
ZIC1 mRNA levels may appear paradoxical. However, the results make sense if both transcripts change their expression as compensatory mechanisms attempting to counteract the bone loss.
4. Material and Methods
4.1. Male Participants
All participants were Caucasian men (
n = 13) from the northeast of England, U.K. The vertebral biopsies from these subjects were collected whilst they were undergoing spinal fusions or spinal decompression laminectomies of the lumbar spine (LS). The study was conducted as per ethical principles for medical research involving human subjects expressed in the World Medical Association Declaration of Helsinki. The study was commenced after ethical approval was obtained from the Institutional Review Board of Northumberland Local Research Ethics Committee, Blyth, Northumberland NE24 2AG (REC 09/05/2005; Reference: 04/Q0902/29). Informed written consent was obtained from all the study participants. All possible secondary causes of bone loss were excluded by relevant detailed medical history. Medical examination and a range of laboratory investigation are detailed in
Supplementary Materials. Patients with a history of oral glucocorticoids, bone preservation agents, anticoagulants or anticonvulsants were excluded [
2]. The mean ± SD (range) of anthropometric indices and BMD, given as areal density, is presented in
Supplementary Table S1.
4.2. Female Participants
The female participants were a randomly selected subset (
n = 57) from the ‘Osteogene Study’ cohort comprised of 84 Norwegian women (50–86 years) with a varying range of BMDs who were free of metabolic bone disease. All these subjects were recruited at the outpatient clinic of Lovisenberg Diaconal Hospital, Oslo (
Supplementary Table S4).
Transiliac bone biopsies were obtained from ilia at the same location as described previously [
16]. The power of the cohort has been previously reported [
16,
17].
4.3. RNA Purification and Gene Expression Analysis
Microarray analysis of total RNA on HG-U133 plus 2.0 chips (Affymetrix Santa Clara, CA, USA) was performed as previously described [
2]. TaqMan gene expression analysis (real-time RT-PCR validation) of selected transcripts (
n = 21) (as per the manufacturer’s instructions), together with the ribosomal protein L41 (RPL41) as internal standard [
17], was used to control the reproducibility of the analysis on the chips. The rationale for selecting ribosomal protein L41 (RPL41) as an internal standard was that Affymetrix analyses had shown a similar magnitude of signal in the female bones (10,895 ± SD 315). The relevant female data were submitted to the EMBL-EBI (European Bioinformatics Institute) ArrayExpress repository (accession number: E-MEXP-1618); the male data can be accessed at the same site (accession number: E-MEXP-2219).
4.4. Bone Biopsies
To avoid possible anatomical-site-related variability, all bone biopsies were trabecular and were taken from a specific iliac site, namely two centimetres distal to the iliac crest and two centimetres posterior from the anterior superior iliac spine [
17]. To avoid interoperator variability, all biopsies were collected under the supervision of one named senior surgeon, who was instructed to avoid attached tissue and muscle.
Likewise, male biopsies from the lumbar spine were also trabecular. These were primarily from the lamina process of lumbar vertebrae (L2, L3 or L4), whereas 19 biopsies from the vertebral lamina of the LS and 5 biopsies were from the iliac crest (IB).
Affymetrix ZIC1 signal values were correlated with signal values for the transcripts reflecting osteocyte (SOST, PDPN and MEPE), osteoblast (COL1A1, IBSP, SPARC, BGLAP and CDH11), osteoblast differentiation (BMP2 and RUNX2), and osteoclast activity (CALCR and OSCAR).
4.5. Global Methylation Analyses
Analysis of the DNA obtained from iliac bone biopsies was performed using an Infinium HumanMethylation450 BeadChip (Illumina) as per the manufacturer’s instructions. This allowed for detection of the methylation status of 485,000 individual CpGs. On average, there were 17 CpG sites per gene region, which were found to be distributed across the first exon, gene body, promoter, 5′UTR and 3′UTR. The quantitative measurement of the methylation for each CpG (β value) was obtained from the fluorescence data in BeadStudio (Illumina). The data were preprocessed using minfi and normalized using BMIQ [
22,
23].
4.6. ZIC1-Specific Methylation Analysis
The methylation pattern of 20 consecutive CpGs within the promoter region of ZIC1 was measured using pyrosequencing. DNA from female bone biopsies (~100 ng) and/or human osteoblast-like cells (SAOS2) (~1 µg) was bisulphite-treated and purified using an EpiTect bisulphite kit (Qiagen, Germantown, MD, USA). A 207 bp amplicon (chr3:147,126,936–147,127,142; GRCh37/hg19 assembly) was amplified from ~10 ng of bisulfite-treated DNA in 25 µL reactions using 1× PyroMark PCR Master Mix, 1× CoralLoad Concentrate (both from Qiagen) and 0.2 µM primers. Primers were designed using PyroMark Assay design 2.0 (Qiagen); forward primer: 5′-TGGTTTGTTAAAAGGGGATGTT-3′ and biotinylated reverse primer 5′-B-ACACCCTCCCCCCCTTAATAA-3′. Cycling conditions were an initial denaturation step at 95 °C for 15 min, followed by 50 cycles of 94 °C for 30 s, 56 °C for 30 s, 72 °C for 30 s and a final extension period at 72 °C for 10 min.
A total of 20 µL of PCR products was added to 40 µL binding buffer (Qiagen), 2 µL streptavidin–Sepharose high-performance beads (GE Healthcare, Chicago, IL, USA) and 18 µL water and stirred for 5–10 min at 14,000 rpm. Single-stranded biotinylated templates were isolated using PyroMark Vacuum Prep WorkStation (Qiagen) and dispensed onto a PyroMark Q24 plate containing 25 µL of 0.3 µM sequencing primer (5′-AAGAGTTTTATAATATTTGGGATTG-3′) and annealing buffer (Qiagen). The plates were incubated for 2 min at 80 °C and subsequently cooled at room temperature for at least 5 min. Sequencing was performed in a PyroMark Q24 instrument with PyroGold reagents (Qiagen). Results were analysed using PyroMark Q24 2.0.6 software, Qiagen, Germantown, MD, USA.
4.7. Data Analysis
Data analysis was performed by importing CEL files (raw gene expression data) into Partek Genomics Suite software (Partek, Inc., St. Louis, MO, USA). Generation of signal values and normalization was performed by the application of the robust multichip analysis (RMA) algorithm. A one-way analysis of variance (ANOVA) model was used for the expression comparisons of different groups. The results are given as fold change.
In accordance with the manufacturer’s recommendation, raw gene expression data were normalized and processed using the Affymetrix GCOS software module and MAS 5.0 in ArrayAssist (Stratagene, La Jolla, CA, USA), which generated a list of genes ‘present’ in a given sample. Following the compilation of a raw data set identification of differentially expressed genes was performed by ArrayAssist software. Statistical significance of microarrays was assessed by unpaired t-test, which identified differential gene expression. Normalized data were filtered on expression, with a cutoff value of two-fold change in expression (p ≤ 0.05). Gene ontology/enrichment analysis was then performed on the differentially expressed clusters.
4.8. Cell Lines and Culture Conditions
Immortalized human SAOS2 osteoblast-like cells (ATCC, Manassas, Virginia, USA) were cultured in 25 cm2 flasks and incubated at 37 °C in 5% CO2. Briefly, in each experiment, SAOS2 cells were treated with trypsin-EDTA solution (Sigma-Aldrich, Merck KGaA, Darmstadt, Germany), removed from the flask surface and grown in McCoy’s 5a medium (Sigma-Aldrich) supplemented with 10% foetal bovine serum (FBS). For primary human skin fibroblast (HSF) cells, Dulbecco’s modified Eagle’s medium (DMEM, Sigma-Aldrich) supplemented with 5% Calf Serum (CS), 100 μg/mL Streptomycin and 100 U/mL penicillin was used. Both cell lines were being subcultured when they reached 70–80% confluence.
4.9. mRNA Extraction and Quantification
Cells were grown in original 25 cm2 culture flasks until they reached 80% confluence. Normal medium was removed, and the flasks were washed with PBS to ensure that no residual media or growth factors were present. Cells were then lysed by directly adding 1 mL of Trizol reagent (Invitrogen, Thermo Fisher Scientific, Waltham, MA, USA) in the flask, passed through the pipette several times to homogenize the lysates, transferred to RNAse-free Eppendorf tubes and left for 5 min to completely dissociate the nucleoprotein complexes. An amount of 200 μL of chloroform was then added to the tubes, shaken vigorously for 10–15 s and left for another 3 min. Tubes were then centrifuged at 13,000 rpm for 15 min, and the colourless upper aqueous phase containing RNA was removed from all tubes, transferred to new tubes and precipitated by mixing with an equal volume of isopropyl alcohol. Samples were then left for 10 min, centrifuged at 13,000 rpm for 15 min and supernatant was removed. Remaining pellets were washed once with 1 mL of 70% ethanol, mixed by vortexing and centrifuged at 13,000 rpm for 3 min. Ethanol was removed, and RNA pellets were left to dry completely for 5 min and finally redissolved by adding 50 μL of RNase-free water, passed through the pipette tip several times and incubated for 10 min at 60 °C. The absorbance of each sample was then measured at 260 nm by a spectrophotometer (NanoDrop, Thermo Fisher Scientific, Waltham, MA, USA) to calculate the concentration of mRNA in ng/μL. In addition, calculating the 260/230 nm and 260/280 nm absorbance ratios determined the integrity and purity of extracted RNA. Prior to each measurement, the spectrophotometer was calibrated with a blank (RNase-free water) at 260 nm to provide a more accurate reading.
The first-strand cDNA was synthesized from extracted mRNA by reverse transcription (RT). A total of 4 μg of total RNA was used as starting template for each reaction and included oligo dT, dNTP (10 mM). The volume of water added for each reaction was adjusted depending on the concentration and volume of mRNA added to give a final volume of 14 μL.
4.10. Immunofluorescence Detection of ZIC1
Primary rat osteoprogenitor cells were isolated from 3–4-day-old rat pup calvariae. The pups were sprayed and cleaned with 70% alcohol before the calvariae were dissected and washed with balanced Hanks solution, cut into small 2–3 mm wide pieces and digested with 1 mg/mL collagenase (type II) on a rocking bed. The supernatant was discarded, and the collagenase reaction was repeated for a further 30 min, following which the supernatant was isolated and kept as fraction 1. Calvariae were then washed with PBS that was added to fraction 1. In the next step, fraction 2 was collected by washing calvariae with PBS containing 4 mM EDTA for 15 min at 37 °C on a rocking bed. The calvariae were washed once more with Hanks solution and added to fraction 2. The collagenase reaction was repeated for 30 min, and the supernatant was kept as fraction 3. The calvariae were once again washed with Hanks solution, and this was added to fraction 3. In the final step, all the fractions were pooled and spun at 800×
g (1000 rpm) for 3 min, and the resulting cell populations were cultured in T75 flasks for further experiments. The rat calvarial osteoblasts used were a mixed primary culture that contained cells at a number of points in the continuum from progenitors to mature cells. Previous characterization of the cells showed their response to osteoinduction, with increased levels of alkaline phosphatase and deposition of mineralised matrix, as well as appropriate changes in expression of alkaline phosphatase, collagen I, osteopontin and osteocalcin [
24].
Cells were harvested and grown on sterile 13 mm glass cover slips (in a 24-well plate) overnight at 37 °C to let them settle down and adhere on the surface. Then, cells were briefly washed with PBS, and freshly prepared (<3 months) preheated (37 °C) 4% paraformaldehyde in PBS was added for 10 min to fix cells on the surface. Cover slips were thoroughly washed with PBS/0.1% Tween three times, and specimens were then incubated with 3% goat serum dissolved in PBS/0.1% Tween for approximately 30 min. Goat serum was used as a blocking serum to prevent non-specific binding of IgG, as secondary antibody was originally raised in goat. After a brief wash with PBS/0.1% Tween, 150 μL of rabbit polyclonal anti-ZIC1 antibody (diluted at 2.5 μg/mL in PBS, Abcam, Cambridge, UK) was added and incubated at room temperature for 2 h.
After the 2 h incubation time, cover slips were extensively washed with PBS/0.1% Tween three times (each wash for 15 min), and 2.5μL of anti-rabbit IgG (whole molecule, FITC conjugate, Sigma-Aldrich) was added per cover slip (in a well containing 500 μL PBS) and incubated at room temperature for 1 h in a dark chamber. After three extensive washes with PBS/0.1% Tween, cover slips were dried and mounted with Vectashield with DAPI (Vector) on microscope slides and examined on a microscope (DMLB, Leica, Wetzlar, Germany) with a fluorescent lamp (ebq 100 isolated, Leistungselektronik, Jena, Germany).
4.11. In Vitro Fluid Shear Stress Studies
To address the question of whether mechanical stress can upregulate ZIC1 in isolated rat osteoprogenitor cells and if so, whether ZIC1 was associated with enhanced osteogenesis (rat progenitors), we performed studies on freshly isolated primary rat osteoprogenitor cells. Cells were seeded on sterile 13 mm glass coverslips (in a 24-well plate) or in culture flasks incubated at 37 °C overnight and were then serum-starved for another 12 h. Serum-free medium of the culture flaks was then replaced with 5 ml of normal medium supplemented with 5.958 g/L HEPES and transferred to an orbital shaker incubator (Gallenkamp; Fisher Scientific, Loughbrough, UK) to apply shear stress and incubated for variable required time at 37 °C and 50 rpm.
The transcriptional response of the cells to fluid shear stress in a two-armed study (mechanically strained vs. static cells) was carried out to rule out factors other than mechanical stress affecting the osteogenic response of the cells. The magnitude of mechanical strain applied was restricted to 10–12 dynes/cm2 and calculated using the formula τ = a(ηρ(2πf)3)1/2, where a is the orbital radius of rotation of the shaker, ρ is the density of the culture medium (0.9973 g/mL), η is the viscosity of the medium (0.0101) and f is the frequency of rotation (rotation/s). Following the application of mechanical strain, the expression of genes associated with osteogenic differentiation (ALP, RUNX2 and COL1A1) and genes of interest that might play a role in mediating the effect of FSS (TAZ, GLI3 and ZIC1) were determined.
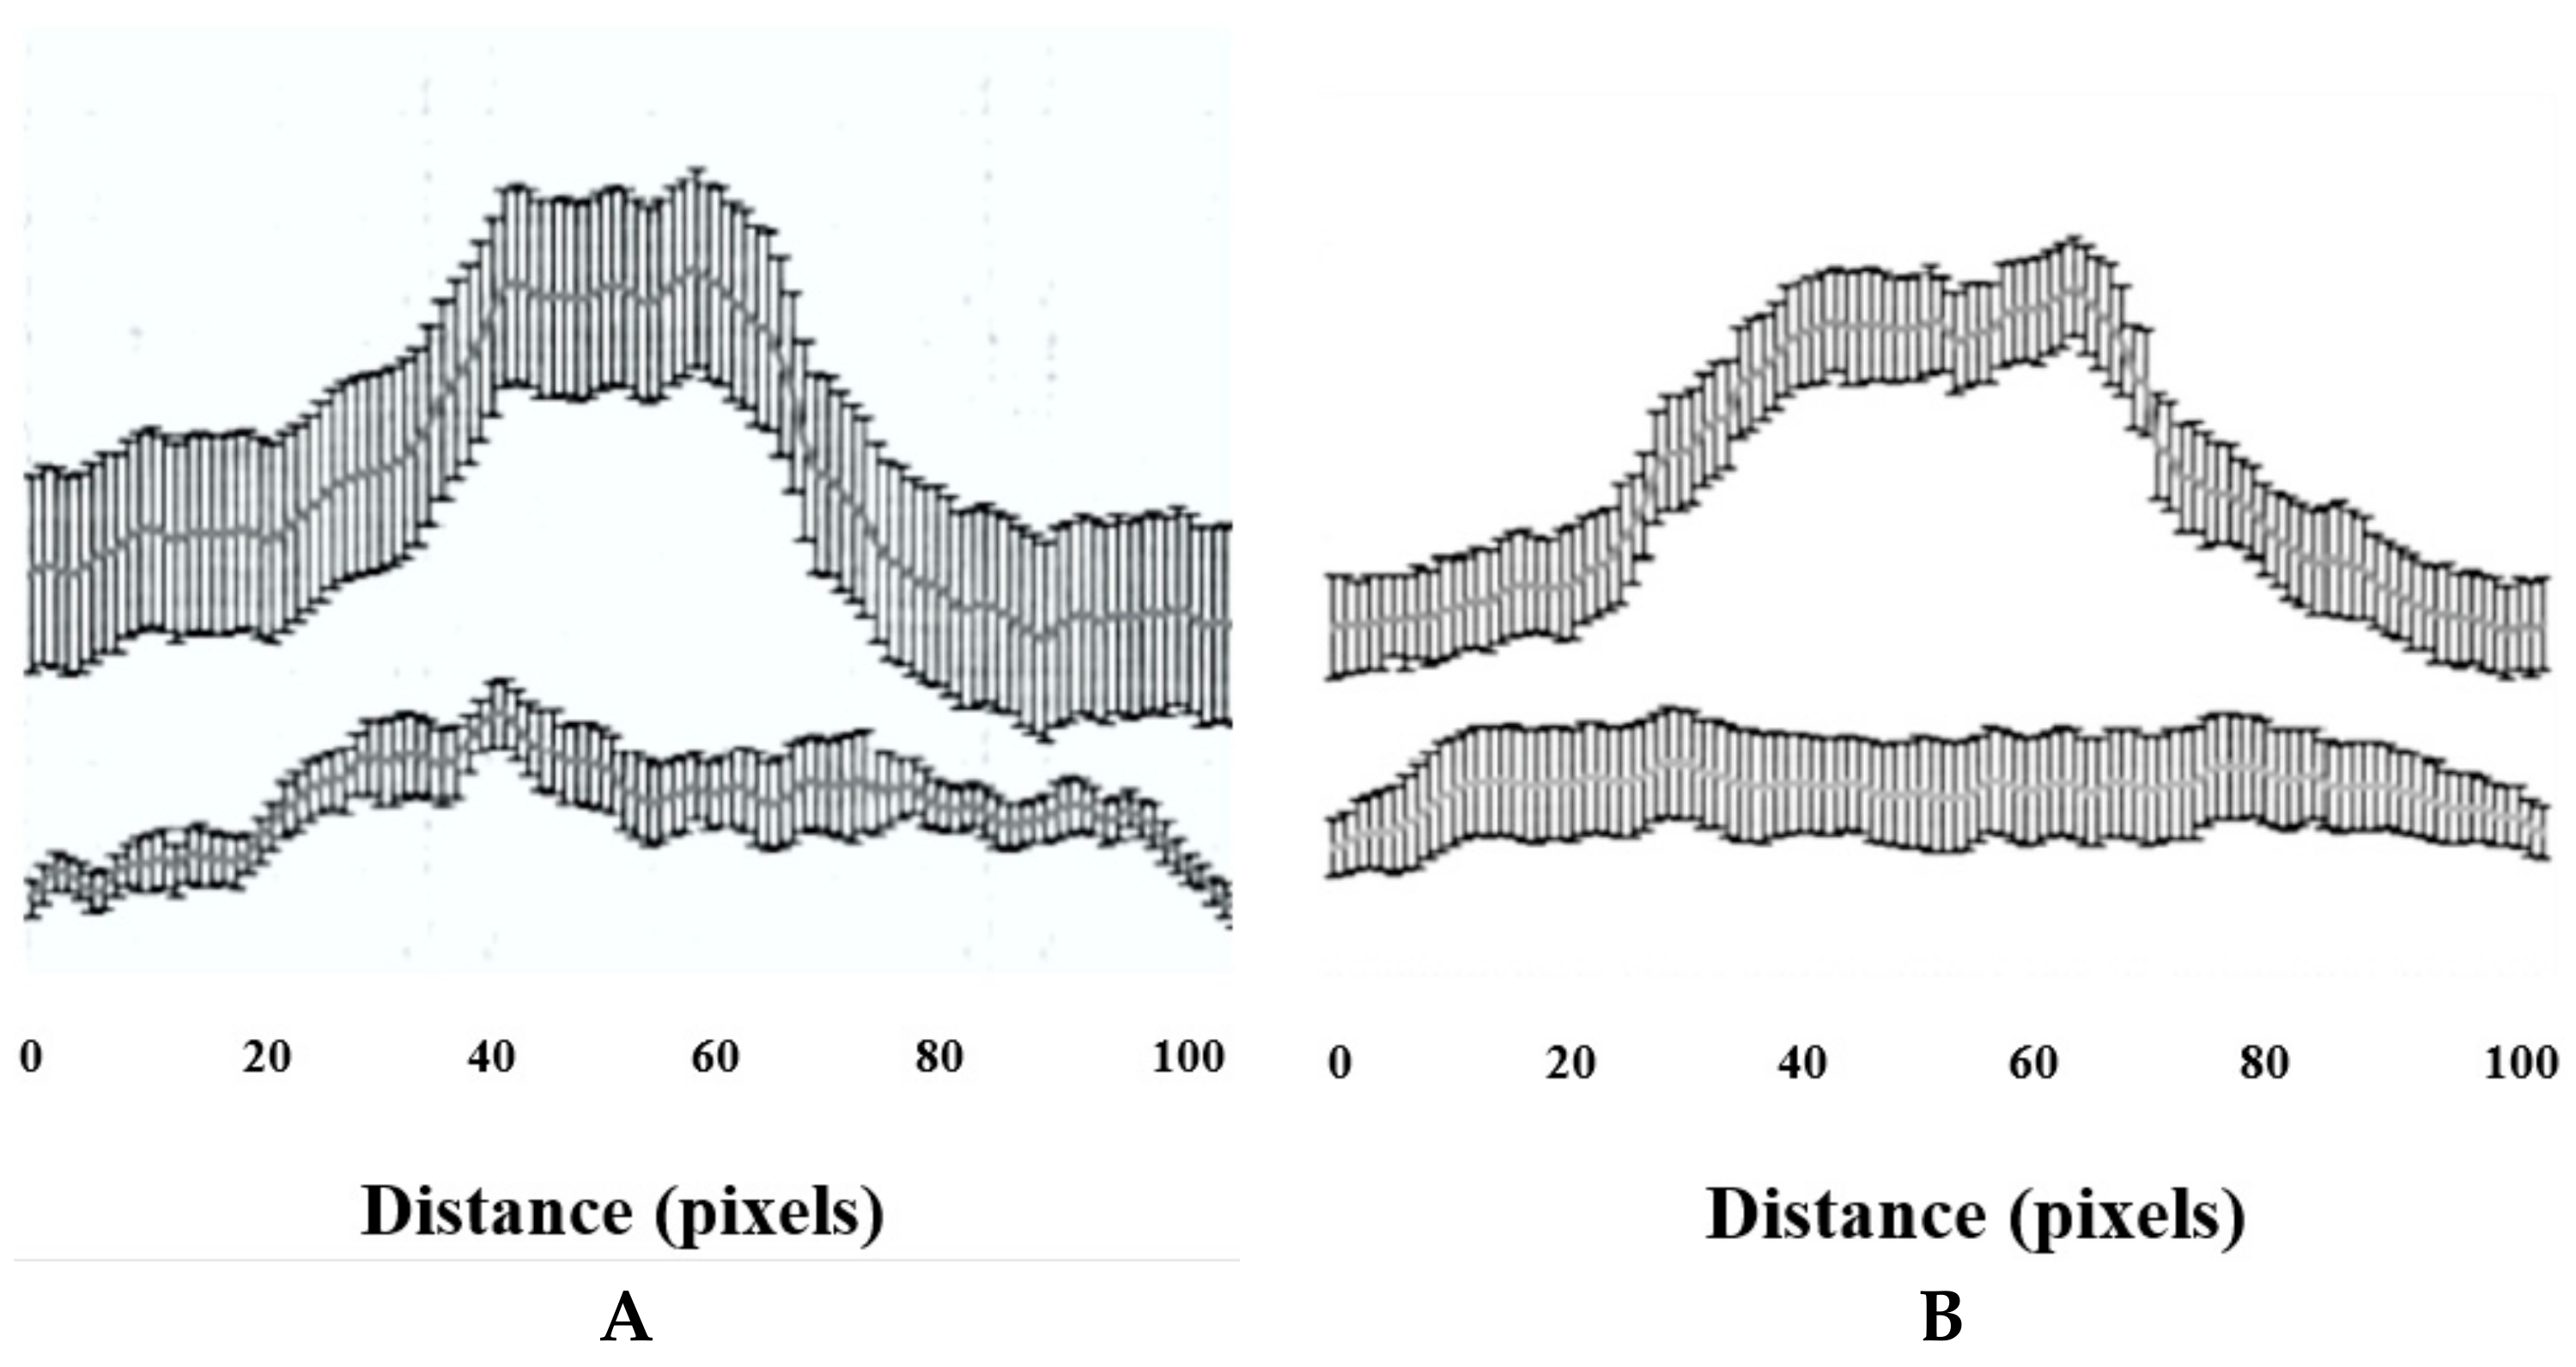
The immunostaining intensity (i.e., ZIC1 and RUNX2) was measured for a total of 20 cells per treatment using ImageJ 1.42q software (U.S. National Institutes of Health, Bethesda, MD, USA), for a total of 20 cells per treatment. A straight line of a of distance of 100 pixels was drawn along the long axis of each cell such that it passed through the middle of the nucleus and passed through the cytoplasm at the start and at the end. For each pixel for a given cell, the colour intensity was given as mean and SD, and it was plotted on a graph against the x-axis as the pixel distance.
4.12. Quantitative RT-PCR
Validation of the Affymetrix gene expression data was carried out for selected transcripts using TaqMan gene expression assays and the Applied Biosystems Prism 7900 HT sequence detection system. From each donor, total RNA (500 ng) was reverse-transcribed (Omniscript, Qiagen Ltd.), and resulting cDNA, which represented 2.5 ng total RNA, was the used in the PCR reaction. The analyses were performed in duplicate. The gene expression results are given as RQ (relative quantitation), and the relative changes of a given gene transcript were calculated using the 2(ΔΔC(T)) method. The ribosomal protein L41 (RPL41) served as an endogenous control; this was selected as internal standard because Affymetrix analyses had shown similar signal values in all samples (10,895 ± SD 315).


 ,
, 


