
Lighting from Top and Side Enhances Photosynthesis and Plant Performance by Improving Light Usage Efficiency


Abstract
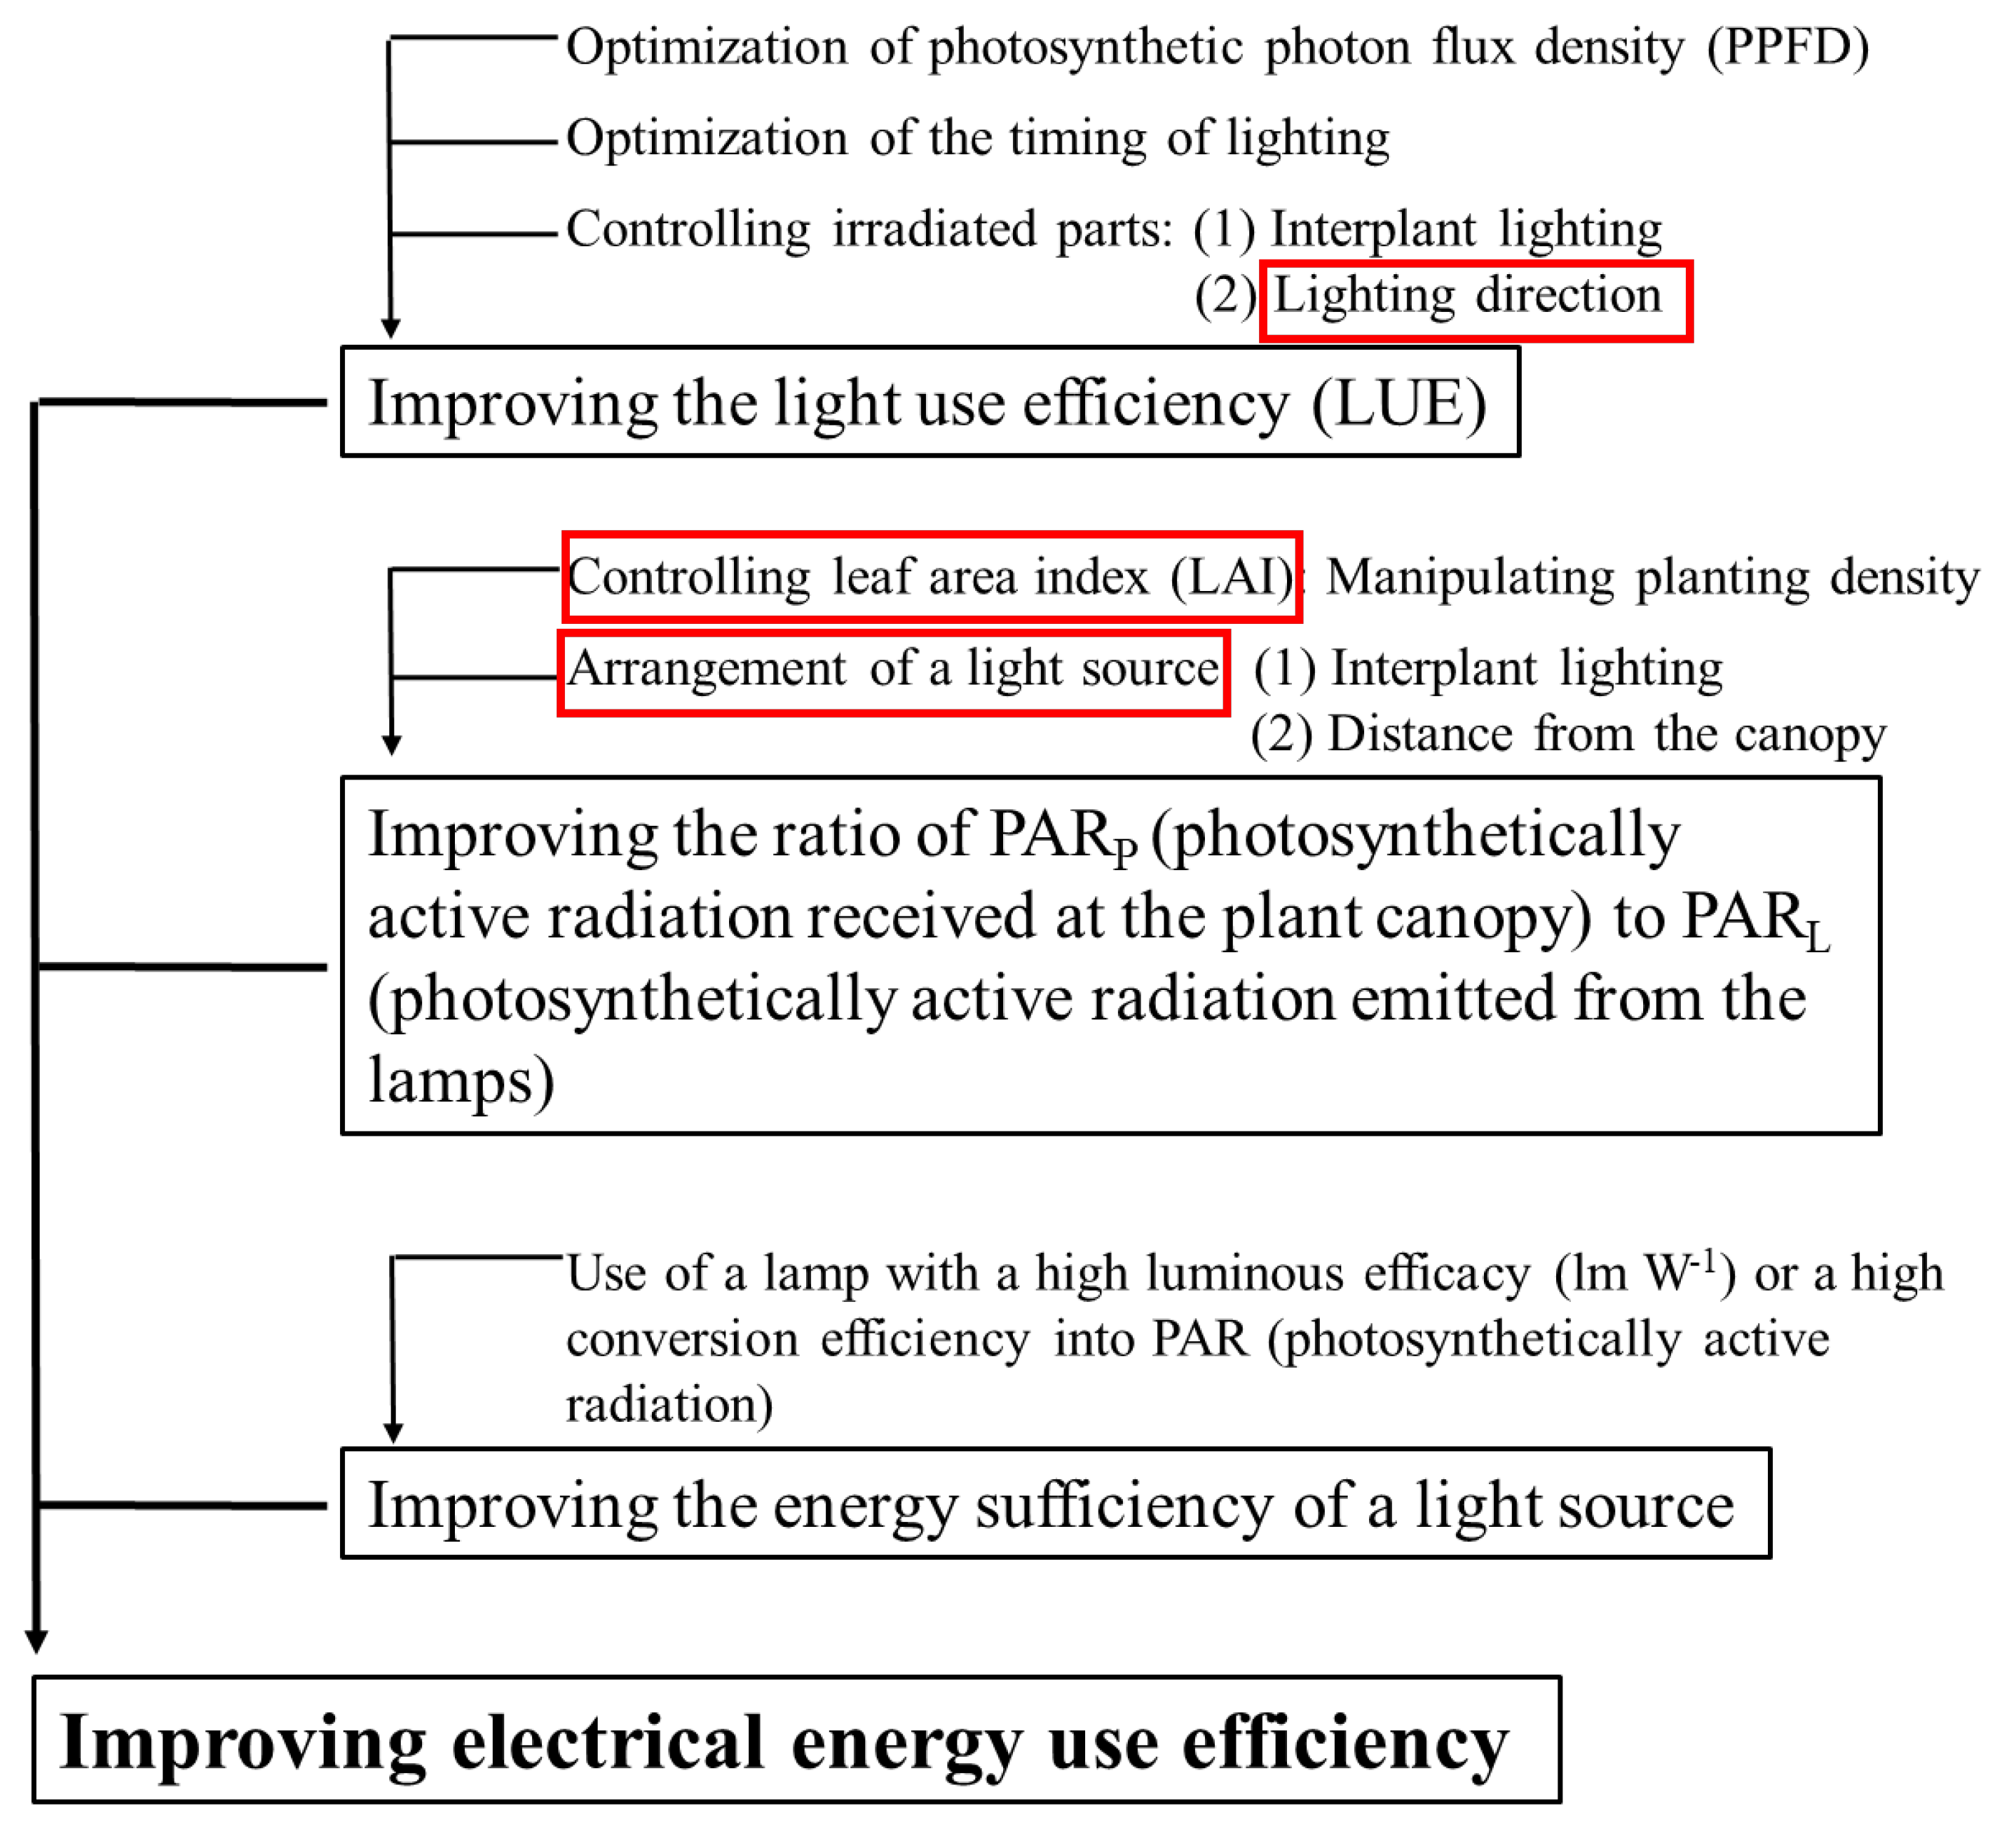
:1. Introduction
2. Results
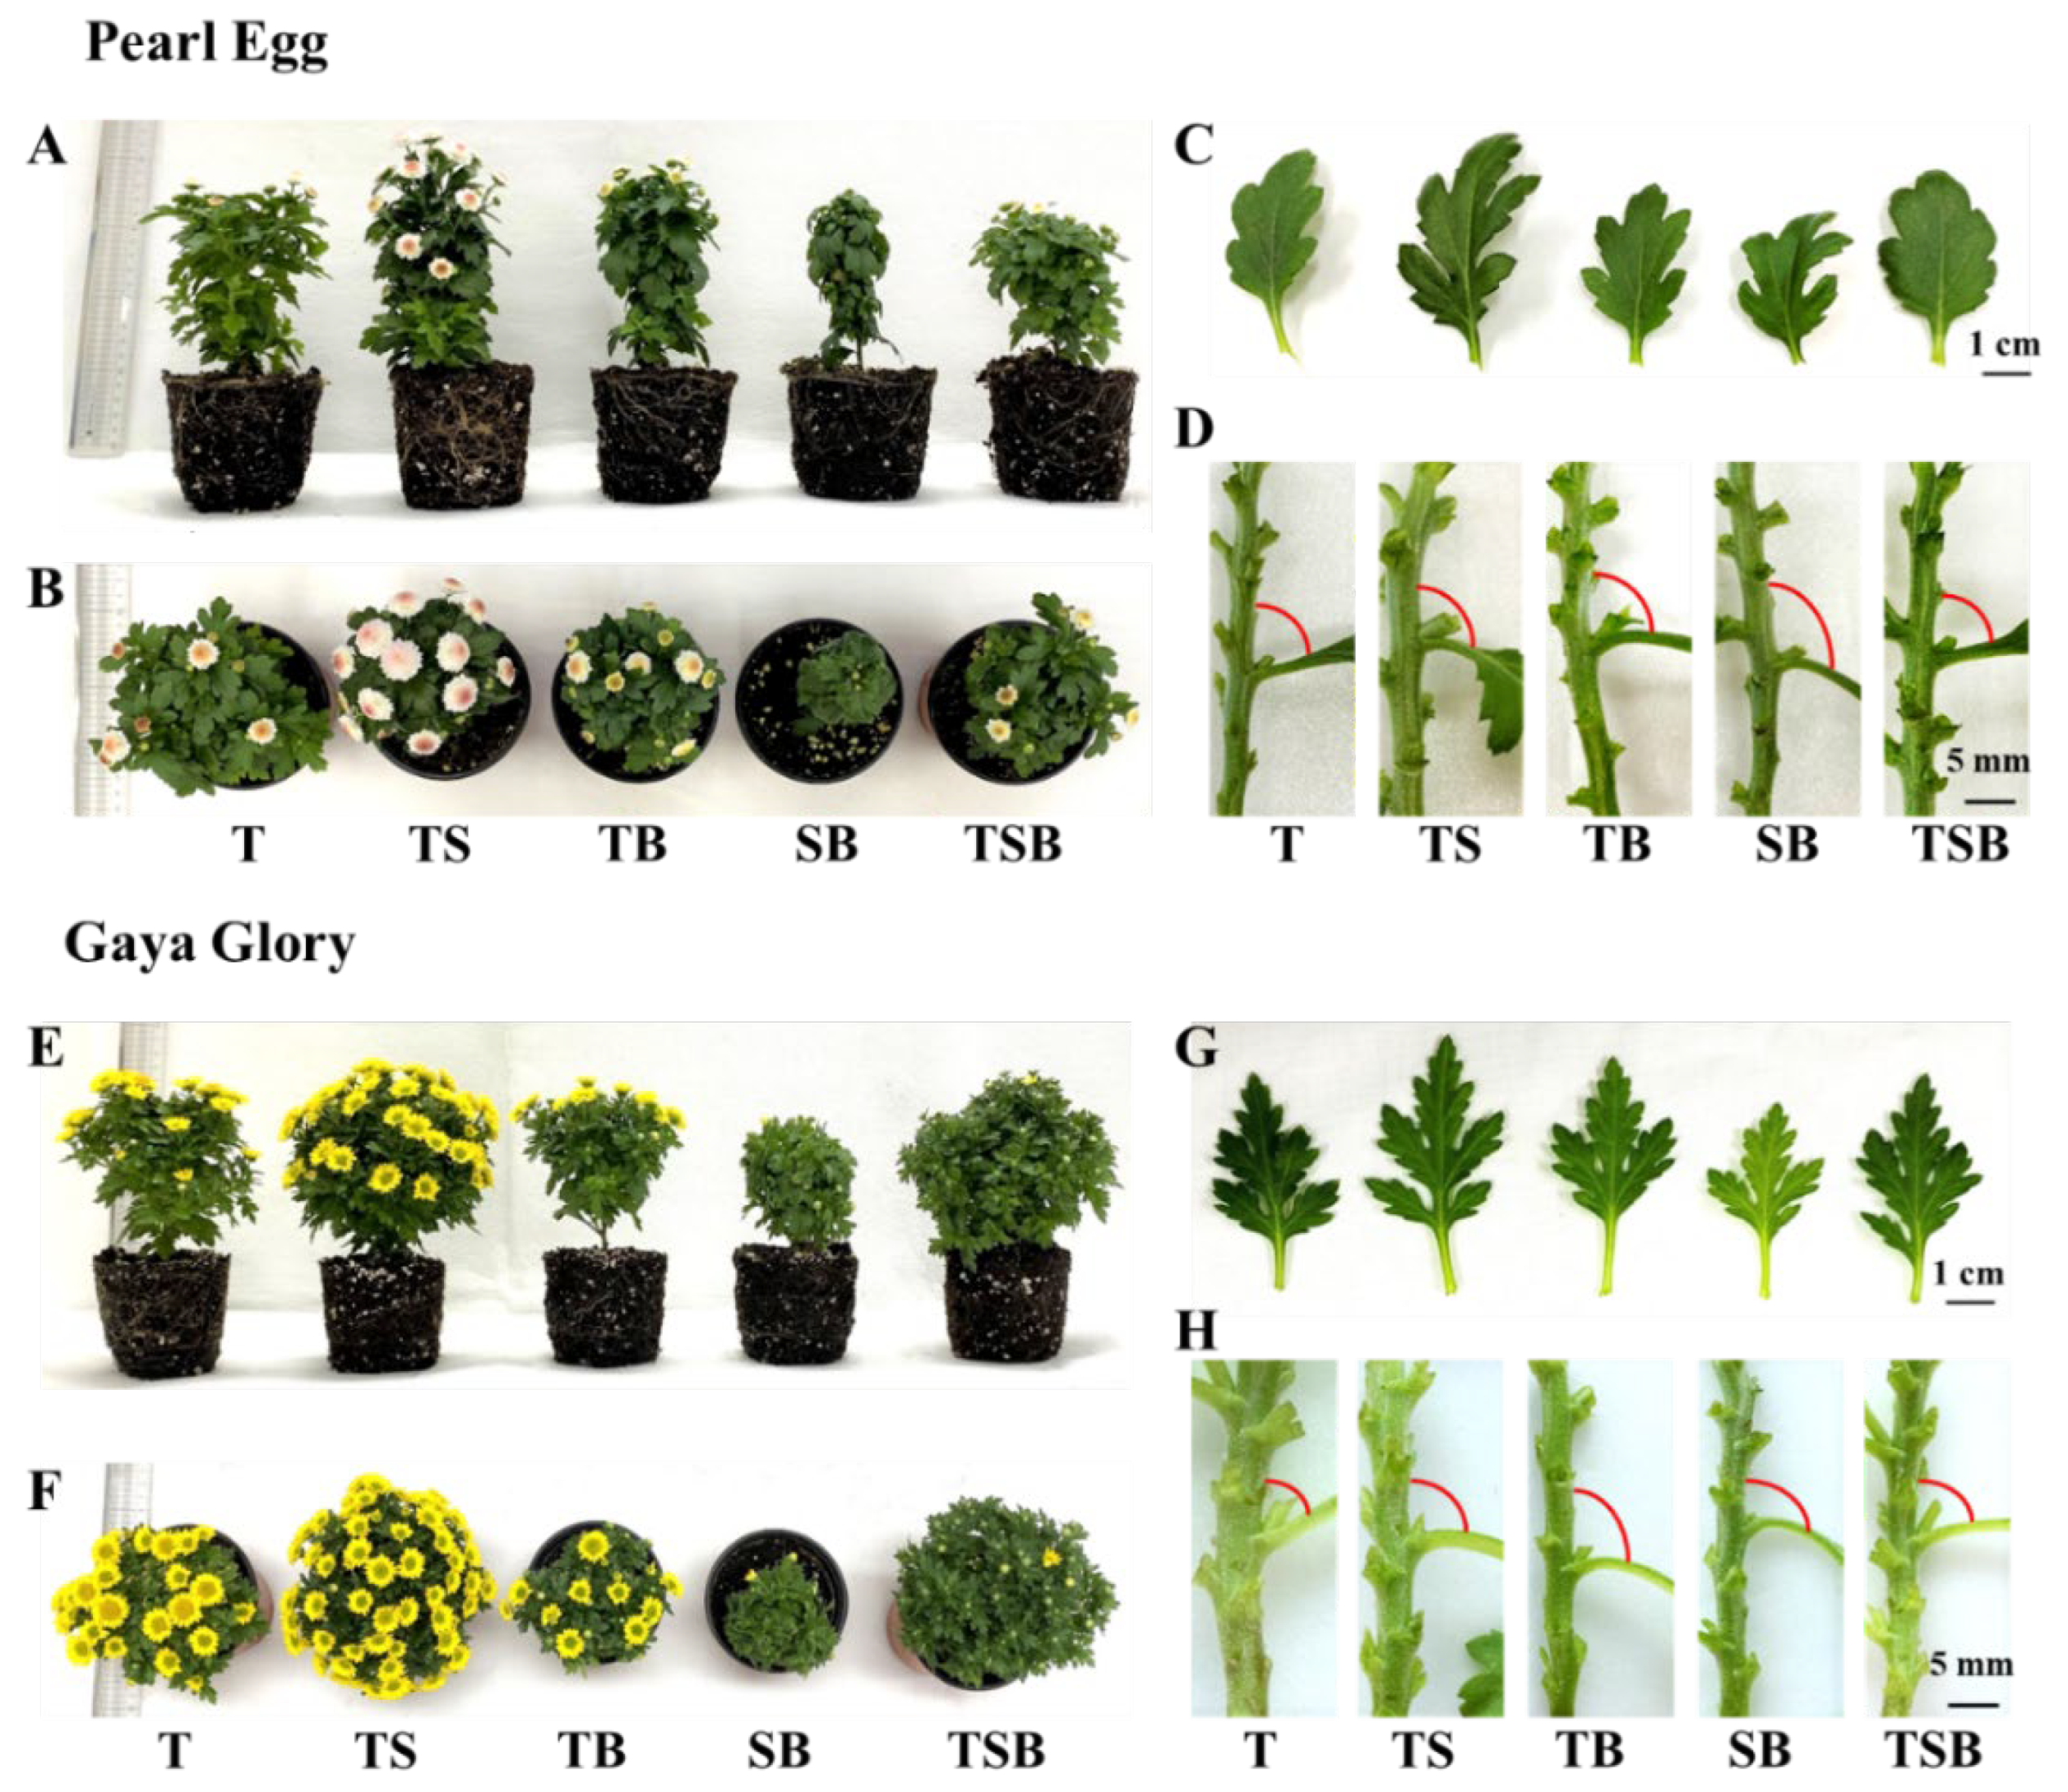
2.1. Morphology and Plant Growth Parameters
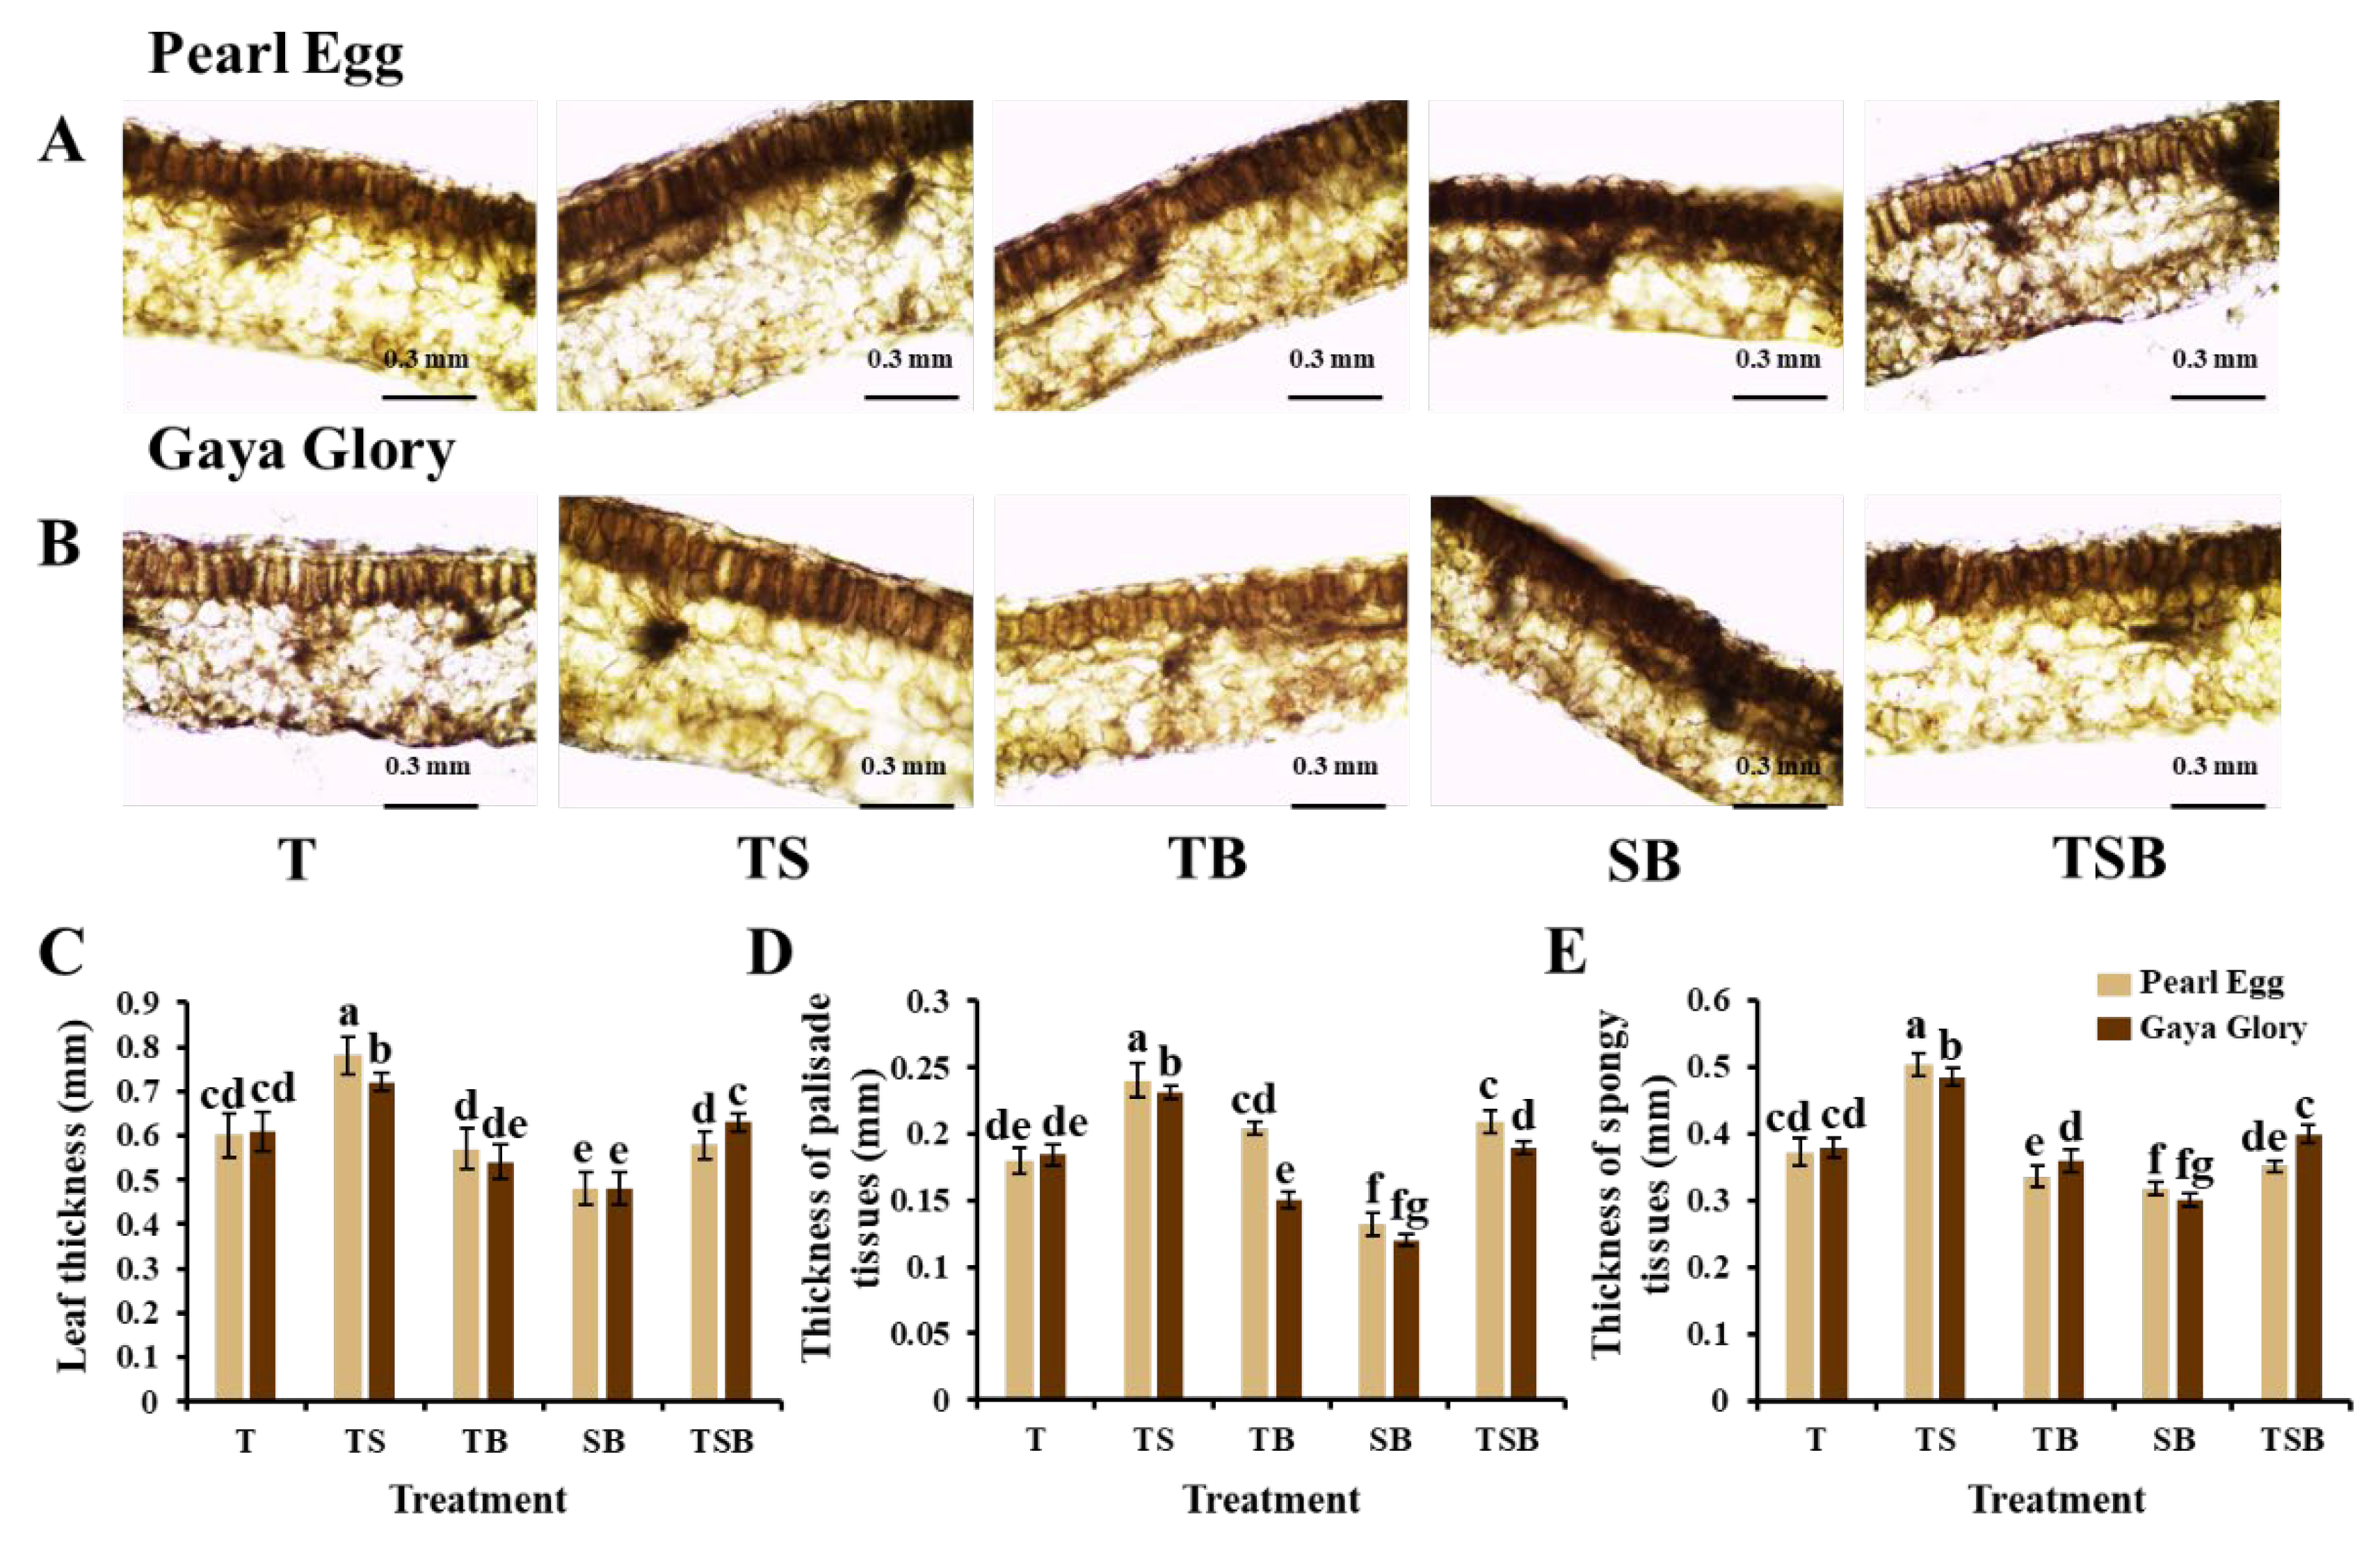
2.2. Leaf Anatomy
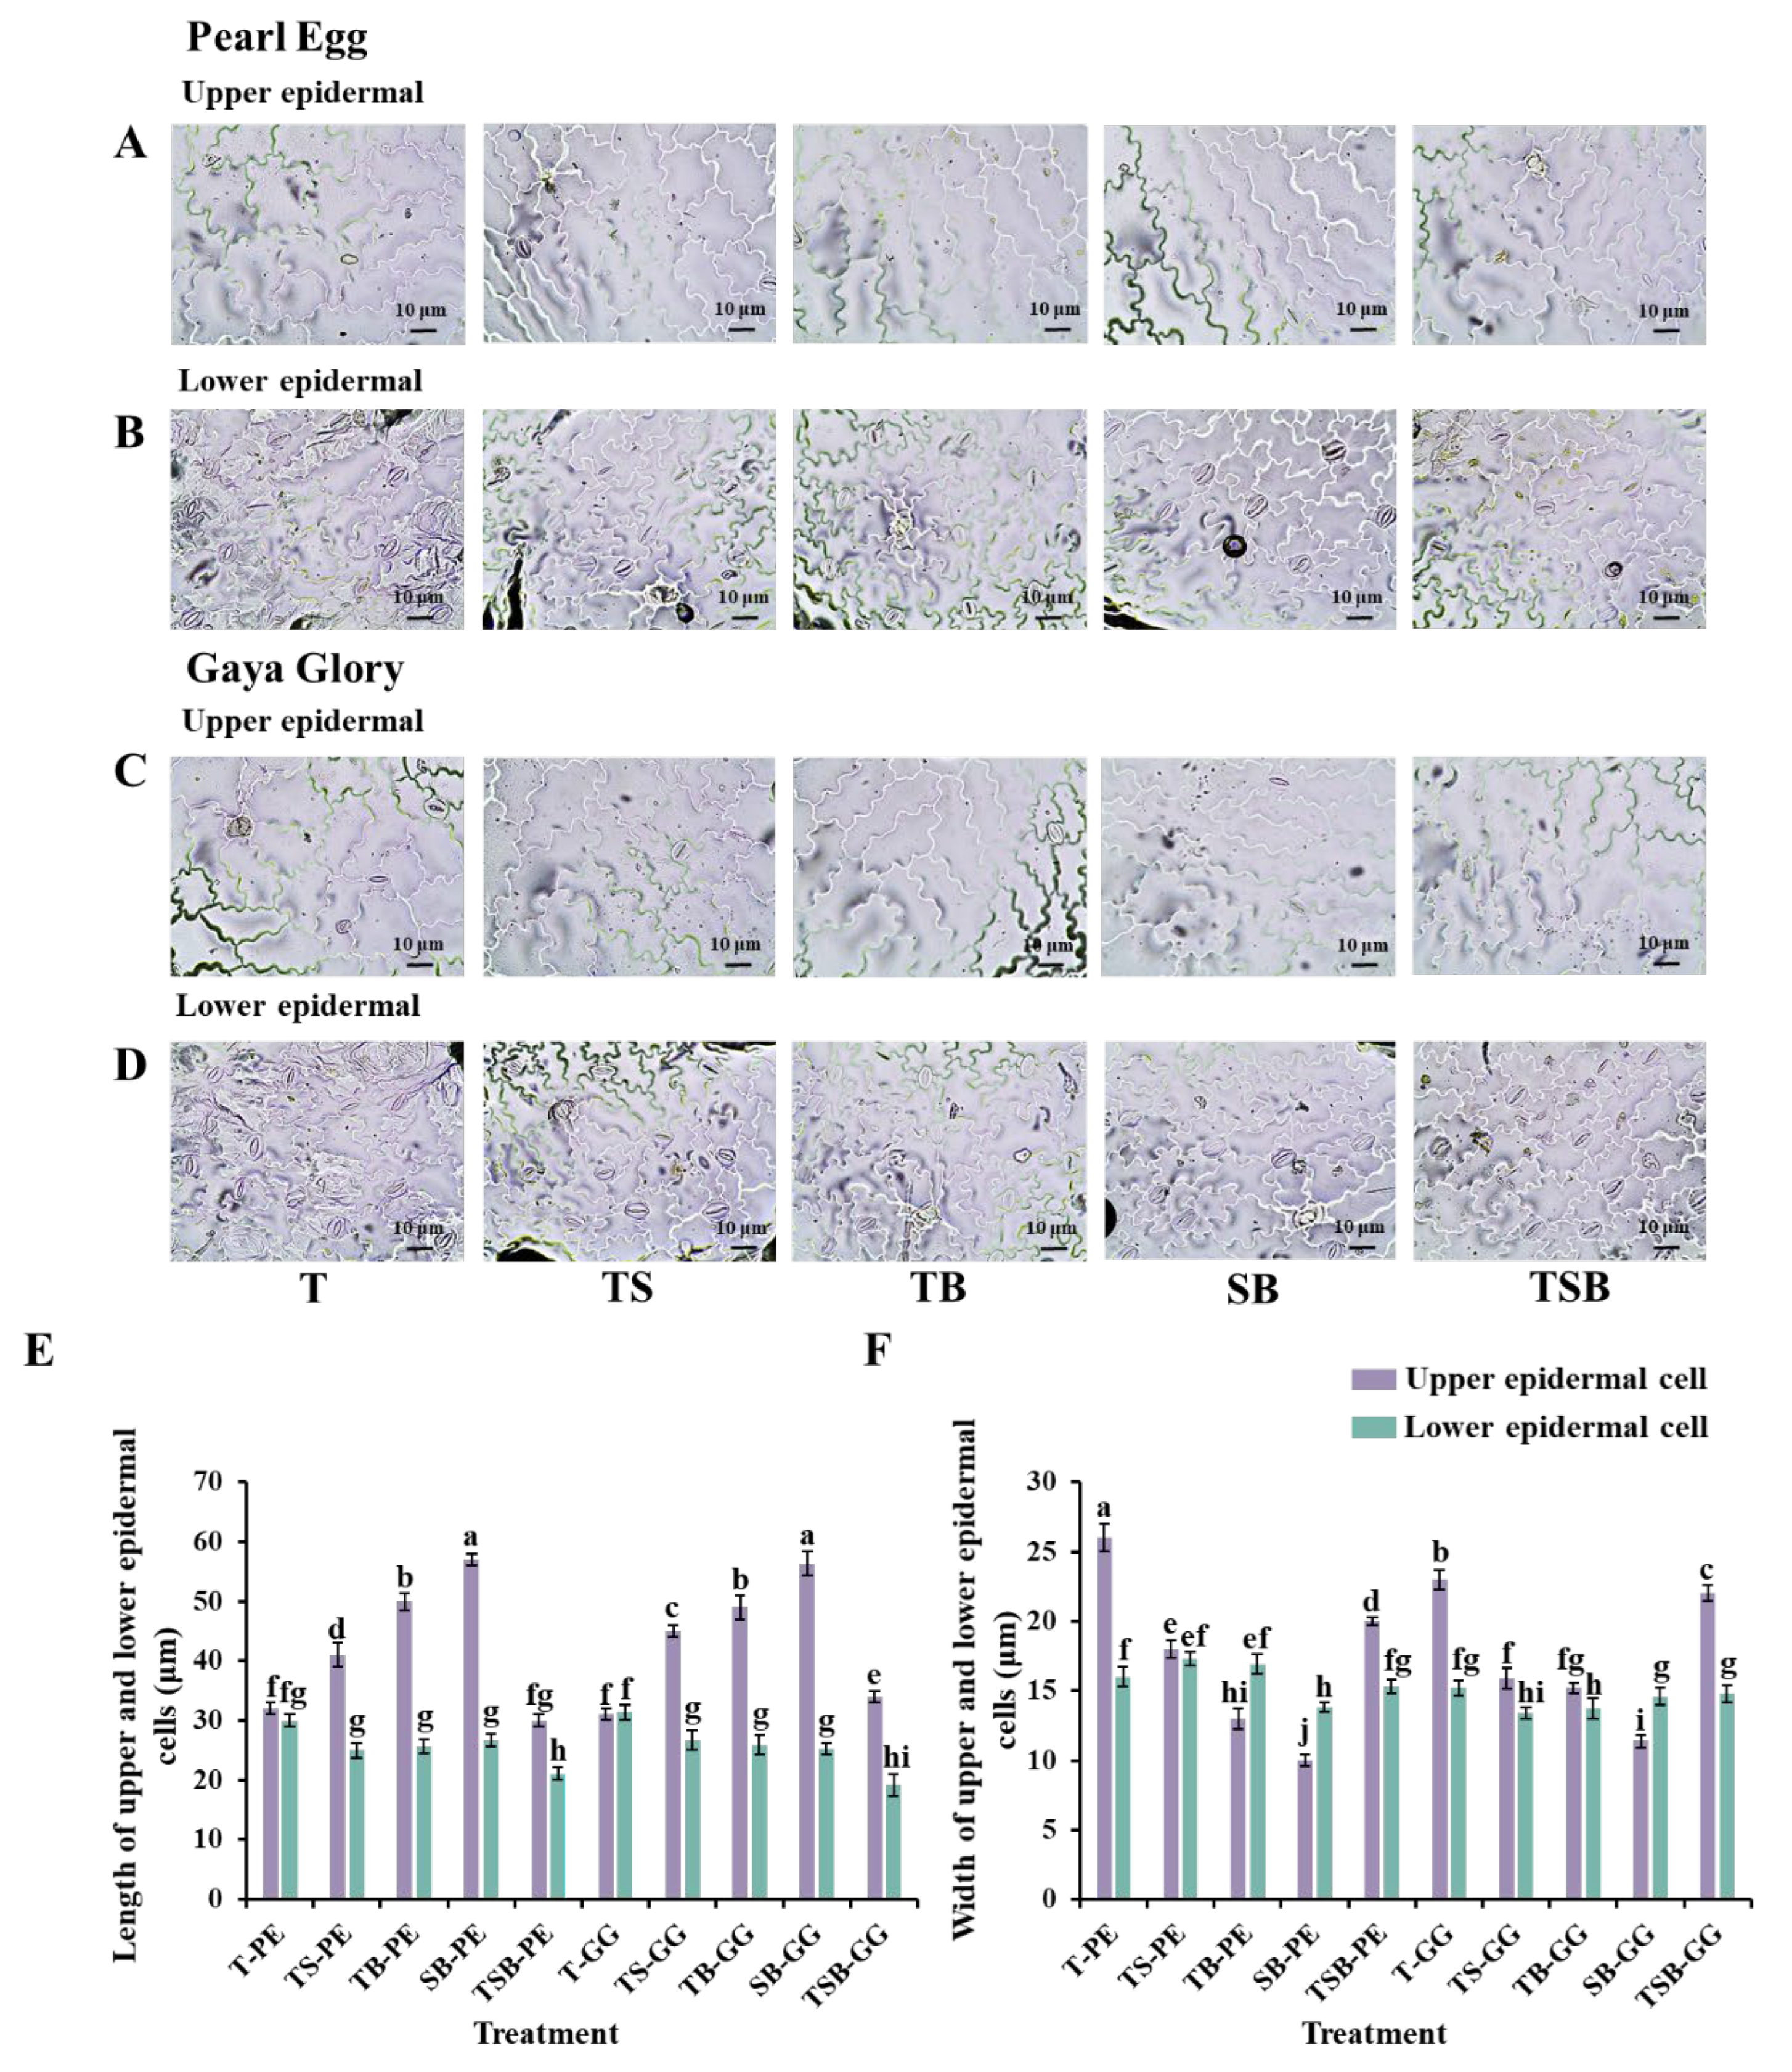
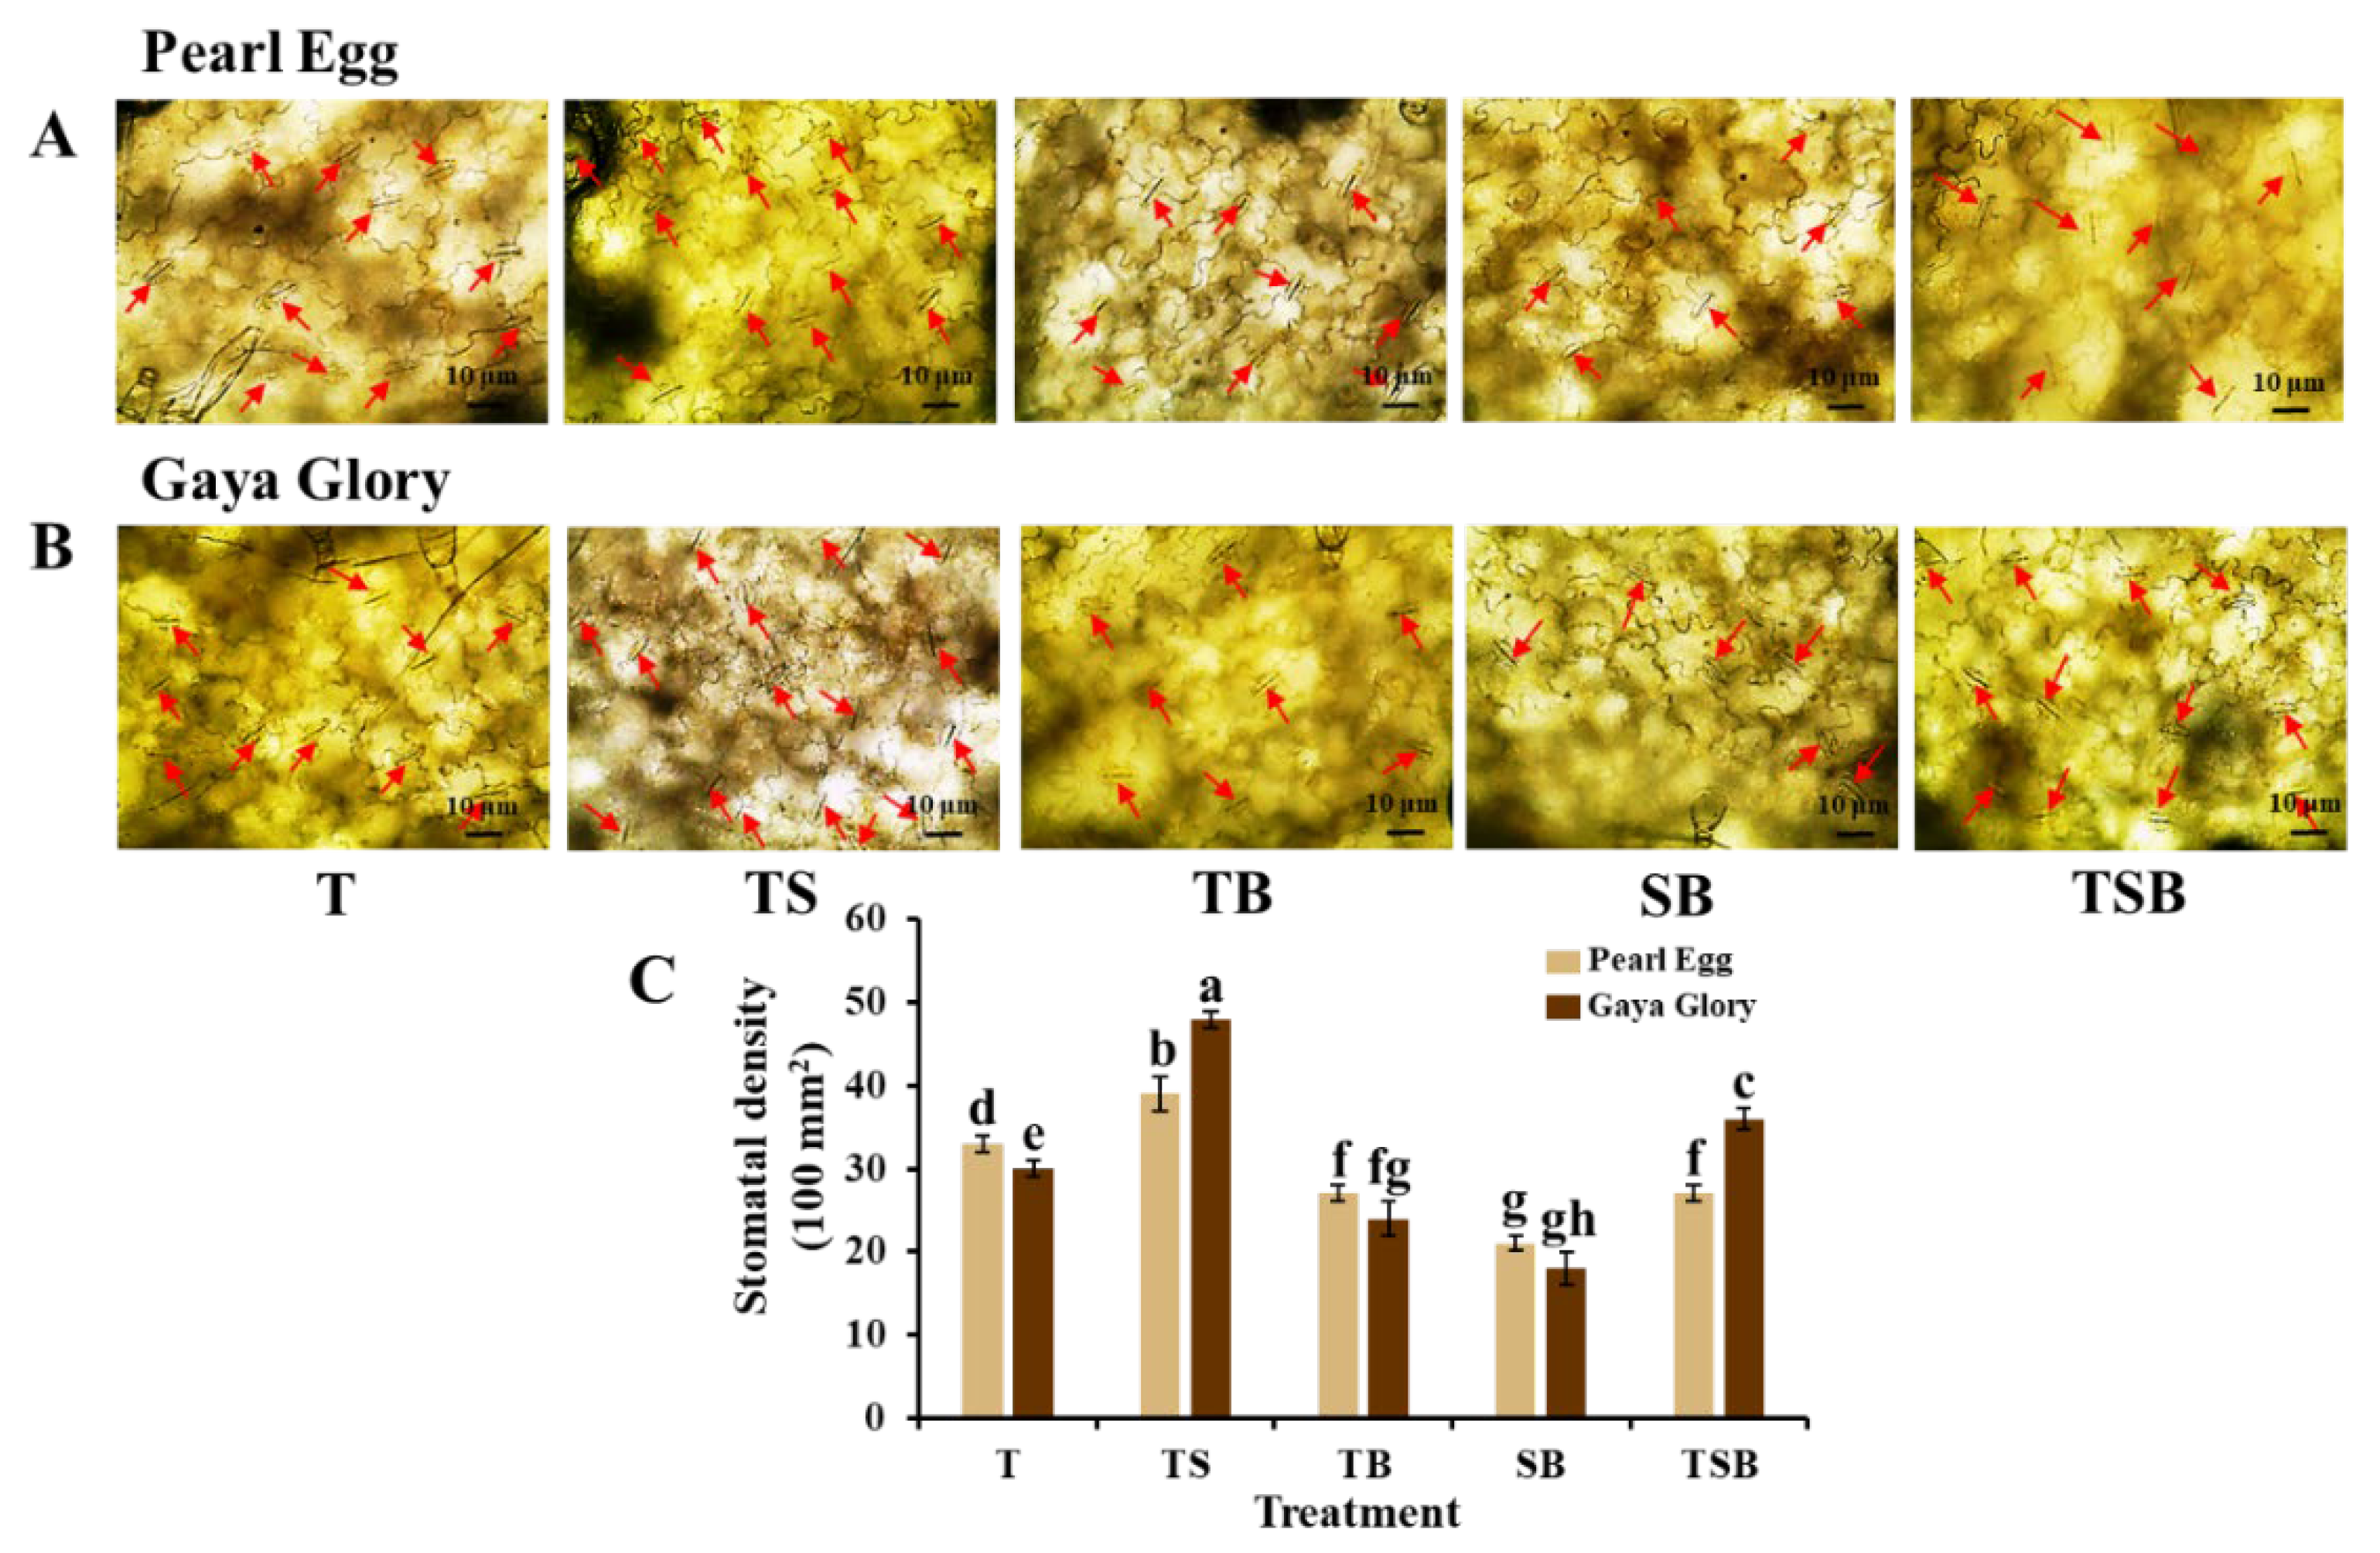
2.3. Morphological Characteristics of the Epidermal Cells and Stomata
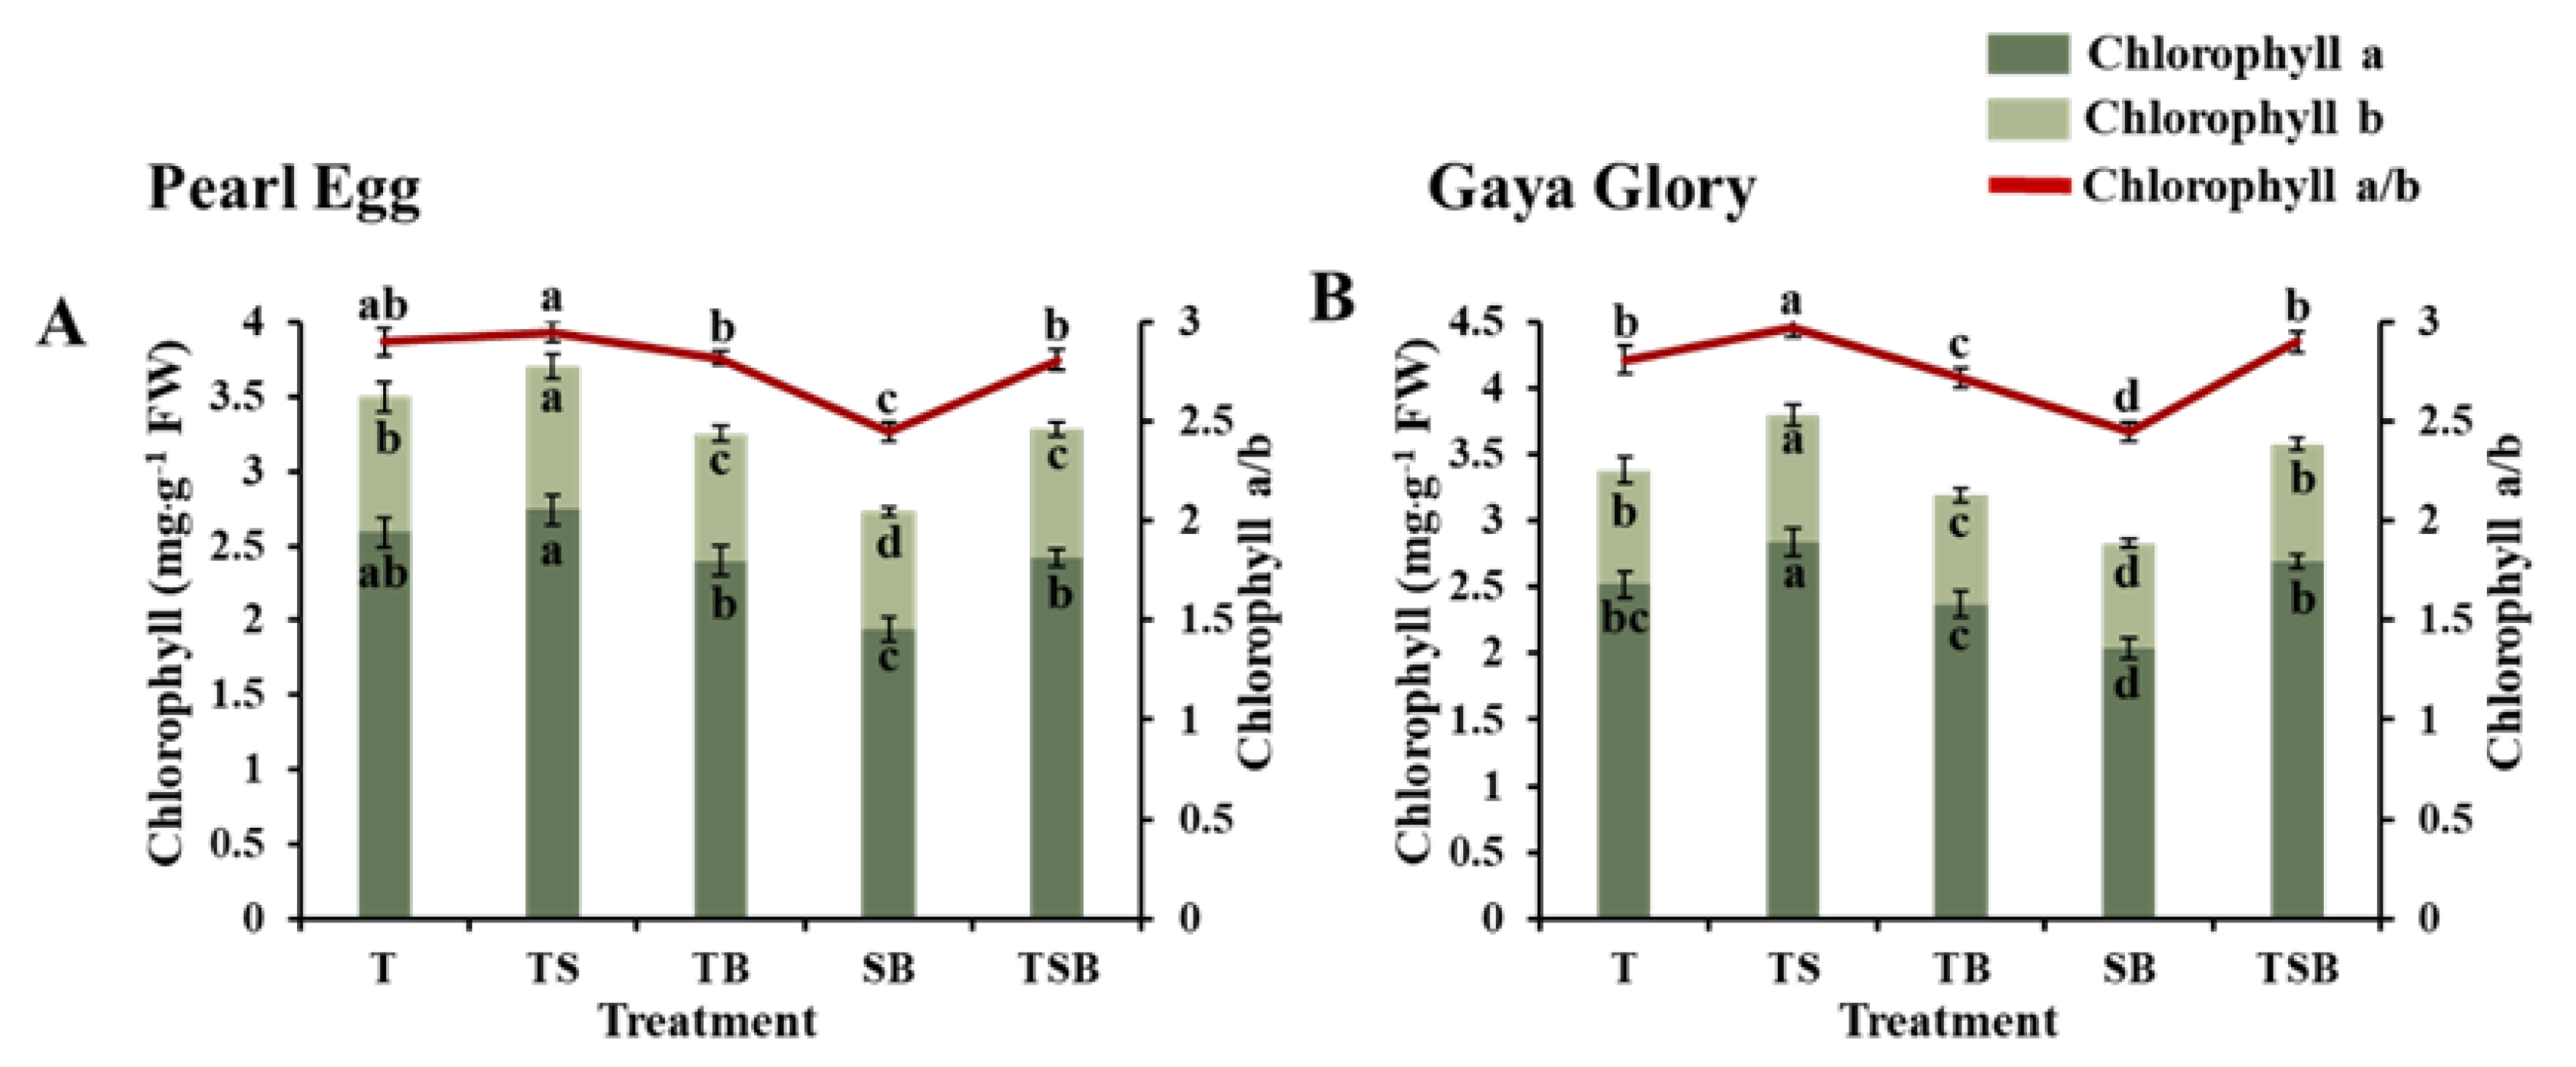
2.4. Chlorophyll Content
2.5. Photosynthetic and Chlorophyll Fluorescence Characteristics
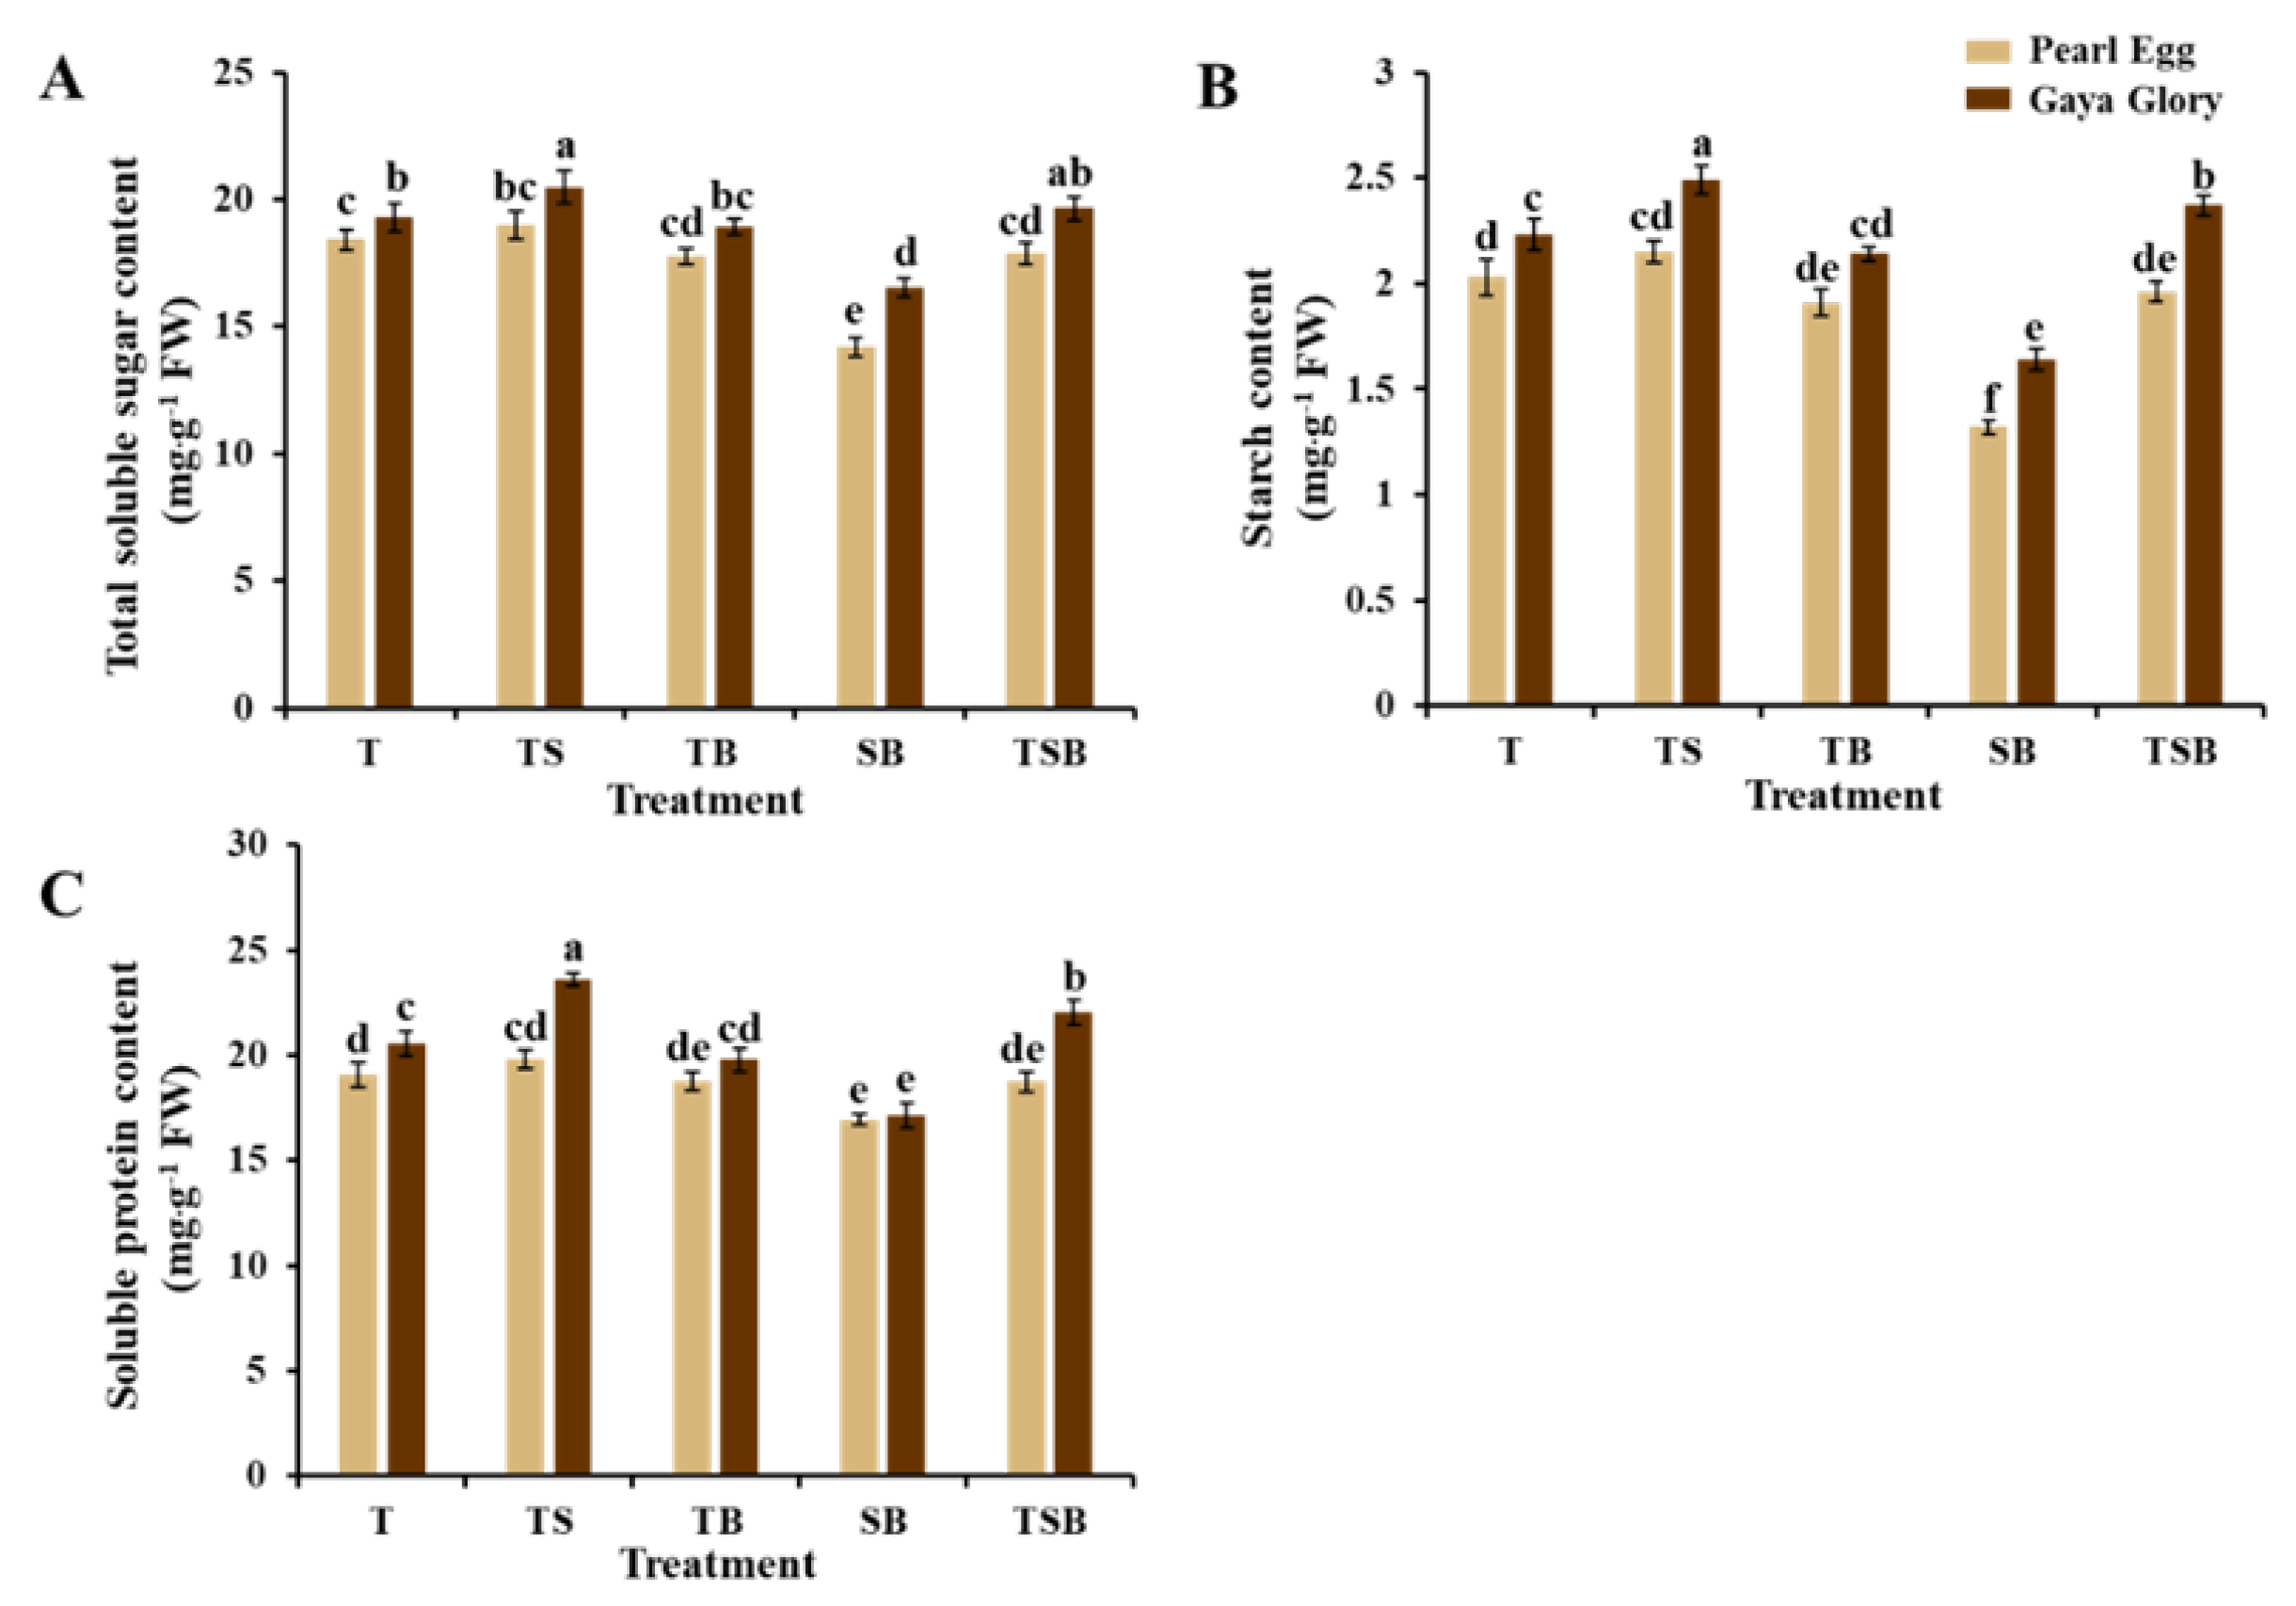
2.6. Carbohydrates and Soluble Proteins
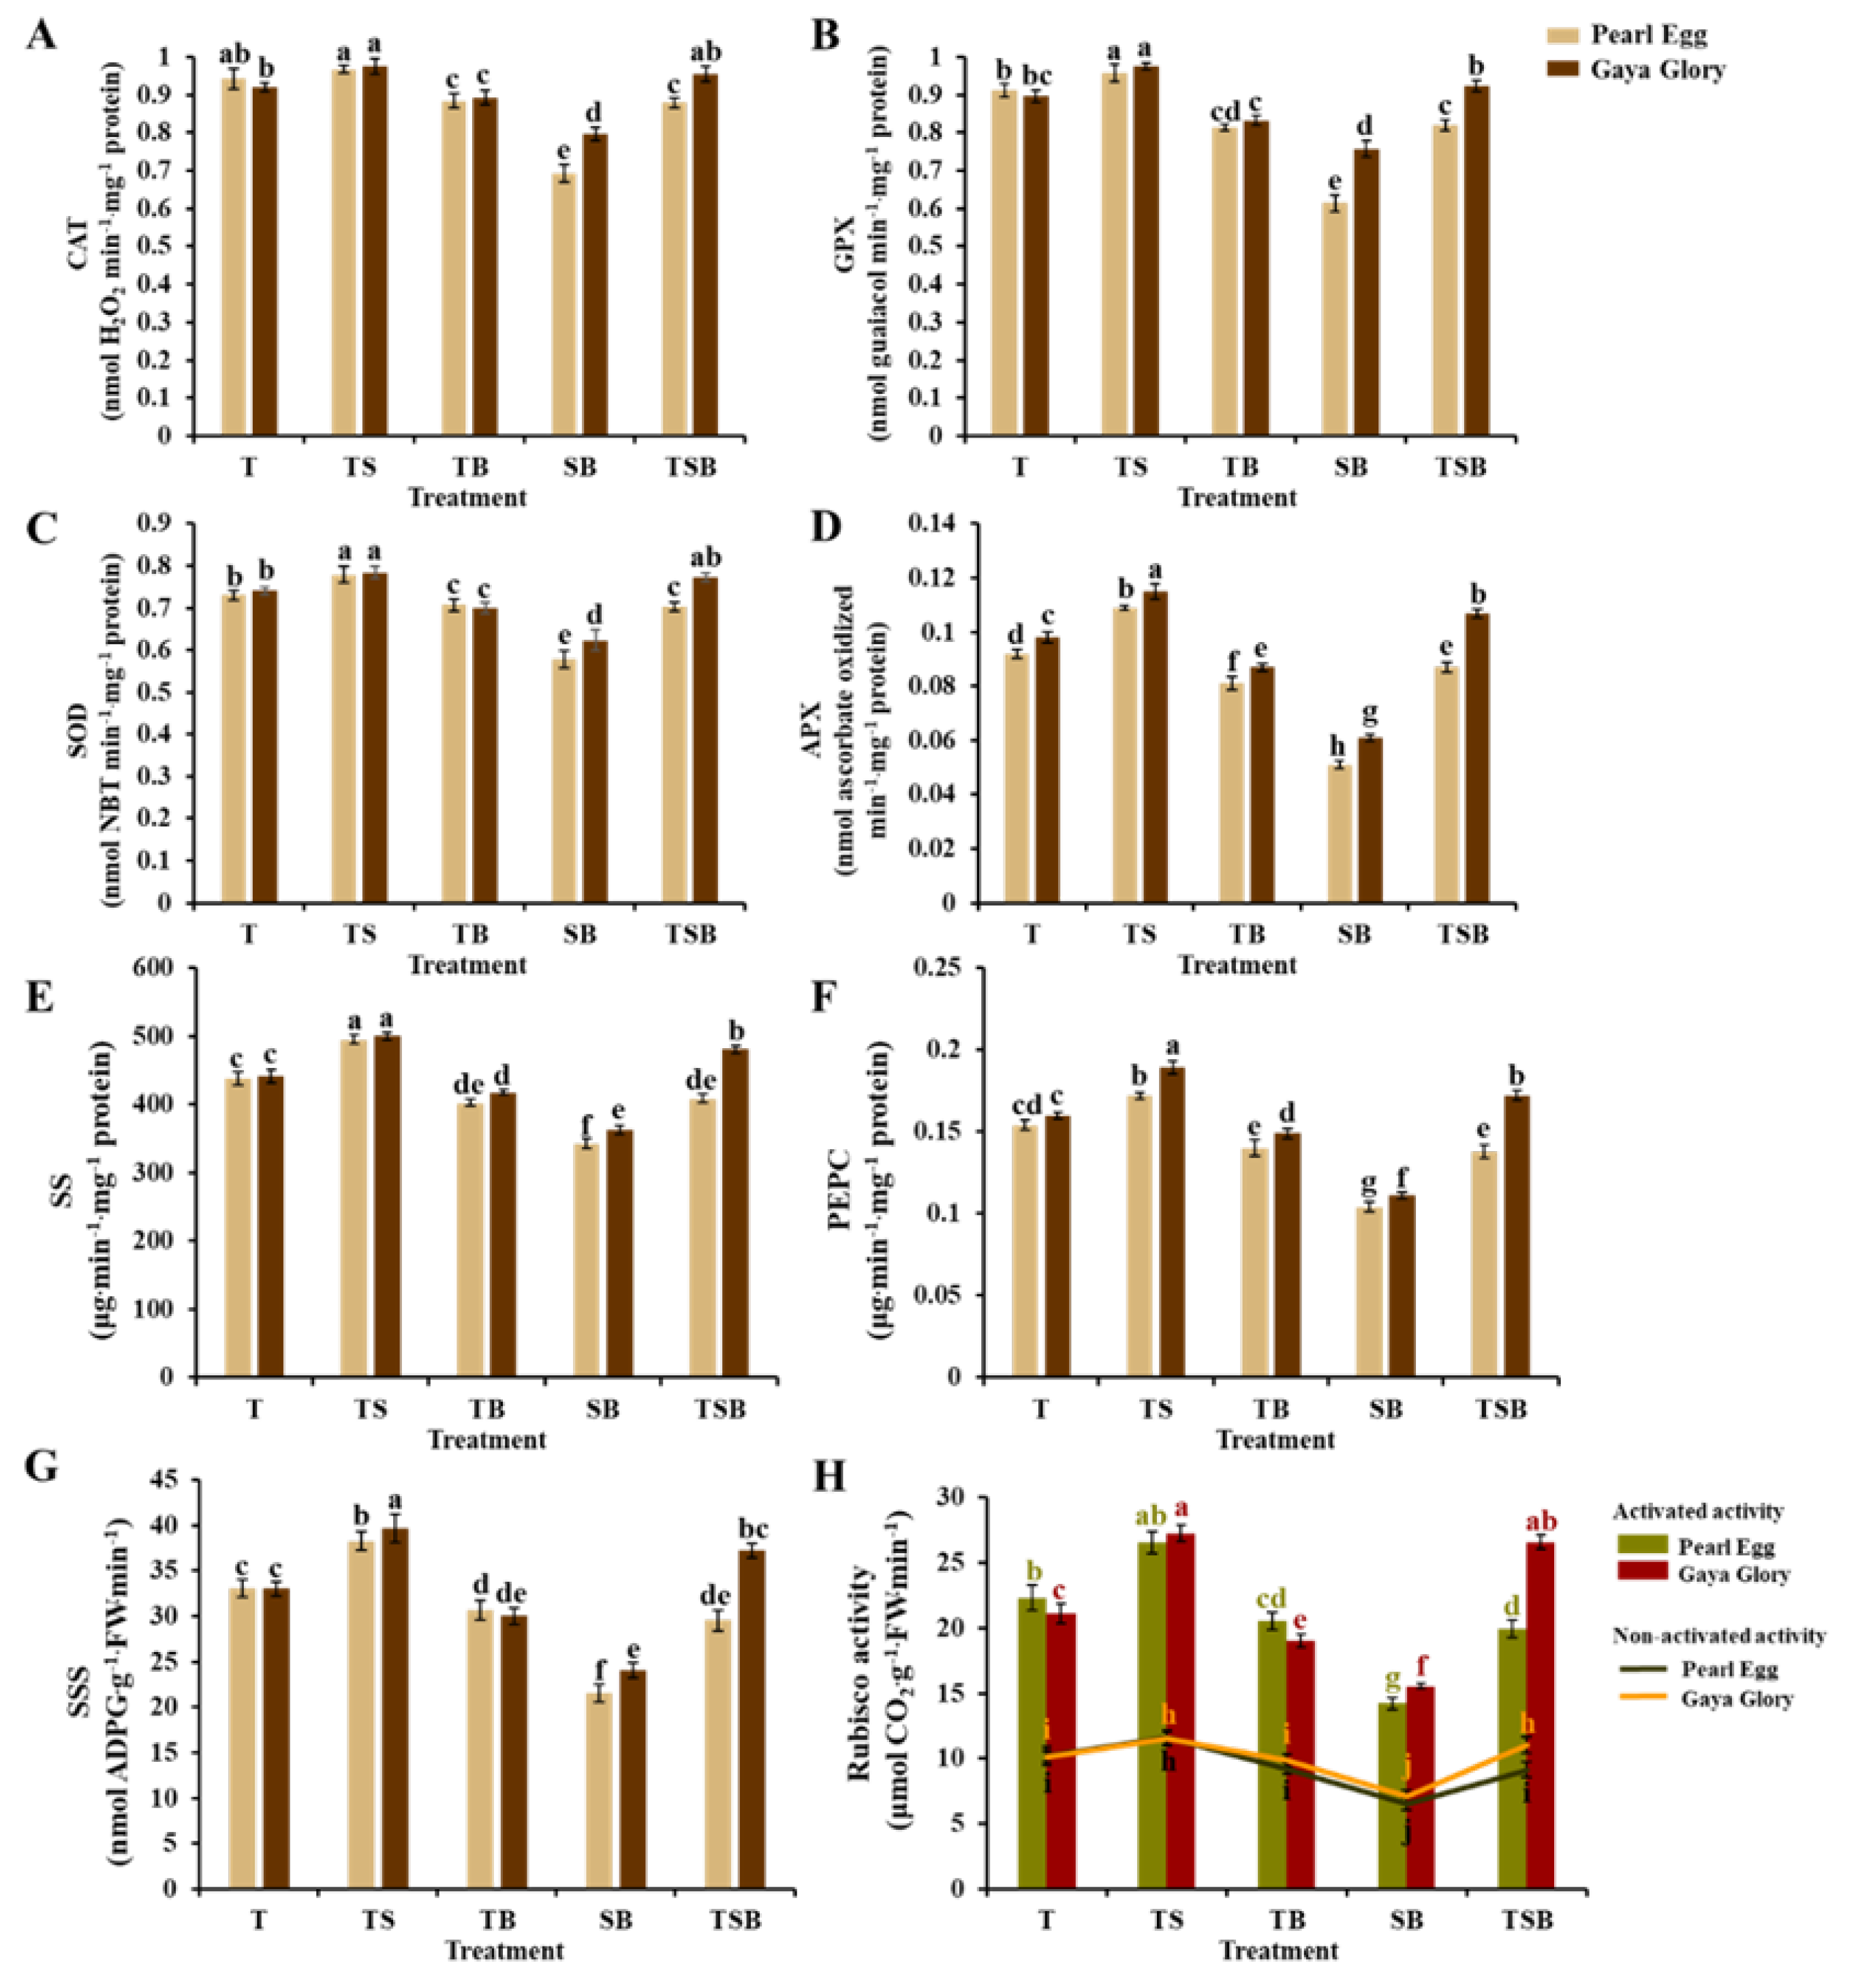
2.7. Enzymatic Activity
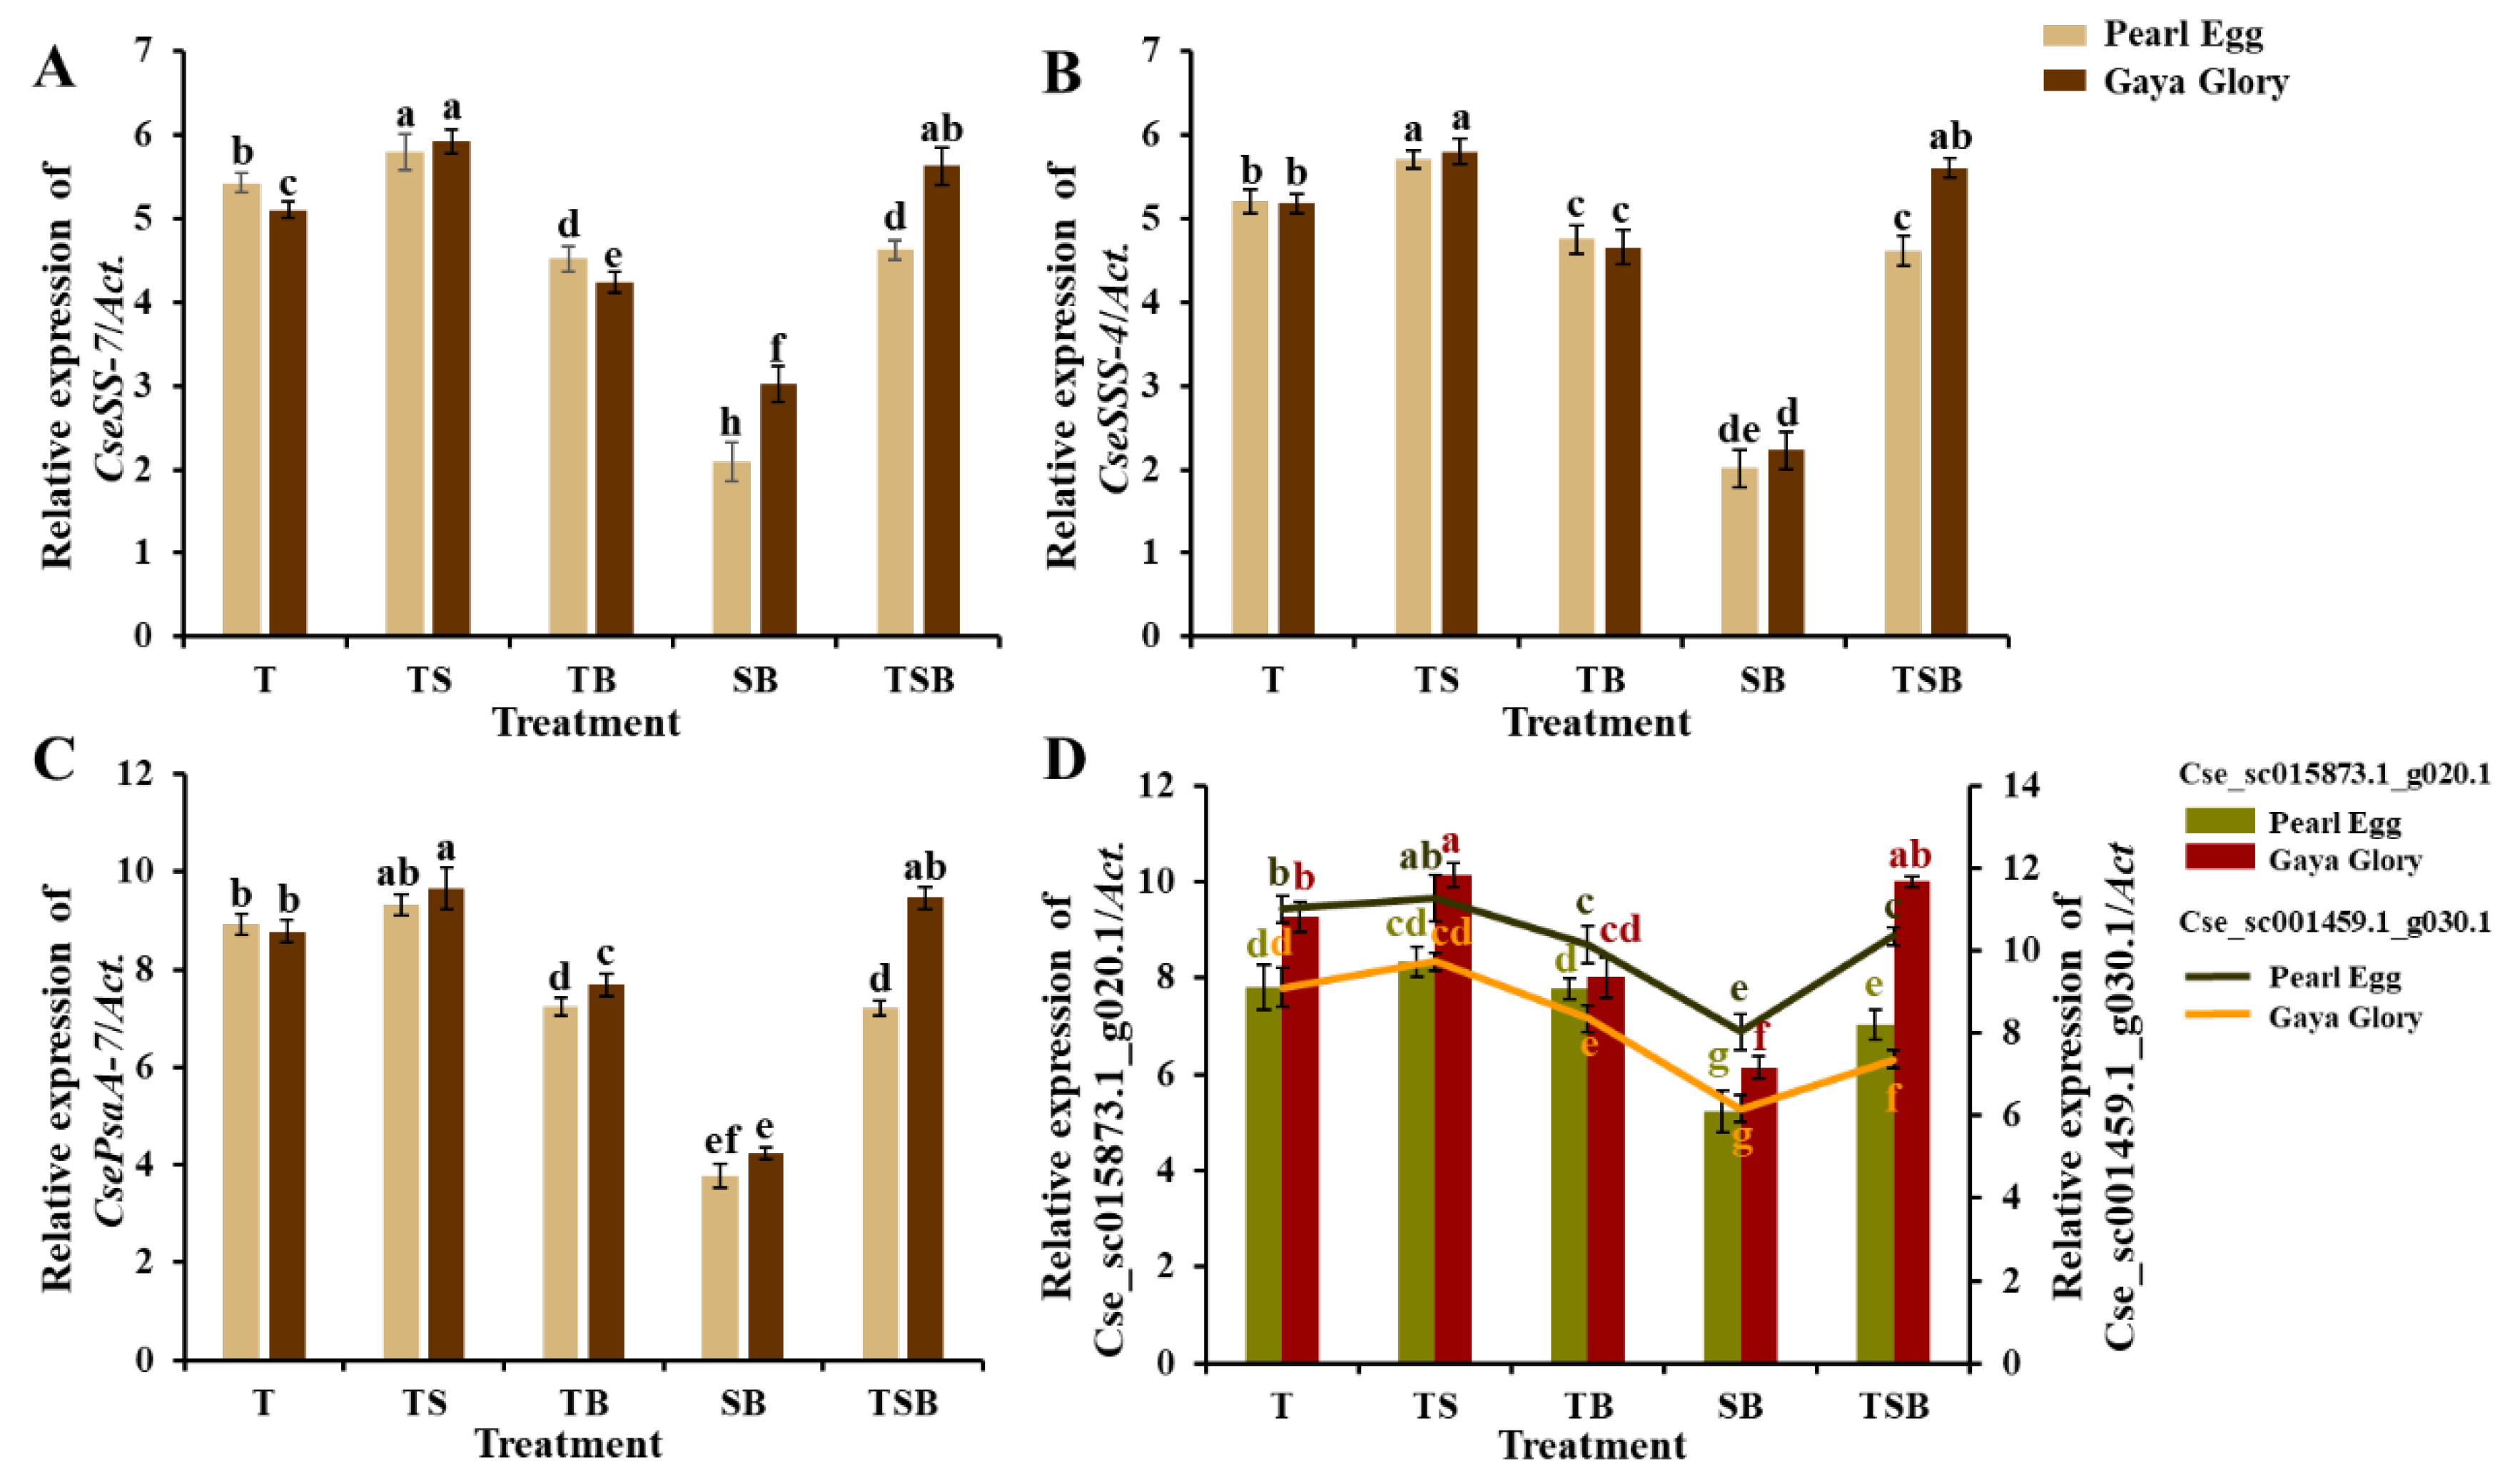
2.8. Gene Expression
3. Discussion
3.1. Variations in the Lighting Direction Combinations: Their Effects on Morphology and Growth Parameters of Chrysanthemum “Pearl Egg” and “Gaya Glory”
3.2. Variations in the Lighting Direction Combinations: Their Effects on the Leaf Anatomy, Epidermis, Stoma, and Chlorophyll Content of Chrysanthemum “Pearl Egg” and “Gaya Glory”
3.3. Variations in the Lighting Direction Combinations: Their Effects on Photosynthesis and Primary Metabolite Yields of Chrysanthemum “Pearl Egg” and “Gaya Glory”
3.4. Variations in the Lighting Direction Combinations: Their Effects on Enzymatic Activities and Gene Expressions in Chrysanthemum “Pearl Egg” and “Gaya Glory”
4. Materials and Methods
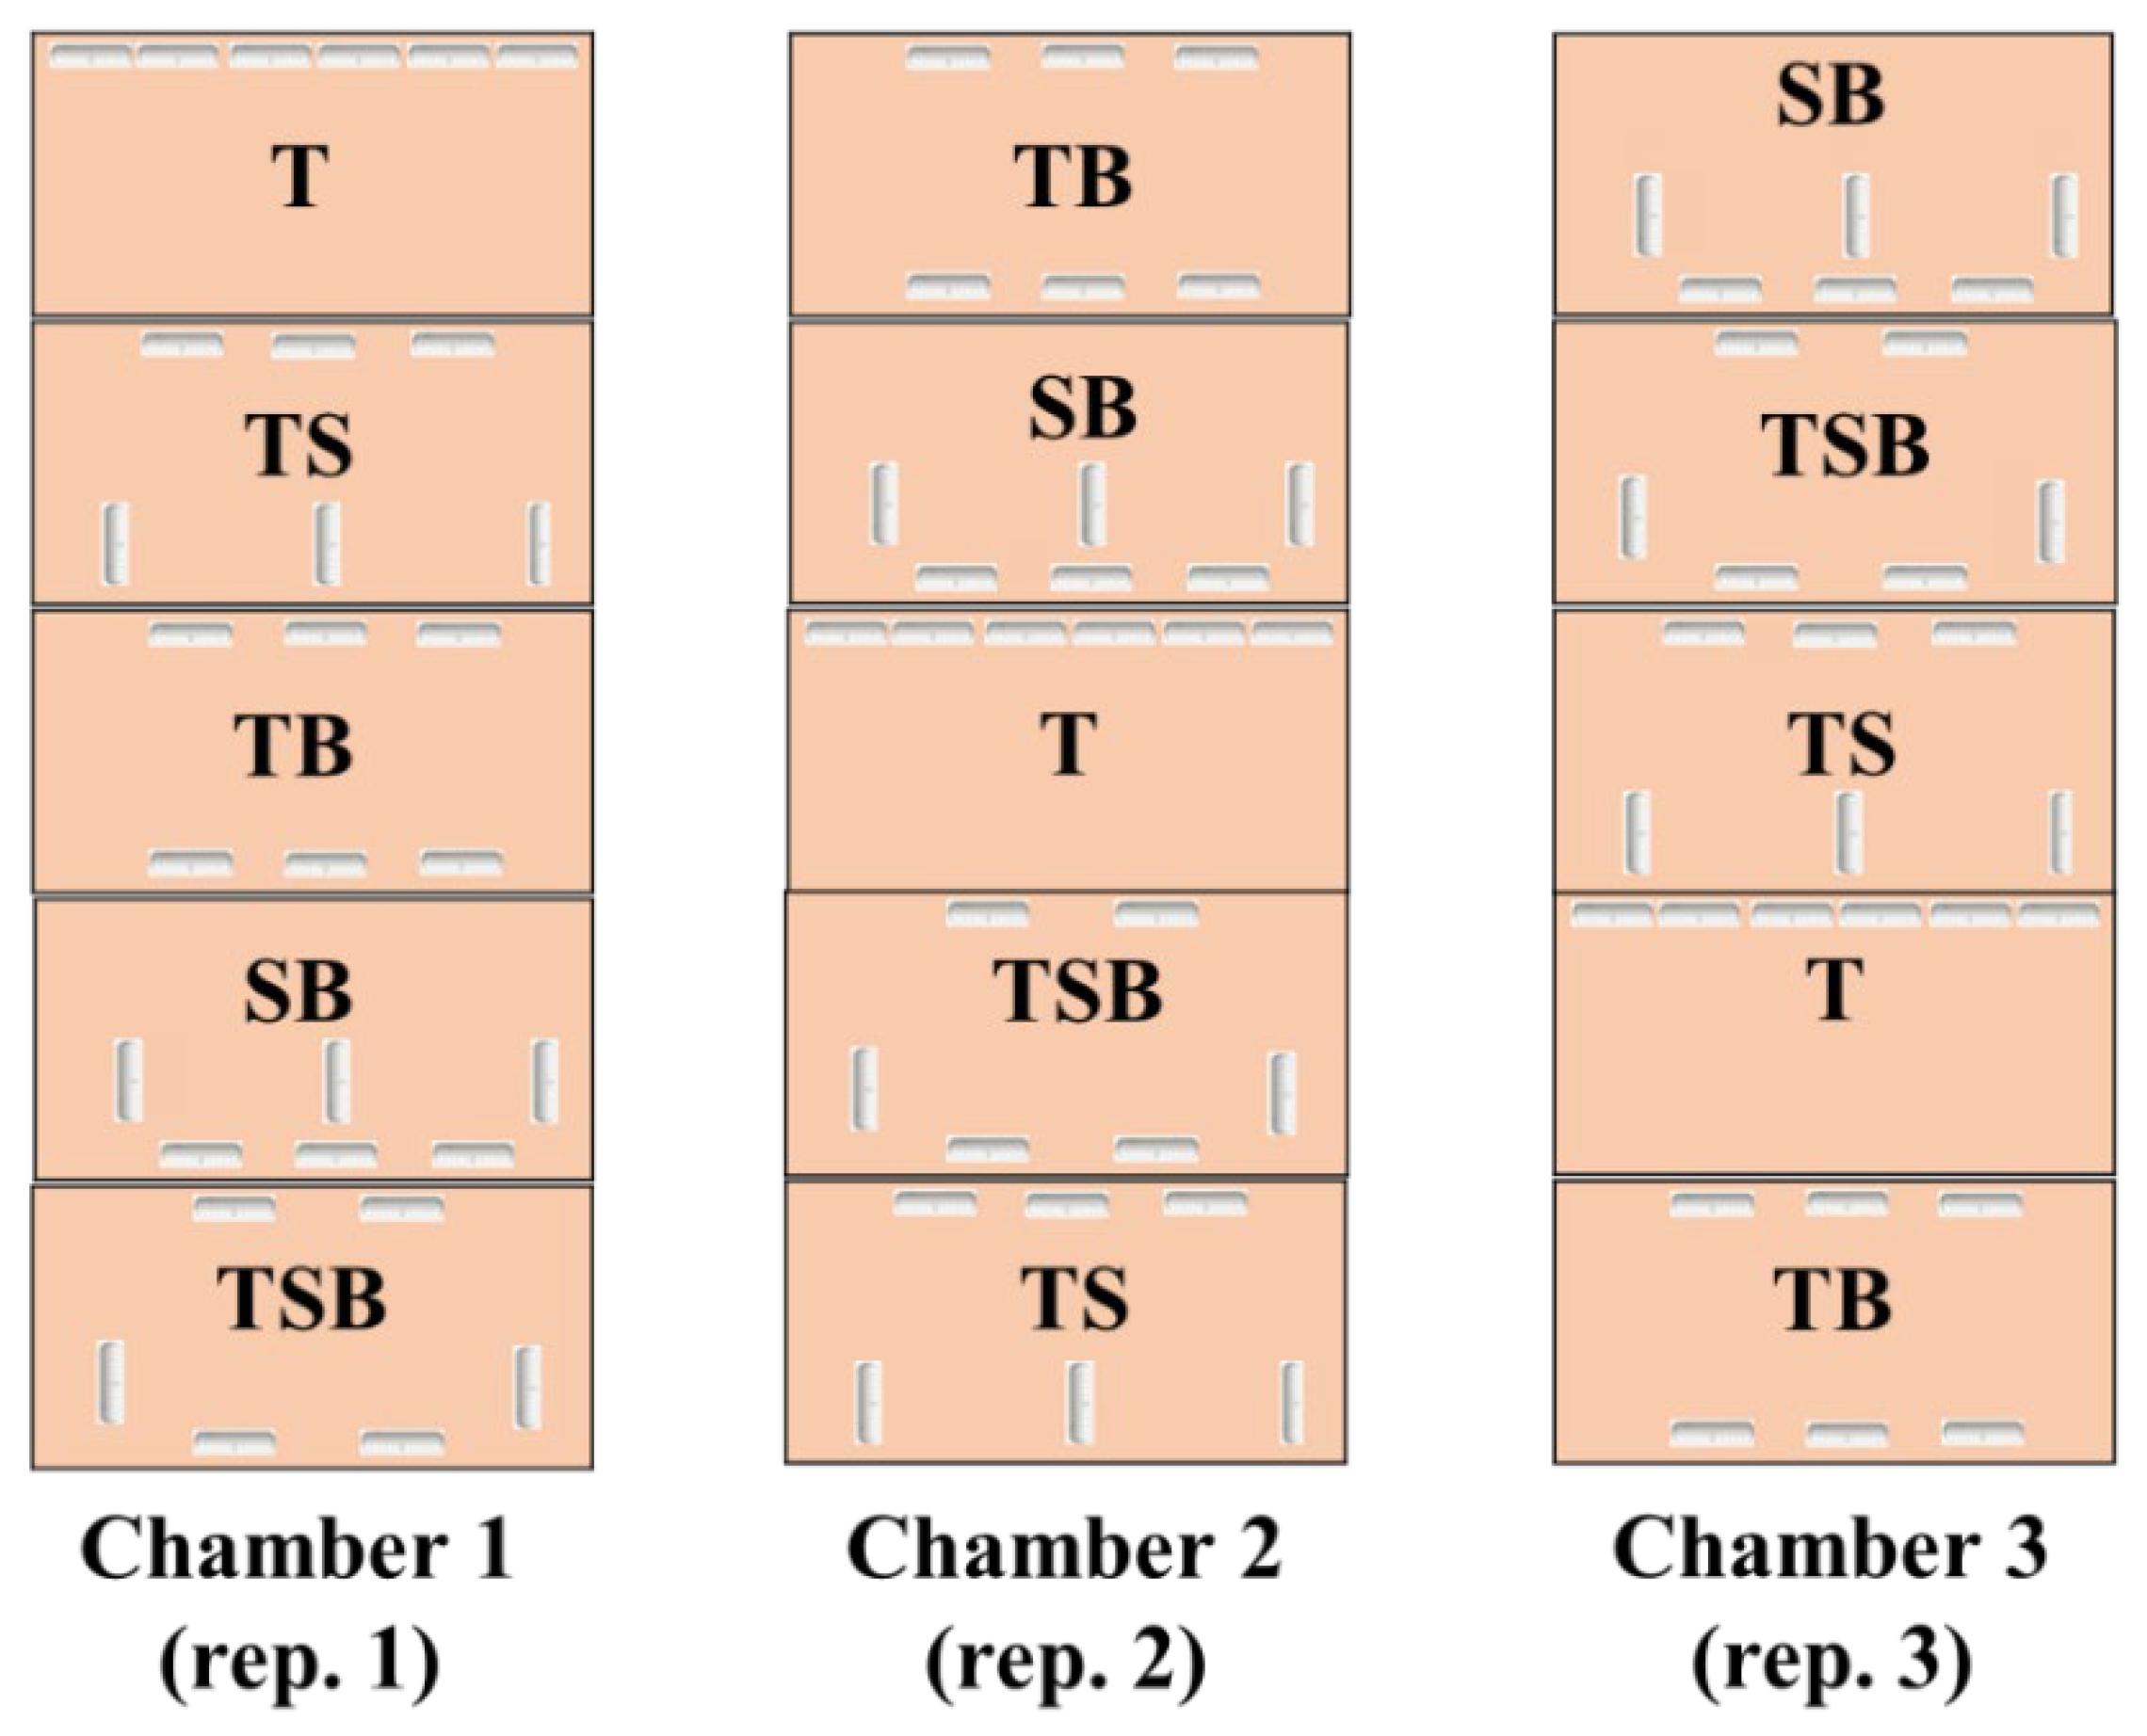
4.1. Plant Growth and Treatment Design
4.2. Measurements of the Growth Parameters
4.3. Leaf Anatomical Features
4.4. Epidermal Cell and Stomatal Characteristics
4.5. Photosynthesis and Chlorophyll Contents
4.6. Chlorophyll Fluorescence Measurements
4.7. Contents of Carbohydrates and Soluble Proteins
4.8. Enzyme Activities
4.9. Real-Time Quantitative PCR Verification
4.10. Statistical Analysis
5. Conclusions
Author Contributions
Funding
Institutional Review Board Statement
Informed Consent Statement
Data Availability Statement
Conflicts of Interest
References
- Mawphlang, O.I.; Kharshiing, E.V. Photoreceptor mediated plant growth responses: Implications for photoreceptor engineering toward improved performance in crops. Front. Plant Sci. 2017, 8, 1181. [Google Scholar] [CrossRef] [PubMed]
- Paik, I.; Huq, E. In plant photoreceptors: Multi-functional sensory proteins and their signaling networks. Semin. Cell Dev. Biol. 2019, 92, 114–121. [Google Scholar] [CrossRef] [PubMed]
- Ibaraki, Y. Lighting efficiency in plant production under artificial lighting and plant growth modeling for evaluating the lighting efficiency. In Led Lighting for Urban Agriculture; Springer: New York, NY, USA, 2016; pp. 151–161. [Google Scholar]
- Saito, Y.; Shimizu, H.; Nakashima, H.; Miyasaka, J.; Ohdoi, K. The effect of light quality on growth of lettuce. IFAC Proc. Vol. 2010, 43, 294–298. [Google Scholar] [CrossRef]
- Zhang, X.; He, D.; Niu, G.; Yan, Z.; Song, J. Effects of environment lighting on the growth, photosynthesis, and quality of hydroponic lettuce in a plant factory. Int. J. Agric. Biol. Eng. 2018, 11, 33–40. [Google Scholar] [CrossRef]
- Kozai, T.; Niu, G.; Takagaki, M. Plant Factory: An Indoor Vertical Farming System for Efficient Quality Food Production; Academic Press: Cambridge, MA, USA, 2019. [Google Scholar]
- Fujiwara, M.; Kubota, C.; Kozai, T.; Sakami, K. Air temperature effect on leaf development in vegetative propagation of sweetpotato single node cutting under artificial lighting. Sci. Hortic. 2004, 99, 249–256. [Google Scholar] [CrossRef] [Green Version]
- Goto, E. Plant Production in a closed plant factory with artificial lighting. In Proceedings of the VII International Symposium on Light in Horticultural Systems 956, Wageningen, The Netherlands, 14–18 October 2012; pp. 37–49. [Google Scholar]
- Kozai, T. Plant factory in Japan-current situation and perspectives. Chron. Hortic. 2013, 53, 8–11. [Google Scholar]
- Nicole, C.; Charalambous, F.; Martinakos, S.; Van De Voort, S.; Li, Z.; Verhoog, M.; Krijn, M. Lettuce growth and quality optimization in a plant factory. In Proceedings of the VIII International Symposium on Light in Horticulture 1134, East Lansing, MI, USA, 22 May 2016; pp. 231–238. [Google Scholar]
- Ibaraki, Y.; Shigemoto, C. Estimation of supplemental lighting efficiency based on PPFD distribution on the canopy surface. J. Agric. Meteorol. 2013, 69, 47–54. [Google Scholar] [CrossRef] [Green Version]
- Kozai, T. Resource use efficiency of closed plant production system with artificial light: Concept, estimation and application to plant factory. Proc. Jpn. Acad. Ser. B 2013, 89, 447–461. [Google Scholar] [CrossRef] [Green Version]
- Yang, J.; Jeong, B.R. Side lighting enhances morphophysiology by inducing more branching and flowering in chrysanthemum grown in controlled environment. Int. J. Mol. Sci. 2021, 22, 12019. [Google Scholar] [CrossRef]
- Yang, J.; Song, J.; Jeong, B.R. Side lighting enhances morphophysiology and runner formation by upregulating photosynthesis in strawberry grown in controlled environment. Agronomy 2022, 12, 24. [Google Scholar] [CrossRef]
- Liscum, E.; Askinosie, S.K.; Leuchtman, D.L.; Morrow, J.; Willenburg, K.T.; Coats, D.R. Phototropism: Growing towards an understanding of plant movement. Plant Cell 2014, 26, 38–55. [Google Scholar] [CrossRef] [PubMed] [Green Version]
- Mullen, J.L.; Weinig, C.; Hangarter, R.P. Shade avoidance and the regulation of leaf inclination in Arabidopsis. Plant Cell Environ. 2006, 29, 1099–1106. [Google Scholar] [CrossRef] [Green Version]
- Van Zanten, M.; Pons, T.; Janssen, J.; Voesenek, L.; Peeters, A. On the relevance and control of leaf angle. Crit. Rev. Plant Sci. 2010, 29, 300–316. [Google Scholar] [CrossRef]
- Ren, X.; Liu, Y.; Jeong, H.K.; Jeong, B.R. Supplementary light source affects the growth and development of Codonopsis lanceolata seedlings. Int. J. Mol. Sci. 2018, 19, 3074. [Google Scholar] [CrossRef] [PubMed] [Green Version]
- Sack, L.; Buckley, T.N. The developmental basis of stomatal density and flux. Plant Physiol. 2016, 171, 2358–2363. [Google Scholar] [CrossRef] [Green Version]
- Kardel, F.; Wuyts, K.; Babanezhad, M.; Wuytack, T.; Potters, G.; Samson, R. Assessing urban habitat quality based on specific leaf area and stomatal characteristics of Plantago lanceolata L. Environ. Pollut. 2010, 158, 788–794. [Google Scholar] [CrossRef]
- Rascher, U.; Liebig, M.; Lüttge, U. Evaluation of instant light-response curves of chlorophyll fluorescence parameters obtained with a portable chlorophyll fluorometer on site in the field. Plant Cell Environ. 2000, 23, 1397–1405. [Google Scholar] [CrossRef]
- Yao, X.; Li, C.; Li, S.; Zhu, Q.; Zhang, H.; Wang, H.; Yu, C.; Martin, S.K.S.; Xie, F. Effect of shade on leaf photosynthetic capacity, light-intercepting, electron transfer and energy distribution of soybeans. Plant Growth Regul. 2017, 83, 409–416. [Google Scholar] [CrossRef]
- Wu, Y.S.; Feng, Y.; Gong, W.Z.; Ahmed, S.; Fan, Y.F.; Wu, X.L.; Yong, T.W.; Liu, W.G.; Kai, S.; Jiang, L. Shade adaptive response and yield analysis of different soybean genotypes in relay intercropping systems. J. Integr. Agric. 2017, 16, 1331–1340. [Google Scholar] [CrossRef]
- Song, J.N.; Liu, X.H.; Wang, Y.Q.; Yang, H.B. Transcriptome analysis reveals salinity responses in four Tartary buckwheat cultivars. J. Plant Biochem. Biotechnol. 2021, 30, 564–578. [Google Scholar] [CrossRef]
- Lotfi, R.; Pessarakli, M.; Gharavi, K.P.; Khoshvaghti, H. Physiological responses of Brassica napus to fulvic acid under water stress: Chlorophyll a fluorescence and antioxidant enzyme activity. Crop. J. 2015, 3, 434–439. [Google Scholar] [CrossRef] [Green Version]
- Huang, P.; Jia, D.; Yuan, Z.; Mei, S.; Ye, Y. Physiological responses of exotic weeds Gaura parviflora to drought stress. J. Northeast Agric. Univ. 2011, 42, 102–106. [Google Scholar]
- Huang, C.J.; Wei, G.; Jie, Y.C.; Xu, J.J.; Zhao, S.Y.; Wang, L.C.; Anjum, S.A. Responses of gas exchange, chlorophyll synthesis and ROS-scavenging systems to salinity stress in two ramies (Boehmeria nivea L.) cultivars. Photosynthetica 2015, 53, 455–463. [Google Scholar] [CrossRef]
- Seemann, J.R.; Sharkey, T.D. Salinity and nitrogen effects on photosynthesis, ribulose-1, 5-bisphosphate carboxylase and metabolite pool sizes in Phaseolus vulgaris L. Plant Physiol. 1986, 82, 555–560. [Google Scholar] [CrossRef] [Green Version]
- Delfine, S.; Alvino, A.; Villani, M.C.; Loreto, F. Restrictions to carbon dioxide conductance and photosynthesis in spinach leaves recovering from salt stress. Plant Physiol. 1999, 119, 1101–1106. [Google Scholar] [CrossRef] [Green Version]
- Redondo-Gómez, S.; Mateos, N.E.; Davy, A.J.; Fernández-Muñoz, F.; Castellanos, E.M.; Luque, T.; Figueroa, M.E. Growth and photosynthetic responses to salinity of the salt-marsh shrub Atriplex portulacoides. Ann. Bot 2007, 100, 555–563. [Google Scholar] [CrossRef] [Green Version]
- Kao, W.Y.; Tsai, T.T.; Shih, C.N. Photosynthetic gas exchange and chlorophyll a fluorescence of three wild soybean species in response to NaCl treatments. Photosynthetica 2003, 41, 415–419. [Google Scholar] [CrossRef]
- Ranjbarfordoei, A.; Samson, R.; Van Damme, P. Chlorophyll fluorescence performance of sweet almond [Prunus dulcis (miller) d. Webb] in response to salinity stress induced by NaCl. Photosynthetica 2006, 44, 513–522. [Google Scholar] [CrossRef]
- Stępień, P.; Kłbus, G. Water relations and photosynthesis in Cucumis sativus L. Leaves under salt stress. Biol. Plantarum 2006, 50, 610–616. [Google Scholar] [CrossRef]
- Mauser, H.; King, W.A.; Gready, J.E.; Andrews, T.J. CO2 fixation by rubisco: Computational dissection of the key steps of carboxylation, hydration, and C− C bond cleavage. J. Am. Chem. Soc. 2001, 123, 10821–10829. [Google Scholar] [CrossRef]
- Evans, J.R.; Seemann, J.R. The allocation of protein nitrogen in the photosynthetic apparatus: Costs, consequences, and control. Photosynth. Res. 1989, 8, 183–205. [Google Scholar]
- Yang, F.; Fan, Y.; Wu, X.; Cheng, Y.; Liu, Q.; Feng, L.; Chen, J.; Wang, Z.; Wang, X.; Yong, T. Auxin to gibberellin ratio as a signal for light intensity and quality in regulating soybean growth and matter partitioning. Front. Plant Sci. 2018, 9, 56. [Google Scholar] [CrossRef] [Green Version]
- Park, Y.G.; Jeong, B.R. Both the quality and positioning of the night interruption light are important for flowering and plant extension growth. J. Plant Growth Regul. 2020, 39, 583–593. [Google Scholar] [CrossRef] [Green Version]
- Park, Y.G.; Jeong, B.R. How supplementary or night-interrupting low-intensity blue light affects the flower induction in chrysanthemum, a qualitative short-day plant. Plants 2020, 9, 1694. [Google Scholar] [CrossRef]
- Wang, M.; Wei, H.; Jeong, B.R. Lighting direction affects leaf morphology, stomatal characteristics, and physiology of head lettuce (Lactuca sativa L.). Int. J. Mol. Sci. 2021, 22, 3157. [Google Scholar] [CrossRef]
- Ma, C.F.; Dai, S.L. Advances in photoreceptor-mediated signaling transduction in flowering time regulation. Chin. Bull. Bot. 2019, 54, 9. [Google Scholar]
- Blümel, M.; Dally, N.; Jung, C. Flowering time regulation in crops—what did we learn from Arabidopsis? Curr. Opin. Biotech. 2015, 32, 121–129. [Google Scholar] [CrossRef]
- Samach, A.; Onouchi, H.; Gold, S.E.; Ditta, G.S.; Schwarz, S.Z.; Yanofsky, M.F.; Coupland, G. Distinct roles of CONSTANS target genes in reproductive development of Arabidopsis. Science 2000, 288, 1613–1616. [Google Scholar] [CrossRef] [Green Version]
- Abe, M.; Kobayashi, Y.; Yamamoto, S.; Daimon, Y.; Yamaguchi, A.; Ikeda, Y.; Ichinoki, H.; Notaguchi, M.; Goto, K.; Araki, T. FD, a bZIP protein mediating signals from the floral pathway integrator FT at the shoot apex. Science 2005, 309, 1052–1056. [Google Scholar] [CrossRef]
- Adeyemo, O.S.; Chavarriaga, P.; Tohme, J.; Fregene, M.; Davis, S.J.; Setter, T.L. Overexpression of Arabidopsis FLOWERING LOCUS T (FT) gene improves floral development in cassava (Manihot esculenta, Crantz). PLoS ONE 2017, 12, e0181460. [Google Scholar] [CrossRef] [Green Version]
- Phillips, I. Apical dominance. Annu. Rev. Plant Physiol. 1975, 26, 341–367. [Google Scholar] [CrossRef]
- Otiende, M.A.; Fricke, K.; Nyabundi, J.O.; Ngamau, K.; Hajirezaei, M.R.; Druege, U. Involvement of the auxin–cytokinin homeostasis in adventitious root formation of rose cuttings as affected by their nodal position in the stock plant. Planta 2021, 254, 65. [Google Scholar] [CrossRef]
- Sun, D.; Zhang, L.; Yu, Q.; Zhang, J.; Li, P.; Zhang, Y.; Xing, X.; Ding, L.; Fang, W.; Chen, F. Integrated signals of jasmonates, sugars, cytokinins and auxin influence the initial growth of the second buds of chrysanthemum after decapitation. Biology 2021, 10, 440. [Google Scholar] [CrossRef]
- Neogy, A.; Singh, Z.; Mushahary, K.K.K.; Yadav, S.R. Dynamic cytokinin signaling and function of auxin in cytokinin responsive domains during rice crown root development. Plant Cell Rep. 2021, 40, 1367–1375. [Google Scholar] [CrossRef]
- Kozai, T.; Kino, S.; Jeong, B.; Kinowaki, M.; Ochiai, M.; Hayashi, M.; Mori, K. In a sideward lighting system using diffusive optical fibers for production of vigorous micropropagated plantlets. In Proceedings of the International Symposium on Transplant Production Systems 319, Yokohama, Japan, 21–26 July 1992; pp. 237–242. [Google Scholar]
- Van, G.K.; Kang, C.; Pierik, R. Light signaling, root development, and plasticity. Plant Physiol. 2018, 176, 1049–1060. [Google Scholar]
- Vandenbussche, F.; Pierik, R.; Millenaar, F.F.; Voesenek, L.A.; Van Der Straeten, D. Reaching out of the shade. Curr. Opin. Plant Biol. 2005, 8, 462–468. [Google Scholar] [CrossRef]
- Sheerin, D.J.; Hiltbrunner, A. Molecular mechanisms and ecological function of far-red light signaling. Plant Cell Environ. 2017, 40, 2509–2529. [Google Scholar] [CrossRef] [PubMed]
- Weraduwage, S.M.; Chen, J.; Anozie, F.C.; Morales, A.; Weise, S.E.; Sharkey, T.D. The relationship between leaf area growth and biomass accumulation in Arabidopsis thaliana. Front. Plant Sci. 2015, 6, 167. [Google Scholar] [CrossRef] [PubMed] [Green Version]
- Marchi, S.; Tognetti, R.; Minnocci, A.; Borghi, M.; Sebastiani, L. Variation in mesophyll anatomy and photosynthetic capacity during leaf development in a deciduous mesophyte fruit tree (Prunus persica) and an evergreen sclerophyllous Mediterranean shrub (Olea europaea). Trees 2008, 22, 559–571. [Google Scholar] [CrossRef]
- Waldhoff, D.; Parolin, P. Morphology and anatomy of leaves. In Amazonian Floodplain Forests; Springer: Dordrecht, The Netherlands, 2010; pp. 179–202. [Google Scholar]
- Kalve, S.; Fotschki, J.; Beeckman, T.; Vissenberg, K.; Beemster, G.T. Three-dimensional patterns of cell division and expansion throughout the development of Arabidopsis thaliana. leaves. J. Exp. Bot. 2014, 65, 6385–6397. [Google Scholar] [CrossRef] [Green Version]
- Terashima, I.; Inoue, Y. Palisade tissue chloroplasts and spongy tissue chloroplasts in spinach: Biochemical and ultrastructural differences. Plant Cell Physiol. 1985, 26, 63–75. [Google Scholar]
- Wittmann, C.; Aschan, G.; Pfanz, H. Leaf and twig photosynthesis of young beech (Fagus sylvatica) and aspen (Populus tremula) trees grown under different light regime. Basic Appl. Ecol. 2001, 2, 145–154. [Google Scholar] [CrossRef]
- Borsuk, A.M.; Brodersen, C.R. The spatial distribution of chlorophyll in leaves. Plant Physiol. 2019, 180, 1406–1417. [Google Scholar] [CrossRef] [Green Version]
- Millenaar, F.F.; Van Zanten, M.; Cox, M.C.; Pierik, R.; Voesenek, L.A.; Peeters, A.J. Differential petiole growth in Arabidopsis thaliana: Photocontrol and hormonal regulation. New Phytol. 2009, 184, 141–152. [Google Scholar] [CrossRef]
- Pierik, R.; Cuppens, M.L.; Voesenek, L.A.; Visser, E.J. Interactions between ethylene and gibberellins in phytochrome-mediated shade avoidance responses in tobacco. Plant Physiol. 2004, 136, 2928–2936. [Google Scholar] [CrossRef] [Green Version]
- Niresh, J.; Kirubakaran, R.; Mohana Praddeesh, M.; Gokul, V.; Gokkul, T. An optimized observer for estimating torque converter characteristics for vehicles with automatic transmission. Int. J. Eng. Technol. 2018, 7, 573–577. [Google Scholar]
- Jumrani, K.; Bhatia, V.S.; Pandey, G.P. Impact of elevated temperatures on specific leaf weight, stomatal density, photosynthesis and chlorophyll fluorescence in soybean. Photosynth. Res. 2017, 131, 333–350. [Google Scholar] [CrossRef]
- Liao, J.X.; Ge, Y.; Huang, C.C.; Zhang, J.; Liu, Q.X.; Chang, J. Effects of irradiance on photosynthetic characteristics and growth of Mosla chinensis and M. scabra. Photosynthetica 2005, 43, 111–115. [Google Scholar] [CrossRef]
- Yin, Q.; Tian, T.; Kou, M.; Liu, P.; Wang, L.; Hao, Z.; Yue, M. The relationships between photosynthesis and stomatal traits on the Loess Plateau. Glob. Ecol. Conserv. 2020, 23, e01146. [Google Scholar] [CrossRef]
- Ma, J.; Zhu, Q.S.; Ma, W.B.; Tian, Y.H.; Yang, J.C.; Zhou, K.D. Studies on the photosynthetic characteristics and assimilate’s accumulation and transformation in heavy panicle type of rice. Agr. Sci. China 2003, 2, 602–608. [Google Scholar]
- Yamori, W.; Kusumi, K.; Iba, K.; Terashima, I. Increased stomatal conductance induces rapid changes to photosynthetic rate in response to naturally fluctuating light conditions in rice. Plant Cell Environ. 2020, 43, 1230–1240. [Google Scholar] [CrossRef]
- Dai, Y.; Shen, Z.; Liu, Y.; Wang, L.; Hannaway, D.; Lu, H. Effects of shade treatments on the photosynthetic capacity, chlorophyll fluorescence, and chlorophyll content of Tetrastigma hemsleyanum Diels et Gilg. Environ. Exp. Bot. 2009, 65, 177–182. [Google Scholar] [CrossRef]
- Liang, Y.; Feng, L.; Yin, C. Current status and prospect of chlorophyll fluorescence technique in the study of responses of microalgae to environmental stress. Mar. Sci. 2007, 31, 71. [Google Scholar]
- Zhang, Y.; Liu, G.J. Effects of cesium accumulation on chlorophyll content and fluorescence of Brassica juncea L. J. Environ. Radioactiv. 2018, 195, 26–32. [Google Scholar] [CrossRef] [PubMed]
- Liu, Y.; Ren, X.; Jeong, B.R. Supplementary light source affects growth, metabolism, and physiology of Adenophora triphylla (Thunb.) A.DC. seedlings. Biomed Res. Int. 2019, 2019, 6283989. [Google Scholar] [PubMed] [Green Version]
- Kreft, H.; Jetz, W. Global patterns and determinants of vascular plant diversity. Proc. Natl. Acad. Sci. USA 2007, 104, 5925–5930. [Google Scholar] [CrossRef] [Green Version]
- Chen, B.H.; Li, X.S.; Cao, Z.Y. A method for observing stoma by transparent gummed tape to tear epidermis from leaf. Plant Physiol. Commun. 2004, 40, 215–218. [Google Scholar]
- Sims, D.A.; Gamon, J.A. Relationships between leaf pigment content and spectral reflectance across a wide range of species, leaf structures and developmental stages. Remote Sens. Environ. 2002, 81, 337–354. [Google Scholar] [CrossRef]
- Maxwell, K.; Johnson, G.N.; Maxwell, K.; Johnson, G.N. Chlorophyll fluorescence—A practical guide. J. Exp. Bot. 2000, 51, 659–668. [Google Scholar] [CrossRef]
- Vasseur, F.; Pantin, F.; Vile, D. Changes in light intensity reveal a major role for carbon balance in Arabidopsis responses to high temperature. Plant Cell Environ. 2011, 34, 1563–1576. [Google Scholar] [CrossRef]
- Ren, X.X.; Xue, J.Q.; Wang, S.L.; Xue, Y.Q.; Zhang, P.; Jiang, H.D.; Zhang, X.X. Proteomic analysis of tree peony (Paeonia ostii ‘Feng Dan’) seed germination affected by low temperature. J. Plant Physiol. 2018, 224, 56–67. [Google Scholar] [CrossRef] [PubMed]
- Song, J.; Li, Y.; Hu, J.; Lee, J.; Jeong, B.R. Pre-and/or postharvest silicon application prolongs the vase life and enhances the quality of cut peony (Paeonia lactiflora Pall.) flowers. Plants 2021, 10, 1742. [Google Scholar] [CrossRef] [PubMed]
- Muneer, S.; Soundararajan, P.; Jeong, B.R. Proteomic and antioxidant analysis elucidates the underlying mechanism of tolerance to hyperhydricity stress in in vitro shoot cultures of Dianthus caryophyllus. J. Plant Growth Regul. 2016, 35, 667–679. [Google Scholar] [CrossRef]
- Bradford, M.M. A rapid and sensitive method for the quantitation of microgram quantities of protein utilizing the principle of protein-dye binding. Anal. Biochem. 1976, 72, 248–254. [Google Scholar] [CrossRef]
- Becana, M.; Tejo, P.A.; Irigoyen, J.J.; Sanchez-Dıaz, M. Some enzymes of hydrogen peroxide metabolism in leaves and root nodules of Medicago sativa. Plant Physiol. 1986, 82, 1169–1171. [Google Scholar] [CrossRef] [Green Version]
- Aeibi, H.; Bergmeyer, H. Methods in Enzymatic Analysis; Academic Press: New York, NY, USA, 1974; Volume 3, p. 673. [Google Scholar]
- Nakano, Y.; Asada, K. Hydrogen peroxide is scavenged by ascorbate-specific peroxidase in spinach chloroplasts. Plant Cell Physiol. 1981, 22, 867–880. [Google Scholar]
- Castillo, F.J.; Penel, C.; Greppin, H. Peroxidase release induced by ozone in Sedum album leaves: Involvement of Ca2+. Plant Physiol. 1984, 74, 846–851. [Google Scholar] [CrossRef] [Green Version]
- Feng, L.; Raza, M.A.; Li, Z.; Chen, Y.; Khalid, M.H.B.; Du, J.; Liu, W.; Wu, X.; Song, C.; Yu, L. The influence of light intensity and leaf movement on photosynthesis characteristics and carbon balance of soybean. Front. Plant Sci. 2019, 9, 1952. [Google Scholar] [CrossRef]
- Yang, L.T.; Chen, L.S.; Peng, H.Y.; Guo, P.; Wang, P.; Ma, C.L. Organic acid metabolism in Citrus grandis leaves and roots is differently affected by nitric oxide and aluminum interactions. Sci. Hortic. 2012, 133, 40–46. [Google Scholar] [CrossRef]
- Doehlert, D.C.; Kuo, T.M.; Felker, F.C. Enzymes of sucrose and hexose metabolism in developing kernels of two inbreds of maize. Plant Physiol. 1988, 86, 1013–1019. [Google Scholar] [CrossRef] [Green Version]
- Liang, J.S.; Cao, X.; Xu, S.; Zhu, Q.; Song, P. Studies on the relationship between the grain sink strength and its starch accumulation in rice (O. Sativa). Acta Agron. Sin. 1994, 20, 685–691. [Google Scholar]


| Cultivar (A) | Treatment (B) | Shoot | ||||||||
|---|---|---|---|---|---|---|---|---|---|---|
| Plant Height(cm) | Canopy Diameter (cm) | No. of Branches | Stem Diameter (mm) | No. of Nodes | Length of Top 5th Internode (mm) | Fresh Weight (g) | Dry Weight (g) | |||
| Pearl Egg | T 1 | 12.23 c 2 | 12.44 d | 8.33 e | 2.72 c | 15.00 d | 5.06 d | 18.46 e | 1.84 e | |
| TS | 14.73 a | 9.19 g | 11.33 d | 3.09 ab | 23.00 b | 5.68 bc | 24.95 d | 2.50 d | ||
| TB | 13.00 b | 8.22 h | 5.67 f | 2.73 c | 11.67 e | 5.79 b | 15.11 f | 1.51 f | ||
| SB | 10.60 e | 4.22 j | 2.67 g | 2.28 d | 15.33 d | 4.93 e | 8.21 h | 0.74 h | ||
| TSB | 10.17 f | 9.83 f | 8.67 e | 2.70 c | 19.00 c | 4.25 f | 15.16 f | 1.52 f | ||
| Gaya Glory | T | 10.90 d | 12.87 c | 16.00 c | 3.06 b | 16.00 d | 5.64 c | 31.90 c | 3.19 c | |
| TS | 12.23 c | 14.90 a | 20.00 a | 3.13 a | 22.67 b | 5.10 d | 47.88 a | 4.79 a | ||
| TB | 10.30 f | 10.87 e | 12.33 d | 2.17 e | 12.67 e | 6.26 a | 25.33 d | 2.53 d | ||
| SB | 8.30 g | 6.40 i | 6.33 f | 2.13 e | 19.33 c | 4.13 f | 12.94 g | 1.29 g | ||
| TSB | 12.27 c | 14.20 b | 17.67 b | 2.75 c | 27.00 a | 4.00 g | 40.75 b | 4.13 b | ||
| F-test | A | *** | *** | *** | *** | *** | *** | *** | *** | |
| B | *** | *** | *** | *** | *** | *** | *** | *** | ||
| A × B | *** | *** | *** | *** | *** | *** | *** | *** | ||
| Cultivar (A) | Treatment (B) | Leaf | Flower | Root | ||||||
| No. of Leaves | Adaxial Petiole Angle (°) | Length (cm) | Width (cm) | No. of Flowers | DVB 3 (Day) | Length (cm) | Fresh Weight (g) | Dry Weight (g) | ||
| Pearl Egg | T 1 | 93.33 ef 2 | 60.63 f | 3.78 c | 2.49 de | 18.00 ef | 16.67 h | 31.37 d | 2.81 c | 0.29 c |
| TS | 105.33 d | 75.90 e | 4.77 a | 3.09 a | 23.67 d | 13.33 i | 38.87 a | 3.61 a | 0.36 a | |
| TB | 83.67 g | 95.33 cd | 3.38 g | 2.19 g | 19.00 ef | 20.33 g | 27.31 e | 2.14 e | 0.21 e | |
| SB | 59.67 i | 121.27 a | 3.31 h | 2.04 i | 7.33 g | 29.67 c | 17.91 g | 1.10 g | 0.11 f | |
| TSB | 88.67 fg | 71.57 e | 3.71 d | 2.46 e | 17.00 f | 20.00 g | 27.41 e | 2.14 e | 0.21 e | |
| Gaya Glory | T | 121.00 c | 41.83 g | 3.60 e | 2.60 c | 31.33 c | 23.67 e | 32.37 c | 2.71 d | 0.28 d |
| TS | 171.67 a | 90.23 d | 4.08 b | 2.85 b | 82.33 a | 21.33 f | 33.87 b | 3.51 b | 0.35 b | |
| TB | 97.00 e | 100.17 c | 3.11 i | 2.39 f | 20.67 de | 26.33 d | 25.31 f | 2.04 f | 0.20 e | |
| SB | 74.67 h | 111.53 b | 2.89 j | 2.14 h | 8.00 g | 37.67 a | 15.57 h | 1.01 h | 0.10 f | |
| TSB | 164.67 b | 70.43 e | 3.43 f | 2.50 d | 55.33 b | 32.67 b | 25.41 f | 2.07 f | 0.21 e | |
| F-test | A | *** | NS | *** | *** | *** | *** | *** | *** | *** |
| B | *** | *** | *** | *** | *** | *** | *** | *** | *** | |
| A × B | *** | *** | *** | *** | * | *** | ** | NS | NS | |
| Cultivar (A) | Treatment (B) | Pn3 (μmol CO2 m−2·s−1) | Tr4 (mmol H2O m−2·s−1) | Gs5 (mol H2O m−2·s−1) | Ci6 (μmol CO2 mol−1) |
|---|---|---|---|---|---|
| Pearl Egg | T 1 | 19.00 d 2 | 2.10 d | 0.74 d | 449.73 d |
| TS | 19.73 c | 2.14 c | 0.78 c | 456.57 c | |
| TB | 17.53 e | 2.08 e | 0.72 e | 435.10 e | |
| SB | 13.03 g | 1.39 g | 0.37 f | 393.50 g | |
| TSB | 17.57 e | 2.08 e | 0.71 e | 435.10 e | |
| Gaya Glory | T | 19.87 bc | 2.16 c | 0.79 bc | 458.60 c |
| TS | 21.93 a | 2.22 a | 0.86 a | 490.17 a | |
| TB | 19.63 c | 2.15 c | 0.77 c | 456.10 c | |
| SB | 16.30 f | 1.92 f | 0.72 de | 401.90 f | |
| TSB | 20.13 b | 2.19 b | 0.81 b | 467.93 b | |
| F-test | A | *** | *** | *** | *** |
| B | *** | *** | *** | *** | |
| A × B | *** | *** | *** | *** |
| Cultivar (A) | Treatment (B) | Fv/Fm3 | Fv′/Fm′ 4 | NPQ 5 | qP6 |
|---|---|---|---|---|---|
| Pearl Egg | T 1 | 0.82 e 2 | 0.66 d | 2.76 c | 0.54 c |
| TS | 0.87 d | 0.71 c | 2.79 c | 0.59 b | |
| TB | 0.78 f | 0.52 e | 2.47 d | 0.45 d | |
| SB | 0.60 h | 0.41 g | 1.98 f | 0.33 f | |
| TSB | 0.79 f | 0.53 e | 2.50 d | 0.45 d | |
| Gaya Glory | T | 0.90 c | 0.72 c | 2.81 c | 0.58 b |
| TS | 0.99 a | 0.79 a | 2.97 a | 0.68 a | |
| TB | 0.86 d | 0.70 c | 2.78 c | 0.57 b | |
| SB | 0.68 g | 0.46 f | 2.07 e | 0.39 e | |
| TSB | 0.93 b | 0.75 b | 2.89 b | 0.66 a | |
| F-test | A | *** | *** | *** | *** |
| B | *** | *** | *** | *** | |
| A × B | *** | *** | *** | *** |
| Lighting Direction | Abbreviation | Light Intensity (μmol∙m−2∙s−1 Photosynthetic Photon Flux Density (PPFD)) |
|---|---|---|
| Top (1/1) | T | 600 |
| Top (1/2) + Side (1/2) | TS | 300 per lighting direction |
| Top (1/2) + Bottom (1/2) | TB | 300 per lighting direction |
| Side (1/2) + Bottom (1/2) | SB | 300 per lighting direction |
| Top (1/3) + Side (1/3) + Bottom (1/3) | TSB | 200 per lighting direction |
| Name | Gene ID | GO ID | Forward Primer (5′ to 3′) | Reverse Primer (5′ to 3′) |
|---|---|---|---|---|
| ACTTIN Cse_sc001321.1_g010.1 | 3641_0:00292c | GO:0005524 | AACTGGGACGATATGGAGAAGA | CGCAAGATAGCATGTGGAAGTG |
| SS-7 Cse_sc012707.1_g010.1 | 4232_0:0027ec | GO:0009507 | GGCCTTGGAGCAAAACTGGT | AGTCTATTCCAGCAACAGGTCC |
| SSS-4 Cse_sc005354.1_g010.1 | 4232_0:003c28 | GO:0016157 | TGAGAATATGTGCTGGCGGA | TCGCACCAACCCATGGATAC |
| PsaA-7 Cse_sc003237.1_g010.1 | 4232_0:00aa9f | GO:0016021 | ACTGGTAGTGGTGGGAAAGC | CTTAGAGCCTGAGCATCTGAGT |
| Cse_sc015873.1_g020.1 | 4236_0:004cfa | GO:0009909 | ATGTCTGGTGTTTGGGTGTTTA | CTACATATCTTACTTCAA |
| Cse_sc001459.1_g030.1 | 4232_0:00932a | GO:0042753 | GATGGCAAGGTGATGCAAACA | TCGAAAAATTCGACGAAAGATCC |
Publisher’s Note: MDPI stays neutral with regard to jurisdictional claims in published maps and institutional affiliations. |
© 2022 by the authors. Licensee MDPI, Basel, Switzerland. This article is an open access article distributed under the terms and conditions of the Creative Commons Attribution (CC BY) license (https://creativecommons.org/licenses/by/4.0/).
Share and Cite
Yang, J.; Song, J.; Jeong, B.R. Lighting from Top and Side Enhances Photosynthesis and Plant Performance by Improving Light Usage Efficiency. Int. J. Mol. Sci. 2022, 23, 2448. https://doi.org/10.3390/ijms23052448
Yang J, Song J, Jeong BR. Lighting from Top and Side Enhances Photosynthesis and Plant Performance by Improving Light Usage Efficiency. International Journal of Molecular Sciences. 2022; 23(5):2448. https://doi.org/10.3390/ijms23052448
Chicago/Turabian StyleYang, Jingli, Jinnan Song, and Byoung Ryong Jeong. 2022. "Lighting from Top and Side Enhances Photosynthesis and Plant Performance by Improving Light Usage Efficiency" International Journal of Molecular Sciences 23, no. 5: 2448. https://doi.org/10.3390/ijms23052448
APA StyleYang, J., Song, J., & Jeong, B. R. (2022). Lighting from Top and Side Enhances Photosynthesis and Plant Performance by Improving Light Usage Efficiency. International Journal of Molecular Sciences, 23(5), 2448. https://doi.org/10.3390/ijms23052448