
Red Blood Cell Morphodynamics in Patients with Polycythemia Vera and Stroke

 ,
,  ,
,
Abstract
:1. Introduction
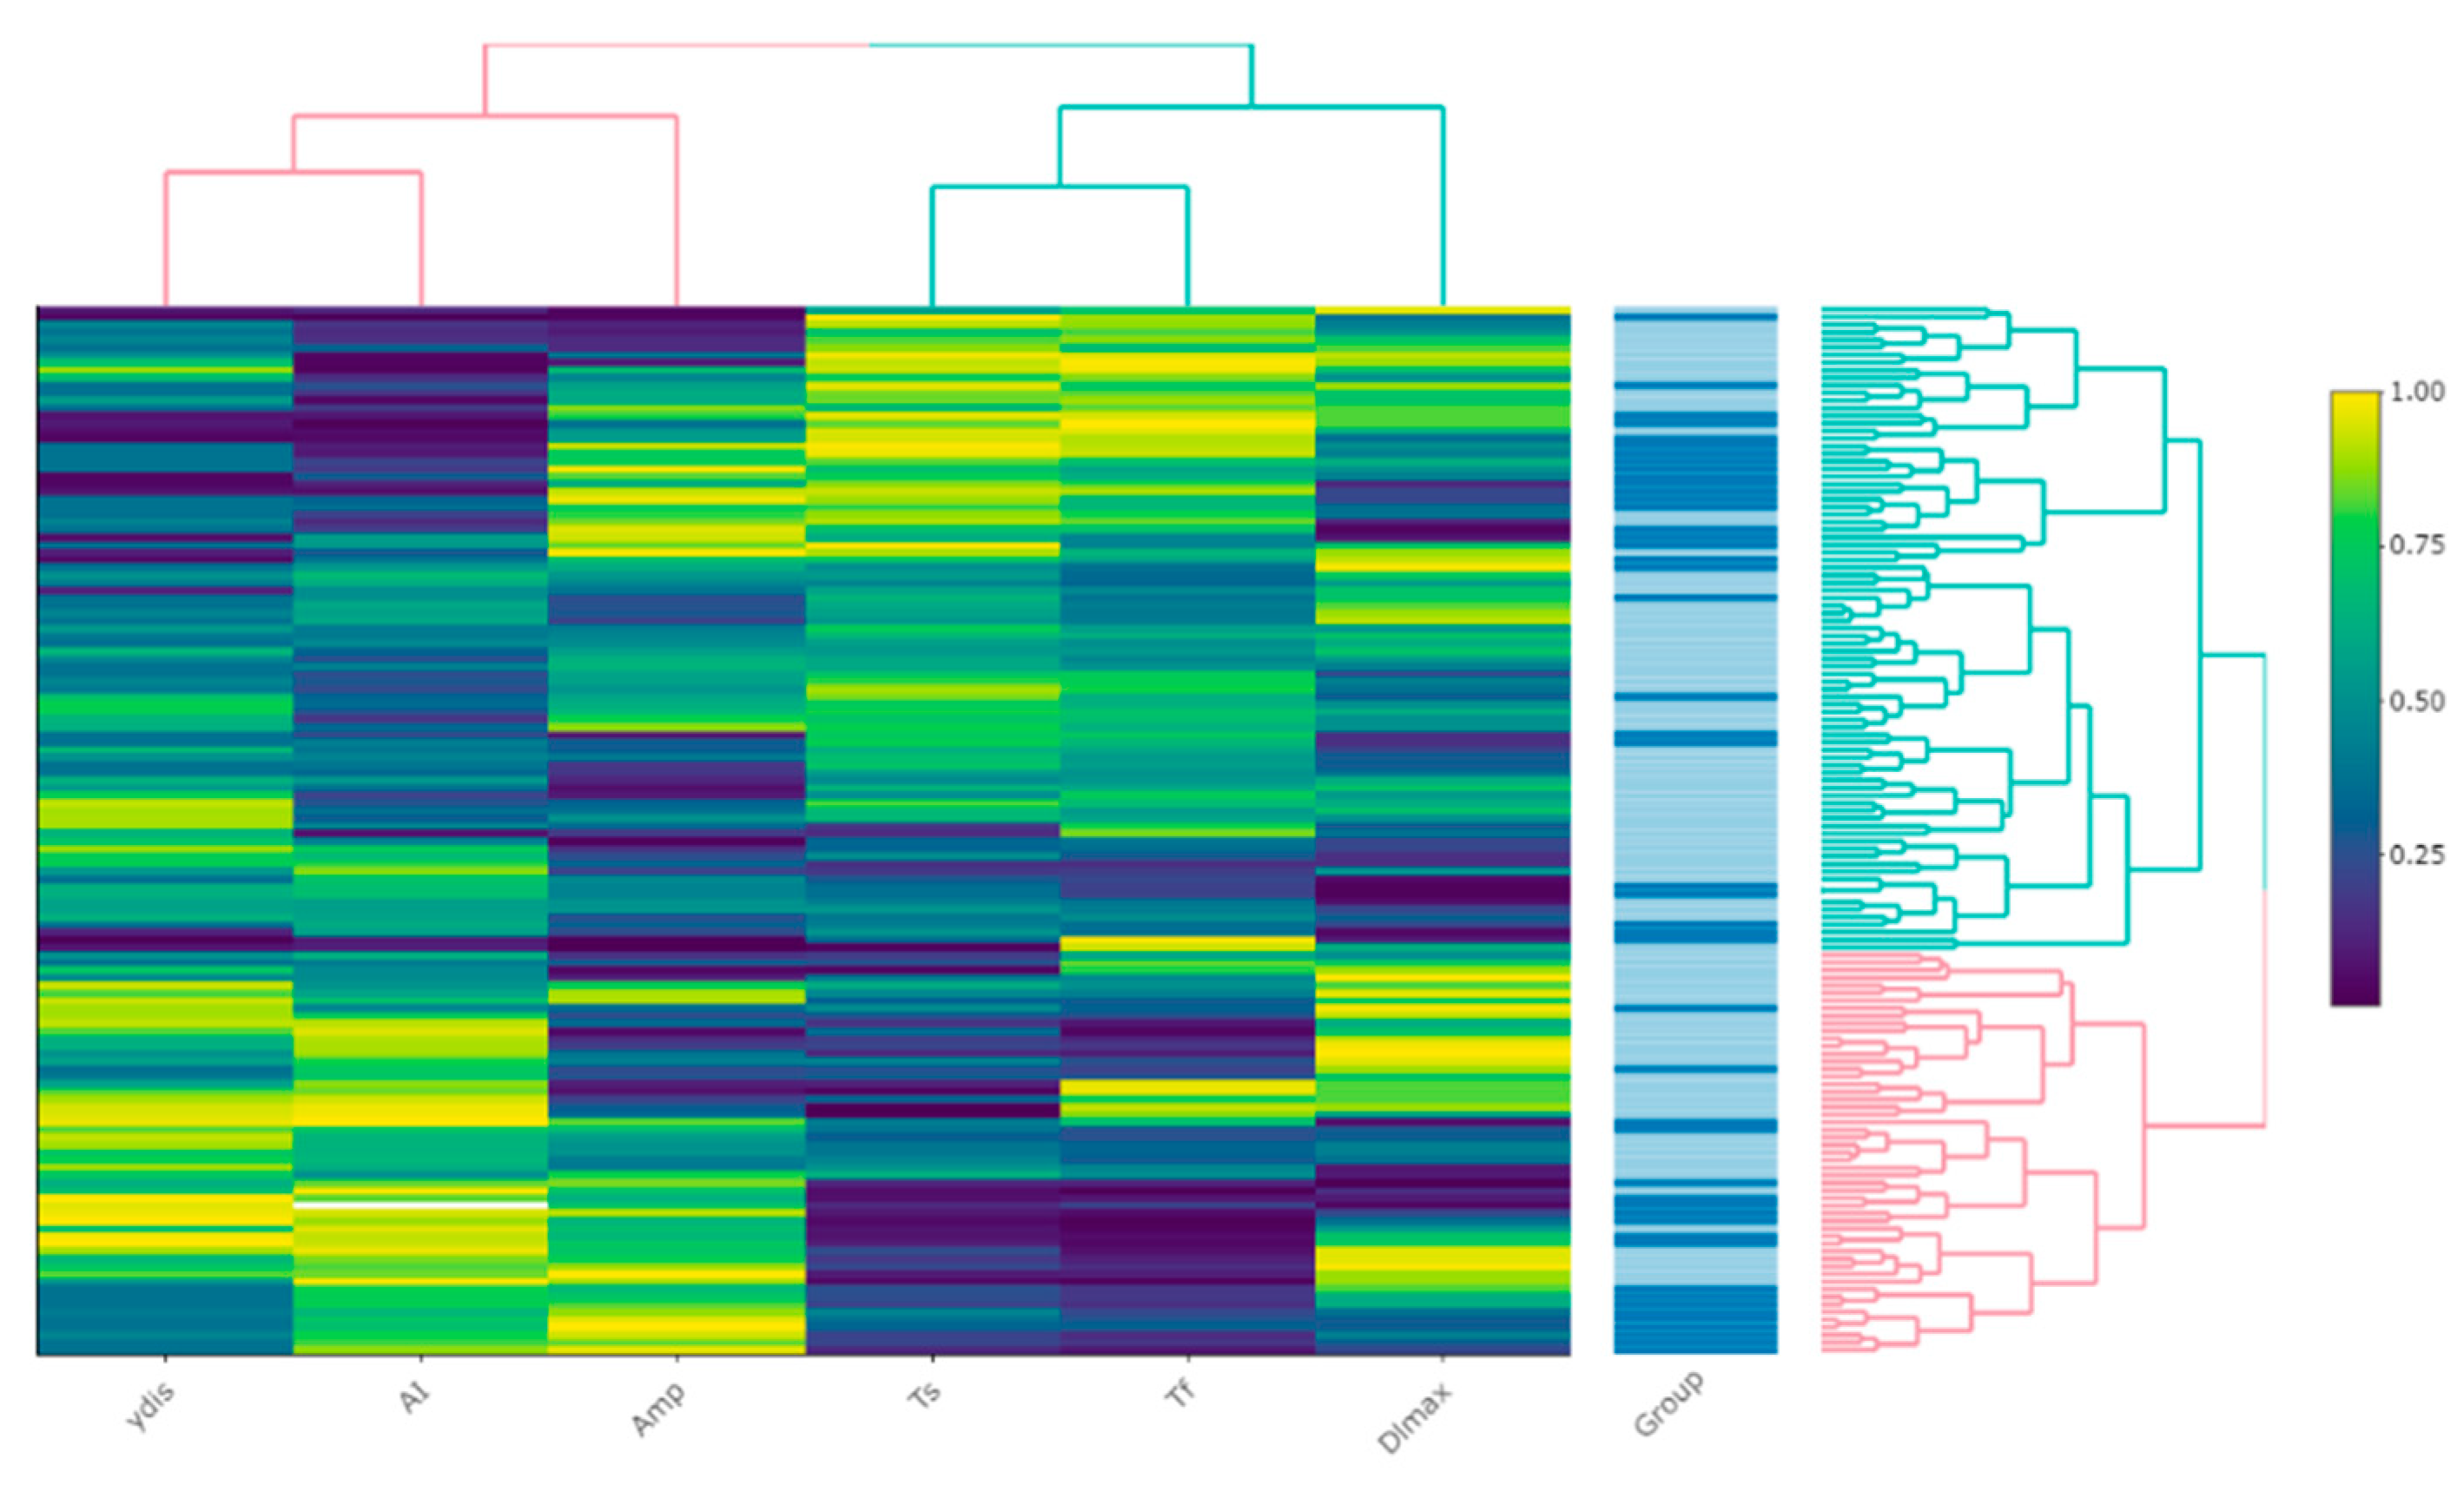
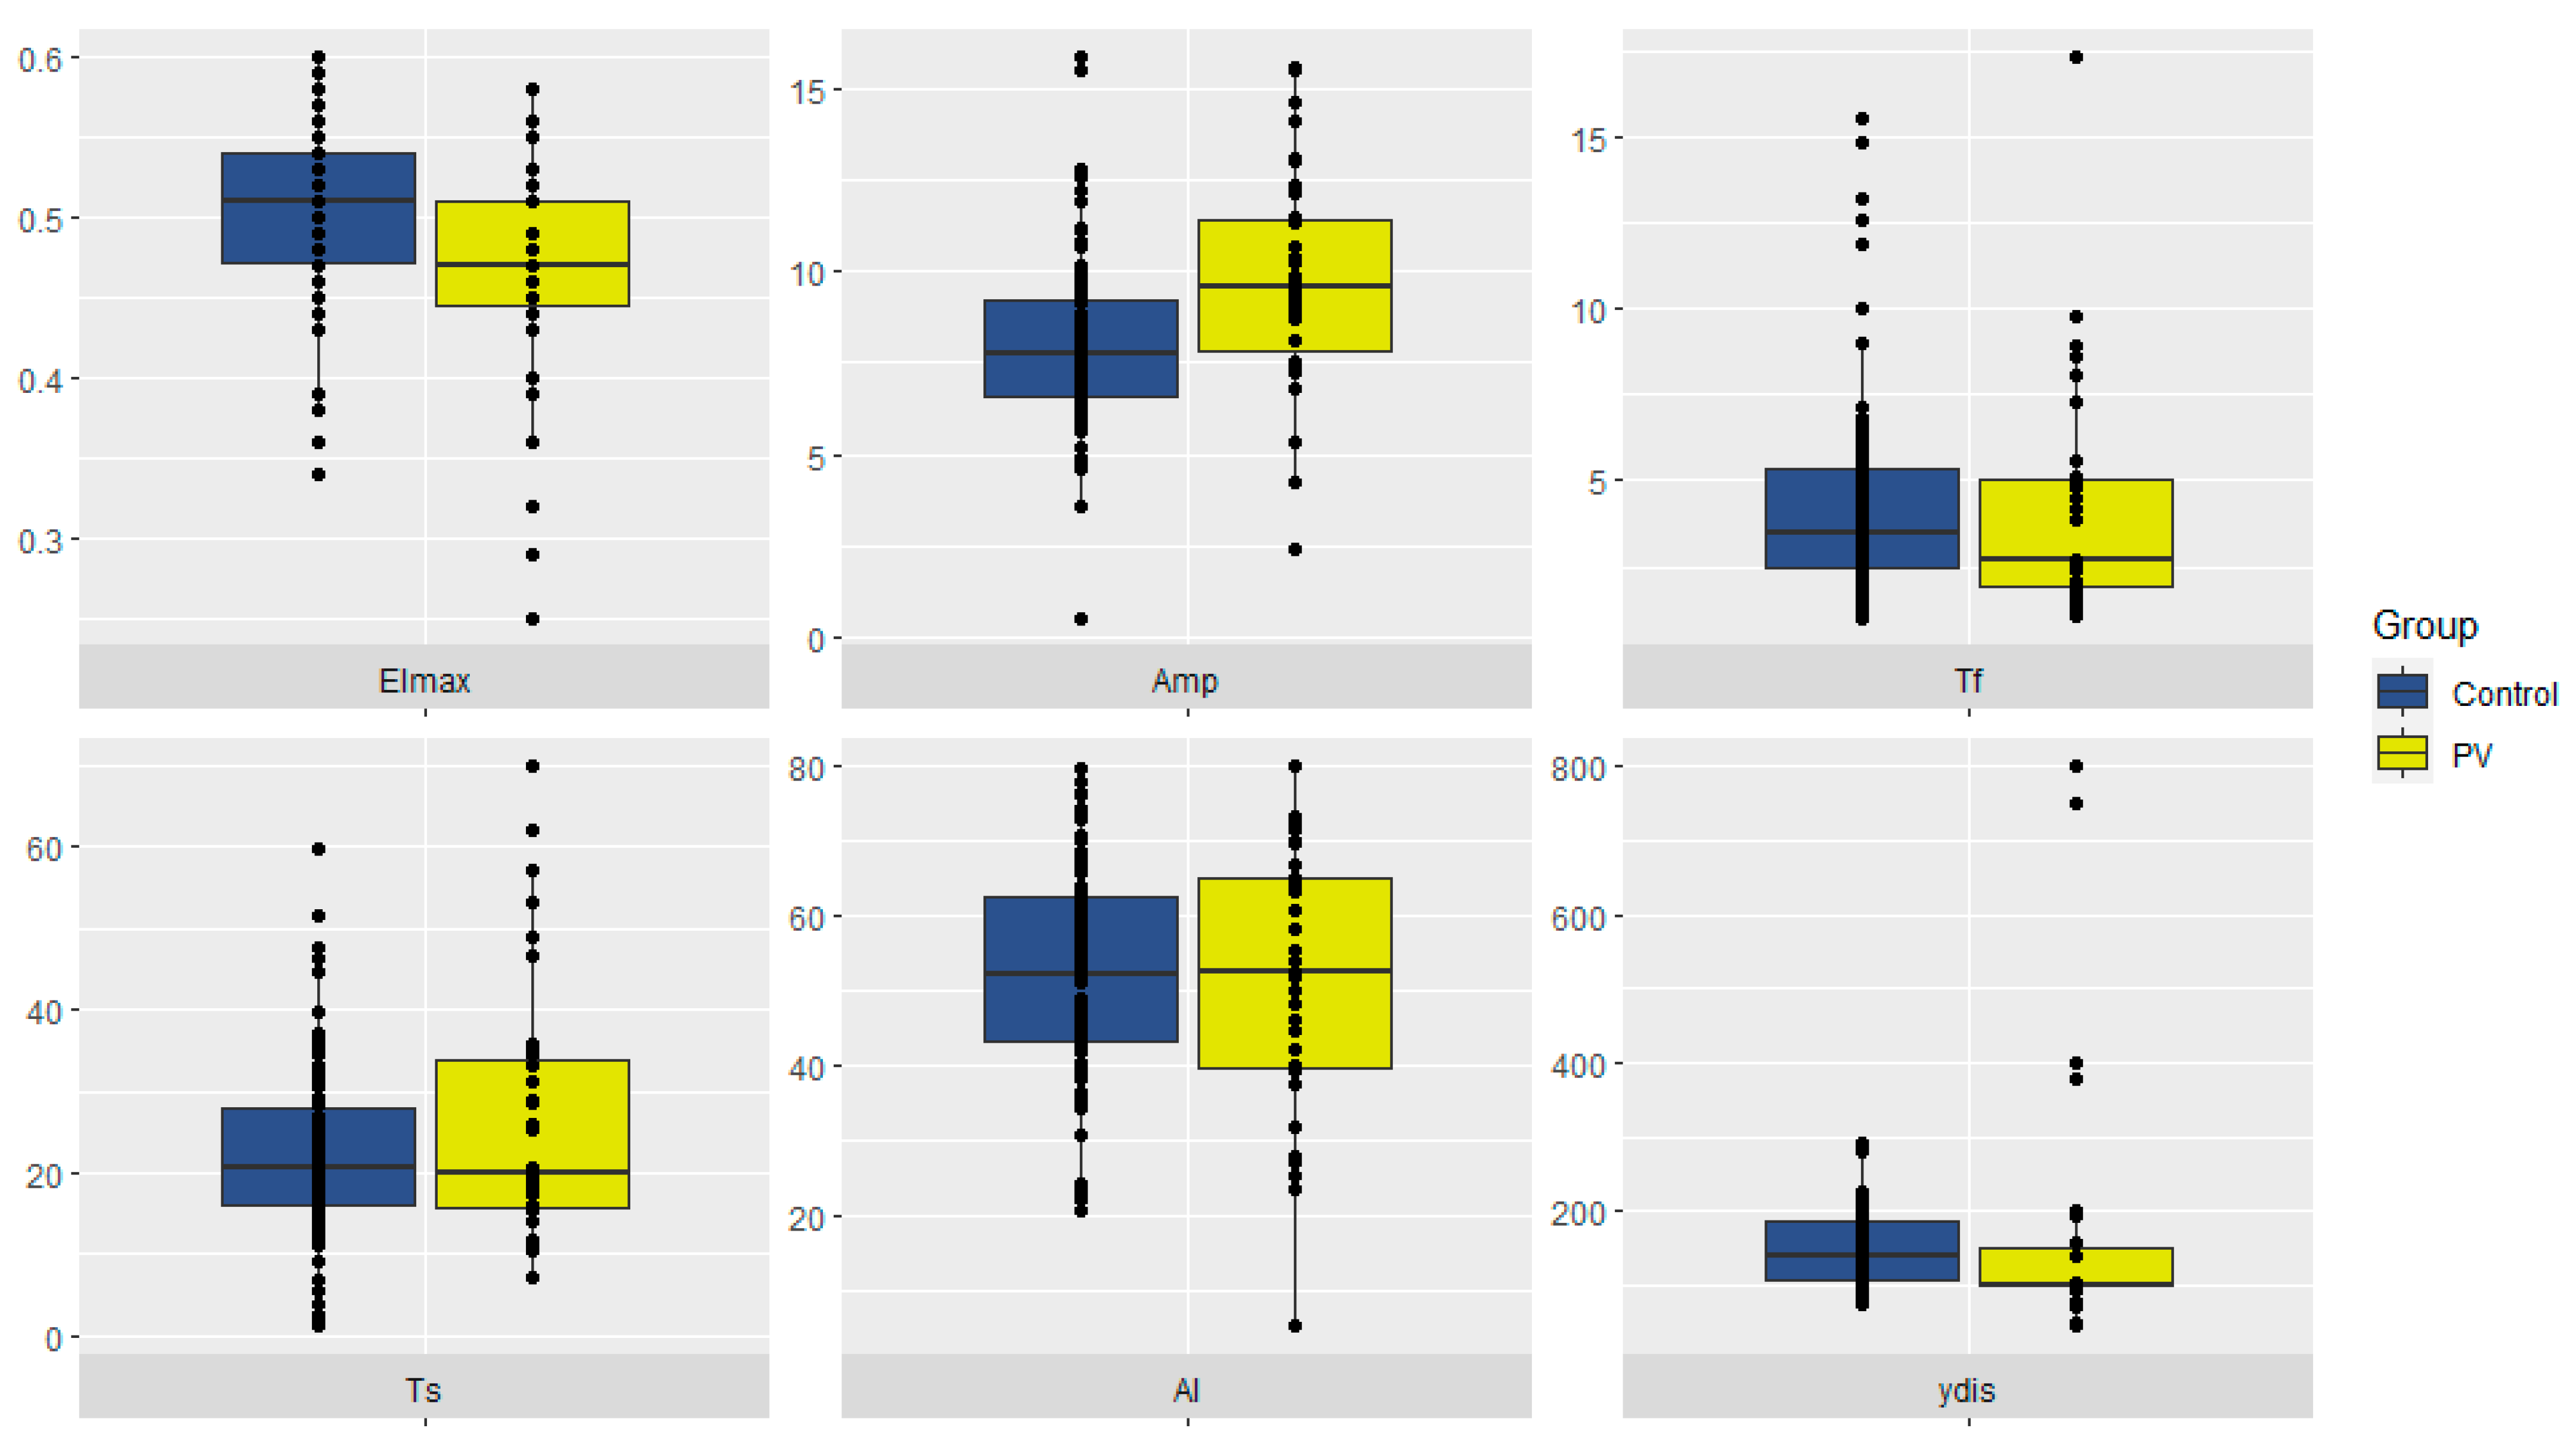
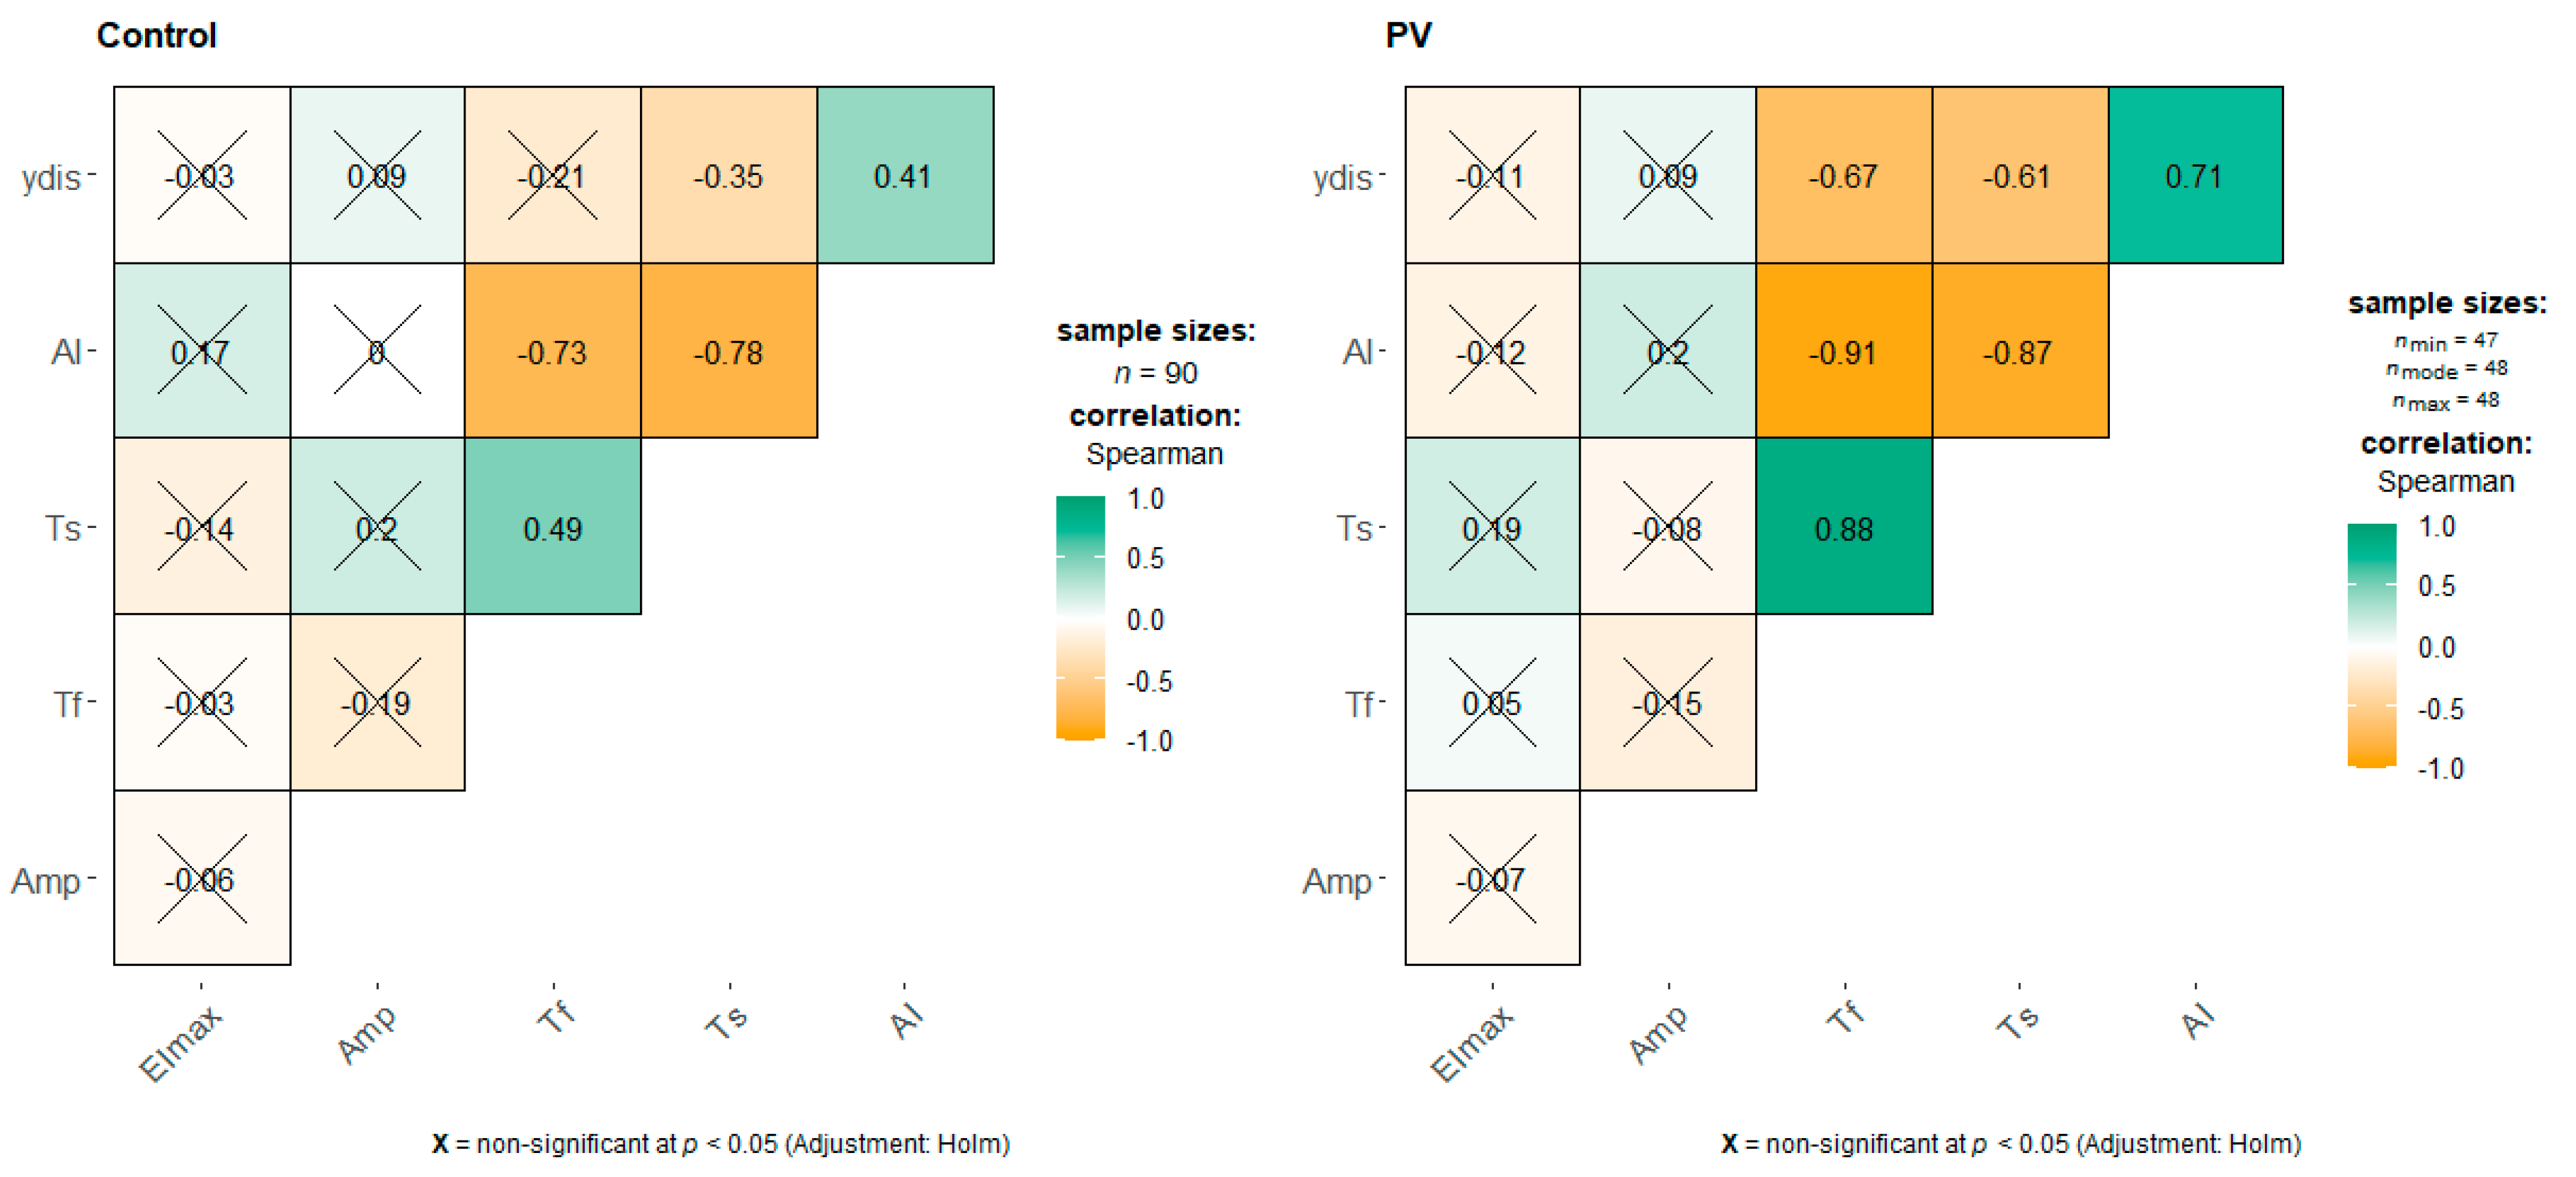
2. Results
3. Discussion
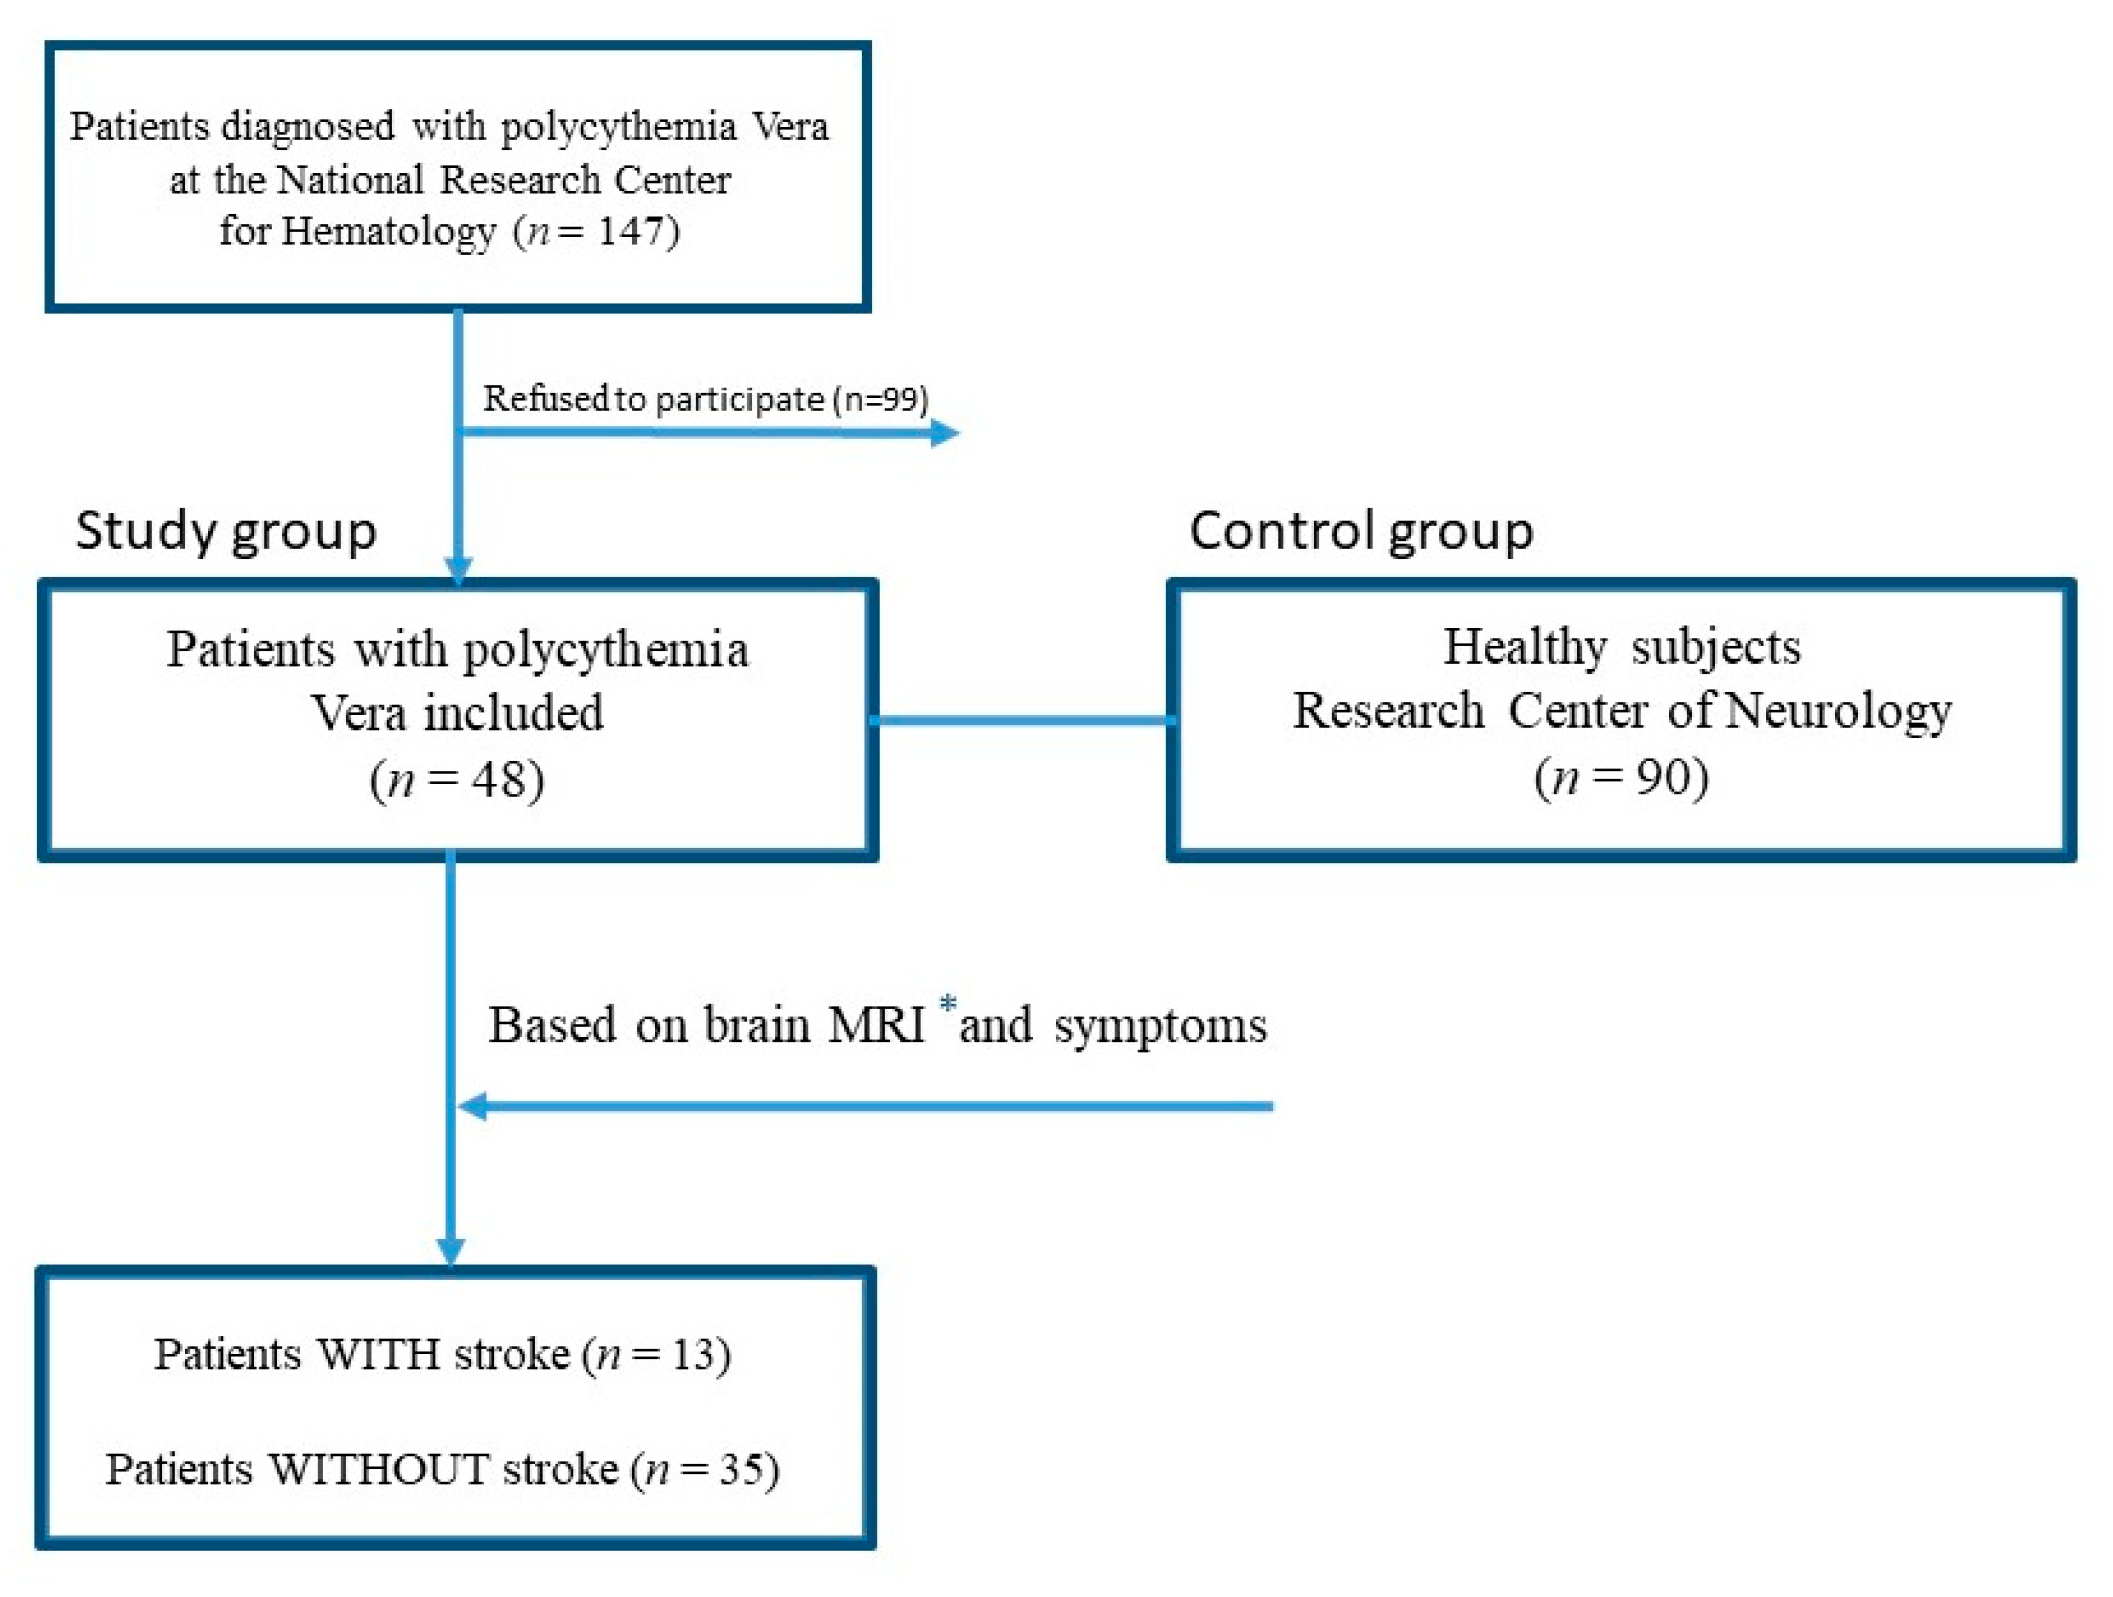
4. Materials and Methods
4.1. Study Populations and Blood Collection
4.2. Measurement of Red Blood Cells Morphodynamics
4.3. Statistics
5. Conclusions
Author Contributions
Funding
Institutional Review Board Statement
Informed Consent Statement
Data Availability Statement
Conflicts of Interest
Abbreviations
| PV | polycythemia vera |
| RBC | red blood cell |
| Amp | aggregation amplitude (extent of aggregation) |
| Tf | time of formation of coin columns (RBC-rouleaux formation time constant) |
| Ts | time of formation of three-dimensional aggregates (RBC-3D aggregate formation contribution) |
| AI | aggregation index |
| γ-dis | the rate of complete disaggregation |
| EImax | maximal elongation (deformability) index |
| WBC | white blood cell |
| MRI | Magnetic resonance imaging |
References
- Michiels, J.J.; Berneman, Z.; Schroyens, W.; De Raeve, H. Changing concepts of diagnostic criteria of myeloproliferative disorders and the molecular etiology and classification of myeloproliferative neoplasms: From Dameshek 1950 to Vainchenker 2005 and beyond. Acta Haematol. 2015, 133, 36–51. [Google Scholar] [CrossRef] [PubMed]
- Barbui, T.; Thiele, J.; Gisslinger, H.; Kvasnicka, H.M.; Vannucchi, A.M.; Guglielmelli, P.; Orazi, A.; Tefferi, A. The 2016 WHO classification and diagnostic criteria for myeloproliferative neoplasms: Document summary and in-depth discussion. Blood Cancer J. 2018, 8, 1–11. [Google Scholar] [CrossRef] [PubMed]
- Xia, D.; Hasserjian, R.P. Molecular testing for JAK2, MPL, and CALR in myeloproliferative neoplasms. Am. J. Hematol. 2016, 91, 1277–1280. [Google Scholar] [CrossRef]
- Seif, F.; Khoshmirsafa, M.; Aazami, H.; Mohsenzadegan, M.; Sedighi, G.; Bahar, M. The role of JAK-STAT signaling pathway and its regulators in the fate of T helper cells. Cell Commun. Signal. 2017, 15, 23. [Google Scholar] [CrossRef] [PubMed] [Green Version]
- Hultcrantz, M.; Björkholm, M.; Dickman, P.W.; Landgren, O.; Derolf, Å.R.; Kristinsson, S.Y.; Andersson, T.M.L. Risk for arterial and venous thrombosis in patients with myeloproliferative neoplasms: A population-based cohort study. Ann. Intern. Med. 2018, 168, 317–325. [Google Scholar] [CrossRef]
- Arboix, A.; Jiménez, C.; Massons, J.; Parra, O.; Besses, C. Hematological disorders: A commonly unrecognized cause of acute stroke. Expert Rev. Hematol. 2016, 9, 891–901. [Google Scholar] [CrossRef]
- Skoda, R.C.; Duek, A.; Grisouard, J. Pathogenesis of myeloproliferative neoplasms. Exp. Hematol. 2015, 43, 599–608. [Google Scholar] [CrossRef] [Green Version]
- Griesshammer, M.; Kiladjian, J.-J.; Besses, C. Thromboembolic events in polycythemia vera. Ann. Hematol. 2019, 98, 1071–1082. [Google Scholar] [CrossRef] [Green Version]
- Tefferi, A.; Elliott, M. Thrombosis in myeloproliferative disorders: Prevalence, prognostic factors, and the role of leukocytes and JAK2V617F. Semin. Thromb. Hemost. 2007, 33, 313–320. [Google Scholar] [CrossRef] [Green Version]
- Vannucchi, A.M. Insights into the pathogenesis and management of thrombosis in polycythemia vera and essential thrombocythemia. Intern. Emerg. Med. 2009, 5, 177–184. [Google Scholar] [CrossRef]
- Tefferi, A.; Pardanani, A. Myeloproliferative neoplasms: A contemporary review. JAMA Oncol. 2015, 1, 97–105. [Google Scholar] [CrossRef] [PubMed]
- Shallis, R.M.; Wang, R.; Davidoff, A.; Ma, X.; Podoltsev, N.A.; Zeidan, A.M. Epidemiology of the classical myeloproliferative neoplasms: The four corners of an expansive and complex map. Blood Rev. 2020, 42, 100706. [Google Scholar] [CrossRef] [PubMed]
- Buks, R.; Dagher, T.; Rotordam, M.G.; Alonso, D.M.; Cochet, S.; Gautier, E.-F.; Chafey, P.; Cassinat, B.; Kiladjian, J.-J.; Becker, N.; et al. Altered Ca2+ homeostasis in red blood cells of polycythemia vera patients following disturbed organelle sorting during terminal erythropoiesis. Cells 2021, 11, 49. [Google Scholar] [CrossRef]
- Man, Y.; Kucukal, E.; An, R.; Watson, Q.D.; Bosch, J.; Zimmerman, P.A.; Little, J.A.; Gurkan, U.A. Microfluidic assessment of red blood cell mediated microvascular occlusion. Lab Chip 2020, 20, 2086–2099. [Google Scholar] [CrossRef] [PubMed]
- Porro, B.; Conte, E.; Zaninoni, A.; Bianchi, P.; Veglia, F.; Barbieri, S.; Fiorelli, S.; Eligini, S.; Di Minno, A.; Mushtaq, S.; et al. Red blood cell morphodynamics: A new potential marker in high-risk patients. Front. Physiol. 2021, 11, 603633. [Google Scholar] [CrossRef]
- Byrnes, J.R.; Wolberg, A.S. Red blood cells in thrombosis. Blood 2017, 130, 1795–1799. [Google Scholar] [CrossRef] [PubMed]
- Weisel, J.W.; Litvinov, R.I. Red blood cells: The forgotten player in hemostasis and thrombosis. J. Thromb. Haemost. 2019, 17, 271–282. [Google Scholar] [CrossRef] [Green Version]
- Arboix, A.; Besses, C. Cerebrovascular disease as the initial clinical presentation of haematological disorders. Eur. Neurol. 1997, 37, 207–211. [Google Scholar] [CrossRef]
- Finazzi, G. A prospective analysis of thrombotic events in the European collaboration study on low-dose aspirin in polycythemia (ECLAP). Pathol. Biol. 2004, 52, 285–288. [Google Scholar] [CrossRef]
- Kim, J.; Lee, H.; Shin, S. Advances in the measurement of red blood cell deformability: A brief review. J. Cell. Biotechnol. 2015, 1, 63–79. [Google Scholar] [CrossRef] [Green Version]
- Connes, P.; Lamarre, Y.; Waltz, X.; Ballas, S.K.; Lemonne, N.; Etienne-Julan, M.; Hue, O.; Hardy-Dessources, M.-D.; Romana, M. Haemolysis and abnormal haemorheology in sickle cell anaemia. Br. J. Haematol. 2014, 165, 564–572. [Google Scholar] [CrossRef]
- Baskurt, O.K.; Üyüklü, M.; Hardeman, M.R.; Meiselman, H.J. Photometric measurements of red blood cell aggregation: Light transmission versus light reflectance. J. Biomed. Opt. 2009, 14, 054044. [Google Scholar] [CrossRef] [PubMed]
- Wautier, M.-P.; El Nemer, W.; Gane, P.; Rain, J.-D.; Cartron, J.-P.; Colin, Y.; Le Van Kim, C.; Wautier, J.-L. Increased adhesion to endothelial cells of erythrocytes from patients with polycythemia vera is mediated by laminin α5 chain and Lu/BCAM. Blood 2007, 110, 894–901. [Google Scholar] [CrossRef] [PubMed] [Green Version]
- Wang, J. Hyperviscosity in polycythemia vera and other red cell abnormalities. Semin. Thromb. Hemost. 2003, 29, 451–458. [Google Scholar] [CrossRef] [Green Version]
- Mury, P.; Faes, C.; Millon, A.; Mura, M.; Renoux, C.; Skinner, S.; Nicaise, V.; Joly, P.; Della Schiava, N.; Lermusiaux, P.; et al. Higher daily physical activity level is associated with lower RBC aggregation in carotid artery disease patients at high risk of stroke. Front. Physiol. 2017, 8, 1043. [Google Scholar] [CrossRef] [Green Version]
- Gillespie, A.H.; Doctor, A. Red blood cell contribution to hemostasis. Front. Pediatr. 2021, 9, 629824. [Google Scholar] [CrossRef]
- Poisson, J.; Tanguy, M.; Davy, H.; Camara, F.; El Mdawar, M.-B.; Kheloufi, M.; Dagher, T.; Devue, C.; Lasselin, J.; Plessier, A.; et al. Erythrocyte-derived microvesicles induce arterial spasms in JAK2V617F myeloproliferative neoplasm. J. Clin. Investig. 2020, 130, 2630–2643. [Google Scholar] [CrossRef] [Green Version]
- Huisjes, R.; Bogdanova, A.; Van Solinge, W.W.; Schiffelers, R.M.; Kaestner, L.; Van Wijk, R. Squeezing for life—Properties of red blood cell deformability. Front. Physiol. 2018, 9, 656. [Google Scholar] [CrossRef]
- Zaninoni, A.; Fermo, E.; Vercellati, C.; Consonni, D.; Marcello, A.P.; Zanella, A.; Cortelezzi, A.; Barcellini, W.; Bianchi, P.; Zaninoni, A.; et al. Use of Laser assisted optical rotational cell analyzer (LoRRca MaxSis) in the diagnosis of RBC membrane disorders, enzyme defects, and congenital dyserythropoietic anemias: A monocentric study on 202 patients. Front. Physiol. 2018, 9, 451. [Google Scholar] [CrossRef]


| PV (n = 48) | Control (n = 90) | p | |
|---|---|---|---|
| EImax | 0.47 (0.44; 0.51) | 0.51 (0.47; 0.54) | 0.0003539 |
| Amp | 10.1 (8.6; 12.2) | 7.7 (6.6; 9.2) | 0.000006 |
| Tf, s | 2.7 (1.9; 4.9) | 3.5 (2.5; 5.4) | 0.1784 |
| Ts, s | 19.8 (15.5; 33.3) | 20.8 (16.2; 27.9) | 0.4032 |
| AI | 53.9 (39.7; 64.9) | 52.3 (43.2; 62.5) | 0.9693 |
| γ-dis, s−1 | 100 (100; 140) | 140 (106; 188) | 0.00009 |
| PV All (n = 48) | PV Stroke (n = 13) | PV No Stroke (n = 35) | p | |
|---|---|---|---|---|
| EImax | 0.47 (0.44; 0.51) | 0.46 (0.38; 0.52) | 0.47 (0.44; 0.51) | 0.7186 |
| Amp | 10.1 (8.6; 12.2) | 11.6 (10.0; 13.3) | 9.6 (7.8; 11.4) | 0.03573 |
| Tf, s | 2.7 (1.9; 4.9) | 2.4 (1.9; 4.5) | 2.7 (1.9; 5.0) | 0.9445 |
| Ts, s | 19.8 (15.5; 33.3) | 17.4 (15.6; 31.9) | 19.9 (15.8; 33.9) | 0.9076 |
| AI | 53.9 (39.7; 64.9) | 53.9 (39.7; 63.6) | 52.5 (39.7; 64.9) | 0.9416 |
| γ-dis, s−1 | 100 (100; 140) | 100 (100; 100) | 100 (100; 150) | 0.6081 |
| Age, years | 51.5 (42.8; 56) | 49 (45; 56) | 53.0 (41.5; 56.0) | 0.8891 |
| JAK2, % | 23 (13.5; 40.0) | 15 (14;33) | 24 (13;45) | 0.4568 |
| Ht, % | 45 (42; 49.5) | 43 (42; 46) | 46 (42; 50) | 0.5357 |
| Hb (g/L) | 157 (144;168) | 152 (144;166) | 158 (146; 169) | 0.8254 |
| RBC (×1012/L) | 5.6 (4.9; 6.5) | 4.8 (4.5; 5.7) | 6 (5.2; 6.7) | 0.02429 |
| PLT (×109/L) | 373 (259; 526) | 271 (228; 505) | 374 (296; 527) | 0.4864 |
| Hydrea | 34 (71%) | 10 (77%) | 24 (68.6%) | 0.8349 |
| ASA | 43 (90%) | 10 (77%) | 33 (94%) | 0.2231 |
| NCCN risk | ||||
| low | 17 (35.4%) | 0 (0) | 17 (48.6%) | 0.005 |
| moderate | 26 (54.2%) | 8 (61.5) | 18 (51.4%) | 0.7651 |
| high | 5 (10.4%) | 5 (38.4%) | 0 (0) | 0.0008 |
| Univariate Analysis | Multivariable Analysis | Model Summary | |||
|---|---|---|---|---|---|
| OR (95% CI) | p | OR (95% CI) | p | ||
| EImax | 0.04 (0–93.1) | 0.41 | Not included in the model | χ²(5) = 14.22 p = 0.01 Pseudo-R² (McFadden) = 0.27 | |
| Amp | 1.28 (1.0–1.64) | 0.05 | 1.40 (1.02–1.92) | 0.04 | |
| Tf | 1.03 (0.87–1.21) | 0.76 | 1.63 (1.06–2.52) | 0.03 | |
| AI | 1.0 (0.96–1.04) | 0.89 | 1.17 (1.01–1.36) | 0.04 | |
| Ts | 1.0 (0.96–1.04) | 0.99 | 1.04 (0.96–1.12) | 0.37 | |
| ydis | 1.0 (0.99–1.00) | 0.28 | 0.98 (0.96–1.00) | 0.07 | |
Publisher’s Note: MDPI stays neutral with regard to jurisdictional claims in published maps and institutional affiliations. |
© 2022 by the authors. Licensee MDPI, Basel, Switzerland. This article is an open access article distributed under the terms and conditions of the Creative Commons Attribution (CC BY) license (https://creativecommons.org/licenses/by/4.0/).
Share and Cite
Kuznetsova, P.I.; Raskurazhev, A.A.; Shabalina, A.A.; Melikhyan, A.L.; Subortseva, I.N.; Tanashyan, M.M. Red Blood Cell Morphodynamics in Patients with Polycythemia Vera and Stroke. Int. J. Mol. Sci. 2022, 23, 2247. https://doi.org/10.3390/ijms23042247
Kuznetsova PI, Raskurazhev AA, Shabalina AA, Melikhyan AL, Subortseva IN, Tanashyan MM. Red Blood Cell Morphodynamics in Patients with Polycythemia Vera and Stroke. International Journal of Molecular Sciences. 2022; 23(4):2247. https://doi.org/10.3390/ijms23042247
Chicago/Turabian StyleKuznetsova, Polina I., Anton A. Raskurazhev, Alla A. Shabalina, Anait L. Melikhyan, Irina N. Subortseva, and Marine M. Tanashyan. 2022. "Red Blood Cell Morphodynamics in Patients with Polycythemia Vera and Stroke" International Journal of Molecular Sciences 23, no. 4: 2247. https://doi.org/10.3390/ijms23042247
APA StyleKuznetsova, P. I., Raskurazhev, A. A., Shabalina, A. A., Melikhyan, A. L., Subortseva, I. N., & Tanashyan, M. M. (2022). Red Blood Cell Morphodynamics in Patients with Polycythemia Vera and Stroke. International Journal of Molecular Sciences, 23(4), 2247. https://doi.org/10.3390/ijms23042247