Article

Circadian Gene cry Controls Tumorigenesis through Modulation of Myc Accumulation in Glioblastoma Cells

by
Patricia Jarabo
*,†,
Carmen de Pablo
,
Amanda González-Blanco
and
Sergio Casas-Tintó
*
Instituto Cajal, CSIC, 28002 Madrid, Spain
*
Authors to whom correspondence should be addressed.
These authors contributed equally to this work.
Int. J. Mol. Sci. 2022, 23(4), 2043; https://doi.org/10.3390/ijms23042043
Submission received: 20 January 2022 / Revised: 4 February 2022 / Accepted: 8 February 2022 / Published: 12 February 2022
(This article belongs to the Special Issue Advances in Molecular Genetics of Brain Tumors)

Abstract

:
Glioblastoma (GB) is the most frequent malignant brain tumor among adults and currently there is no effective treatment. This aggressive tumor grows fast and spreads through the brain causing death in 15 months. GB cells display a high mutation rate and generate a heterogeneous population of tumoral cells that are genetically distinct. Thus, the contribution of genes and signaling pathways relevant for GB progression is of great relevance. We used a Drosophila model of GB that reproduces the features of human GB and describe the upregulation of the circadian gene cry in GB patients and in a Drosophila GB model. We studied the contribution of cry to the expansion of GB cells and the neurodegeneration and premature death caused by GB, and we determined that cry is required for GB progression. Moreover, we determined that the PI3K pathway regulates cry expression in GB cells, and in turn, cry is necessary and sufficient to promote Myc accumulation in GB. These results contribute to understanding the mechanisms underlying GB malignancy and lethality, and describe a novel role of Cry in GB cells.

1. Introduction

Glioblastoma (GB) is the most common and aggressive type of glioma among all brain tumors, and it accounts for 57.3% of all gliomas [1]. It was classified in 2016 as a WHO grade IV diffuse oligodendroglial and astrocytic brain tumor, but the most recent classification (2021) includes these type of tumors in the “Gliomas, glioneuronal tumors, and neuronal tumors” group, termed as Glioblastoma, IDH-wildtype [2]. Despite current treatments, the median survival of GB patients is 15 months [3], and it is estimated that only 6.8% of patients survive five years after diagnosis [1]. To understand the genetic, molecular and cellular bases of gliomagenesis is fundamental for the development of effective therapies. In terms of histopathology and genetic expression, GB is a very heterogeneous type of tumor, even within the same patient [4]. However, there are common mutations in GB affecting different pathways that show mutual exclusion: the p53 pathway, the Rb pathway and components of the PI3K pathway [5].
Previous studies from our lab used a GB model in Drosophila, developed by Read and collaborators in 2009, that recapitulates key aspects of the disease both genetically and phenotypically [6,7,8,9,10,11,12,13]. This model is based on the expression of constitutively active forms of the epidermal growth factor receptor (EGFRλ) and phosphatidyl inositol 3 kinase (PI3K) catalytic subunit (dp110CAAX) (orthologues of EGFR and PI3K catalytic subunit in Drosophila, respectively). We used the binary expression system Gal4/UAS [14] to express EGFRλ and PI3K dp110CAAX specifically in glial cells under the control of repo-Gal4 driver [6]. The co-activation of EGFR and PI3K signaling pathways in Drosophila glial cells reproduces the cascade of signaling events that occurs in GB patients [6]. In consequence, GB cells upregulate myc expression, which is essential for tumoral transformation, and the glial tumor cell numbers increase along with the expansion of the glial membrane. As a result, GB progression causes a reduction in the number of synapses in neighboring neurons and premature death [6,9,15]. Furthermore, EGFR and PI3K pathway co-activation regulates processes such as progression and entry into the cell cycle and protein synthesis [6,7].
c-myc is one of the oncogenes most amplified in human cancer, including GB. About 60%–80% of human GB cases show elevated Myc levels [16]. Myc regulates cell proliferation, transcription, differentiation, apoptosis and cell migration. It is the point where EGFR and PI3K pathways converge; thus, Myc is considered essential for GB transformation [6,16,17,18]. Furthermore, in vitro and in vivo studies have shown that myc inhibition prevents glioma formation, inhibits cell proliferation and survival and even induces disease regression [16,19]. These features are conserved in Drosophila [6].
In the recent years, the study of alterations in circadian rhythm genes has emerged in different types of cancer, including GB [20]. Previous reports suggested that circadian rhythm genes play essential roles in different aspects of tumor progression. The central clock organizes the oscillations and rhythmicity of the physiological processes and modulates the expression of genes related to cell proliferation or differentiation, such as cell cycle components [21], proto-oncogenes and tumor suppressors [22].
In mammals, the structure responsible for coordinating circadian behavior throughout the body is the suprachiasmatic nucleus (SCN), located in the anterior region of the hypothalamus and made up of about 50,000 neurons in humans [23]. All the neurons that compose the central clock express the core circadian genes that control the oscillations that organize the cycles of the whole organism in absence of environmental cues. Furthermore, synchronization of the internal clock with light/dark cycles relies on cryptochrome protein (Cry), a blue light photopigment expressed in certain subsets of clock neurons. Cry is a receptor of near-UV/blue light and a regulator of gene expression that belongs to the group of DNA photolyases. It was suggested that the last universal common ancestor (LUCA) had one or several photolyases, supporting the evolutionary conservation of cryptochrome genes [24]. However, the mammalian gene that plays the role of Drosophila cry remains unknown. Interestingly, Drosophila Cry also acts as the mammalian Cry when expressed in peripheral clocks [25]. Besides, cry1 expression is androgen responsive, Cry1 regulates DNA repair and the G2/M transition and it is associated with poor outcome in prostate cancer and colorectal cancer.
Regarding GB, studies in patients with primary gliomas show an association between a specific per1 variant with overall glioma risk. Several circadian genes, including cry1, exhibited differential expression in GB samples compared to control brains as described in the literature [26,27], and in human cancer gene expression databases (https://www.proteinatlas.org, accessed on 1 February 2022; https://cancer.sanger.ac.uk/, accessed on 10 January 2022). Besides, the expression of the circadian gene clk is significantly enhanced in high-grade gliomas and correlates with tumor progression [28]. Moreover, per1 and per2 expression increases the efficacy of radiotherapy also in GB cells [29].
Furthermore, high levels of cry1 inversely correlate with median survival in GB patients, acting as signal of poor prognosis (http://gepia.cancer-pku.cn/detail.php?gene=CRY1, accessed on 1 February 2022). Still, the functional mechanism of Cry in cancer susceptibility and carcinogenesis remains unsolved.
Different studies show a relationship between Cry and Myc [30]; c-Myc levels decrease in cry1/cry2 null mutant mice [31]. Besides, cry1 expression is induced by Myc in GB cells in culture [32].
Taking into account the deregulation in the expression of circadian genes in tumor tissues and the pre-established relationship between Cry and myc, which is a key player in GB, here we show that cry is regulated by PI3K pathway, cry expression enhances Myc accumulation in GB cells and it is necessary for GB progression.

2. Results

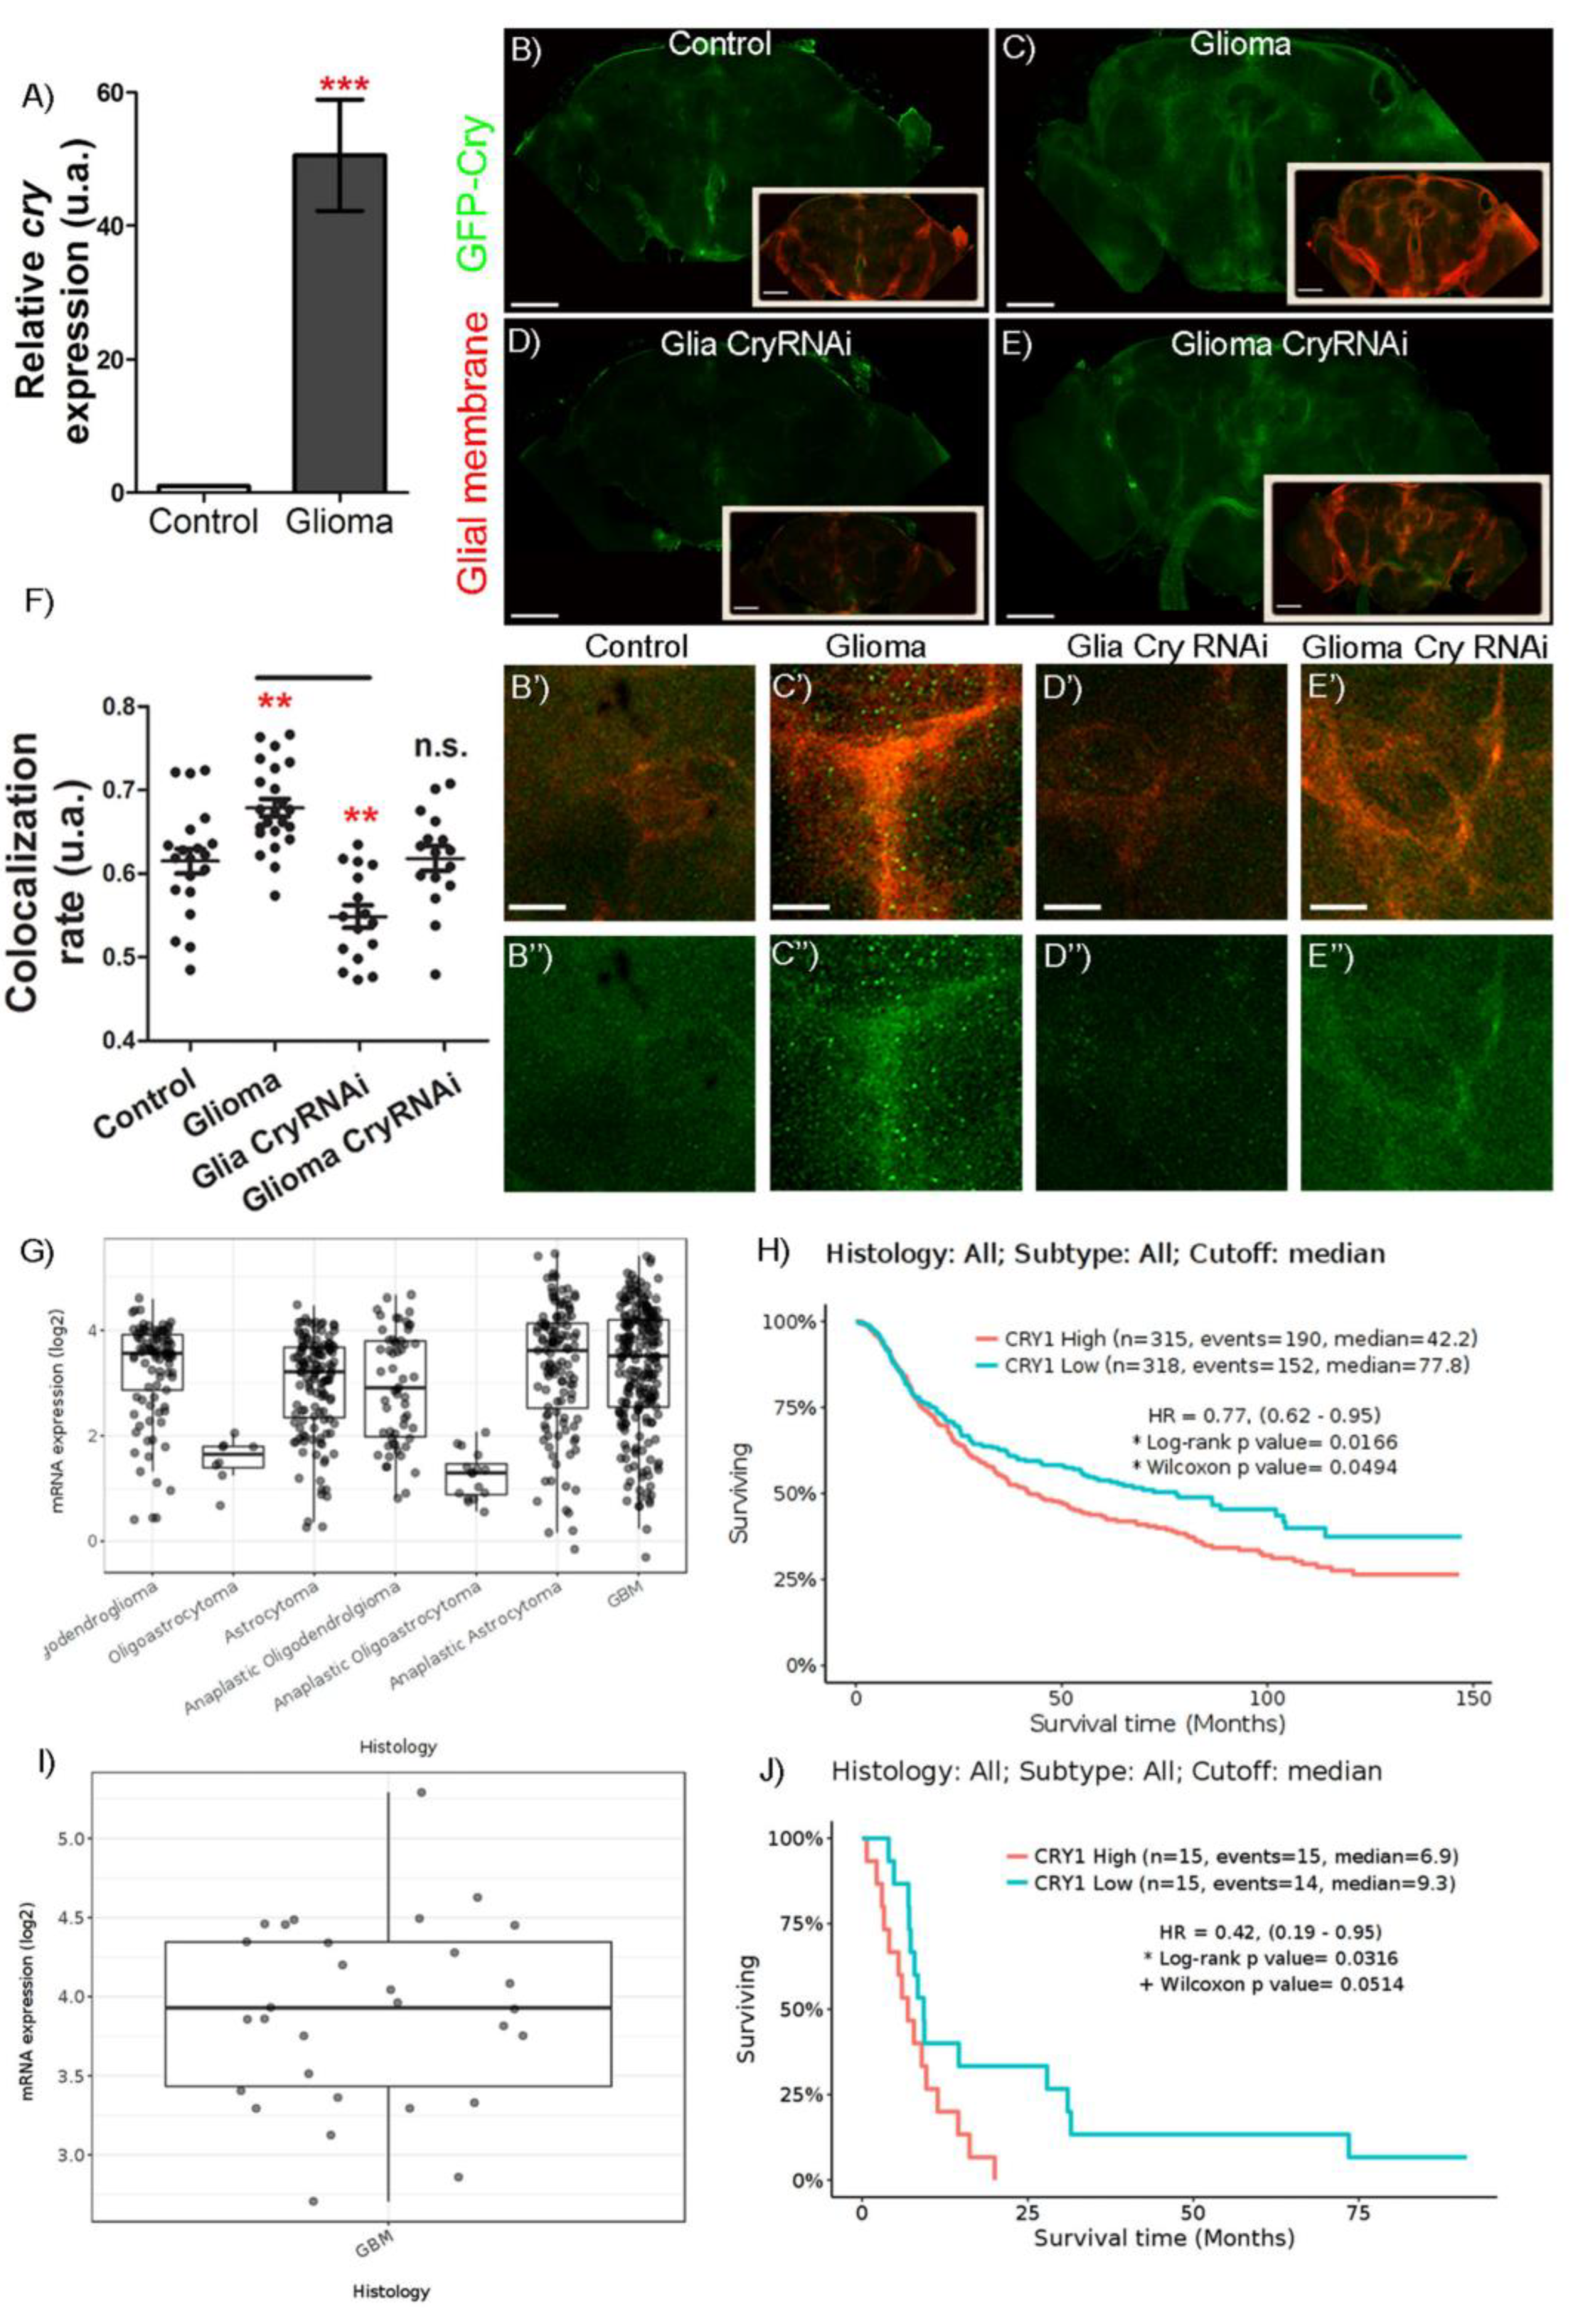
2.1. Cry Expression in Glioblastoma

To determine if cry expression was affected in glioma samples, we extracted RNA from the heads of 7-day-old adult control and glioma flies. Quantitative RT-PCR results (see Table 1 in Materials and Methods) indicate that cry mRNA levels are 50 times higher in glioma samples as compared to controls (Figure 1A). This result goes in line with the data retrieved from TCGA-GBM dataset (at http://gliovis.bioinfo.cnio.es/, accessed on 1 February 2022) that indicate a significant increase of cry1 mRNA levels (RNA-seq) in GB samples, as compared to non-tumor tissue.
Next, to determine if cry upregulation occurs in GB cells, we used a specific reporter line that generates a green fluorescent protein (GFP) tagged form of Cry (GFP-Cry) and visualized adult brains in confocal microscopy. The images show the GFP signal (Cry) and glial membrane marked in red with myristoylated red fluorescent protein (mRFP) (Figure 1B–E,B’–E’). The quantification of GFP-Cry and mRFP co-localization is higher in glioma samples than in controls (Figure 1B,C,F) suggesting an accumulation of Cry in glioma cells. This signal is restored to control levels upon cry knockdown by means of RNAi expression in glial or glioma cells (Figure 1D–F).
Next, we analyzed human mRNA expression databases for Glioblastoma multiforme (http://gliovis.bioinfo.cnio.es/, accessed on 10 January 2022). The results indicate that cry in GB patients is transcriptionally upregulated in primary tumors (Figure 1G) and cry1 upregulation correlates with worse prognosis (Figure 1H). Moreover, cry1 is also upregulated in secondary GB (Figure 1I) and correlates with poor prognosis in secondary GB patients (Figure 1J). All together, these results indicate that cry is transcriptionally upregulated in GB cells in Drosophila and patients and suggest a role in GB malignancy and aggressiveness.

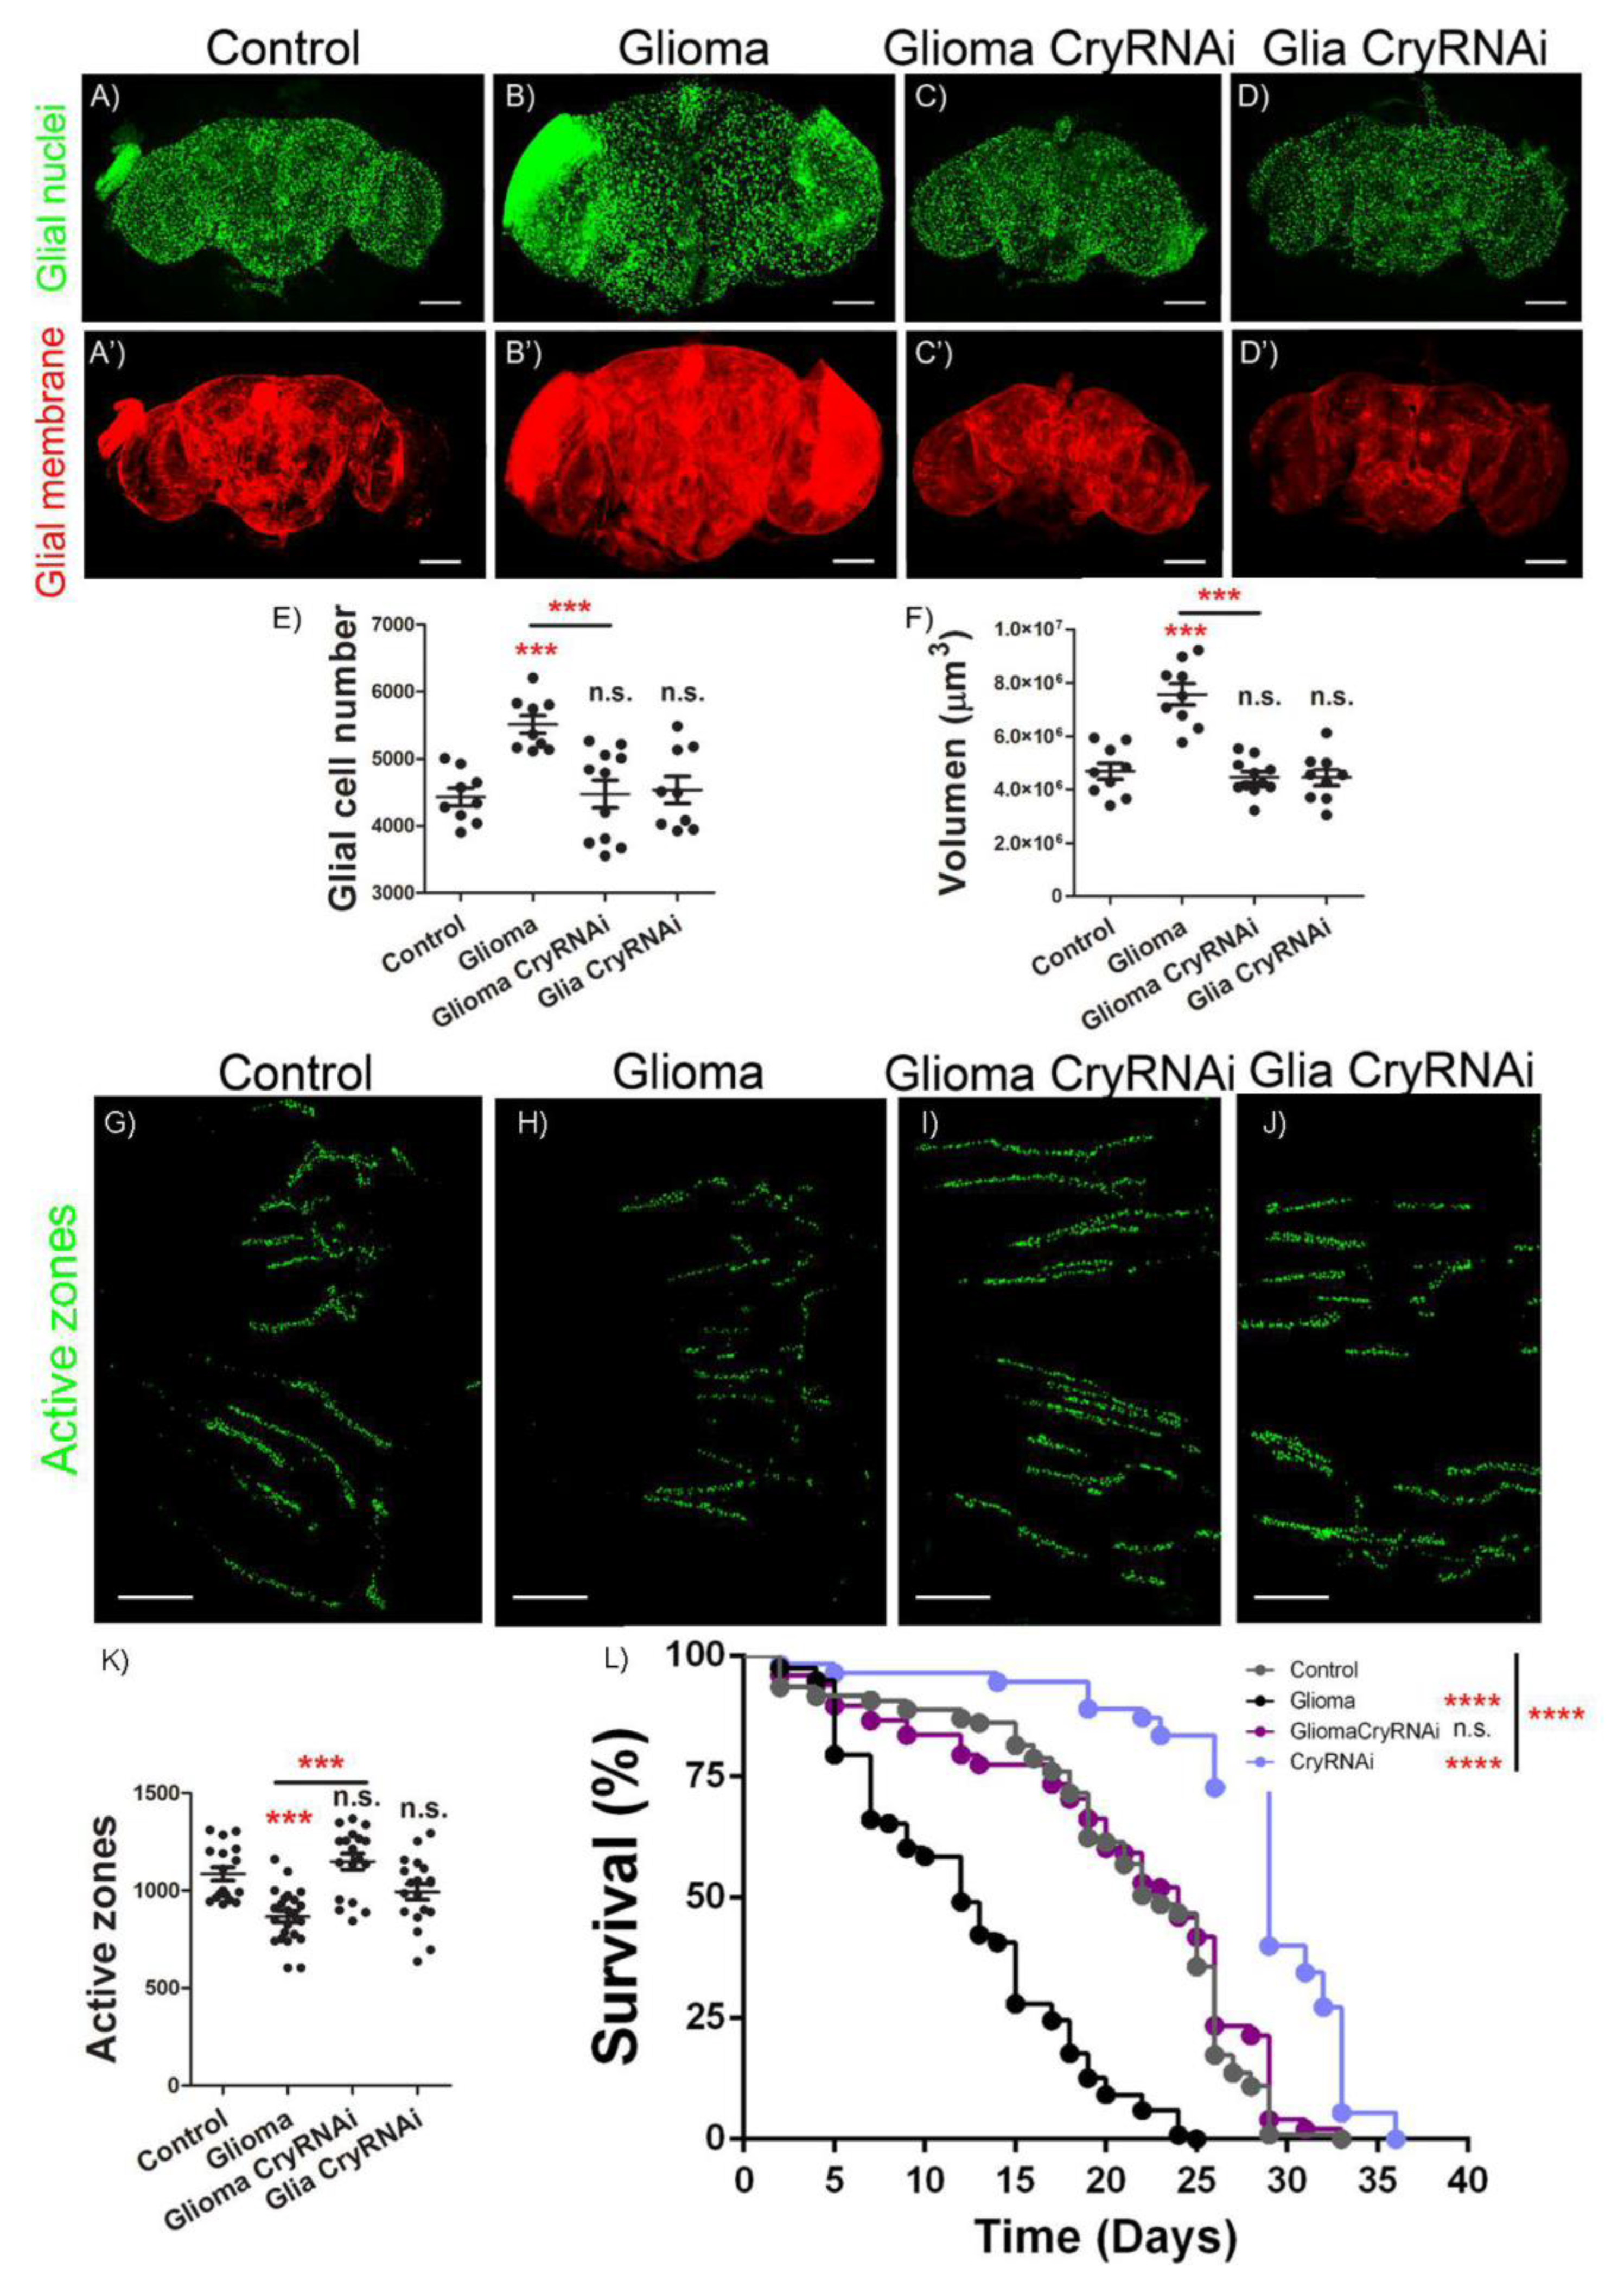
2.2. Cry Mediates GB Progression and Neurodegeneration

To determine the contribution of cry to GB progression, we used a previously validated protocol to quantify tumor progression and the associated neurodegeneration in Drosophila [7,9,11]. We stained adult control brains and compared them with GB, GB + cryRNAi and wt brains expressing cryRNAi in glial cells. We used a specific antibody against repo to visualize the nuclei of all glial cells and quantified the number of glial cells in the confocal images (Figure 2A–E). The results indicate that GB samples have a significant increase in the number of glial cells compared to control samples, but this increase depends on cry expression (Figure 2A–C,E). Besides, knockdown of cry in normal glia does not alter the number of glial cells (Figure 2D,E). In addition, we quantified the volume of glial membrane. We used Imaris software to measure the volume of the red signal that corresponds to a myristoilated form of RFP (mRFP) expressed in glial cells under the control of repo-Gal4. The quantification of the volume show a significant expansion of glial membrane in GB compared to control samples, but this increase depends on cry expression (Figure 2A’–C’,F). Again, knockdown of cry in normal glia does not alter the volume of glial membrane (Figure 2D’,F). These results suggest that cry expression is required for GB progression, but not for normal glia development.
Next, we studied the impact of GB progression and cry expression in neighboring neurons. We counted the number of synapses in motor neurons of adult neuromuscular junction (NMJ), a standardized tissue to study neurodegeneration [9,11,33]. To visualize synapses, we used an anti-Brp antibody (nc82) to detect active zones in the neurons, and counted the number of synapses in control samples, GB, GB + cryRNAi and normal glia + cryRNAi (Figure 2G–J). The quantification of synapse number (Figure 2K) shows that GB induction provokes a significant reduction in the number of synapses as compared to control samples, compatible with a neurodegenerative process. This effect was previously described [7,9,11] as a consequence of GB progression. Moreover, cry knockdown in GB prevents the reduction in the number of synapses, and cryRNAi expression in normal glial cells does not cause any detectable change in the number of synapses. Finally, we aimed to determine the systemic effect of cry. We expressed cryRNAi in glia or GB cells, and we analyzed the life span of adult flies. The results show that GB causes a significant reduction of life span and a premature death, which is prevented by cryRNAi expression in GB cells. Moreover, cryRNAi expression in normal glial cells does not reduce lifespan but causes a significant increase in the average lifespan (Figure 2L).

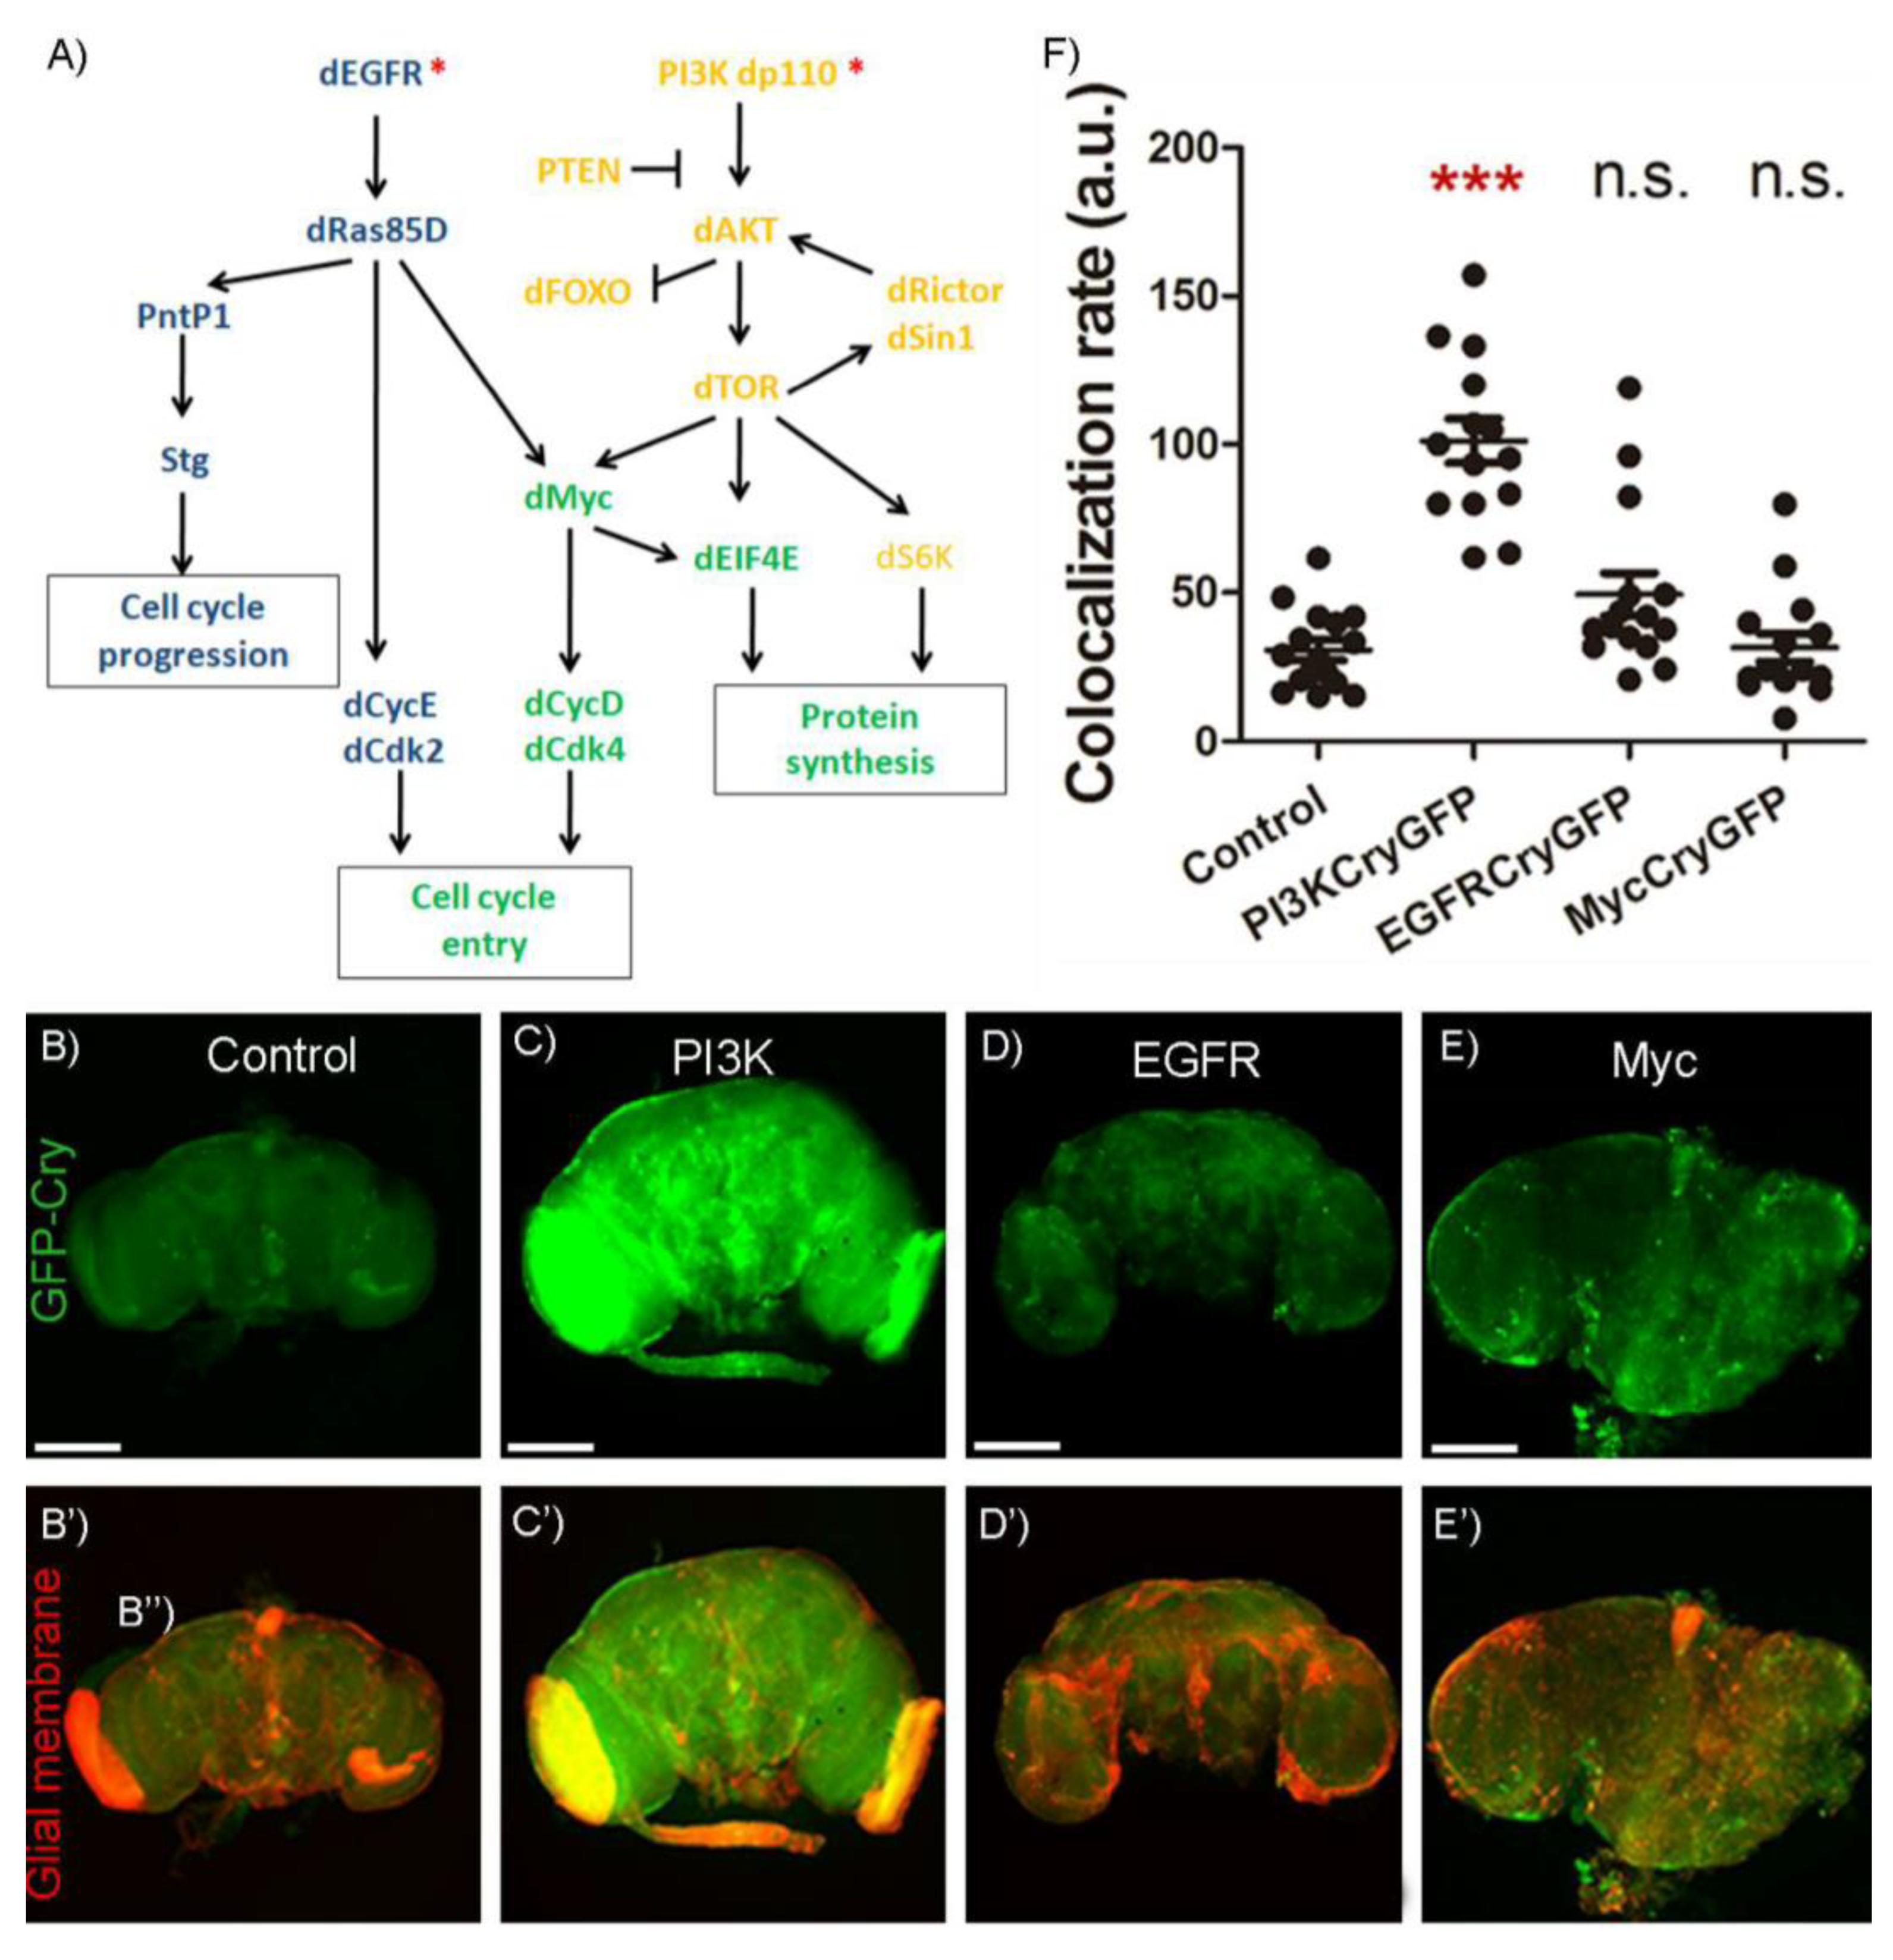
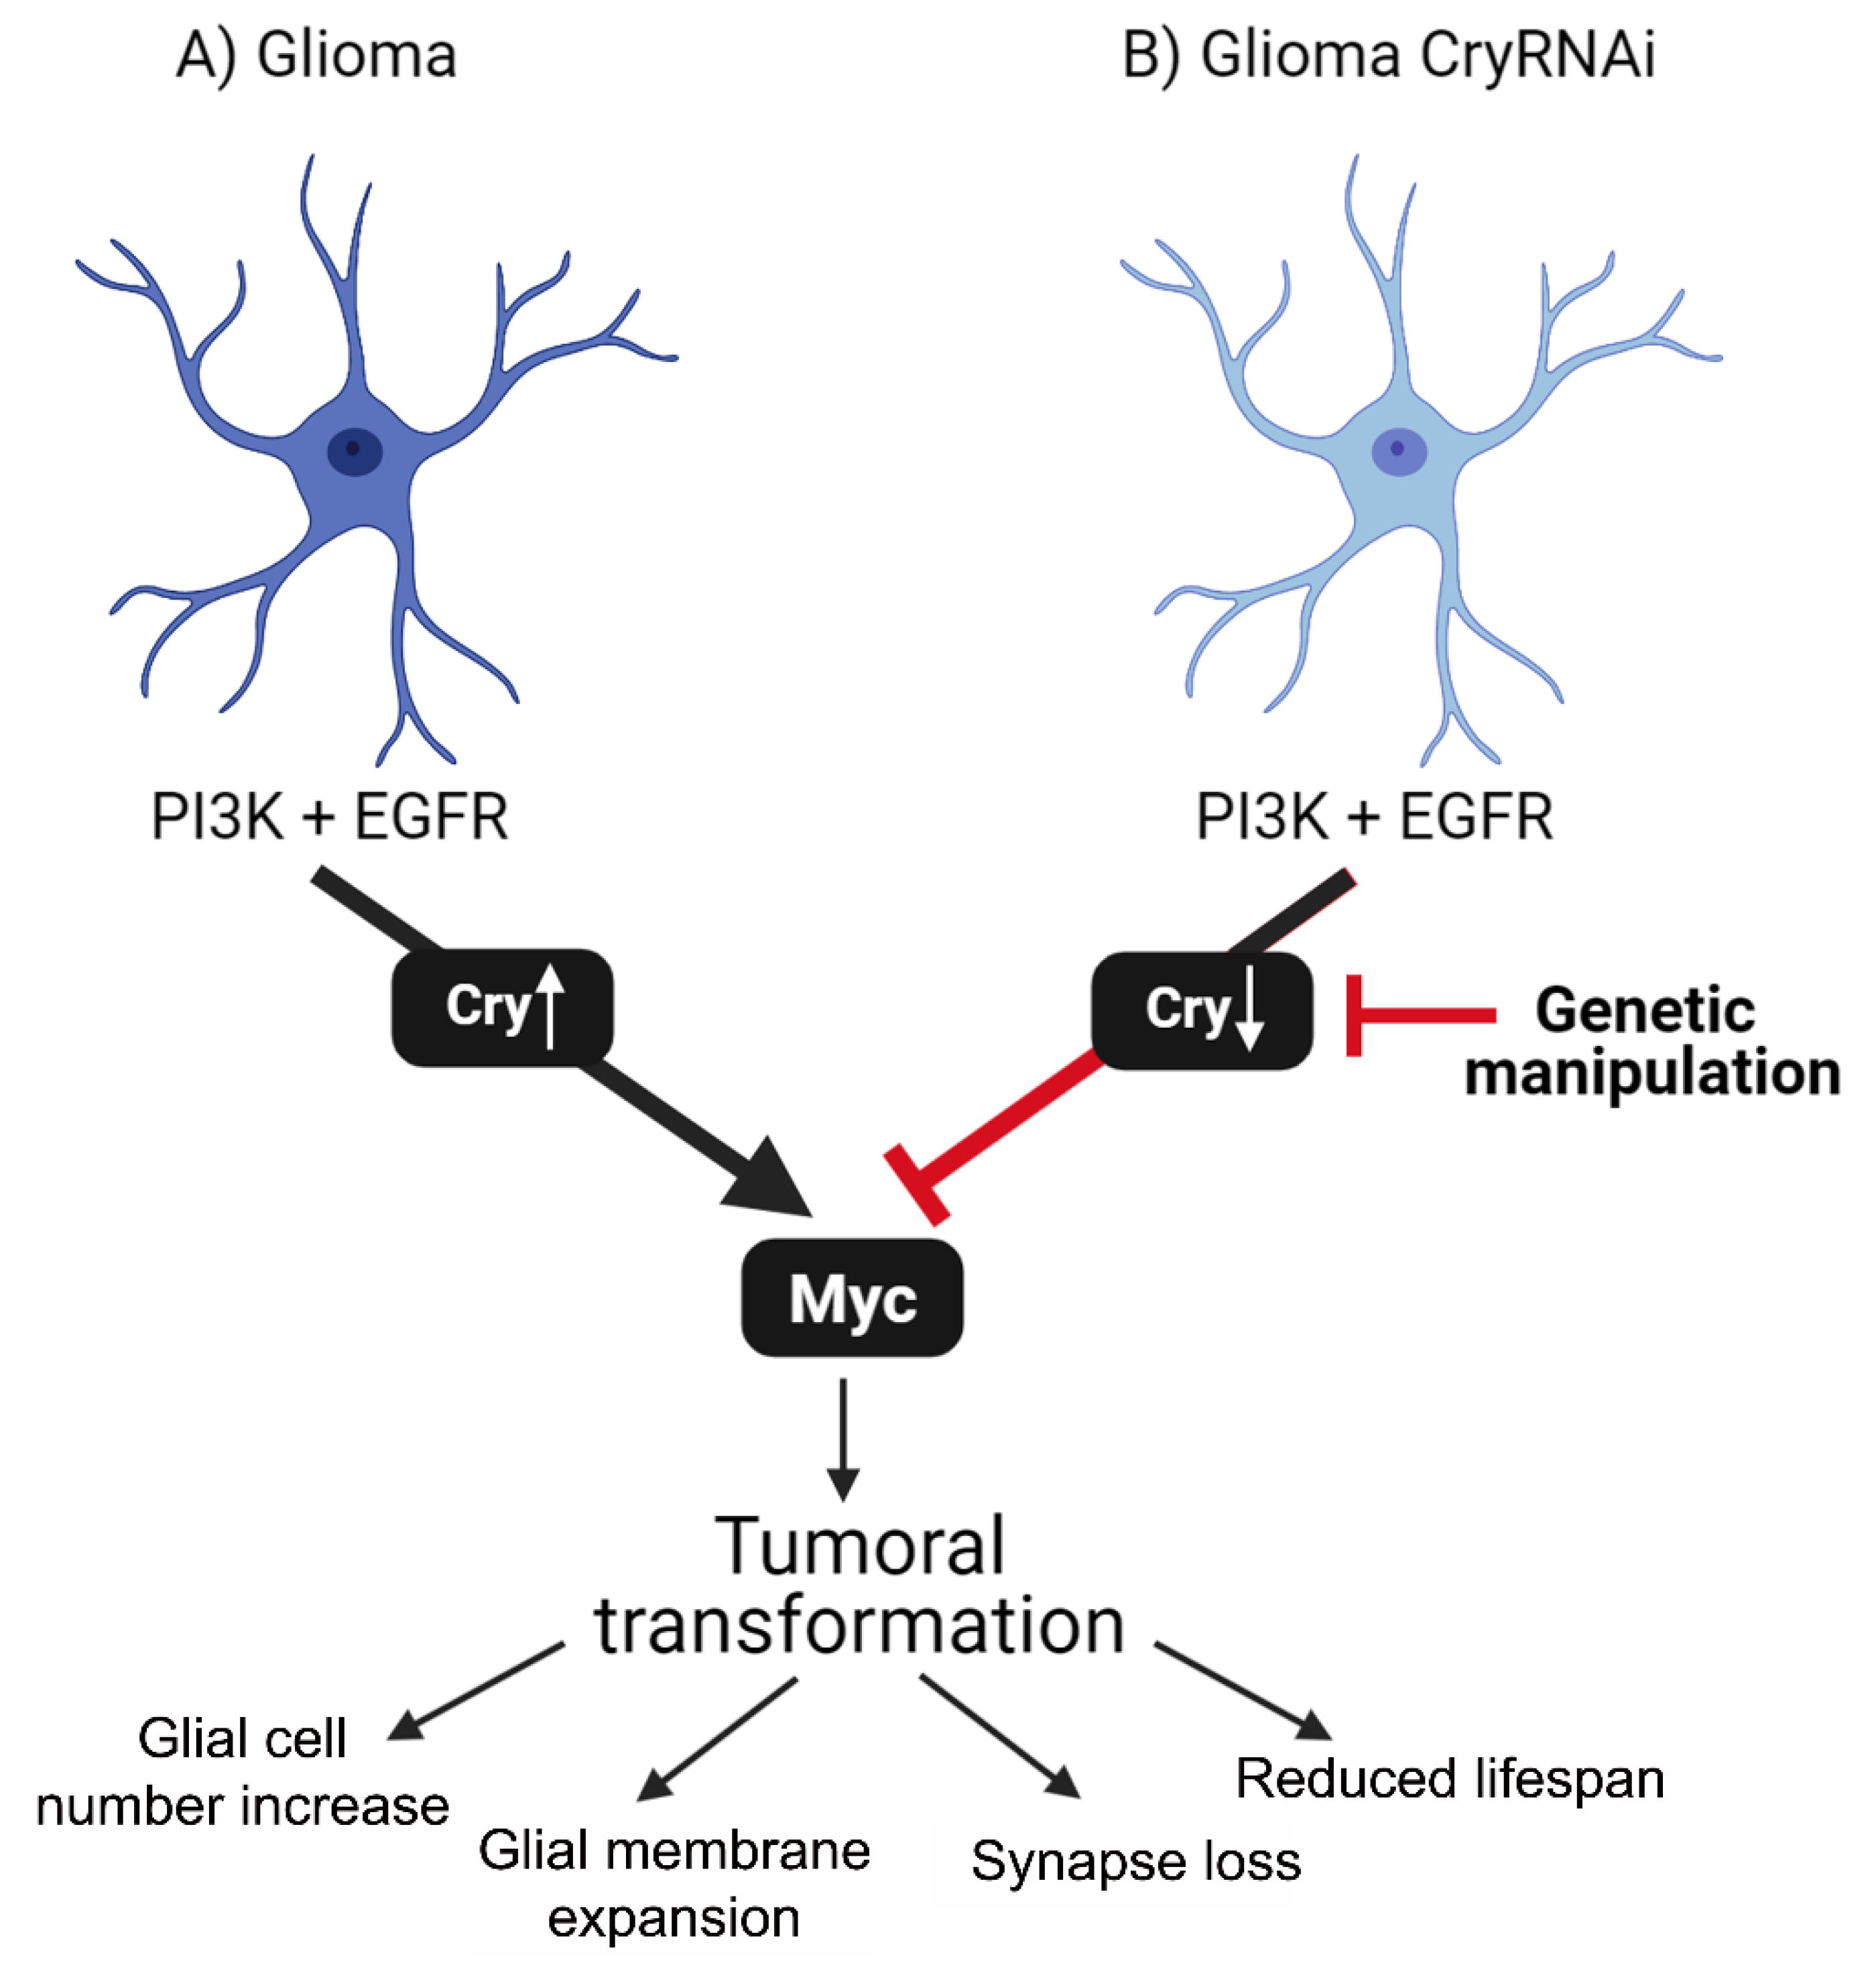
2.3. Signaling Pathway to Control Cry Upregulation

To decipher the specific signaling pathway responsible for cry transcriptional activation in GB cells, we analyzed the contribution of the two main pathways activated in this model of GB, EGFR and PI3K. Both pathways converge in the expression of the gene myc (see Figure 3A for detailed genetic epistasis in GB). Thus, we analyzed the contribution of PI3K, EGFR and myc to cry upregulation. We measured the fluorescent signal of GFP-cry reporter in control adult brains (Figure 3B–B″) and compared it with adult brains upon expression of the constitutively active forms of PI3K (Figure 3C–C″) or EGFR (Figure 3D–D″) in glial cells (under the control of repo-Gal4). In addition, we analyzed the GFP-cry signal in glial cells upon myc upregulation (Figure 3E–E″). We quantified in the confocal images the signal of GFP that co-localizes with glial membranes (mRFP) (Figure 3F). The results indicate that PI3K expression is sufficient to increase GFP-cry signal but not EGFR or myc overexpression. These results suggest that PI3K upregulation induces cry transcription, and EGFR or myc expression do not induce cry expression in glial cells.

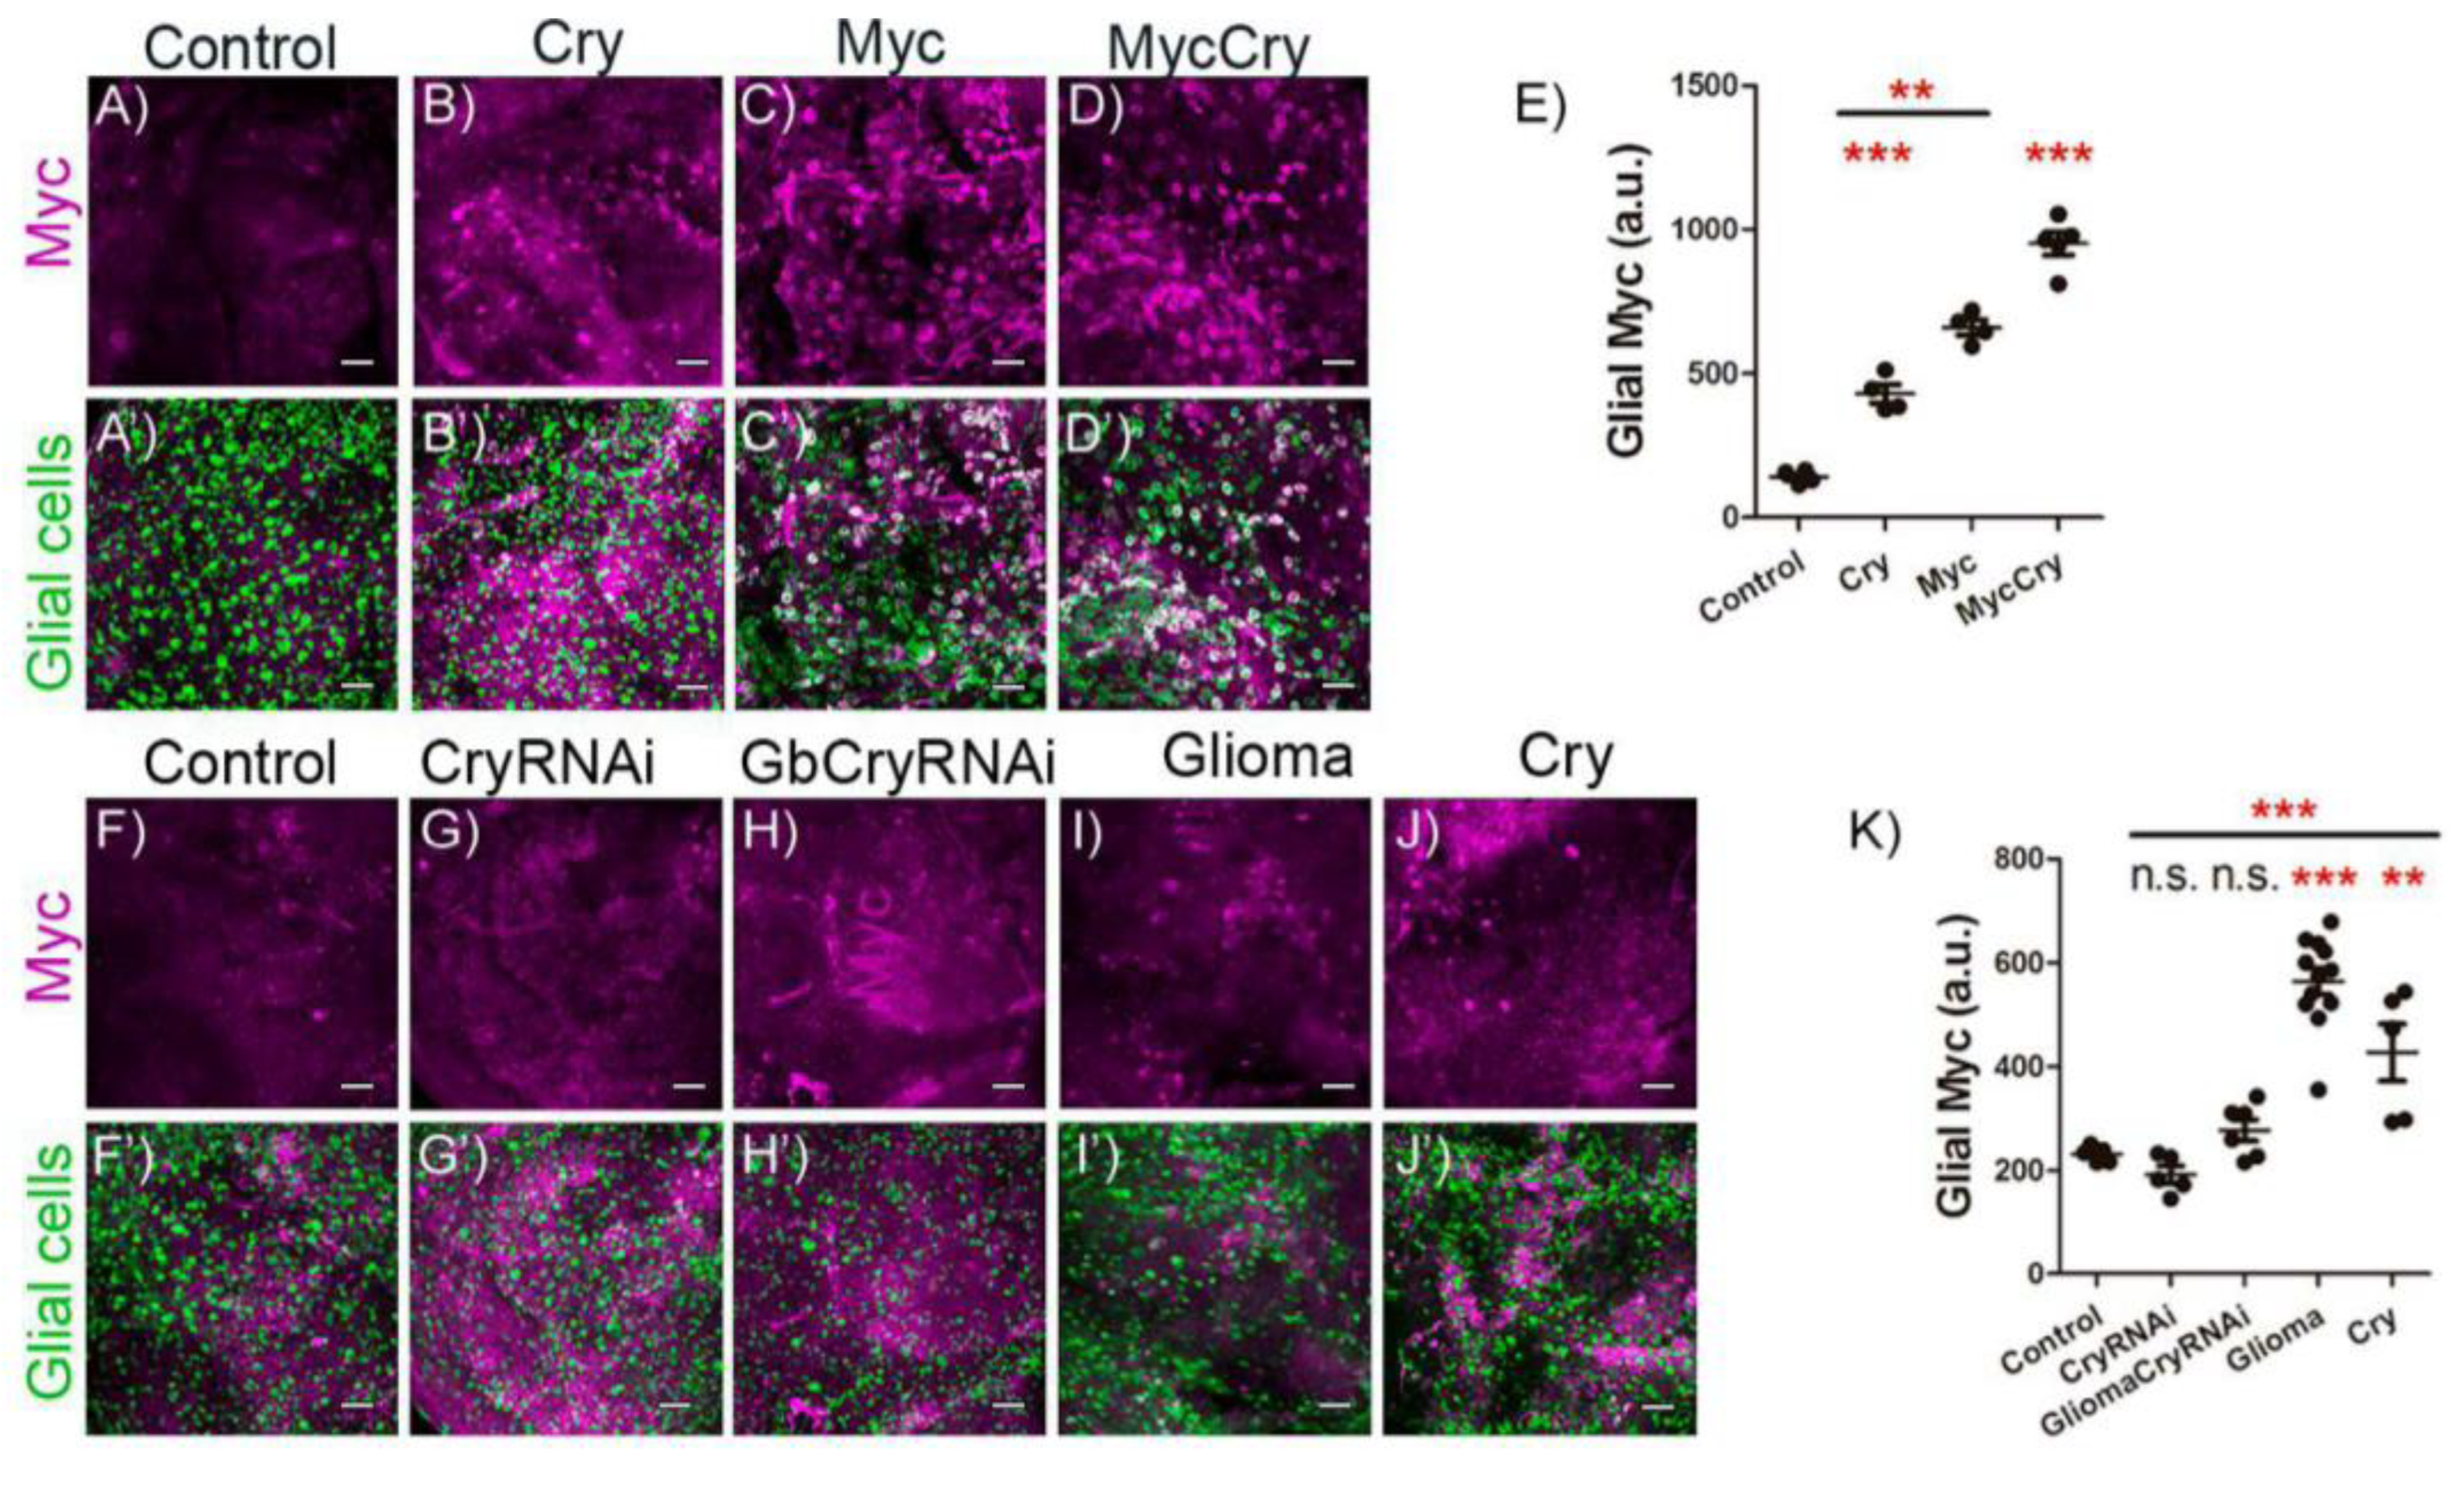
2.4. Cry Regulates Myc Expression in Glial Cells

Next, to determine the epistatic relation between cry and myc, we analyzed Myc protein accumulation in glial cells upon cry expression. First, to analyze if Cry is sufficient to cause an increase in Myc protein levels, we used a specific antibody against Myc and analyzed Myc signal levels upon cry overexpression, myc overexpression or cry + myc overexpression in glial cells (Figure 4A–D’). The quantification of Myc surface signal that coincides with glial cells (anti-repo) showed that cry expression in glia is sufficient to increase Myc protein signal in glial cells, comparable to myc upregulation. In addition, cry + myc upregulation show a summation effect on the increase of Myc protein levels (Figure 4E). To conclude if cry is required for myc expression in GB, we quantified glial Myc signal in the control, cry RNAi, GB, GB + cryRNAi and cry upregulation (Figure 4F–J’). The quantifications indicate that cryRNAi in glial cells does not reduce the amount of Myc in glial cells (Figure 4K). In addition, GB condition triggers the number of Myc positive glial cells, as well as cry upregulation in glial cells (Figure 4K). Finally, cryRNAi expression in GB cells prevents the accumulation of Myc in GB cells. Taking all these results together, we conclude that cry is sufficient to trigger Myc accumulation in glial cells, and cry expression is necessary for Myc accumulation in GB condition.

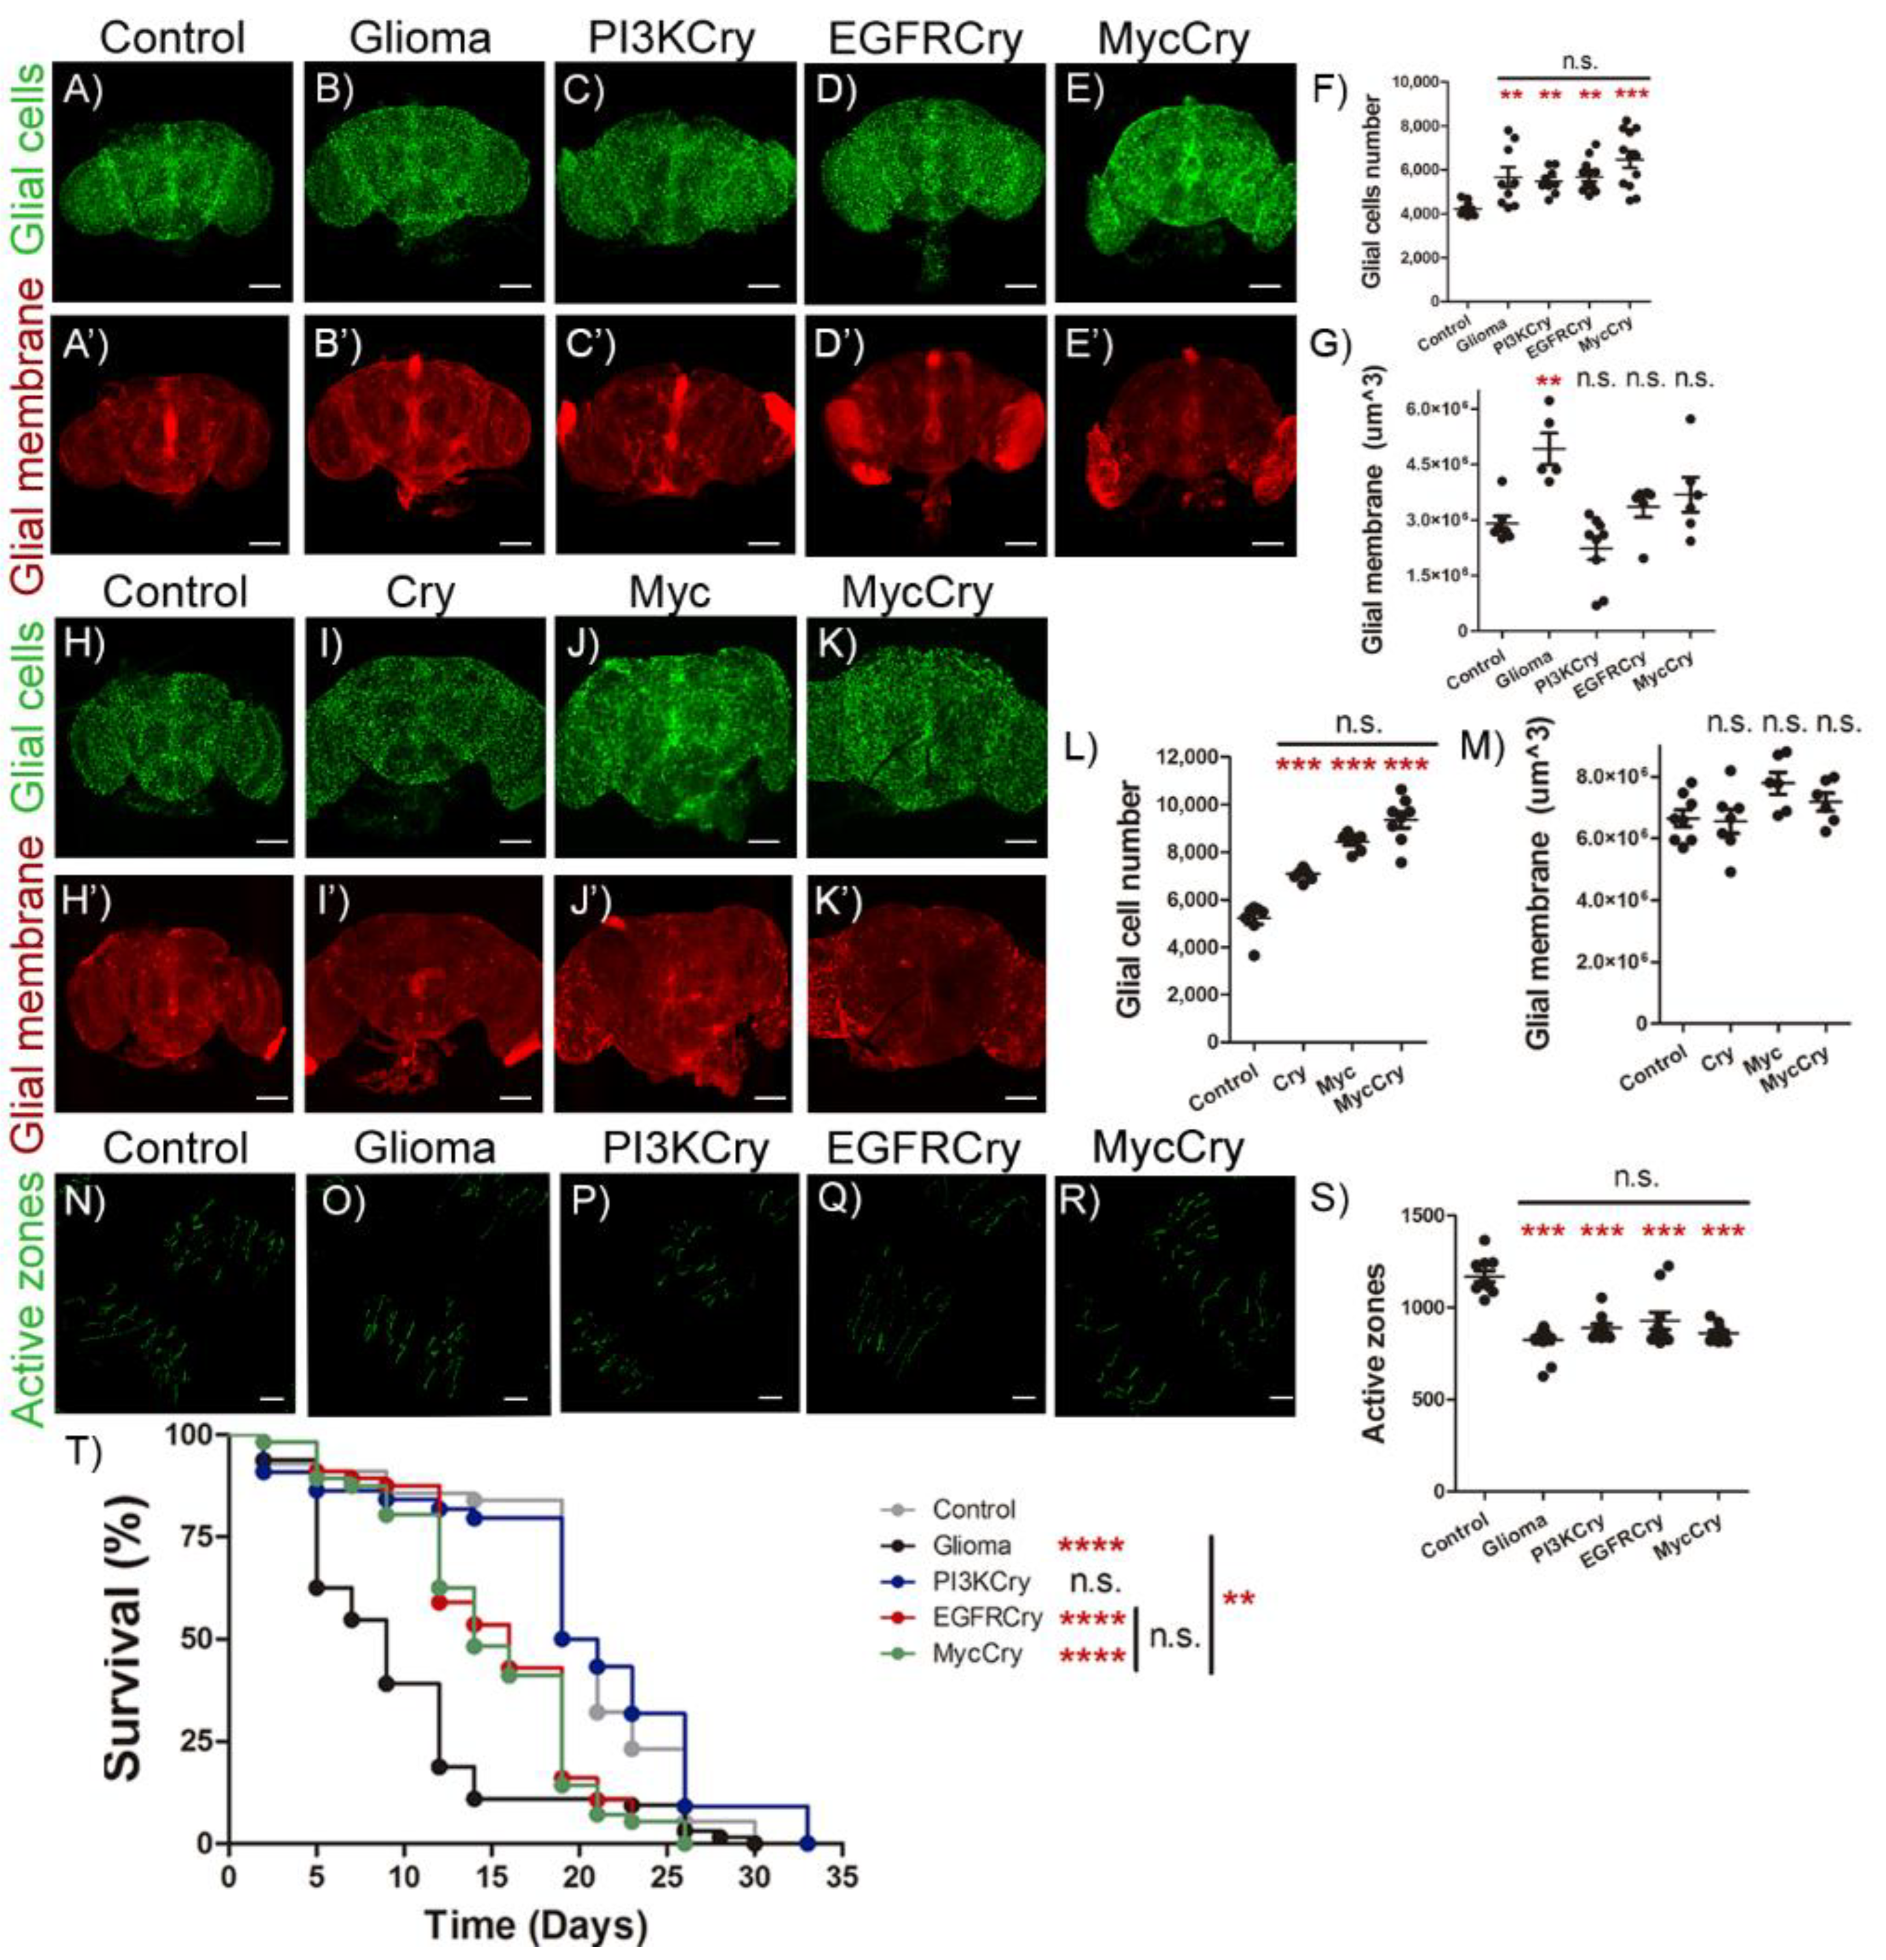
2.5. Cry Contribution to GB Progression

To investigate the contribution of Cry to glioma progression, we determined the number of glial cells and volume of glial membrane network in control adult brain, GB (PI3K + EGFR), PI3K + cry, EGFR + cry or myc + cry expressed in glial cells (Figure 5A–E’). The quantification showed that all these genetic combinations cause an increase in the number of glial cells as compared to control brains (Figure 5F). However, only the GB condition provoked an expansion of the glial membrane volume, and the combination of PI3K + cry, EGFR + cry or myc + cry showed a volume of glial membrane comparable to control brains (Figure 5G). To further determine the contribution of cry to GB expansion, we analyzed the contribution of single gene upregulation in glial cells for cry or myc, and the combination of cry + myc expression (Figure 5H–K’). The quantification of glial cell number showed that cry or myc expression alone, or in combination, is sufficient to increase the number of glial cells with respect to control samples (Figure 5L). Nevertheless, none of these genetic modifications is sufficient to expand glial membrane volume (Figure 5M). These results suggest that cry or myc are sufficient to trigger glial cell number increase in adult brains, but not to expand the volume of glial membrane network.

2.6. Cry Upregulation in Glial Cells Causes Synapse Loss and Premature Death

It was previously described that GB progression induces synapse loss, an early symptom of neurodegeneration. To determine the contribution of cry to synapse loss, we counted the number of active zones in motor neurons of adult neuromuscular junction in the control, GB (PI3K + EGFR), PI3K + cry, EGFR + cry or myc + cry samples (Figure 5N–R). The quantification of the number of active zones showed that the expression in glial cells of GB (PI3K + EGFR), PI3K + cry, EGFR + cry or myc + cry is sufficient to reduce the number of synapses in NMJ neurons (Figure 5S).
Finally, to evaluate the systemic effect of GB and glial expression of PI3K + cry, EGFR + cry or my c + cry, we analyzed the lifespan of adult individuals. The results show that GB causes a premature death, as previously described in Drosophila and mice Xenografts [8,9,11], glial upregulation of EGFR + cry or myc + cry causes a significant reduction of lifespan but less aggressive than GB, and PI3K + cry upregulation in glial cells does not reduce lifespan (Figure 5T).

3. Discussion

Different studies have established a relation between alterations in circadian rhythm genes and cancer [32,34]. Specifically, one of the genes associated with different types of cancer is cry [35,36,37]. Thus, this study aims to investigate the role of cry in a Drosophila GB model.
The previous work of Luo et al. 2012 [38] describes a reduction of the number of glial cells positive for cry1/2 expression in glioma tissue compared to normal tissue. However, the authors show that glioma cells that are positive for Cry1/2 show an increase in the amount of Cry1/2 with respect to non-tumoral tissue. Moreover, both Madden et al. 2014 [26] (with a sample 10 times larger than that of Luo et al. 2012) and Wang et al. 2021 [27] (using data from three different databases) analyzed the expression of circadian genes in glioma tissue compared to healthy tissue and conclude that cry1 is overexpressed in glioma tissue. We also found this result in other databases such as https://www.proteinatlas.org/ and http://gliovis.bioinfo.cnio.es/, accessed on 10 January 2022, [39], which in turn is compatible with the observations in the Drosophila model of GB.
Nonetheless, Fan et al. [40] investigated the role of Cry2 in rat glioma cells and observed that cry2 mRNA and protein levels showed aberrant rhythmic periodicity of 8 h, compared to 24 h in normal tissue. Thus, futures studies on the contribution of circadian rhythms genes should take into consideration the variations of expression.
On the contrary, Dong et al. [41] state that glioblastoma stem cells (GSCs) displayed robust circadian rhythms dependent on core clock transcription factors. The use of Cry1/2 agonists induced anti-tumor effects suggesting that GSCs are sensitive to cry1/2 activity. Taken the different conclusions into consideration, most of the literature and our data suggest that cry is upregulated in glioma cells and promotes glioma progression; however, the role of cry expression in Drosophila, or cry1/2 expression in mammals, may differ according to the glioma subtype, the specific mutations in glioma cells and the cell population of study within the glioma and the hour of the day.
We described an increase in cry1 mRNA levels in human GB samples and in a well-studied Drosophila model of GB. However, we cannot conclude that GB cells show an increase in cry transcription, or an enhancement of cry mRNA stability. The Drosophila GB model is based on the activation of the two most frequently mutated pathways in GB, PI3K and EGFR, which converge in Myc as a coincidence point. These pathways are of great relevance to promote GB cells expansion, GB progression and, in consequence, the deterioration of neighboring neurons and a premature death. The results indicate that cry upregulation in Drosophila GB cells depends on PI3K expression, and it is required for GB cells number increase and synapse loss (Figure 6). In addition, cry expression in glial cells is sufficient to increase the number of glial cells. However, cry expression is expendable for normal wt glial growth during development. Taking into consideration that cry is upregulated in GB cells and promotes glia cells number increase, we did not observe any contribution to normal glia development, which makes Cry a potential target for GB treatment.
Besides, we show that Cry is necessary and sufficient to induce myc expression in GB cells. This agrees with in vitro studies that revealed an increase in Myc levels as a result of cry upregulation [32]. Therefore, we propose that cry is part of the PI3K-Myc signaling pathway in GB, where cry upregulation would be associated with glial cells number increase. However, PI3K is a highly promiscuous enzyme that participates in numerous signaling pathways, and the results suggest that Cry contribution is restricted to the malignant features of GB dependent on myc, such as GB cell number increase and neurodegeneration. However, cry expression is independent of glial membrane expansion characteristic of GB progression. Besides, cry expression in glial cells partially reduces lifespan, but is less aggressive than GB. This result suggests that Cry plays a central role in GB and is required for GB formation, and cry mutations might be responsible for several features of GB. The human gene expression databases indicate that cry1 expression levels correlate negatively with lifespan, and it is associated with a poor prognosis. In conclusion, these results suggest that further studies on the contribution of Cry1 to human GB progression could lead to novel strategies to treat GB patients.
Recent publications describe the communication between GB cells and neurons in human GB cells and mice xenografts based on the establishment of electrical and chemical synapses, which are essential for tumor progression [42,43]. A possible explanation for GB prevention by cry downregulation arises from the non-circadian function of Cry as a regulator of synapse number through the genetic and physical association with the key presynaptic protein Bruchpilot (Brp) [44,45]. In Drosophila, cry mutants show reduced brp expression levels. Actually, Cry interacts physically with Brp to modulate its stability, and triggers its degradation activated by light. Therefore, it is possible that cry overexpression in glial cells promotes the establishment of synapses with neurons. Moreover, the absence of light input impairs Brp degradation in glial cells, thus promoting tumoral progression. In conclusion, further experiments are required to unveil the molecular interactions of Cry and Brp proteins, including the putative formation of abnormal synapses between glial and neurons under the GB condition.
The studies of other groups describe the beneficial effects of haloperidol on cry1 expression in GB cells, but these results obtained in cell culture suggest that the doses required to treat patients might be toxic; in consequence, specific delivery strategies combined with haloperidol are worth of study. In addition, we observed significant effects of cry knockdown in normal glial cells, in line with Bolukbasiet al., who recently described the extension of lifespan by foxo upregulation in glial cells [46]. We observed an effect of cry upregulation in the number of glial cells (Figure 5L). Given that cry and foxo respond to PI3K pathway, it is tempting to speculate that cry expression is relevant for lifespan extension by PI3K pathway, and associated behaviors such as diet restriction.
The classical definition of Cry as a regulator of circadian rhythms can now be expanded to the biology of glial cells, GB progression and the expansion of lifespan in Drosophila. This plethora of different phenotypes associated with one gene is now a common feature previously described for Troponin I [47,48,49], Caspases [50,51,52] or even other circadian genes as per1 [53,54] and contributes to the explanation of the multiple phenotypes observed in patients.
This study describes the epistatic relationship between PI3K, cry and myc and the relevance for GB progression. The strengths of this study rely on the importance of understanding the mechanisms underlying the progression of a fatal tumor as GB, and the reliability of Drosophila as an animal model useful to study human disease. However, it is important to take into consideration the limitations of the results to put them in perspective. We used a model based on the activation of PI3K and EGFR pathways that reproduces the key features of human disease progression, but the contribution of additional mutations such as IDH or TP53 in GB require further studies; thus, new models in flies or other animal models of study will contribute to validate and narrow down our findings.

4. Materials and Methods

4.1. Fly Stocks and Genetics

All fly stocks were maintained at 25 °C (unless otherwise specified) on a 12/12 h light/dark cycles at constant humidity in a standard medium. The stocks used from Bloomington Stock Center were tub-Gal80TS (BL-7019), Repo-Gal4 (BL-7415) and UAS-LacZ (BL-8529). Other fly stocks used were UAS-dEGFRλ, UAS-dp110CAAX (gift from R. Read [6]), UAS-cry (gift from F. Royer [55]), GFP-cry (BDSC_76317, gift from P.E. Hardin), UAS-PI3K (gift from J. Botas [56]), UAS-cryRNAi (gift from F. Royer [57]) and UAS-dMyc (gift from E. Moreno [58]).
The stock containing UAS-cryRNAi was previously generated and validated [57]; this construct produces a double-stranded RNA that corresponds to the 300–799 region of cryRA mRNA.
The glioma-inducing line contains the UAS-dEGFRλ and UAS-dp110CAAX transgenes that encode for the constitutively active forms of the human orthologues PI3K and EGFR, respectively [6]. The Repo-Gal4 line drives the Gal4 expression to glial cells and precursors [59,60] combined with the UAS-dEGFRλ and UAS-dp110CAAX line allow us to generate a glioma thanks to the Gal4 system [14]. To visualize glial or GB cells membrane, we induced the expression of a myristoylated form of red fluorescent protein (UAS-mRFP, described in [9]) under the control of the specific glial promoter repo-Gal4.
Gal80TS is a repressor of the Gal4 activity at 18 °C, although at 29 °C is inactivated [61]. The tub-Gal80TS construct was used in all the crosses to avoid the lethality caused by the glioma development during the larval stage. The crosses were kept at 17 °C until the adult flies emerged. To inactivate the Gal80TS protein and activate the Gal4/UAS system to allow for the expression of our genes of interest; the adult flies were maintained at 29 °C for 7 days except in the survival assay (flies were at 29 °C until death).

4.2. Immunostaining and Image Acquisition

All tissues were treated in simultaneously for each experiment. Adult brains were dissected and fixed with 4% formaldehyde in phosphate-buffered saline for 20 min, whereas adult NMJ were fixed for 10 min; in both cases, samples were washed 3 × 15 min with PBS + 0.4% triton, blocked for 1 h with PBS + 0.4% triton + BSA 5%, incubated overnight with primary antibodies, washed 3 × 15 min, incubated with secondary antibodies for 2 h and mounted in Vectashield mounting medium with DAPI in the case of the brains. The primary antibodies used were anti-Repo mouse (1/200; DSHB, Iowa City, IA, USA) to recognize glial nuclei, anti-Bruchpilot-nc82-mouse (1/50; DSHB, Iowa City, IA, USA) to recognize the presynaptic protein Bruchpilot, anti-HRP rabbit (1/400; Cell Signaling, Danvers, MA, USA) to recognize neuronal membranes, anti-GFP rabbit (1:500; DSHB, Iowa City, IA, USA) and anti-Myc guinea pig (1/100; DSHB, Iowa City, IA, USA) to recognize the nuclear protein Myc. The secondary antibodies used were anti-mouse, -rabbit or -guinea pig Alexa 488 or 647 (1/500; Life Technologies, Carlsbad, CA, USA). Images were taken by a Leica SP5 confocal microscopy applying same conditions for each experiment.

4.3. qRT-PCR

The mRNA for all samples was extracted from adult brains and processed in parallel. For this, 1- to 4-day-old male adult mice were maintained at 29 °C for 7 days and collected on dry ice at ZT6. Total RNA was extracted by triplicate from 30 heads. RNA was extracted with TRIzol and phenol chloroform. cDNA was synthetized from 1 µg of RNA and cDNA samples from 1:5 dilutions were used for real-time PCR reactions. Transcription levels were determined in a 14 µL volume in duplicate using SYBR Green (Applied Biosystems, Waltham, MA, USA) and 7500 qPCR (Thermo Fisher Scientific, Waltham, MA, USA). We analyzed transcription levels of cry using Rp49 as a housekeeping gene reference.
Sequences of primers were as follows.
After completing each real-time PCR run, with cycling conditions of 95 °C for 10 min, 40 cycles of 95 °C for 15 s and 55 °C for 1 min, and outlier data were analyzed using 7500 software (Applied Biosystems, Waltham, MA, USA). Ct values by triplicate of duplicates from three biological samples were analyzed calculating 2DDCt.

4.4. Survival Assays

Lifespan was determined under 12:12 h LD cycles at 29 °C conditions. Three replicates of 30 1- to 4-day-old male adults were collected in vials containing standard Drosophila media and transferred every 2–3 days to fresh Drosophila media.

4.5. Quantification

Fluorescent reporter-relative cry signals within brains were determined from images taken at the same confocal settings avoiding saturation. For the analysis of co-localization rates, “co-localization” tool from LAS AF Lite software (Leica, Wetzlar, Germany), was used taking the co-localization rate data for the statistics analyzing the co-localization between the green signal (both cases) and signal coming from glial tissue from three slices per brain in similar positions of the z axis.
Glial network was marked by a UAS-myristoylated-RFP reporter (mRFP) specifically expressed under the control of repo-Gal4. The total volume was quantified using the Imaris surface tool (Imaris 6.3.1 software, Oxford Instruments, Abingdon, UK). Glial nuclei were marked by staining with the anti-Repo (DSHB). The number of Repo + cells and number of synapses (anti-nc82; DSHB) were quantified by using the spots tool in Imaris 6.3.1 software (Oxford Instruments, Abingdon, UK). We selected a minimum size and threshold for the spot in the control samples of each experiment: 0.5 μm for active zones and 2 μm for glial cell nuclei. Myc glial signal was quantified using the Imaris surface tool (Imaris 6.3.1 software, Oxford Instruments, Abingdon, UK) creating a mask for the glial nuclei signal and exclusively selecting the myc signal corresponding to glial nuclei. Then we applied the same conditions to the analysis of the corresponding experimental sample.

4.6. Statistics

The results were analyzed using the GraphPad Prism 5 software. Quantitative parameters were divided into parametric and nonparametric using the D’Agostino and Pearson omnibus normality test, and the variances were analyzed with F test. The t-test and ANOVA test with Bonferroni’s post hoc were used in parametric parameters, using Welch’s correction when necessary. The survival assays were analyzed with Mantel–Cox test. The p limit value for rejecting the null hypothesis and considering the differences between cases as statistically significant was p < 0.05 (*). Other p-values are indicated as ** when p < 0.01 and *** when p < 0.001.

4.7. Human GB Databases

We used a public open access database (http://gliovis.bioinfo.cnio.es/, accessed on 1 February 2022) to analyze the expression of human Cry1 gene in GB samples. We used the “Adult” samples in CGGA Dataset and included the data from primary and secondary tumor types. The data shown in Figure 1 correspond to the “expression” and “survival” tabs. Please note that nomenclature corresponds to the 2016 classification. GBM—Glioblastoma multiforme.

Author Contributions

Conceptualization, P.J. and S.C.-T.; methodology, P.J., C.d.P., A.G.-B. and S.C.-T.; software, P.J., C.d.P., A.G.-B. and S.C.-T.; validation, P.J., C.d.P., A.G.-B. and S.C.-T.; formal analysis, P.J., C.d.P., A.G.-B. and S.C.-T.; investigation, P.J., C.d.P., A.G.-B. and S.C.-T.; resources, P.J. and S.C.-T.; data curation, P.J. and S.C.-T.; writing original draft preparation, P.J. and S.C.-T.; writing, review and editing, P.J., C.d.P., A.G.-B. and S.C.-T.; visualization, P.J., C.d.P., A.G.-B. and S.C.-T.; supervision, P.J. and S.C.-T.; project administration, S.C.-T.; funding acquisition, P.J. and S.C.-T. All authors have read and agreed to the published version of the manuscript.

Funding

Research was funded by grant PID2019-110116GB-100 from the Spanish Ministerio de Ciencia e Innovación to S.C.-T. and Khalifa Capital donation to P.J.

Institutional Review Board Statement

Not applicable.

Informed Consent Statement

Not applicable.

Acknowledgments

We thank Alberto Ferrús and Paco Martín for critiques of the manuscript and for helpful discussions, and Esther Seco for fly stocks maintenance. We want to thank the Vienna Drosophila Resource Centre, the Bloomington Drosophila Stock Centre and the Developmental Studies Hybridoma Bank for supplying fly stocks and antibodies, and FlyBase for its wealth of information. We acknowledge the support of the Confocal Microscopy Unit and Molecular Biology Unit at the Cajal Institute and the Drosophila Transgenesis Unit. The results shown here are in part based upon data generated by the TCGA Research Network: https://www.cancer.gov/tcga (accessed on 1 February 2022).

Conflicts of Interest

The authors declare no conflict of interest. The funders had no role in the design of the study; in the collection, analyses, or interpretation of data; in the writing of the manuscript, or in the decision to publish the results.

References

  1. Ostrom, Q.T.; Truitt, G.; Gittleman, H.; Brat, D.J.; Kruchko, C.; Wilson, R.; Barnholtz-Sloan, J.S. Relative survival after diagnosis with a primary brain or other central nervous system tumor in the National Program of Cancer Registries, 2004 to 2014. Neuro. Oncol. Pract. 2020, 7, 306–312. [Google Scholar] [CrossRef] [PubMed]
  2. Louis, D.N.; Perry, A.; Wesseling, P.; Brat, D.J.; Cree, I.A.; Figarella-Branger, D.; Hawkins, C.; Ng, H.K.; Pfister, S.M.; Reifenberger, G.; et al. The 2021 WHO Classification of Tumors of the Central Nervous System: A summary. Neuro. Oncol. 2021, 23, 1231–1251. [Google Scholar] [CrossRef] [PubMed]
  3. Wirsching, H.G.; Weller, M. The Role of Molecular Diagnostics in the Management of Patients with Gliomas. Curr. Treat. Options Oncol. 2016, 17, 51. [Google Scholar] [CrossRef] [PubMed] [Green Version]
  4. Rich, J.N.; Bigner, D.D. Development of novel targeted therapies in the treatment of malignant glioma. Nat. Rev. Drug Discov. 2004, 3, 430–446. [Google Scholar] [CrossRef]
  5. Brennan, C.W.; Verhaak, R.G.W.; McKenna, A.; Campos, B.; Noushmehr, H.; Salama, S.R.; Zheng, S.; Chakravarty, D.; Sanborn, J.Z.; Berman, S.H.; et al. The somatic genomic landscape of glioblastoma. Cell 2013, 155, 462. [Google Scholar] [CrossRef]
  6. Read, R.D.; Cavenee, W.K.; Furnari, F.B.; Thomas, J.B. A Drosophila model for EGFR-Ras and PI3K-dependent human glioma. PLoS Genet. 2009, 5, e1000374. [Google Scholar] [CrossRef] [Green Version]
  7. Portela, M.; Mitchell, T.; Casas-Tintó, S. Cell-to-cell communication mediates glioblastoma progression in Drosophila. Biol. Open 2020, 9, bio053405. [Google Scholar] [CrossRef]
  8. Portela, M.; Segura-Collar, B.; Argudo, I.; Sáiz, A.; Gargini, R.; Sánchez-Gómez, P.; Casas-Tintó, S. Oncogenic dependence of glioma cells on kish/TMEM167A regulation of vesicular trafficking. Glia 2019, 67, 404–417. [Google Scholar] [CrossRef]
  9. Portela, M.; Venkataramani, V.; Fahey-Lozano, N.; Seco, E.; Losada-Perez, M.; Winkler, F.; Casas-Tintó, S. Glioblastoma cells vampirize WNT from neurons and trigger a JNK/MMP signaling loop that enhances glioblastoma progression and neurodegeneration. PLoS Biol. 2019, 17, e3000545. [Google Scholar] [CrossRef]
  10. Portela, M.; Casas-Tintó, S. New Cellular Dimensions on Glioblastoma Progression. Neurosci. Insights 2020, 15, 2633105520923076. [Google Scholar] [CrossRef]
  11. Jarabo, P.; de Pablo, C.; Herranz, H.; Martín, F.A.; Casas-Tintó, S. Insulin signaling mediates neurodegeneration in glioma. Life Sci. Alliance 2021, 4. [Google Scholar] [CrossRef] [PubMed]
  12. Formica, M.; Storaci, A.M.; Bertolini, I.; Carminati, F.; Knævelsrud, H.; Vaira, V.; Vaccari, T. V-ATPase controls tumor growth and autophagy in a Drosophila model of gliomagenesis. Autophagy 2021, 17, 4442–4452. [Google Scholar] [CrossRef] [PubMed]
  13. Vigneswaran, K.; Boyd, N.H.; Oh, S.Y.; Lallani, S.; Boucher, A.; Neill, S.G.; Olson, J.J.; Read, R.D. YAP/TAZ Transcriptional Coactivators Create Therapeutic Vulnerability to Verteporfin in EGFR-mutant Glioblastoma. Clin. Cancer Res. 2021, 27, 1553–1569. [Google Scholar] [CrossRef] [PubMed]
  14. Brand, A.H.; Perrimon, N. Targeted gene expression as a means of altering cell fates and generating dominant phenotypes. Development 1993, 118, 401–415. [Google Scholar] [CrossRef]
  15. Casas-Tintó, S.; Portela, M. Cytonemes, their formation, regulation, and roles in signaling and communication in tumorigenesis. Int. J. Mol. Sci. 2019, 20, 5641. [Google Scholar] [CrossRef] [Green Version]
  16. Annibali, D.; Whitfield, J.R.; Favuzzi, E.; Jauset, T.; Serrano, E.; Cuartas, I.; Redondo-Campos, S.; Folch, G.; Gonzàlez-Juncà, A.; Sodir, N.M.; et al. Myc inhibition is effective against glioma and reveals a role for Myc in proficient mitosis. Nat. Commun. 2014, 5, 4632. [Google Scholar] [CrossRef]
  17. Kozono, D.; Li, J.; Nitta, M.; Sampetrean, O.; Gonda, D.; Kushwaha, D.S.; Merzon, D.; Ramakrishnan, V.; Zhu, S.; Zhu, K.; et al. Dynamic epigenetic regulation of glioblastoma tumorigenicity through LSD1 modulation of MYC expression. Proc. Natl. Acad. Sci. USA 2015, 112, E4055–E4064. [Google Scholar] [CrossRef] [Green Version]
  18. Oktay, Y.; Ülgen, E.; Can, Ö.; Akyerli, C.B.; Yüksel, Ş.; Erdemgil, Y.; Durasl, I.M.; Henegariu, O.I.; Nanni, E.P.; Selevsek, N.; et al. IDH-mutant glioma specific association of rs55705857 located at 8q24.21 involves MYC deregulation. Sci. Rep. 2016, 6, 27569. [Google Scholar] [CrossRef] [Green Version]
  19. Tateishi, K.; Iafrate, A.J.; Ho, Q.; Curry, W.T.; Batchelor, T.T.; Flaherty, K.T.; Onozato, M.L.; Lelic, N.; Sundaram, S.; Cahill, D.P.; et al. Myc-Driven Glycolysis Is a Therapeutic Target in Glioblastoma. Clin. Cancer Res. 2016, 22, 4452–4465. [Google Scholar] [CrossRef] [Green Version]
  20. Wagner, P.M.; Prucca, C.G.; Caputto, B.L.; Guido, M.E. Adjusting the Molecular Clock: The Importance of Circadian Rhythms in the Development of Glioblastomas and Its Intervention as a Therapeutic Strategy. Int. J. Mol. Sci. 2021, 22, 8289. [Google Scholar] [CrossRef]
  21. Lahti, T.; Merikanto, I.; Partonen, T. Circadian clock disruptions and the risk of cancer. Ann. Med. 2012, 44, 847–853. [Google Scholar] [CrossRef]
  22. Kettner, N.M.; Katchy, C.A.; Fu, L. Circadian gene variants in cancer. Ann. Med. 2014, 46, 208. [Google Scholar] [CrossRef] [Green Version]
  23. Jarabo, P.; Martin, F.A. Neurogenetics of Drosophila circadian clock: Expect the unexpected. J. Neurogenet. 2017, 31, 250–265. [Google Scholar] [CrossRef] [PubMed]
  24. Vechtomova, Y.L.; Telegina, T.A.; Kritsky, M.S. Evolution of Proteins of the DNA Photolyase/Cryptochrome Family. Biochemistry (Moscow) 2020, 85, S131–S153. [Google Scholar] [CrossRef] [PubMed]
  25. Collins, B.; Mazzoni, E.O.; Stanewsky, R.; Blau, J. Drosophila CRYPTOCHROME is a circadian transcriptional repressor. Curr. Biol. 2006, 16, 441–449. [Google Scholar] [CrossRef] [PubMed] [Green Version]
  26. Madden, M.H.; Anic, G.M.; Thompson, R.C.; Nabors, L.B.; Olson, J.J.; Browning, J.E.; Monteiro, A.N.; Egan, K.M. Circadian pathway genes in relation to glioma risk and outcome. Cancer Causes Control 2014, 25, 25–32. [Google Scholar] [CrossRef]
  27. Wang, Z.; Su, G.; Dai, Z.; Meng, M.; Zhang, H.; Fan, F.; Liu, Z.; Zhang, L.; Weygant, N.; He, F.; et al. Circadian clock genes promote glioma progression by affecting tumour immune infiltration and tumour cell proliferation. Cell Prolif. 2021, 54, e12988. [Google Scholar] [CrossRef]
  28. Chen, Z.; Liu, P.; Li, C.; Luo, Y.; Chen, I.; Liang, W.; Chen, X.; Feng, Y.; Xia, H.; Wang, F. Deregulated expression of the clock genes in gliomas. Technol. Cancer Res. Treat. 2013, 12, 91–97. [Google Scholar] [CrossRef] [Green Version]
  29. Zhanfeng, N.; Yanhui, L.; Zhou, F.; Shaocai, H.; Guangxing, L.; Hechun, X. Circadian genes Per1 and Per2 increase radiosensitivity of glioma in vivo. Oncotarget 2015, 6, 9951–9958. [Google Scholar] [CrossRef] [Green Version]
  30. Burchett, J.B.; Knudsen-clark, A.M.; Altman, B.J. MYC Ran Up the Clock: The Complex Interplay between MYC and the Molecular Circadian Clock in Cancer. Int. J. Mol. Sci. 2021, 22, 7761. [Google Scholar] [CrossRef]
  31. Liu, Z.; Selby, C.P.; Yang, Y.; Lindsey-Boltz, L.A.; Cao, X.; Eynullazada, K.; Sancar, A. Circadian regulation of c-MYC in mice. Proc. Natl. Acad. Sci. USA 2020, 117, 21609–21617. [Google Scholar] [CrossRef] [PubMed]
  32. Altman, B.J.; Hsieh, A.L.; Sengupta, A.; Krishnanaiah, S.Y.; Stine, Z.E.; Walton, Z.E.; Gouw, A.M.; Venkataraman, A.; Li, B.; Goraksha-Hicks, P.; et al. MYC Disrupts the Circadian Clock and Metabolism in Cancer Cells. Cell Metab. 2015, 22, 1009–1019. [Google Scholar] [CrossRef] [PubMed] [Green Version]
  33. Arnés, M.; Romero, N.; Casas-Tintó, S.; Acebes, Á.; Ferrús, A. PI3K activation prevents Aβ42-induced synapse loss and favors insoluble amyloid deposit formation. Mol. Biol. Cell 2020, 31, 244–260. [Google Scholar] [CrossRef] [PubMed]
  34. Kelleher, F.C.; Rao, A.; Maguire, A. Circadian molecular clocks and cancer. Cancer Lett. 2014, 342, 9–18. [Google Scholar] [CrossRef]
  35. Shafi, A.A.; McNair, C.M.; McCann, J.J.; Alshalalfa, M.; Shostak, A.; Severson, T.M.; Zhu, Y.; Bergman, A.; Gordon, N.; Mandigo, A.C.; et al. The circadian cryptochrome, CRY1, is a pro-tumorigenic factor that rhythmically modulates DNA repair. Nat. Commun. 2021, 12, 401. [Google Scholar] [CrossRef] [PubMed]
  36. Mampay, M.; Flint, M.S.; Sheridan, G.K. Tumour brain: Pretreatment cognitive and affective disorders caused by peripheral cancers. Br. J. Pharmacol. 2021, 178, 3977–3996. [Google Scholar] [CrossRef]
  37. Yang, Y.; Lindsey-Boltz, L.A.; Vaughn, C.M.; Selby, C.P.; Cao, X.; Liu, Z.; Hsu, D.S.; Sancar, A. Circadian clock, carcinogenesis, chronochemotherapy connections. J. Biol. Chem. 2021, 297, 101068. [Google Scholar] [CrossRef]
  38. Luo, Y.; Wang, F.; Chen, L.A.; Chen, X.W.; Chen, Z.J.; Liu, P.F.; Li, F.F.; Li, C.Y.; Liang, W. Deregulated expression of cry1 and cry2 in human gliomas. Asian Pac. J. Cancer Prev. 2012, 13, 5725–5728. [Google Scholar] [CrossRef] [Green Version]
  39. Bowman, R.L.; Wang, Q.; Carro, A.; Verhaak, R.G.W.; Squatrito, M. GlioVis data portal for visualization and analysis of brain tumor expression datasets. Neuro. Oncol. 2017, 19, 139. [Google Scholar] [CrossRef] [Green Version]
  40. Fan, W.; Caiyan, L.; Ling, Z.; Jiayun, Z. Aberrant rhythmic expression of cryptochrome2 regulates the radiosensitivity of rat gliomas. Oncotarget 2017, 8, 77809. [Google Scholar] [CrossRef] [Green Version]
  41. Dong, Z.; Zhang, G.; Qu, M.; Gimple, R.C.; Wu, Q.; Qiu, Z.; Prager, B.C.; Wang, X.; Kim, L.J.Y.; Morton, A.R.; et al. Targeting Glioblastoma Stem Cells through Disruption of the Circadian Clock. Cancer Discov. 2019, 9, 1556. [Google Scholar] [CrossRef] [PubMed] [Green Version]
  42. Venkataramani, V.; Tanev, D.I.; Strahle, C.; Studier-Fischer, A.; Fankhauser, L.; Kessler, T.; Körber, C.; Kardorff, M.; Ratliff, M.; Xie, R.; et al. Glutamatergic synaptic input to glioma cells drives brain tumour progression. Nature 2019, 573, 532–538. [Google Scholar] [CrossRef] [PubMed]
  43. Venkatesh, H.S.; Morishita, W.; Geraghty, A.C.; Silverbush, D.; Gillespie, S.M.; Arzt, M.; Tam, L.T.; Espenel, C.; Ponnuswami, A.; Ni, L.; et al. Electrical and synaptic integration of glioma into neural circuits. Nature 2019, 573, 539–545. [Google Scholar] [CrossRef] [PubMed]
  44. Górska-Andrzejak, J.; Makuch, R.; Stefan, J.; Görlich, A.; Semik, D.; Pyza, E. Circadian expression of the presynaptic active zone protein bruchpilot in the lamina of Drosophila melanogaster. Dev. Neurobiol. 2013, 73, 14–26. [Google Scholar] [CrossRef] [PubMed]
  45. Damulewicz, M.; Mazzotta, G.M.; Sartori, E.; Rosato, E.; Costa, R.; Pyza, E.M. Cryptochrome is a regulator of synaptic plasticity in the visual system of drosophila melanogaster. Front. Mol. Neurosci. 2017, 10, 165. [Google Scholar] [CrossRef] [PubMed]
  46. Bolukbasi, E.; Woodling, N.S.; Ivanov, D.K.; Adcott, J.; Foley, A.; Rajasingam, A.; Gittings, L.M.; Aleyakpo, B.; Niccoli, T.; Thornton, J.M.; et al. Cell type-specific modulation of healthspan by Forkhead family transcription factors in the nervous system. Proc. Natl. Acad. Sci. USA 2021, 118, e2011491118. [Google Scholar] [CrossRef]
  47. Casas-Tintó, S.; Ferrús, A. Troponin-I mediates the localization of selected apico-basal cell polarity signaling proteins. J. Cell Sci. 2019, 132, jcs225243. [Google Scholar] [CrossRef]
  48. Casas-Tintó, S.; Portela, M.; Ferrús, A. Widening the concept of oncogene. Aging (Albany NY) 2016, 8, 2262. [Google Scholar] [CrossRef] [Green Version]
  49. Casas-Tintó, S.; Maraver, A.; Serrano, M.; Ferrús, A. Troponin-I enhances and is required for oncogenic overgrowth. Oncotarget 2016, 7, 52631–52642. [Google Scholar] [CrossRef] [Green Version]
  50. Arthurton, L.; Nahotko, D.A.; Alonso, J.; Wendler, F.; Baena-Lopez, L.A. Non-apoptotic caspase activation preserves Drosophila intestinal progenitor cells in quiescence. EMBO Rep. 2020, 21, e48892. [Google Scholar] [CrossRef]
  51. Baena-Lopez, L.A. All about the caspase-dependent functions without cell death. Semin. Cell Dev. Biol. 2018, 82, 77–78. [Google Scholar] [CrossRef] [PubMed]
  52. Baena-Lopez, L.A.; Arthurton, L.; Xu, D.C.; Galasso, A. Non-apoptotic Caspase regulation of stem cell properties. Semin. Cell Dev. Biol. 2018, 82, 118–126. [Google Scholar] [CrossRef] [PubMed]
  53. Kwapis, J.L.; Alaghband, Y.; Kramár, E.A.; López, A.J.; Vogel Ciernia, A.; White, A.O.; Shu, G.; Rhee, D.; Michael, C.M.; Montellier, E.; et al. Epigenetic regulation of the circadian gene Per1 contributes to age-related changes in hippocampal memory. Nat. Commun. 2018, 9, 3323. [Google Scholar] [CrossRef] [Green Version]
  54. Zhang, L.; Ptáček, L.J.; Fu, Y.H. Diversity of human clock genotypes and consequences. Prog. Mol. Biol. Transl. Sci. 2013, 119, 51–81. [Google Scholar] [CrossRef] [Green Version]
  55. Emery, P.; Stanewsky, R.; Helfrich-Förster, C.; Emery-Le, M.; Hall, J.C.; Rosbash, M. Drosophila CRY is a deep brain circadian photoreceptor. Neuron 2000, 26, 493–504. [Google Scholar] [CrossRef] [Green Version]
  56. Orme, M.H.; Alrubaie, S.; Bradley, G.L.; Walker, C.D.; Leevers, S.J. Input from Ras is required for maximal PI(3)K signalling in Drosophila. Nat. Cell Biol. 2006, 8, 1298–1302. [Google Scholar] [CrossRef] [PubMed]
  57. Picot, M.; Cusumano, P.; Klarsfeld, A.; Ueda, R.; Rouyer, F. Light Activates Output from Evening Neurons and Inhibits Output from Morning Neurons in the Drosophila Circadian Clock. PLoS Biol. 2007, 5, e315. [Google Scholar] [CrossRef]
  58. Moreno, E.; Basler, K. dMyc transforms cells into super-competitors. Cell 2004, 117, 117–129. [Google Scholar] [CrossRef] [Green Version]
  59. Lee, B.P.; Jones, B.W. Transcriptional regulation of the Drosophila glial gene repo. Mech. Dev. 2005, 122, 849–862. [Google Scholar] [CrossRef] [PubMed]
  60. Casas-Tintó, S.; Arnés, M.; Ferrús, A. Drosophila enhancer-Gal4 lines show ectopic expression during development. R. Soc. Open Sci. 2017, 4, 170039. [Google Scholar] [CrossRef] [Green Version]
  61. McGuire, S.E.; Le, P.T.; Osborn, A.J.; Matsumoto, K.; Davis, R.L. Spatiotemporal Rescue of Memory Dysfunction in Drosophila. Science 2003, 302, 1765–1768. [Google Scholar] [CrossRef] [PubMed] [Green Version]
Figure 1. Circadian gene cry is upregulated in both human GB samples and GB Drosophila model. (A) RT-qPCR analysis of complete brains of 7-day-old adult flies from repo-Gal4 > UAS-LacZ (Control) and repo-Gal4 > UAS-dEGFRλ, UAS-dp110 CAAX (Glioma) genotypes in LD conditions at ZT6 for the circadian gene cry (t-test) in n = 90. (BE) Confocal microscopy images of brains of 7-day-old adult flies from (B) repo-Gal4 > UAS-LacZ (Control), (C) repo-Gal4 > UAS-dEGFRλ, UAS-dp110 CAAX (Glioma), (D) repo-Gal4 > UAS-dEGFRλ, UAS-dp110 CAAX, UAS-cryRNAi (Glioma CryRNAi) and (E) repo-Gal4 > UAS-cryRNAi (Glia CryRNAi) after using (B’E″) magnifications of the brain lobe central region, the reporter GFP-Cry in green and the glial membrane are marked in red. (F) Co-localization between GFP-Cry signal and the glial membrane (mRFP). Statistical analysis in at least n = 16 (ANOVA, post-hoc Bonferroni). (G) Data on overexpression of cry1 in human primary gliomas and GB against normal tissue. (H) Graph showing a lower life expectancy in those patients with primary GB and cry1 overexpressed compared to patients with primary GB with low expression of cry1. (I) Data on cry1 expression in human secondary GB compared to normal tissue. (J) Graph showing a lower life expectancy in those patients with secondary GB and cry1 overexpressed compared to patients with secondary GB with low expression of cry1. Images obtained from gliovis.bioinfo.cnio.es based on the 2016 classification of brain tumors (scale bar, 100 µm in (BE) and 20 µm in (B’E’) (n.s. not significant, ** p-value < 0.01, *** p-value < 0.001).
Ijms 23 02043 g001
Figure 2. Ectopic downregulation of cry prevents GB tumorigenesis and effects. (AD) Confocal microscopy images of brains from 7-day-old adult flies with the following genotypes: (A) repo-Gal4 > UAS-LacZ (Control), (B) repo-Gal4 > UAS-dEGFRλ, UAS-dp110 CAAX (Glioma), (C) repo-Gal4 > UAS-dEGFRλ, UAS-dp110 CAAX, UAS-cryRNAi (Glioma CryRNAi) and (D) repo-Gal4 > UAS-cryRNAi (Glia CryRNAi) with glial nuclei marked in green with anti-repo (scale bar, 100 µm). (A’D’) Glial membrane is shown in red by the expression of mRFP. (E) Quantification of glial cells number and (F) quantification of glial membrane volume. Statistical analysis for at least n = 11 per genotype (ANOVA, post-hoc Bonferroni). (GJ) Confocal images of adult NMJ of 7-day-old flies from (G) repo-Gal4 > UAS-LacZ (Control) (H) repo-Gal4 > UAS-dEGFRλ, UAS-dp110CAAX (Glioma), (I) repo-Gal4 > UAS-dEGFRλ, UAS-dp110 CAAX, UAS-cryRNAi (Glioma CryRNAi) and (J) repo-Gal4 > UAS-cryRNAi (Glia CryRNAi) genotypes. Active zones are visualized by nc82 (anti-Brp) antibody and marked in green (scale bar, 25 µm). (K) Quantification and statistical analysis of active zones in at least n = 17 per genotype (ANOVA, post-hoc Bonferroni). (L) Graph shows a survival assay of repo-Gal4 > UAS-LacZ (Control, grey), repo-Gal4 > UAS-dEGFRλ, UAS-dp110CAAX (Glioma, black), repo-Gal4 > UAS-dEGFRλ, UAS-cryRNAi, (Glioma CryRNAi, dark green) and repo-Gal4 > UAS-cryRNAi, (Glia CryRNAi, light green) flies and statistical analysis in n = 90 (Mantel-Cox test) (n.s. not significant, *** p-value < 0.001, **** p-value < 0.0001).
Ijms 23 02043 g002
Figure 3. PI3K upregulates the levels of cry. (A) Scheme of EGFR (blue) and PI3K (yellow) signaling pathways involved in GB tumoral transformation with Myc as convergence point (green) (modified from [6]). (BE) Confocal microscopy images of brains from 7-day-old adult flies with the following genotypes: (B) repo-Gal4 > UAS-LacZ (Control), (C) repo-Gal4 > UAS-dp110CAAX (PI3K), (C) repo-Gal4 > UAS-dEGFRλ (EGFR) and (D) repo-Gal4 > UAS-dmyc (Myc) using the reporter GFP-cry visualized in green (scale bar, 100 µm) and B’E’) the glial membrane is marked in red by the expression of mRFP. Green and red signal merge produces the yellow signal. (F) Co-localization between GFP-cry and the glial membrane (mRFP) and statistical analysis in at least n = 16 (ANOVA, post-hoc Bonferroni) ( n.s. not significant, * p-value < 0.05, *** p-value < 0.001).
Ijms 23 02043 g003
Figure 4. Cry increases glial Myc protein levels in physiological and GB conditions. (AD) Confocal microscopy images of brains from 7-day-old adult flies with the following genotypes: (A) repo-Gal4 > UAS-LacZ (Control), (B) repo-Gal4 > UAS-cry (Cry), (C) repo-Gal4 > UAS-dmyc (Myc) and (D) repo-Gal4 > UAS-dmyc, UAS-cry (MycCry) with Myc marked in magenta (anti-Myc). (A’D’) Glial nuclei marked in green (anti-Repo) (scale bar, 25 µm). (E) Glial Myc quantification and statistical analysis for at least n = 9 per genotype (ANOVA, post-hoc Bonferroni). (FJ) Confocal microscopy images of brains 7-day-old adult flies from (F) repo-Gal4 > UAS-LacZ (Control), (G) repo-Gal4 > UAS-cryRNAi (CryRNAi), (H) repo-Gal4 > UAS-dEGFRλ, UAS-dp110 CAAX, UAS-cryRNAi (Glioma CryRNAi), (I) repo-Gal4 > UAS-dEGFRλ, UAS-dp110 CAAX (Glioma) and (J) repo-Gal4 > UAS-cry (Cry); Myc is marked in magenta (anti-Myc) (F’J’) and glial nuclei are marked in green (anti-Repo) (scale bar, 25 µm). (K) Glial Myc quantification and statistical analysis for at least n = 12 per genotype (ANOVA, post-hoc Bonferroni) ( n.s. not significant, ** p-value < 0.01, *** p-value <0.001).
Ijms 23 02043 g004
Figure 5. EGFR-cry co-expression induces glial cells number increase, synapse number and survival reduction. (AE) Confocal microscopy images of brains from 7-day-old adult flies with the following genotypes: (A) repo-Gal4 > UAS-LacZ (Control), (B) repo-Gal4 > UAS-dEGFRλ, UAS-dp110 CAAX (Glioma), (C) repo-Gal4 > UAS-dp110 CAAX, UAS-cry (PI3KCry), (D) repo-Gal4 > UAS-dEGFRλ, UAS-cry (EGFRCry) and (E) repo-Gal4 > UAS-dmyc, UAS-cry (MycCry) with glial nuclei marked in green (anti-Repo) (scale bar, 100 µm). (A’E’) Glial membrane is visualized in red by the expression. (F) Glial cells number and (G) glial membrane volume quantification and statistical analysis for at least n = 12 per genotype (ANOVA, post-hoc Bonferroni). (HK) Confocal images of adult brains of 7-day-old flies from (H) repo-Gal4 > UAS-LacZ (Control) (I) repo-Gal4 > UAS-cry (Cry), (J) repo-Gal4 > UAS-dmyc (Myc) and (K) repo-Gal4 > UAS-cry, UAS-dmyc (MycCry) genotypes with glial nuclei marked in green (anti-Repo) (scale bar, 100 µm) (H’K’) and glial membrane shown in red (mRFP). (L) Glial cells number and (M) glial membrane volume quantification and statistical analysis for at least n = 9 per genotype (ANOVA, post-hoc Bonferroni). (NR) Confocal microscopy images of NMJ of 7-day-old adult flies from (N) repo-Gal4 > UAS-LacZ (Control), (O) repo-Gal4 > UAS-dEGFRλ, UAS-dp110 CAAX (Glioma), (P) repo-Gal4 > UAS-dp110 CAAX, UAS-cry (PI3KCry), (Q) repo-Gal4 > UAS-dEGFRλ, UAS-cry (EGFRCry) and (R) repo-Gal4 > UAS-dmyc, UAS-cry (MycCry). Active zones are marked with anti-Brp (nc-82) visualized in green (nc82, anti-Brp) (scale bar, 25µm). (S) Quantification and statistical analysis of active zones in at least n = 13 per genotype (ANOVA, post-hoc Bonferroni). (T) Graph shows a survival assay of repo-Gal4 > UAS-LacZ (Control, grey), repo-Gal4 > UAS-dEGFRλ, UAS-dp110CAAX (Glioma, black), repo-Gal4 > UAS-dp110CAAX, UAS-cry (PI3KCry, blue), repo-Gal4 > UAS-dEGFRλ, UAS-cry, (EGFRCry, red) and repo-Gal4 > UAS-cry, UAS-dmyc (MycCry, green) flies and statistical analysis in n = 90 (Mantel-Cox test) ( n.s. not significant, ** p-value < 0.01, *** p-value < 0.001, p-value < 0.0001).
Ijms 23 02043 g005
Figure 6. Schematic representation of Cry contribution to GB progression. (A) Glia cells are transformed to glioma by the co-activation of PI3K and EGFR pathways. These signals take to the accumulation of Myc in glioma cells mediated by cry expression. In consequence, glioma cells number increases, expand glial membrane and cause a reduction in synapse number of neurons (neurodegeneration). This process triggers premature death and reduced lifespan of the fly. (B) Glioma cells are transformed by PI3K and EGFR pathways activation, but upon cry knockdown (cry RNAi), they do not accumulate Myc, do not display cellular features of glioma and prevent lifespan reduction.
Ijms 23 02043 g006
Table 1. Sequences of primers used to detect cry expression. Rp49 is used as housekeeping gene.
Primer Name5′-3′ Sequence
Rp49 FGCATACAGGCCCAAGATCGT
Rp49 RAACCGATGTTGGGCATCAGA
cry FTTCTTCCCATCAAAACTGG
cry RAAACGCATCCGATTGTAACC
Publisher’s Note: MDPI stays neutral with regard to jurisdictional claims in published maps and institutional affiliations.

