
Plasma Metabolomics Profile of “Insulin Sensitive” Male Hypogonadism after Testosterone Replacement Therapy


Abstract
:1. Introduction
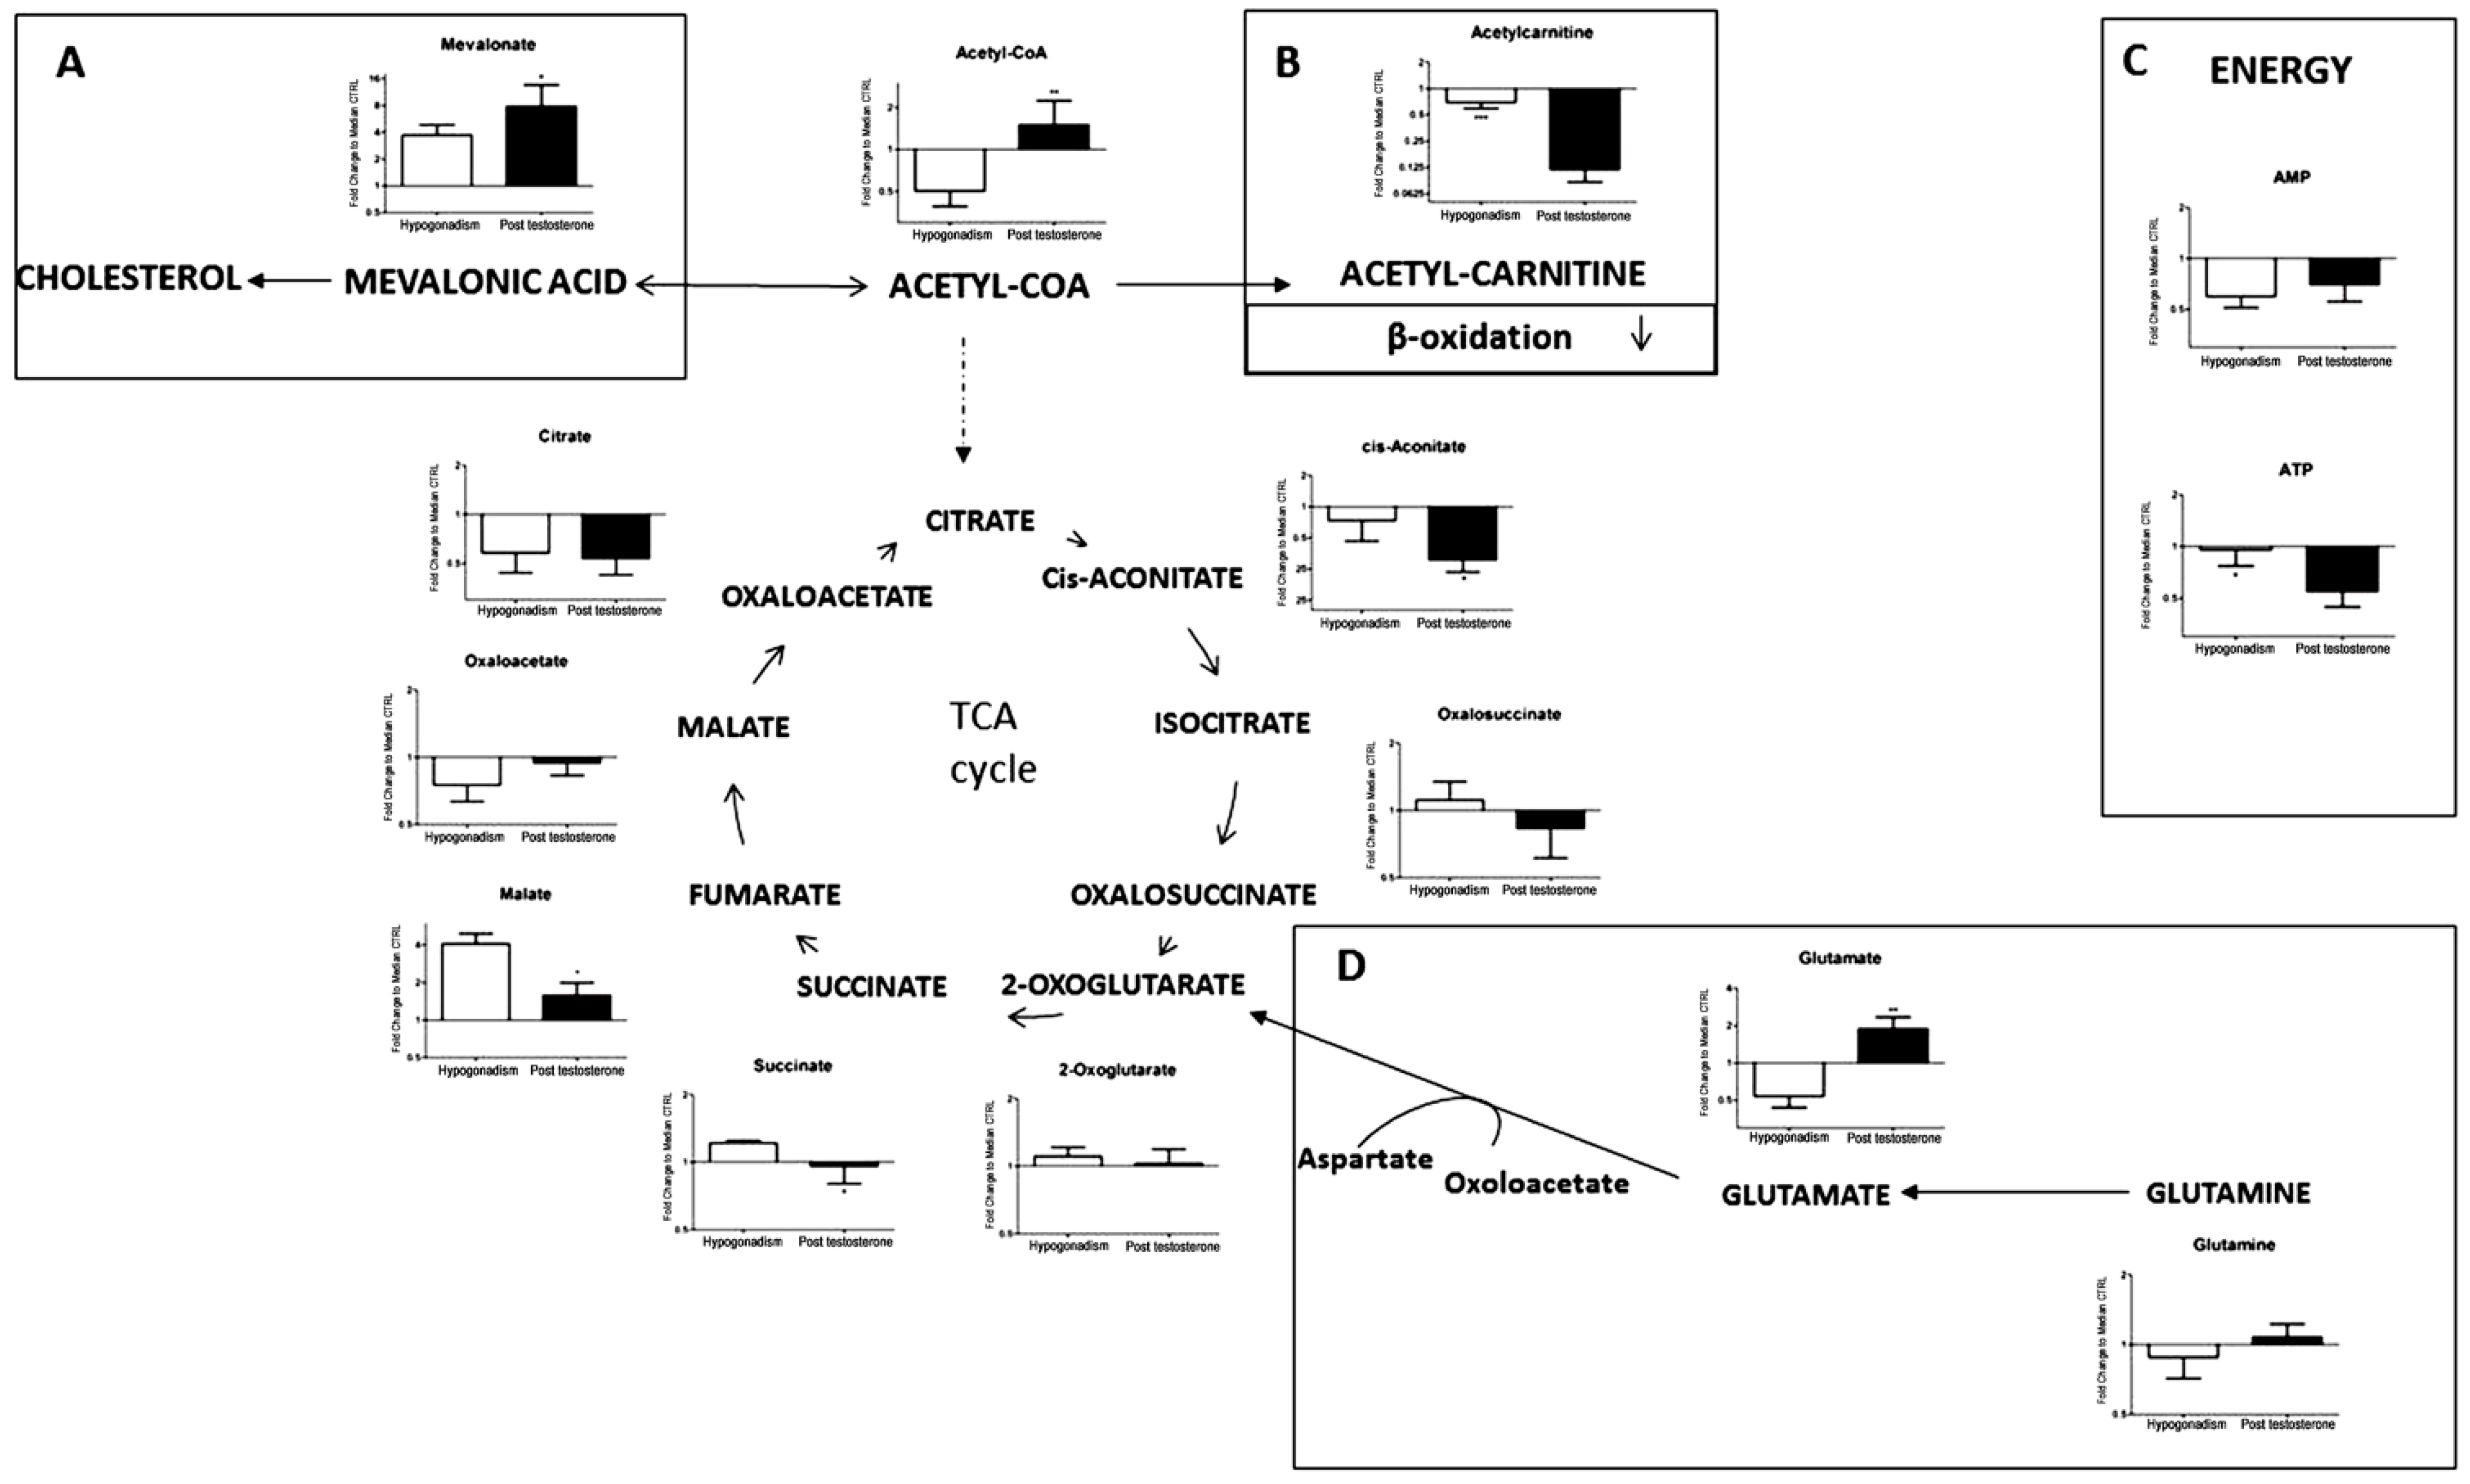
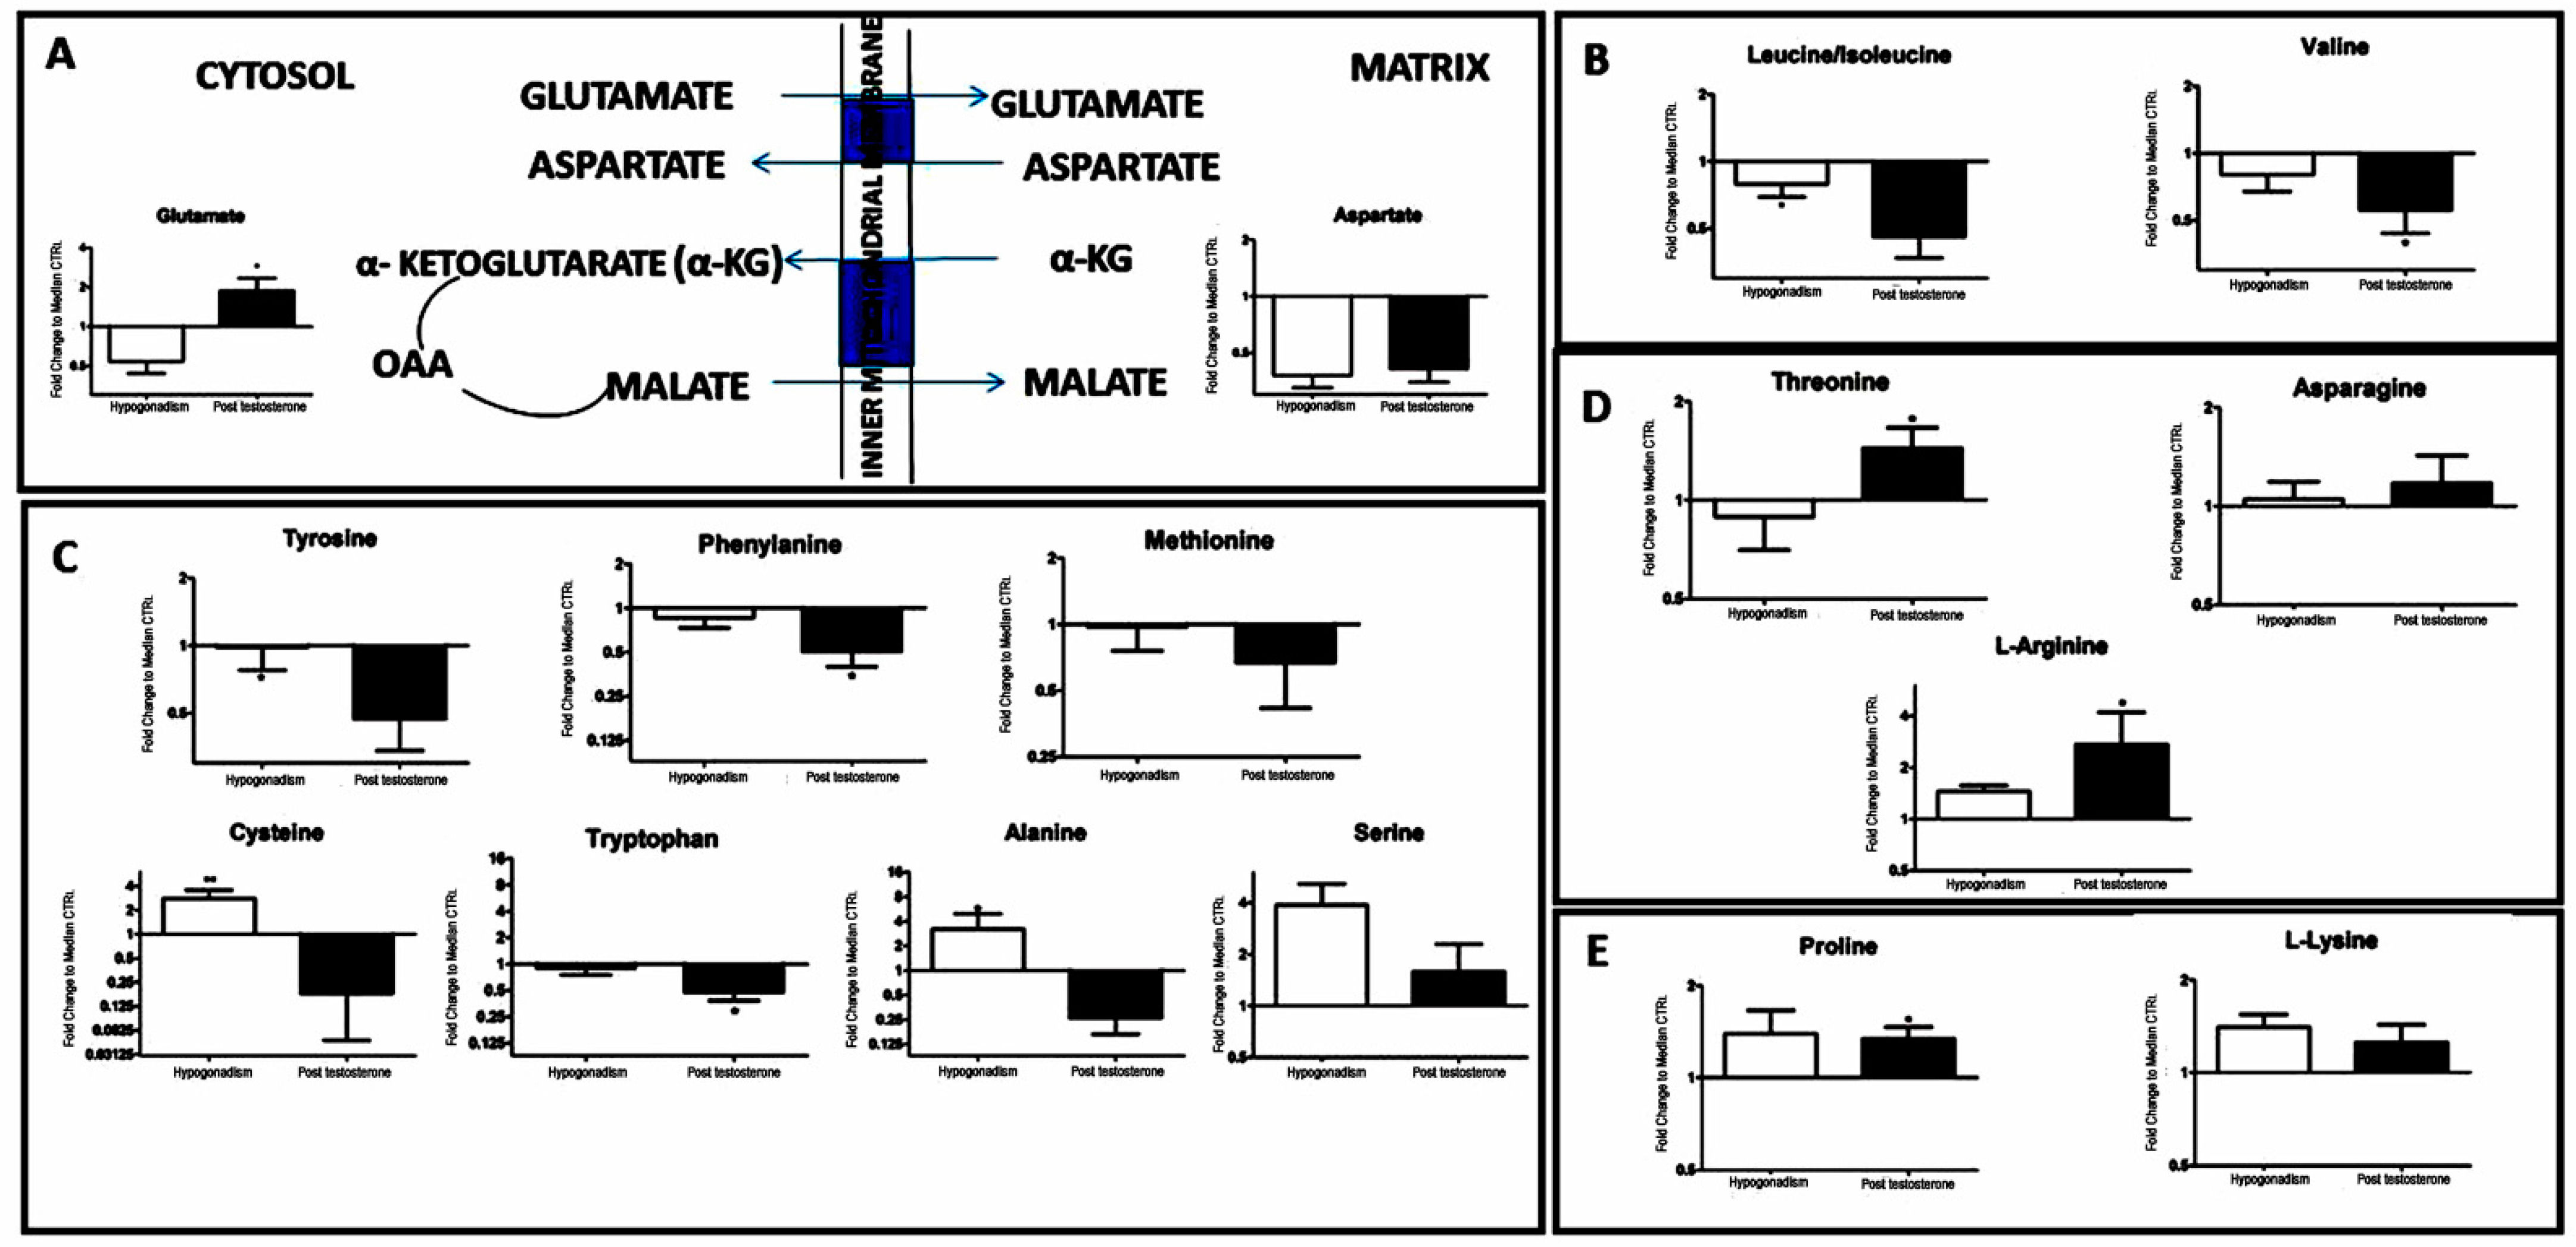
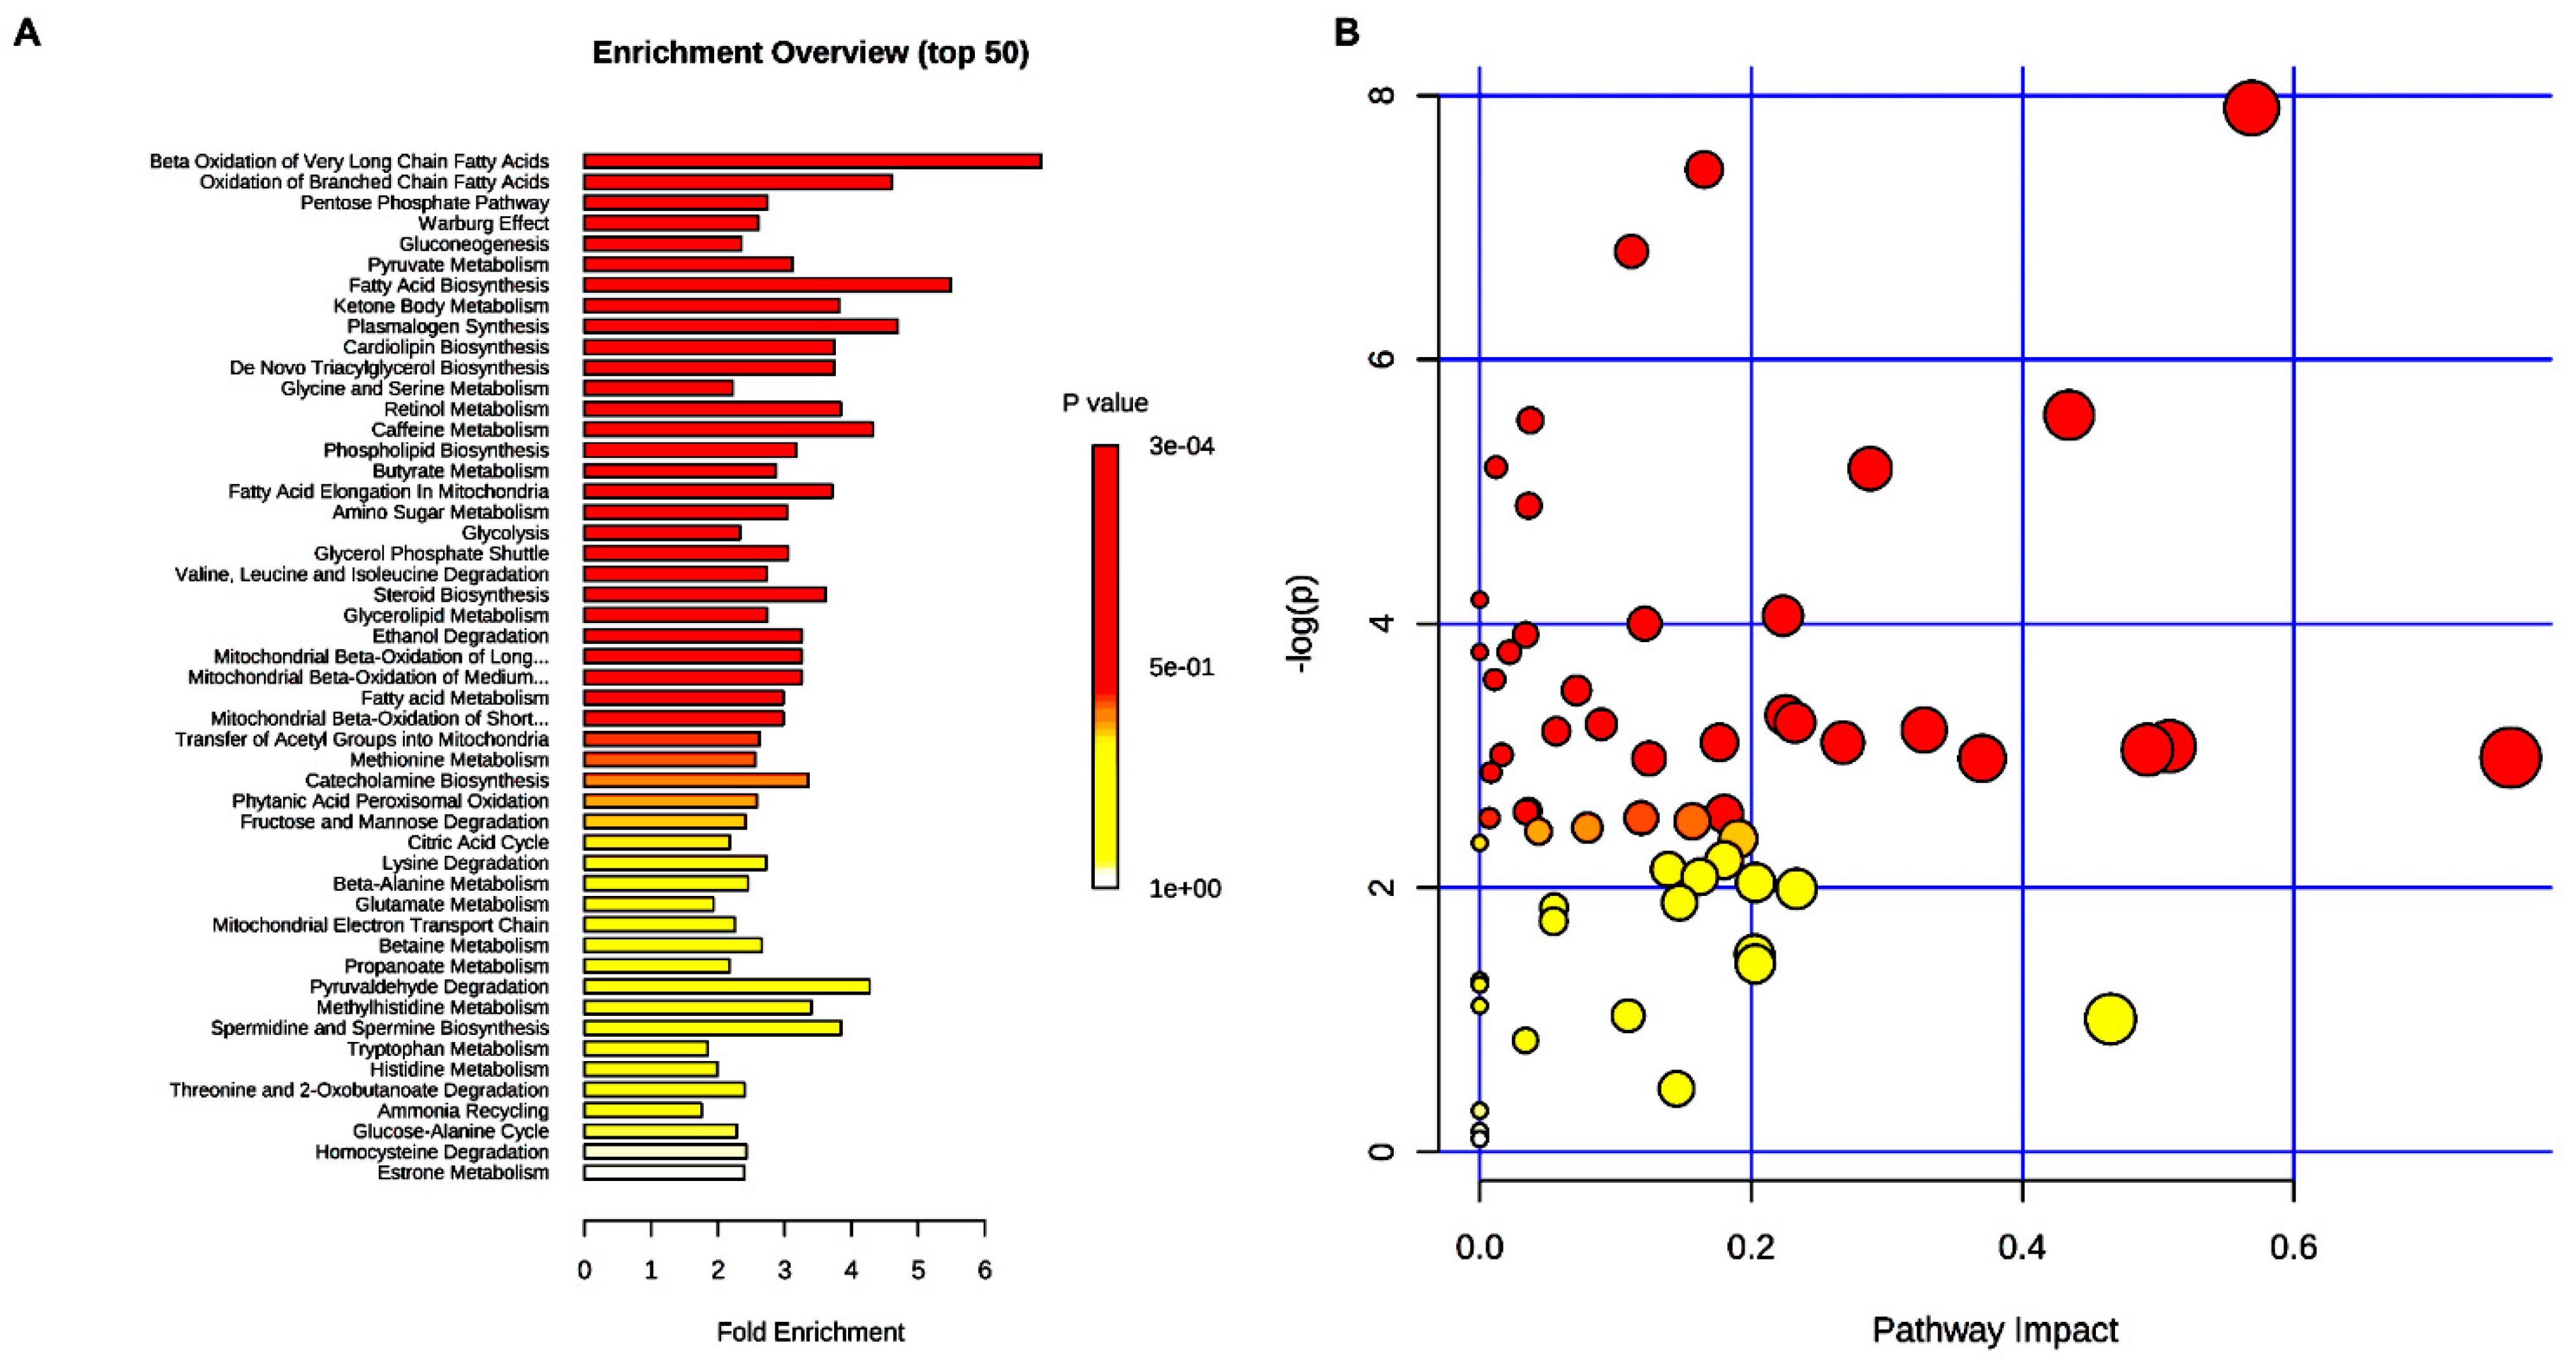
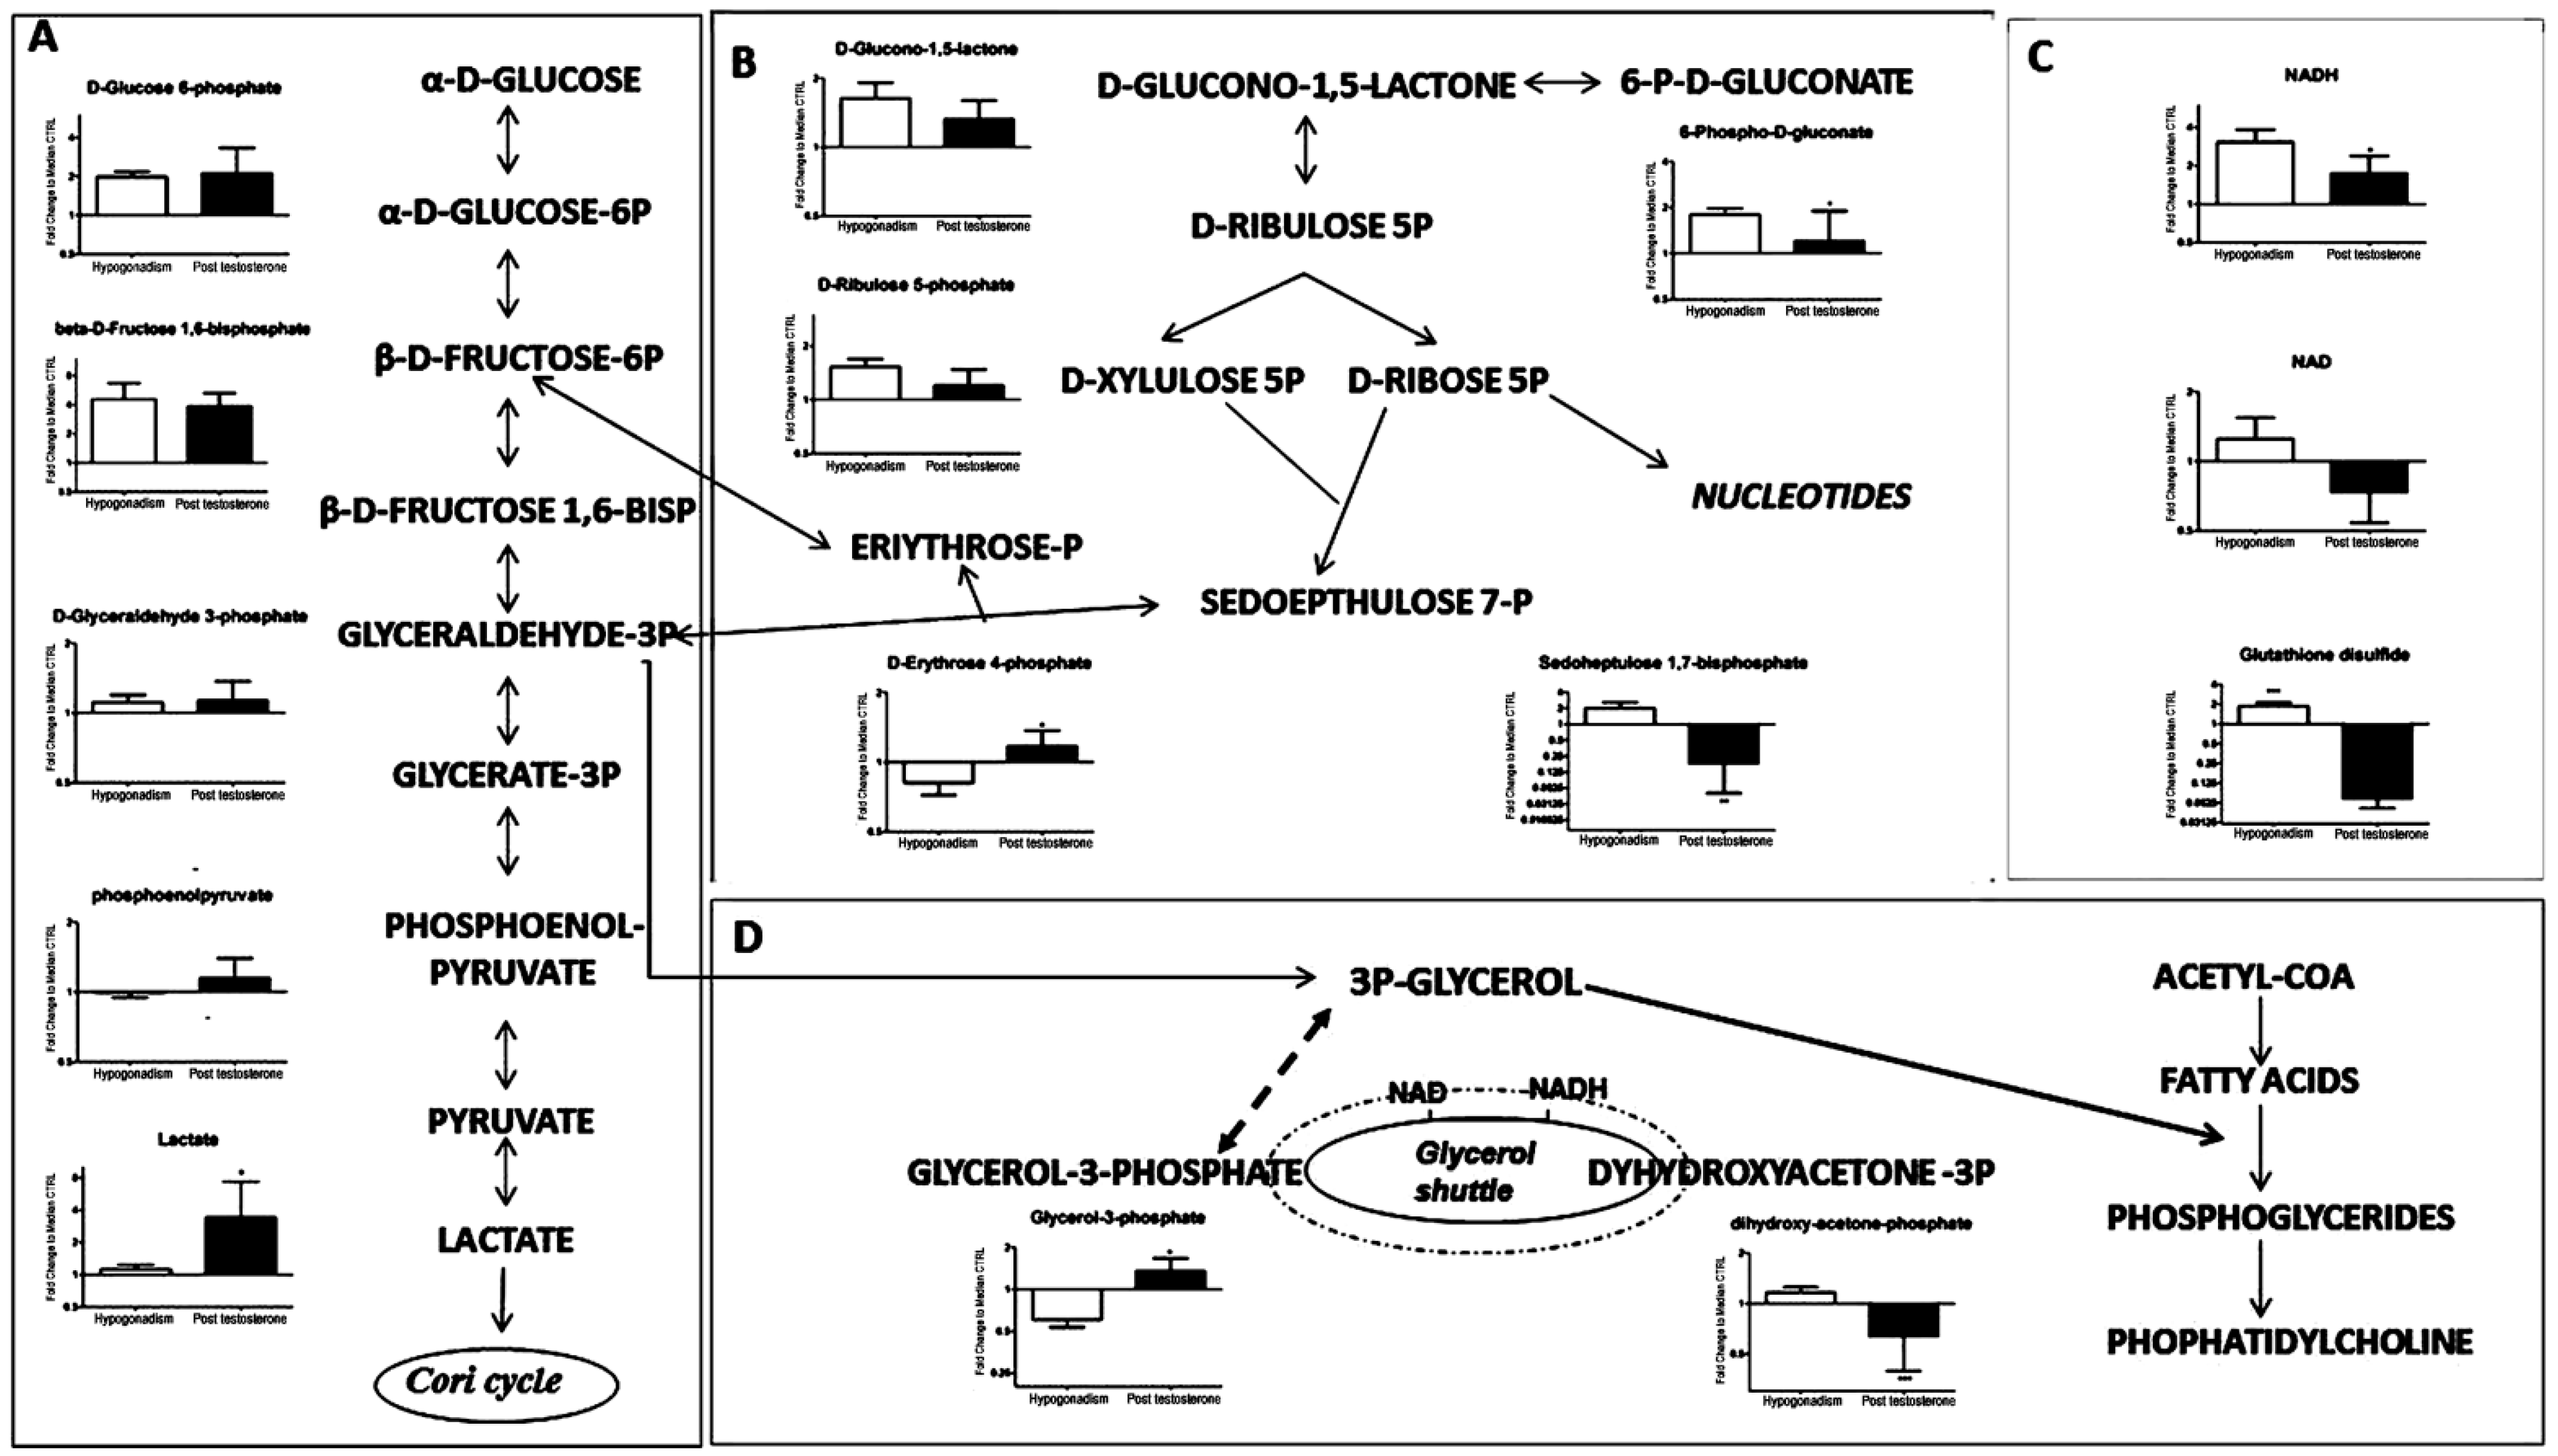
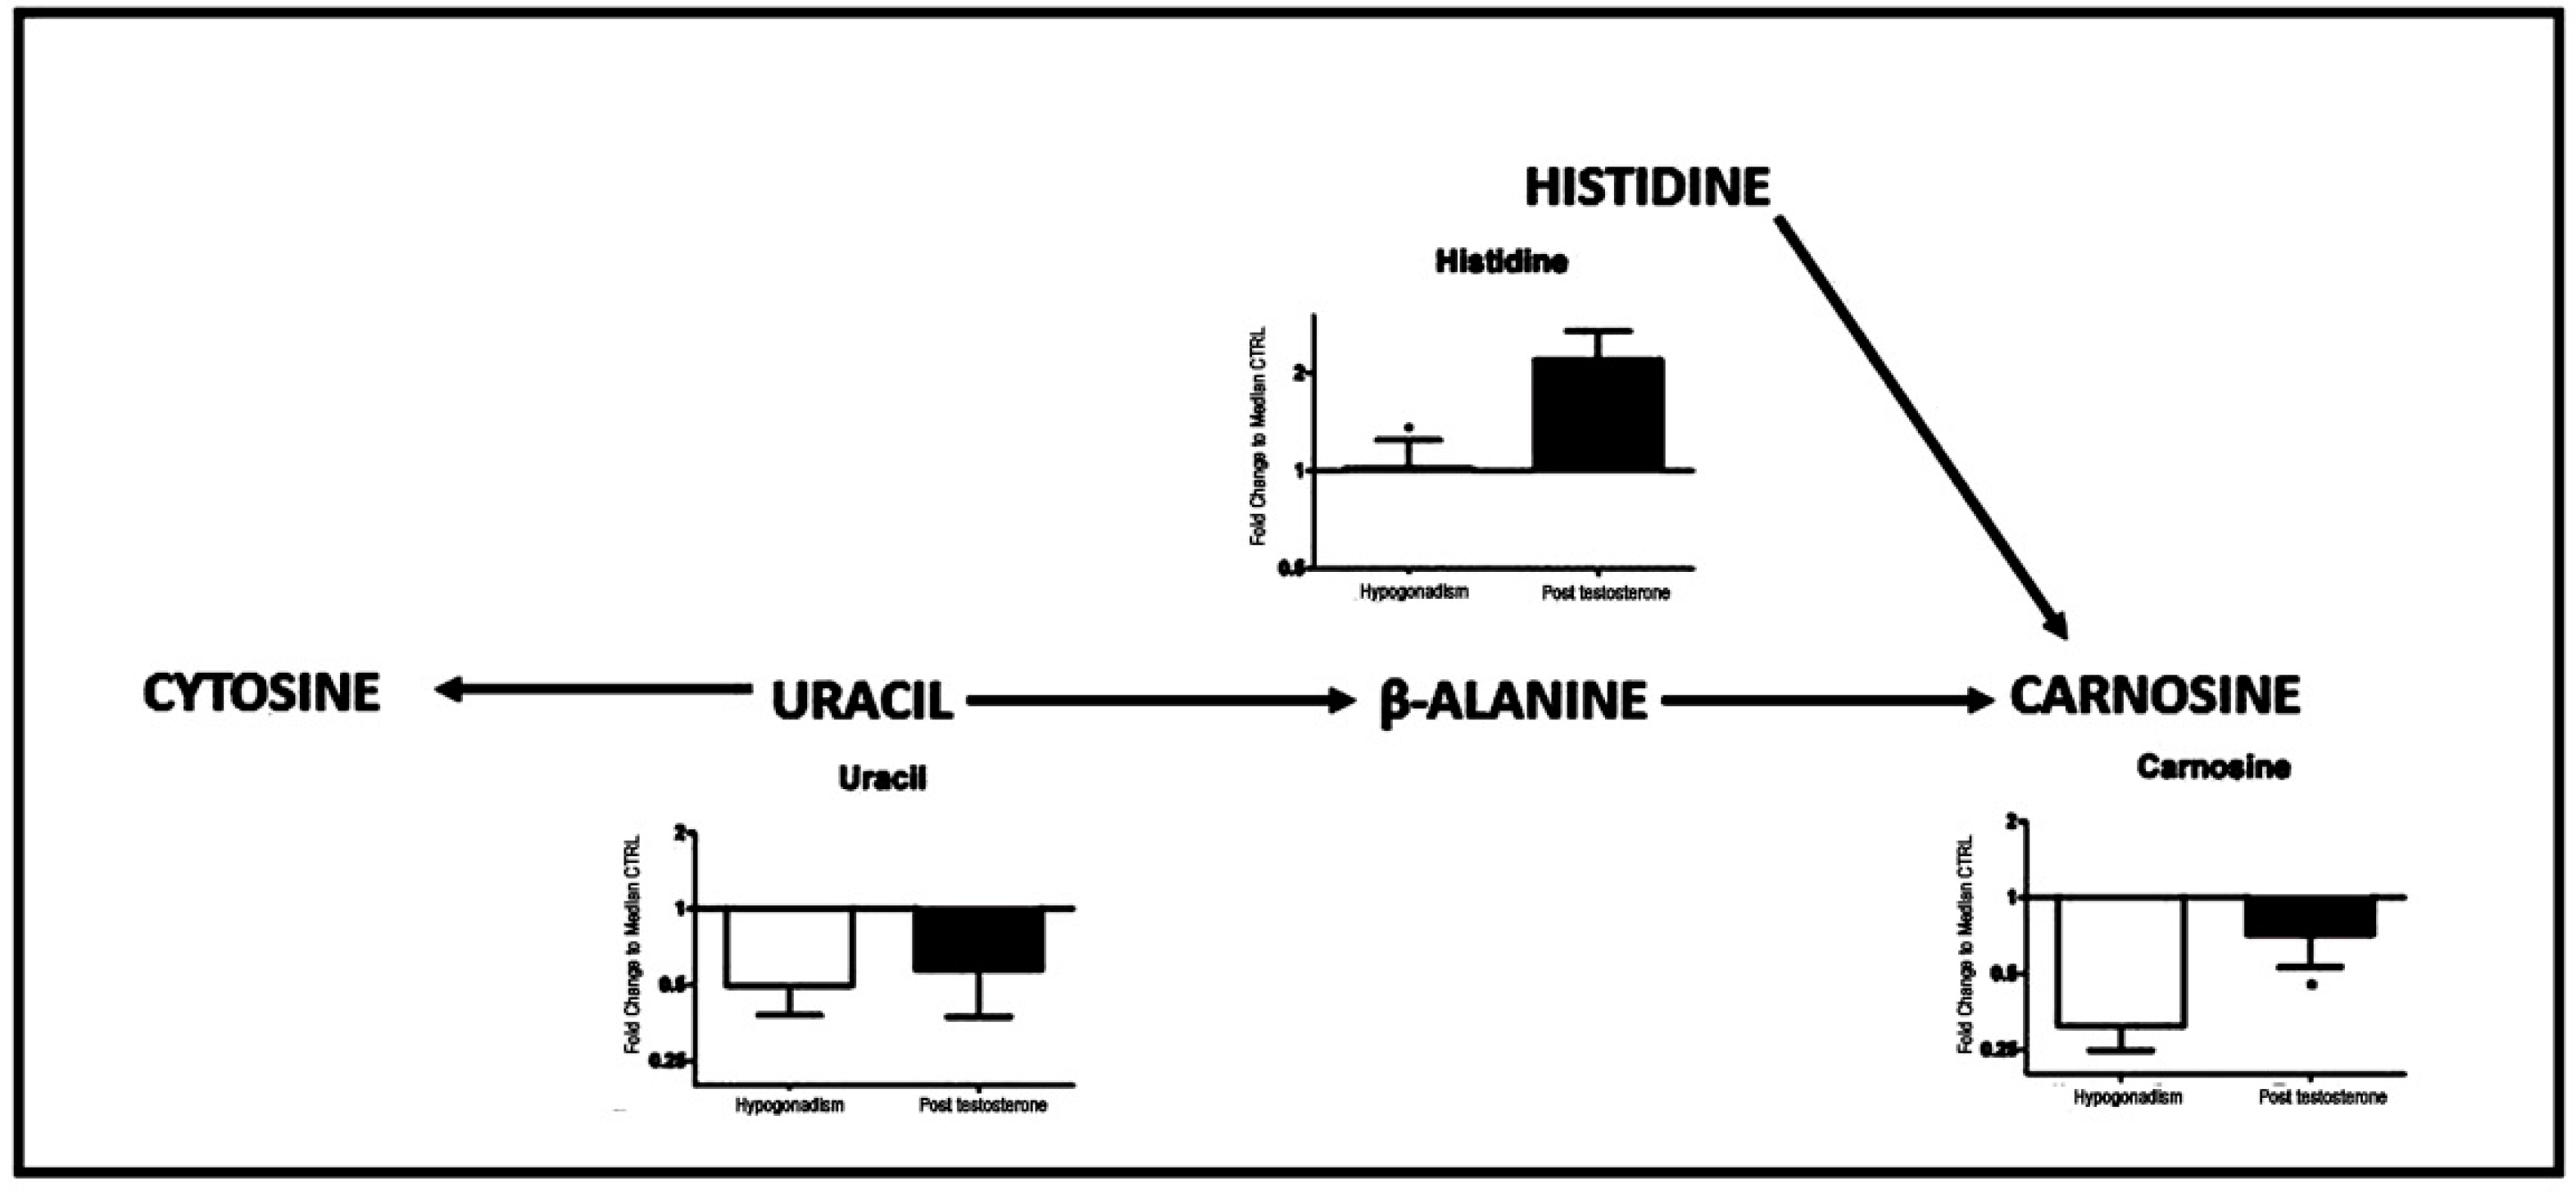
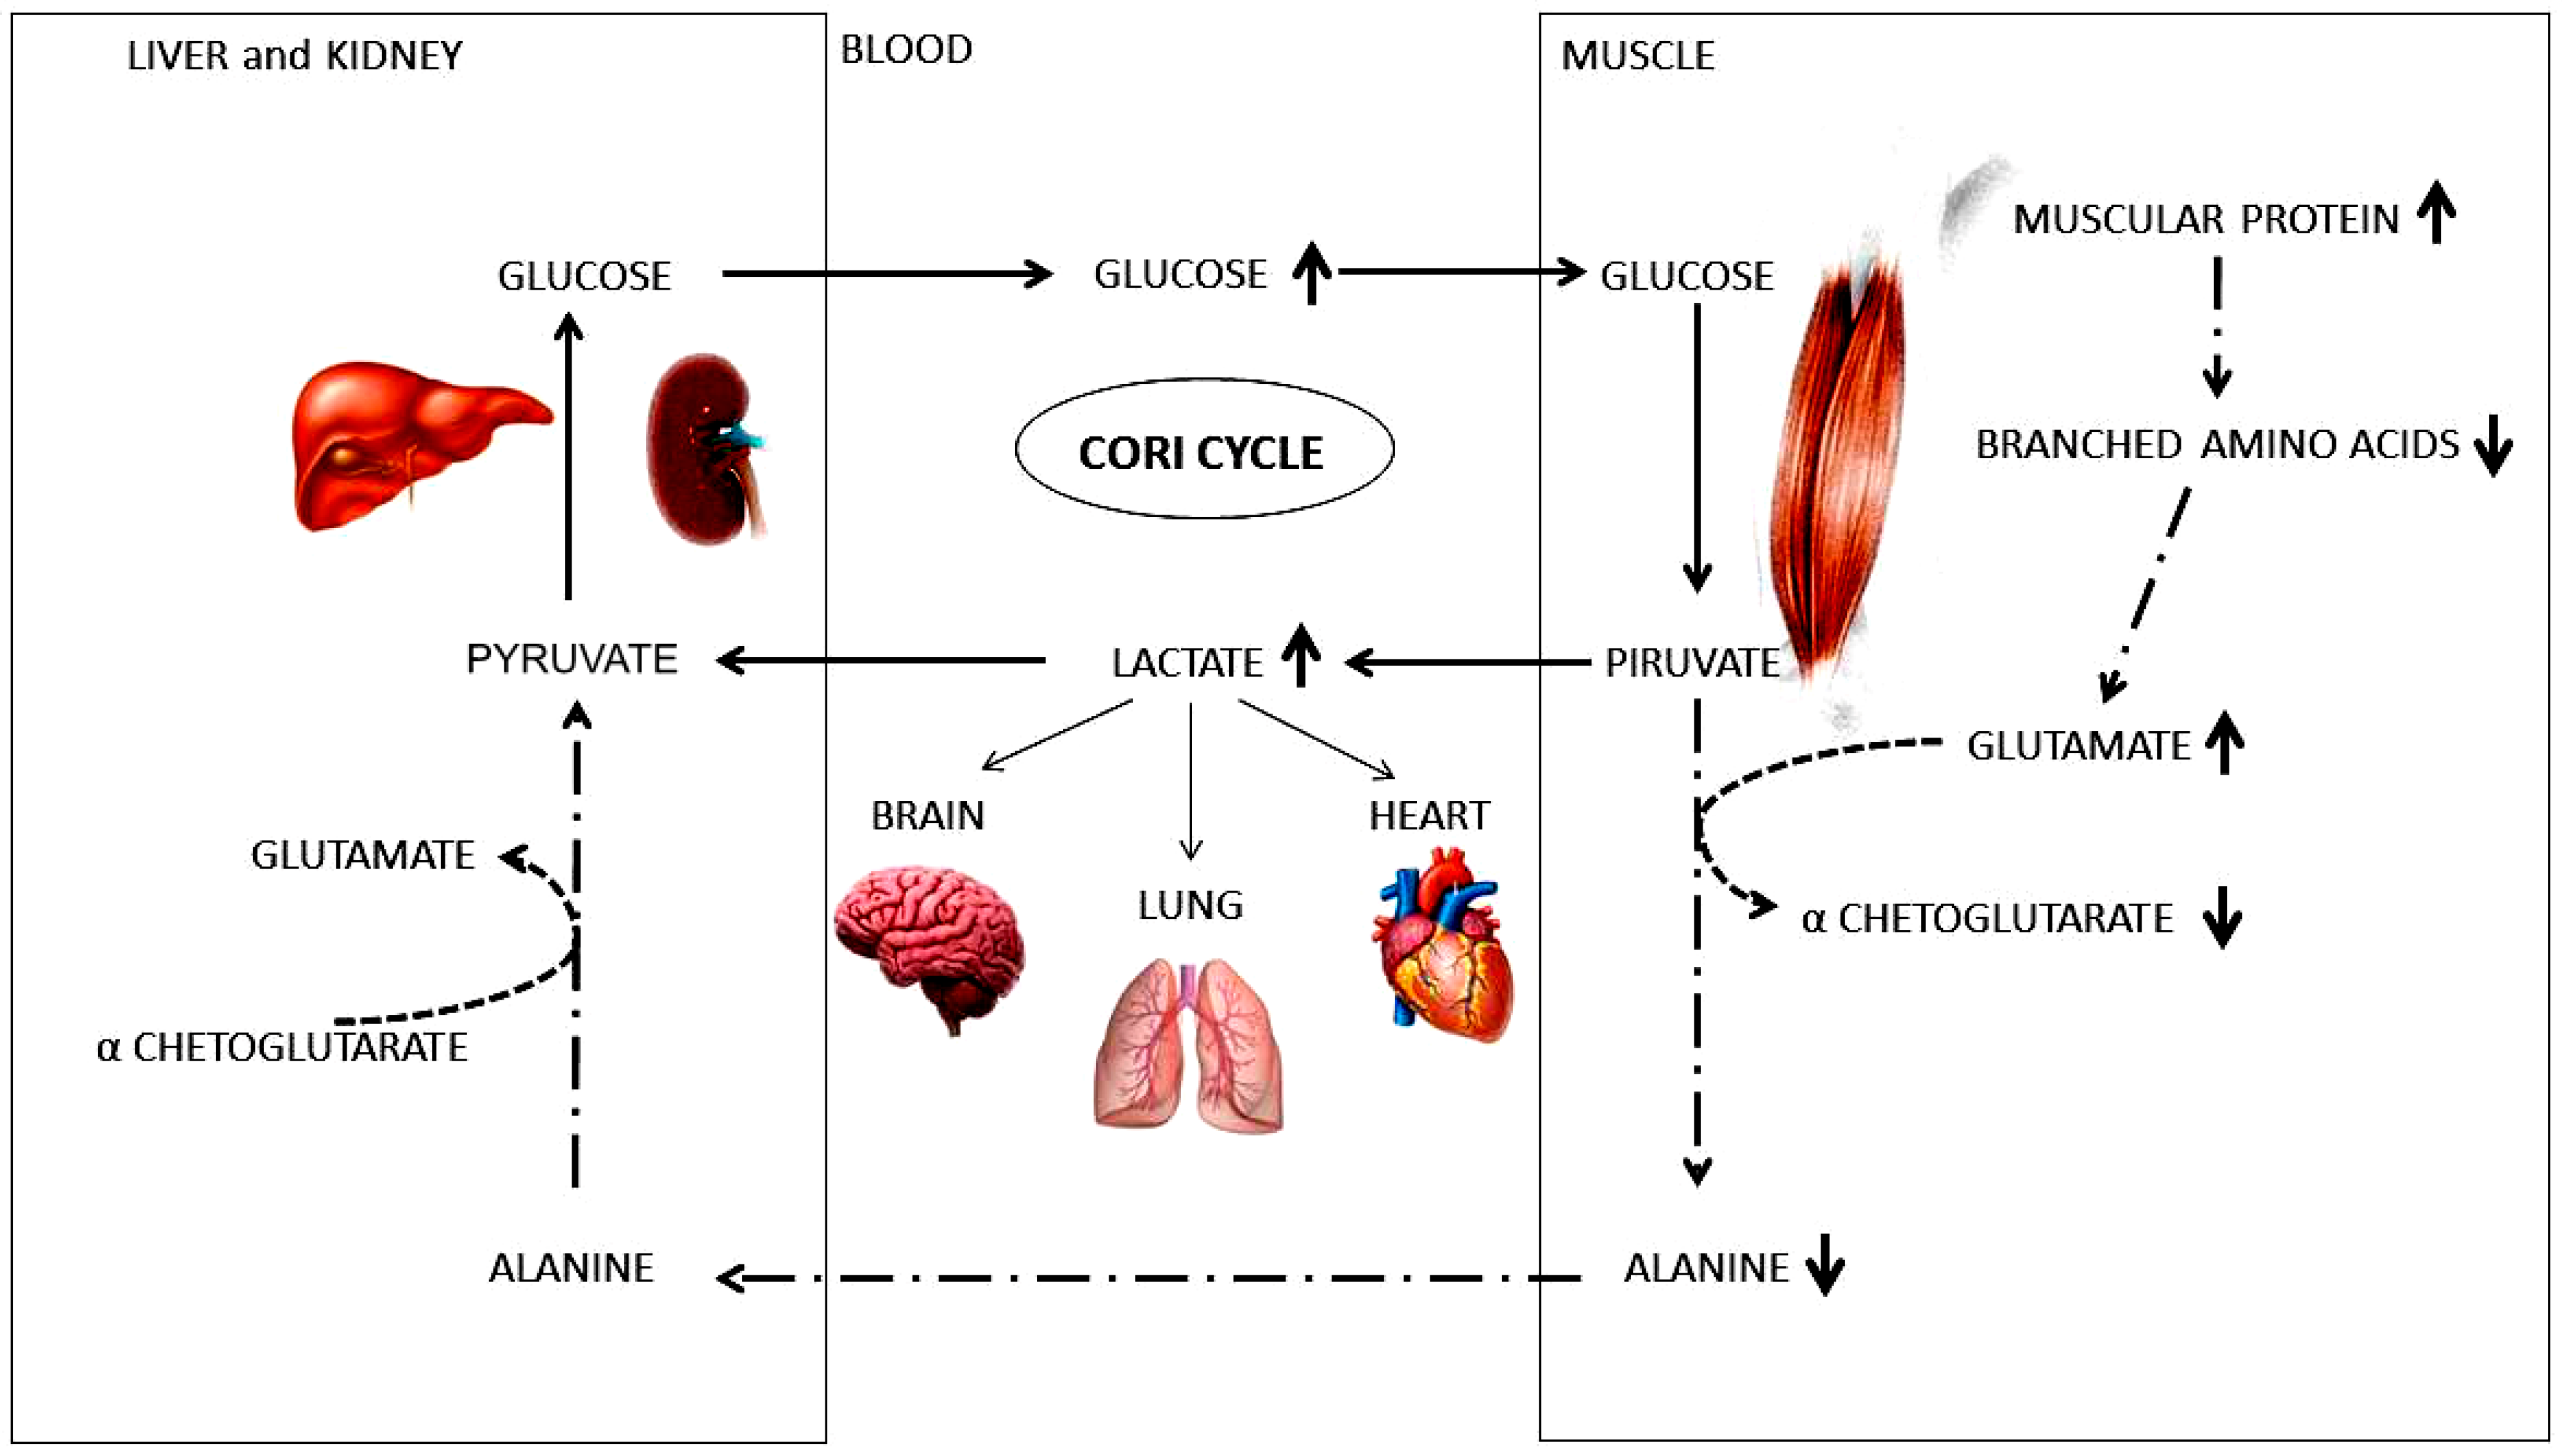
2. Results
3. Discussion
4. Materials and Methods
4.1. Patients Samples: Study Design and Participants
4.2. Study Treatment
4.3. UHPLC-HRMS
4.4. Metabolomic Data Processing and Statistical Analysis
5. Conclusions
6. Patents
Supplementary Materials
Author Contributions
Funding
Institutional Review Board Statement
Informed Consent Statement
Conflicts of Interest
References
- Kelly, D.M.; Akhtar, S.; Sellers, D.J.; Muraleedharan, V.; Channer, K.S.; Jones, T.H. Testosterone differentially regulates targets of lipid and glucose metabolism in liver, muscle and adipose tissues of the testicular feminised mouse. Endocrine 2016, 54, 504–515. [Google Scholar] [CrossRef] [PubMed] [Green Version]
- Traish, A.M.; Haider, A.; Haider, K.S.; Doros, G.; Saad, F. Long-Term Testosterone Therapy Improves Cardiometabolic Function and Reduces Risk of Cardiovascular Disease in Men with Hypogonadism: A Real-Life Observational Registry Study Setting Comparing Treated and Untreated (Control) Groups. J. Cardiovasc. Pharmacol. Ther. 2017, 22, 414–433. [Google Scholar] [CrossRef] [PubMed]
- Traish, A.M.; Haider, A.; Doros, G.; Saad, F. Long-term testosterone therapy in hypogonadal men ameliorates elements of the metabolic syndrome: An observational, long-term registry study. Int. J. Clin. Pract. 2014, 68, 314–329. [Google Scholar] [CrossRef] [PubMed] [Green Version]
- Grossmann, M. Testosterone and glucose metabolism in men: Current concepts and controversies. J. Endocrinol. 2014, 220, R37–R55. [Google Scholar] [CrossRef] [PubMed] [Green Version]
- Fanelli, G.; Gevi, F.; Belardo, A.; Zolla, L. Metabolic patterns in insulin-sensitive male hypogonadism. Cell Death Dis. 2018, 9, 653. [Google Scholar] [CrossRef] [PubMed] [Green Version]
- Gevi, F.; Fanelli, G.; Zolla, L. Metabolic patterns in insulin-resistant male hypogonadism. Cell Death Dis. 2018, 9, 671. [Google Scholar] [CrossRef]
- Morales, A.; Bebb, R.A.; Manjoo, P.; Assimakopoulos, P.; Axler, J.; Collier, C.; Elliott, S.; Goldenberg, L.; Gottesman, I.; Grober, E.D.; et al. Diagnosis and management of testosterone deficiency syndrome in men: Clinical practice guideline. Can. Med. Assoc. J. 2015, 187, 1369–1377. [Google Scholar] [CrossRef] [Green Version]
- Bhasin, S.; Cunningham, G.R.; Hayes, F.J.; Matsumoto, A.M.; Snyder, P.J.; Swerdloff, R.S.; Montori, V.M.; Task Force, E.S. Testosterone therapy in men with androgen deficiency syndromes: An Endocrine Society clinical practice guideline. J. Clin. Endocrinol. Metab. 2010, 95, 2536–2559. [Google Scholar] [CrossRef] [PubMed]
- Morales, A.; Bella, A.J.; Chun, S.; Lee, J.; Assimakopoulos, P.; Bebb, R.; Gottesman, I.; Alarie, P.; Dugré, H.; Elliott, S. A practical guide to diagnosis, management and treatment of testosterone deficiency for Canadian physicians. Can. Urol. Assoc. J. 2010, 4, 269–275. [Google Scholar] [CrossRef] [PubMed] [Green Version]
- Saad, F.; Haider, A.; Doros, G.; Traish, A. Long-term treatment of hypogonadal men with testosterone produces substantial and sustained weight loss. Obesity 2013, 21, 1975–1981. [Google Scholar] [CrossRef] [PubMed]
- Nicholson, J.K.; Lindon, J.C. Systems biology: Metabonomics. Nature 2008, 455, 1054–1056. [Google Scholar] [CrossRef] [PubMed]
- Monnerat, G.; Seara, F.A.C.; Evaristo, J.A.M.; Carneiro, G.; Evaristo, G.P.C.; Domont, G.; Nascimento, J.H.M.; Mill, J.G.; Nogueira, F.C.S.; de Carvalho, A.C.C. Aging-related compensated hypogonadism: Role of metabolomic analysis in physiopathological and therapeutic evaluation. J. Steroid Biochem. Mol. Biol. 2018, 183, 39–50. [Google Scholar] [CrossRef]
- Fanelli, G.; Belardo, A.; Savino, R.; Rinalducci, S.; Zolla, L. Testosterone replacement therapy in insulin-sensitive hypogonadal men restores phosphatidylcholine levels by regulation of arachidonic acid metabolism. J. Cell. Mol. Med. 2020, 24, 8266–8269. [Google Scholar] [CrossRef]
- Elliott, J.; Kelly, S.E.; Millar, A.C.; Peterson, J.; Chen, L.; Johnston, A.; Kotb, A.; Skidmore, B.; Bai, Z.; Mamdani, M.; et al. Testosterone therapy in hypogonadal men: A systematic review and network meta-analysis. BMJ Open 2017, 7, e015284. [Google Scholar] [CrossRef] [PubMed]
- Hwang, K.; Miner, M. Controversies in testosterone replacement therapy: Testosterone and cardiovascular disease. Asian J. Androl. 2015, 17, 187–191. [Google Scholar] [CrossRef]
- Shabsigh, R. Testosterone therapy in erectile dysfunction and hypogonadism. J. Sex. Med. 2005, 2, 785–792. [Google Scholar] [CrossRef] [PubMed]
- Mancini, A.; Leone, E.; Festa, R.; Grande, G.; Silvestrini, A.; de Marinis, L.; Pontecorvi, A.; Maira, G.; Littarru, G.P.; Meucci, E. Effects of testosterone on antioxidant systems in male secondary hypogonadism. J. Androl. 2008, 29, 622–629. [Google Scholar] [CrossRef] [PubMed] [Green Version]
- Chen, X.; Li, X.; Huang, H.-Y.; Li, X.; Lin, J.-F. Effects of testosterone on insulin receptor substrate-1 and glucose transporter 4 expression in cells sensitive to insulin. Zhonghua Yi Xue Za Zhi 2006, 86, 1474–1477. [Google Scholar] [PubMed]
- Muthusamy, T.; Murugesan, P.; Balasubramanian, K. Sex steroids deficiency impairs glucose transporter 4 expression and its translocation through defective Akt phosphorylation in target tissues of adult male rat. Metabolism 2009, 58, 1581–1592. [Google Scholar] [CrossRef] [PubMed]
- Sato, K.; Iemitsu, M.; Aizawa, K.; Ajisaka, R. Testosterone and DHEA activate the glucose metabolism-related signaling pathway in skeletal muscle. Am. J. Physiol. Endocrinol. Metab. 2008, 294, E961–E968. [Google Scholar] [CrossRef] [Green Version]
- Burns, J.S.; Manda, G. Metabolic Pathways of the Warburg Effect in Health and Disease: Perspectives of Choice, Chain or Chance. Int. J. Mol. Sci. 2017, 18, 2755. [Google Scholar] [CrossRef] [PubMed] [Green Version]
- Chen, C.-C.; Chen, C.-W.; Lin, P.-H.; Chou, J.-C.; Weng, T.-C.; Jian, C.-Y.; Hu, S.; Lai, W.-H.; Lieu, F.-K.; Wang, S.-W.; et al. Interactive Effect of Corticosterone and Lactate on Regulation of Testosterone Production in Rat Leydig Cells. J. Cell. Physiol. 2017, 232, 2135–2144. [Google Scholar] [CrossRef] [PubMed]
- Garcia-Alvarez, M.; Marik, P.; Bellomo, R. Stress hyperlactataemia: Present understanding and controversy. Lancet Diabetes Endocrinol. 2014, 2, 339–347. [Google Scholar] [CrossRef]
- Enoki, T.; Yoshida, Y.; Lally, J.; Hatta, H.; Bonen, A. Testosterone increases lactate transport, monocarboxylate transporter (MCT) 1 and MCT4 in rat skeletal muscle. J. Physiol. 2006, 577, 433–443. [Google Scholar] [CrossRef] [PubMed]
- Haddad, R.M.; Kennedy, C.C.; Caples, S.M.; Tracz, M.J.; Bolona, E.R.; Sideras, K.; Uraga, M.V.; Erwin, P.J.; Montori, V.M. Testosterone and cardiovascular risk in men: A systematic review and meta-analysis of randomized placebo-controlled trials. Mayo Clin. Proc. 2007, 82, 29–39. [Google Scholar] [CrossRef]
- Zaima, N.; Kinoshita, S.; Hieda, N.; Kugo, H.; Narisawa, K.; Yamamoto, A.; Yanagimoto, K.; Moriyama, T. Effect of dietary fish oil on mouse testosterone level and the distribution of eicosapentaenoic acid-containing phosphatidylcholine in testicular interstitium. Biochem. Biophys. Rep. 2016, 7, 259–265. [Google Scholar] [CrossRef] [Green Version]
- Fukami, K.; Yamagishi, S.-I.; Sakai, K.; Kaida, Y.; Minami, A.; Nakayama, Y.; Ando, R.; Obara, N.; Ueda, S.; Wada, Y.; et al. Carnitine deficiency is associated with late-onset hypogonadism and depression in uremic men with hemodialysis. Aging Male 2014, 17, 238–242. [Google Scholar] [CrossRef] [PubMed]
- Rezaei, N.; Mardanshahi, T.; Shafaroudi, M.M.; Abedian, S.; Mohammadi, H.; Zare, Z. Effects of l-Carnitine on the Follicle-Stimulating Hormone, Luteinizing Hormone, Testosterone, and Testicular Tissue Oxidative Stress Levels in Streptozotocin-Induced Diabetic Rats. J. Evid.-Based Integr. Med. 2018, 23, 2515690X18796053. [Google Scholar] [CrossRef] [Green Version]
- Cavallini, G.; Caracciolo, S.; Vitali, G.; Modenini, F.; Biagiotti, G. Carnitine versus androgen administration in the treatment of sexual dysfunction, depressed mood, and fatigue associated with male aging. Urology 2004, 63, 641–646. [Google Scholar] [CrossRef]
- Petersson, S.J.; Christensen, L.L.; Kristensen, J.M.; Kruse, R.; Andersen, M.; Højlund, K. Effect of testosterone on markers of mitochondrial oxidative phosphorylation and lipid metabolism in muscle of aging men with subnormal bioavailable testosterone. Eur. J. Endocrinol. 2014, 171, 77–88. [Google Scholar] [CrossRef] [PubMed]
- D’Alessandro, A.; Zolla, L. Proteomics and metabolomics in cancer drug development. Expert Rev. Proteom. 2013, 10, 473–488. [Google Scholar] [CrossRef]
- Kvamme, E.; Svenneby, G. Effect of anaerobiosis and addition of keto acids on glutamine utilization by Ehrlich ascites-tumor cells. Biochim. Biophys. Acta 1960, 42, 187–188. [Google Scholar] [CrossRef]
- Li, J.; Song, P.; Zhu, L.; Aziz, N.; Zhou, Q.; Zhang, Y.; Xu, W.; Feng, L.; Chen, D.; Wang, X.; et al. Synthetic lethality of glutaminolysis inhibition, autophagy inactivation and asparagine depletion in colon cancer. Oncotarget 2017, 8, 42664–42672. [Google Scholar] [CrossRef] [PubMed] [Green Version]
- Gao, Z.Y.; Li, G.; Najafi, H.; Wolf, B.A.; Matschinsky, F.M. Glucose regulation of glutaminolysis and its role in insulin secretion. Diabetes 1999, 48, 1535–1542. [Google Scholar] [CrossRef] [PubMed]
- Ponce, O.J.; Spencer-Bonilla, G.; Alvarez-Villalobos, N.; Serrano, V.; Singh-Ospina, N.; Rodríguez-Gutiérrez, R.; Salcido-Montenegro, A.; Benkhadra, R.; Prokop, L.J.; Bhasin, S.; et al. The efficacy and adverse events of testosterone replacement therapy in hypogonadal men: A systematic review and meta-analysis of randomized, placebo-controlled trials. J. Clin. Endocrinol. Metab. 2018, 103, 1745–1754. [Google Scholar] [CrossRef]
- D’Antona, G.; Ragni, M.; Cardile, A.; Tedesco, L.; Dossena, M.; Bruttini, F.; Caliaro, F.; Corsetti, G.; Bottinelli, R.; Carruba, M.O.; et al. Branched-chain amino acid supplementation promotes survival and supports cardiac and skeletal muscle mitochondrial biogenesis in middle-aged mice. Cell Metab. 2010, 12, 362–372. [Google Scholar] [CrossRef] [Green Version]
- López-Lluch, G.; Irusta, P.M.; Navas, P.; de Cabo, R. Mitochondrial biogenesis and healthy aging. Exp. Gerontol. 2008, 43, 813–819. [Google Scholar] [CrossRef] [PubMed] [Green Version]
- Sheffield-Moore, M. Androgens and the control of skeletal muscle protein synthesis. Ann. Med. 2000, 32, 181–186. [Google Scholar] [CrossRef]
- Peñafiel, R.; Ruzafa, C.; Monserrat, F.; Cremades, A. Gender-related differences in carnosine, anserine and lysine content of murine skeletal muscle. Amino Acids 2003, 26, 53–58. [Google Scholar] [CrossRef] [PubMed]
- Tenover, J.S. Effects of testosterone supplementation in the aging male. J. Clin. Endocrinol. Metab. 1992, 75, 1092–1098. [Google Scholar]


| Control (A) | Hypogonadic IS (B) | IS after TRT (C) | p-Value | Tukey HSD p-Value | |
|---|---|---|---|---|---|
| Subjects | n-20 | n-20 | n-20 | - | - |
| Age | 42.54 ± 13.67 | 42.18 ± 16.01 | 42.18 ± 16.01 | - | - |
| BMI (Kg/m2) | 24.91 ± 4.01 | 25.44 ± 3.04 | 25.24 ± 3.09 | 0.93 | - |
| Testosterone (nmol/L) | 20.02 ± 7.47 | 6.35 ± 4.35 | 19.20 ± 9.10 | 0.0001 *** p | (A vs B) 0.001 ** p (B vs C) 0.001 ** p |
| Glucose (mg/100 mL) | 84.72 ± 4.38 | 81.45 ± 12.51 | 86.90 ± 6.77 | 0.3 | - |
| Insuline (mUI/L) | 7.77 ± 3.13 | 6.72 ± 2.88 | 6.99 ± 2.98 | 0.69 | - |
| HOMAi | 1.79 ± 0.86 | 1.97 ± 0.67 | 1.47 ± 0.70 | 0.92 | - |
| Tg (mmol/L) | 96.36 ± 51.39 | 117.90 ± 62.73 | 125.54 ± 63.18 | 0.5 | - |
| Cholesterol (mmol/L) | 196.72 ± 29.18 | 212.81 ± 42.6 | 210.18 ± 53.18 | 0.6 | - |
| HDL Cholesterol (mmol/L) | 53.90 ± 11.98 | 52.63 ± 15.01 | 47.45 ± 15.47 | 0.54 | - |
| LDL Cholesterol (mmol/L) | 133.45 ± 33.07 | 136.36 ± 38.74 | 127.36 ± 44.31 | 0.85 | - |
| Molecule | M.W. | Hypog. (%) | Post Testost. (%) |
|---|---|---|---|
| D-Glucose 6-Phosphate (260.14) | 260.14 | 100 | 105 |
| beta-D-Fructose 1,6-bisphosphate (340.114) | 340.114 | 350 | 300 |
| D-Glyceraldehyde 3-phosphate (170.06) | 170.06 | 5 | 10 |
| Phosphoenolpyruvate (168.04) | 168.04 | −1 | 20 |
| Lactate (90.08) | 90.08 | 10 | 280 |
| D-Glucono-1,5-lactone (178.14) | 178.14 | 70 | 30 |
| D-Ribulose 5-phosphate (230.11) | 230.11 | 60 | 15 |
| D-Erythrose 4-phosphate (200.084) | 200.084 | −20 | −98.9 |
| 6-P-D-Gluconate (276.135) | 276.135 | 90 | 10 |
| Sedoheptulose 1,7-bisphosphate (370.14) | 370.14 | 100 | −75 |
| NADH (663.43) | 663.43 | 280 | 80 |
| NAD (663.43) | 663.43 | 10 | −20 |
| Glutathione disulfide (610.6) | 610.6 | 98 | −90 |
| Glycerol-3-Phosphate (172.074) | 172.074 | −40 | 20 |
| Dyhydroxyacetone-3P (170.06) | 170.06 | 5 | −30 |
| Mevalonate (148.16) | 148.16 | 290 | 700 |
| Acetyl-CoA (809.57) | 809.57 | −48 | 20 |
| Acetyl-carnitine (203.236) | 203.236 | −20 | −90 |
| Citrate (192.124) | 192.124 | −99.6 | −99.55 |
| Oxaloacetate (132.07) | 132.07 | −18 | −1 |
| Malate (134.0874) | 134.0874 | 300 | 25 |
| Succinate (118.09) | 118.09 | 10 | −5 |
| 2-oxoglutarato (146.11) | 146.11 | 4 | 1 |
| Oxalosuccinate (190.11) | 190.11 | 5 | −15 |
| cis-Aconitate (174.108) | 174.108 | −20 | −100 |
| Glutamate (147.13) | 147.13 | −48 | 90 |
| Glutamine (146.14) | 146.14 | −5 | 2 |
| AMP (347.2212) | 347.2212 | −40 | −20 |
| ATP (507.18) | 507.18 | −1 | −60 |
| Aspartate (133.11) | 133.11 | -60 | −55 |
| Leucine/isoleucine (131.17) | 131.17 | −15 | −47 |
| Valine (117.15) | 117.15 | −15 | −40 |
| Tyrosine (181.19) | 181.19 | −1 | −48 |
| Phenylanine (165.19) | 165.19 | −5 | −48 |
| Cysteine (121.16) | 121.16 | 200 | −85 |
| Tryptophan (204.23) | 204.23 | −2 | −50 |
| Methionine (149.21) | 149.21 | −1 | −25 |
| Alanine (89.09) | 89.09 | 280 | −55 |
| Serine (105.09) | 105.09 | 299 | 60 |
| Threonine (119.1192) | 119.1192 | −5 | 50 |
| Asparagine (132.12) | 132.12 | −97 | −90 |
| L-Arginine (174.2) | 174.2 | 60 | 200 |
| Proline (115.13) | 115.13 | 50 | 47 |
| L-Lysine (146.19) | 146.19 | 50 | 25 |
| Histidine (155.1546) | 155.1546 | −99 | 110 |
| Uracil (112.09) | 112.09 | −48 | −40 |
| Carnosine (226.3) | 226.3 | −55 | −18 |
Publisher’s Note: MDPI stays neutral with regard to jurisdictional claims in published maps and institutional affiliations. |
© 2022 by the authors. Licensee MDPI, Basel, Switzerland. This article is an open access article distributed under the terms and conditions of the Creative Commons Attribution (CC BY) license (https://creativecommons.org/licenses/by/4.0/).
Share and Cite
Zolla, L.; Ceci, M. Plasma Metabolomics Profile of “Insulin Sensitive” Male Hypogonadism after Testosterone Replacement Therapy. Int. J. Mol. Sci. 2022, 23, 1916. https://doi.org/10.3390/ijms23031916
Zolla L, Ceci M. Plasma Metabolomics Profile of “Insulin Sensitive” Male Hypogonadism after Testosterone Replacement Therapy. International Journal of Molecular Sciences. 2022; 23(3):1916. https://doi.org/10.3390/ijms23031916
Chicago/Turabian StyleZolla, Lello, and Marcello Ceci. 2022. "Plasma Metabolomics Profile of “Insulin Sensitive” Male Hypogonadism after Testosterone Replacement Therapy" International Journal of Molecular Sciences 23, no. 3: 1916. https://doi.org/10.3390/ijms23031916
APA StyleZolla, L., & Ceci, M. (2022). Plasma Metabolomics Profile of “Insulin Sensitive” Male Hypogonadism after Testosterone Replacement Therapy. International Journal of Molecular Sciences, 23(3), 1916. https://doi.org/10.3390/ijms23031916