
Developing a Mathematical Model of Intracellular Calcium Dynamics for Evaluating Combined Anticancer Effects of Afatinib and RP4010 in Esophageal Cancer


 ,
, 
 and
and 
Abstract
:1. Introduction
2. Results
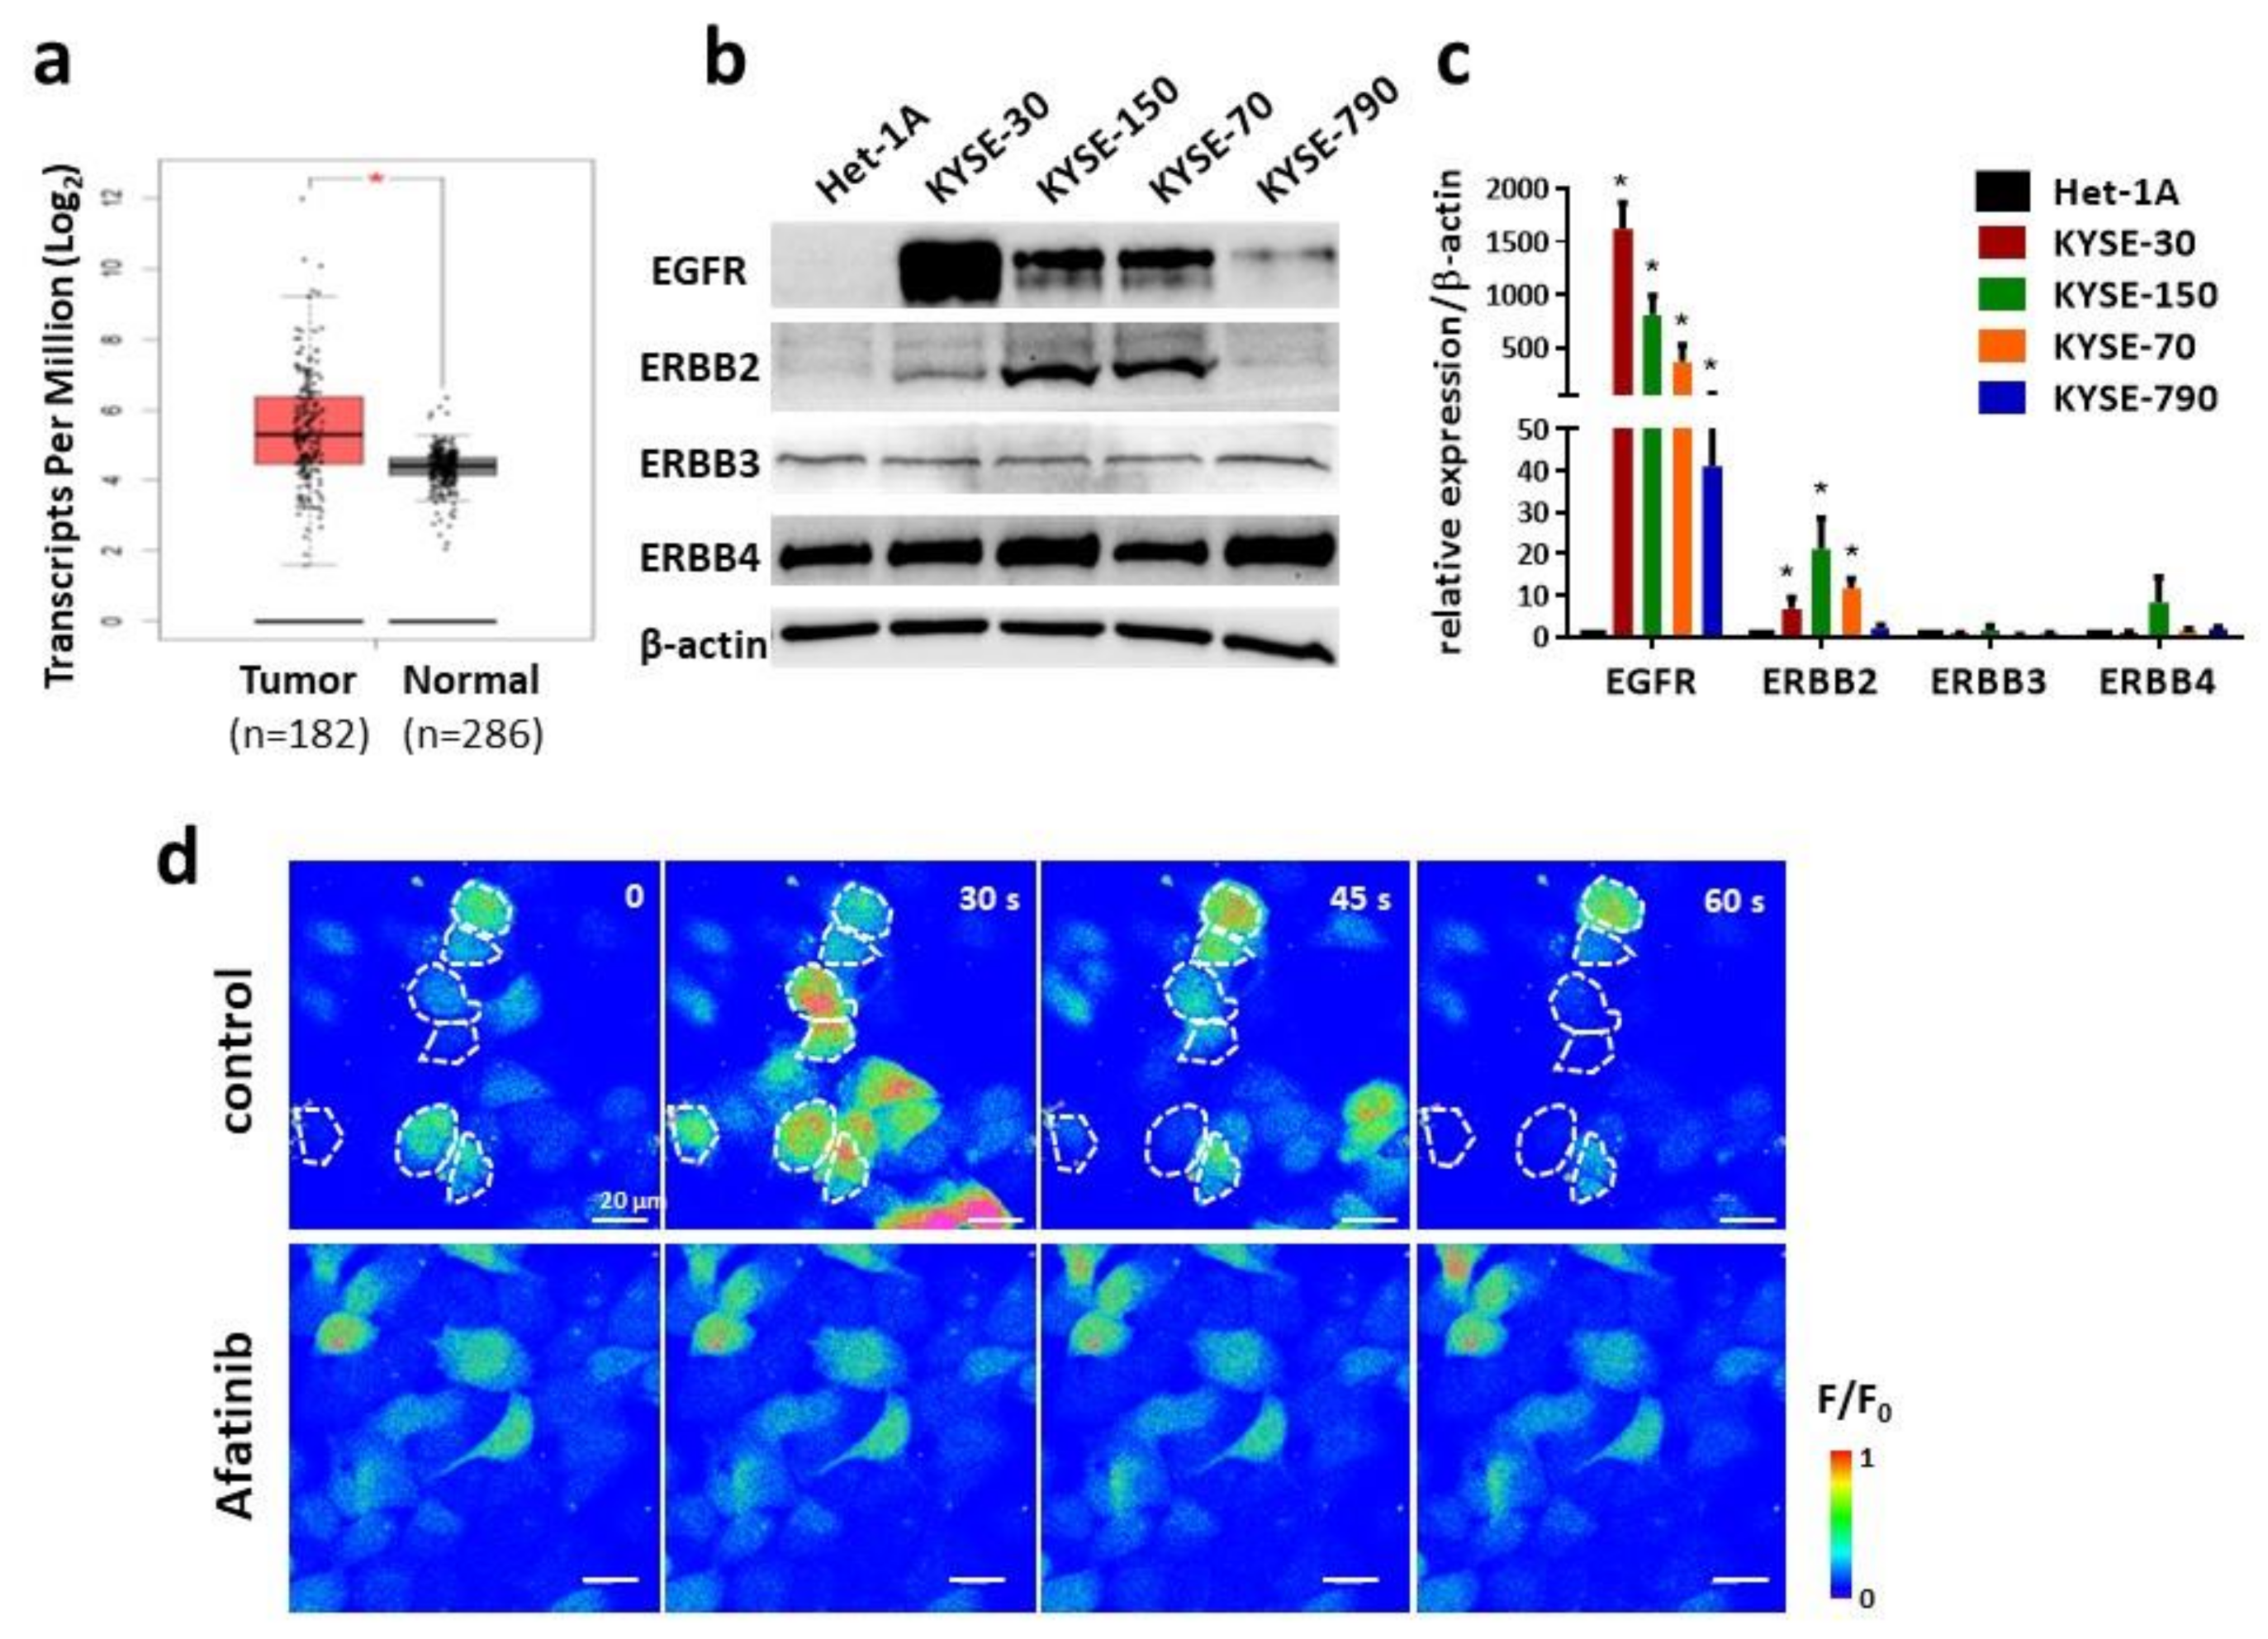
2.1. Inhibited Intracellular Ca2+ Oscillations by Afatinib in ESCC Cells
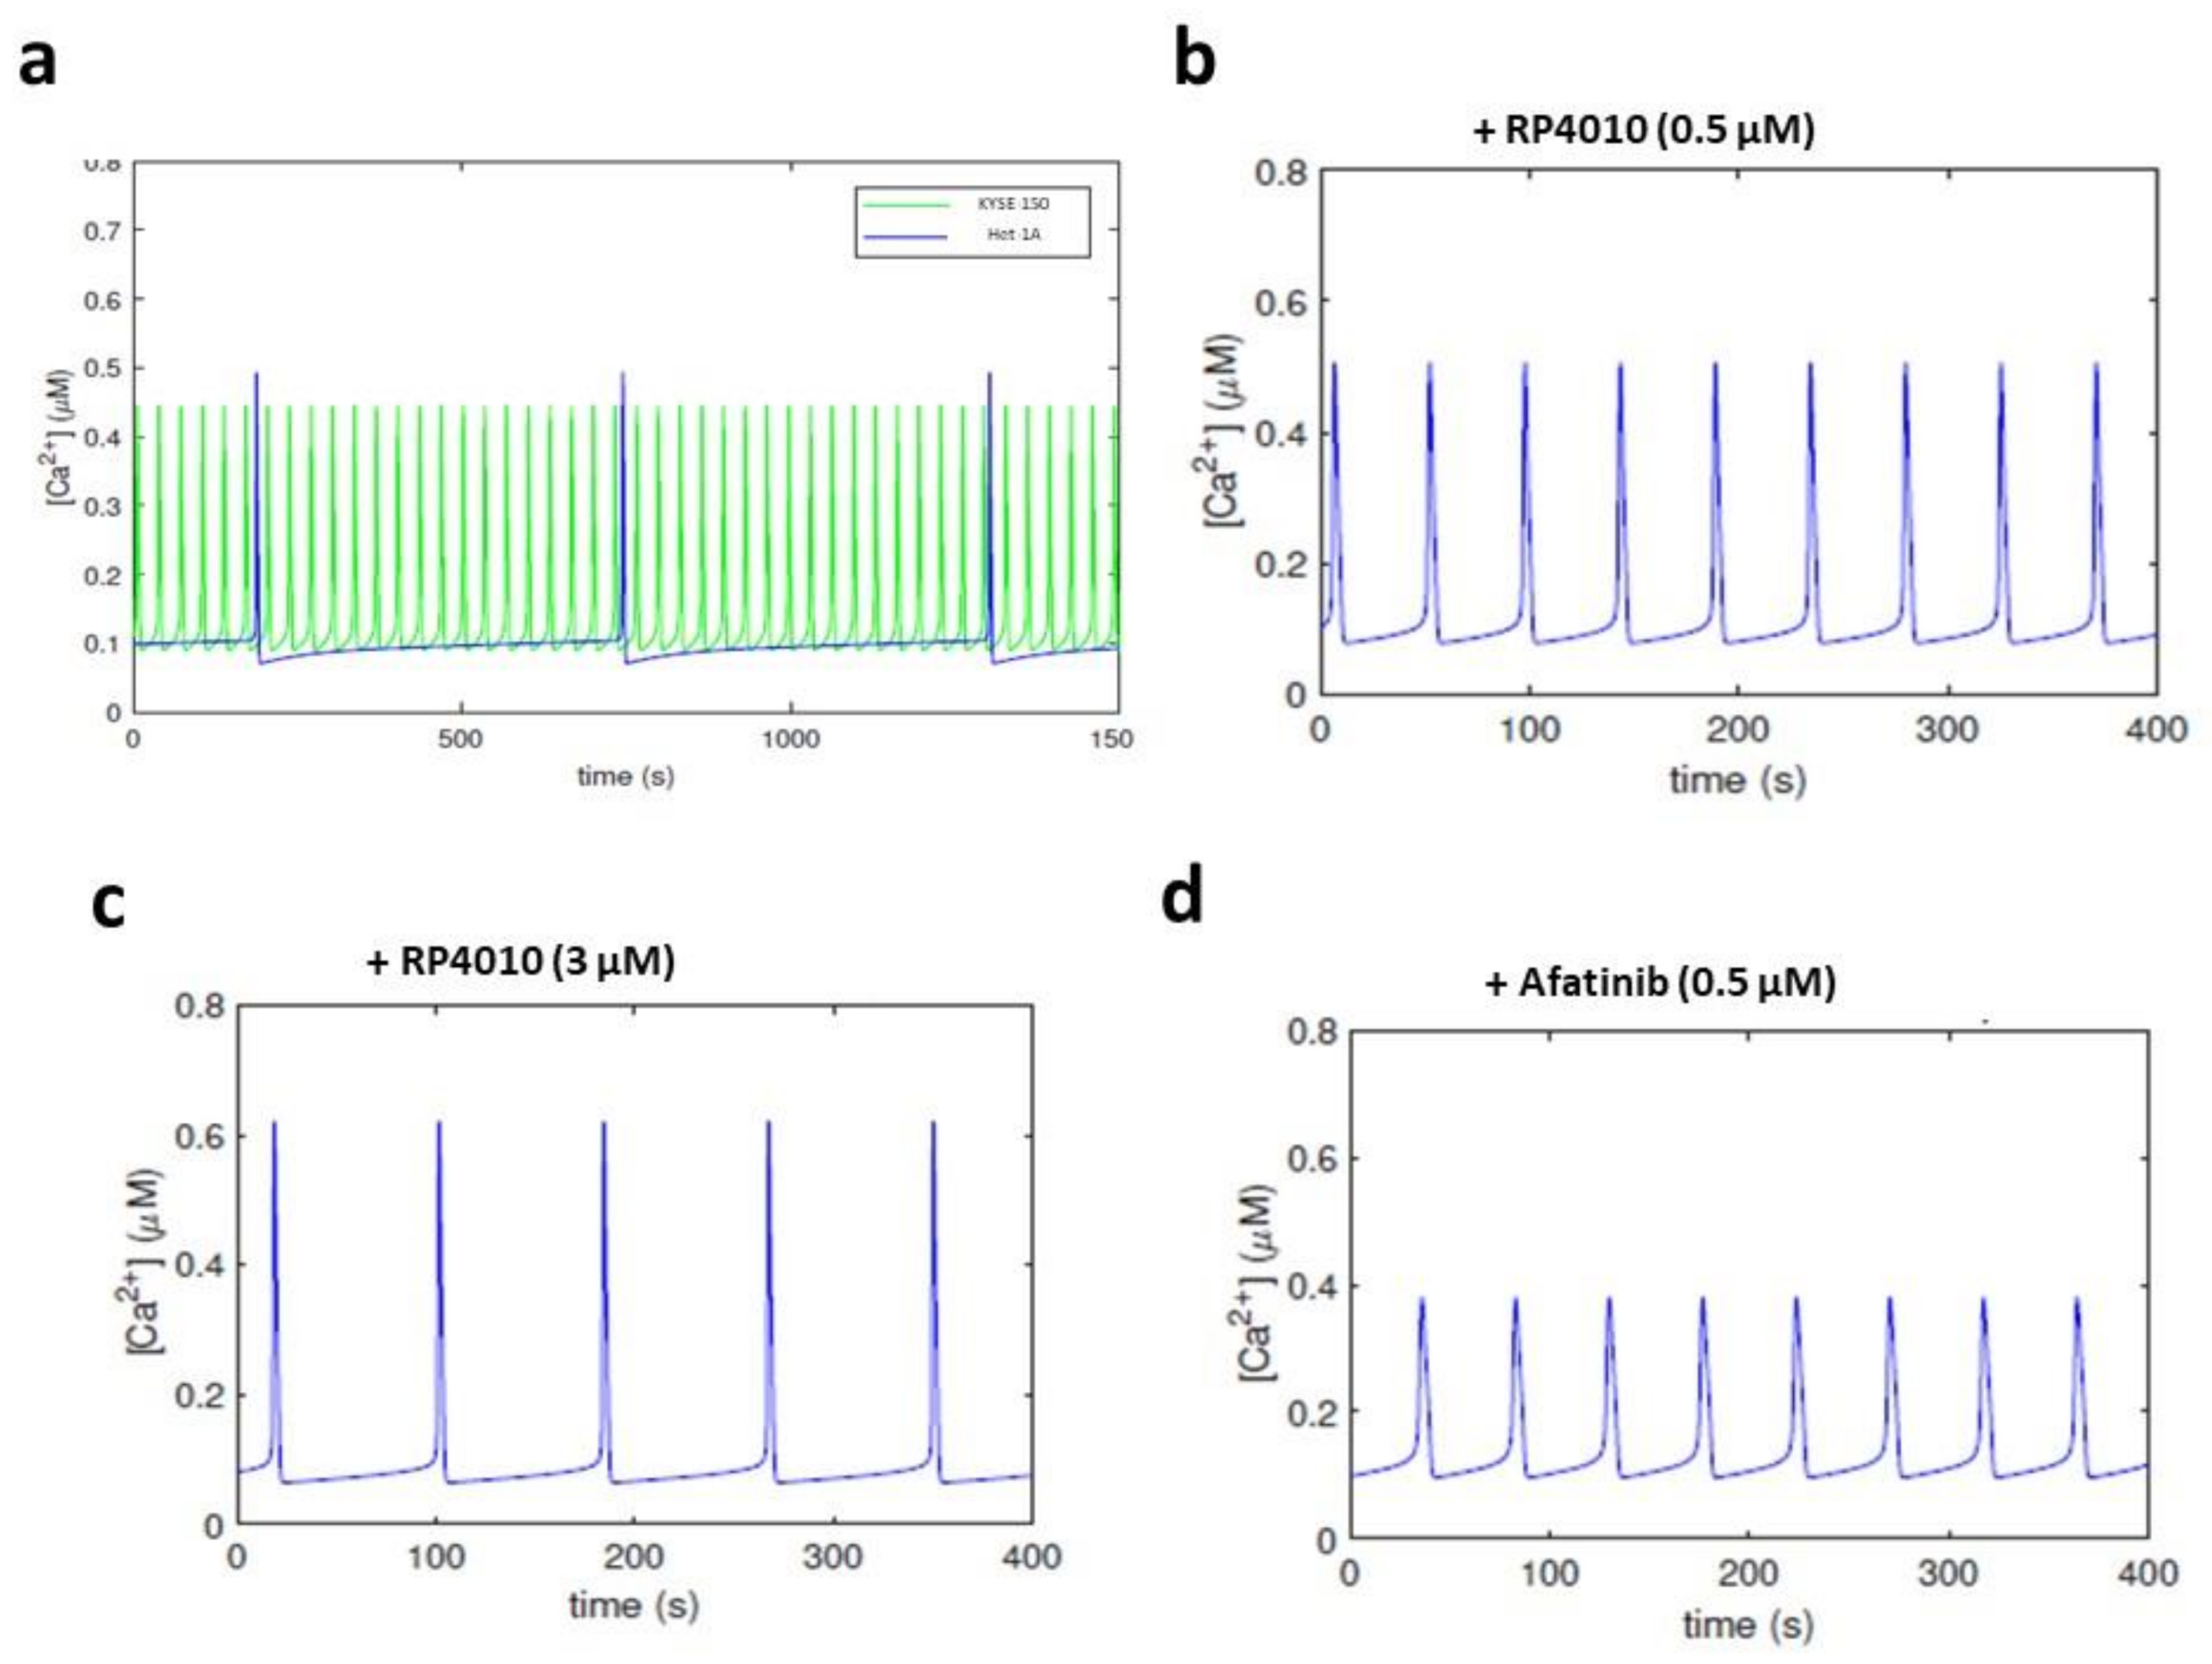
2.2. Decreased Frequency of Intracellular Ca2+ Oscillations by Treatment of RP4010 or Afatinib
2.3. Mathematical Simulation of Intracellular Ca2+ Oscillations
2.4. Effects of Combined RP4010 and Afatinib on Intracellular Ca2+ Oscillations
2.5. Synergistical Effects of RP4010 and Afatinib on Cytotoxicity in ESCC Cells
3. Discussion
4. Materials and Methods
4.1. Materials
4.2. Cell Culture
4.3. Intracellular Ca2+ Oscillations Measurement
4.4. Western Blot
4.5. Cell Viability Measurement
4.6. Mathematical Modeling
4.7. Addition of TKI and SOCE Blocker in the Computational Model
4.8. Validation of the Mathematical Model
4.9. Statistical Analysis
Supplementary Materials
Author Contributions
Funding
Institutional Review Board Statement
Informed Consent Statement
Acknowledgments
Conflicts of Interest
References
- Le Bras, G.F.; Farooq, M.H.; Falk, G.W.; Andl, C.D. Esophageal cancer: The latest on chemoprevention and state of the art therapies. Pharmacol. Res. 2016, 113, 236–244. [Google Scholar] [CrossRef] [PubMed] [Green Version]
- Zhang, X.; Pan, Z. Influence of microbiota on immunity and immunotherapy for gastric and esophageal cancers. Gastroenterol. Rep. 2020, 8, 206–214. [Google Scholar] [CrossRef]
- Siegel, R.L.; Miller, K.D.; Jemal, A. Cancer Statistics, 2017. CA Cancer J. Clin. 2017, 67, 7–30. [Google Scholar] [CrossRef] [Green Version]
- Cui, C.; Merritt, R.; Fu, L.; Pan, Z. Targeting calcium signaling in cancer therapy. Acta Pharm. Sin. B 2017, 7, 3–17. [Google Scholar] [CrossRef] [PubMed]
- Clapham, D.E. Calcium signaling. Cell 2007, 131, 1047–1058. [Google Scholar] [CrossRef] [PubMed] [Green Version]
- Sneyd, J.; Han, J.M.; Wang, L.; Chen, J.; Yang, X.; Tanimura, A.; Sanderson, M.J.; Kirk, V.; Yule, D.I. On the dynamical structure of calcium oscillations. Proc. Natl. Acad. Sci. USA 2017, 114, 1456–1461. [Google Scholar] [CrossRef] [PubMed] [Green Version]
- Berridge, M.J.; Lipp, P.; Bootman, M.D. The versatility and universality of calcium signalling. Nat. Rev. Mol. Cell Biol. 2000, 1, 11–21. [Google Scholar] [CrossRef] [PubMed]
- Bergmeier, W.; Weidinger, C.; Zee, I.; Feske, S. Emerging roles of store-operated Ca(2)(+) entry through STIM and ORAI proteins in immunity, hemostasis and cancer. Channels 2013, 7, 379–391. [Google Scholar] [CrossRef] [Green Version]
- Pan, Z.; Ma, J. Open Sesame: Treasure in store-operated calcium entry pathway for cancer therapy. Sci. China Life Sci. 2015, 58, 48–53. [Google Scholar] [CrossRef] [Green Version]
- Yang, S.; Zhang, J.J.; Huang, X.Y. Orai1 and STIM1 are critical for breast tumor cell migration and metastasis. Cancer Cell 2009, 15, 124–134. [Google Scholar] [CrossRef] [Green Version]
- Kondratska, K.; Kondratskyi, A.; Yassine, M.; Lemonnier, L.; Lepage, G.; Morabito, A.; Skryma, R.; Prevarskaya, N. Orai1 and STIM1 mediate SOCE and contribute to apoptotic resistance of pancreatic adenocarcinoma. Biochim. Biophys. Acta 2014, 1843, 2263–2269. [Google Scholar] [CrossRef] [Green Version]
- Flourakis, M.; Lehen’kyi, V.; Beck, B.; Raphael, M.; Vandenberghe, M.; Abeele, F.V.; Roudbaraki, M.; Lepage, G.; Mauroy, B.; Romanin, C.; et al. Orai1 contributes to the establishment of an apoptosis-resistant phenotype in prostate cancer cells. Cell Death Dis. 2010, 1, e75. [Google Scholar] [CrossRef] [Green Version]
- Zhu, H.; Zhang, H.; Jin, F.; Fang, M.; Huang, M.; Yang, C.S.; Chen, T.; Fu, L.; Pan, Z. Elevated Orai1 expression mediates tumor-promoting intracellular Ca2+ oscillations in human esophageal squamous cell carcinoma. Oncotarget 2014, 5, 3455–3471. [Google Scholar] [CrossRef] [Green Version]
- Cui, C.; Chang, Y.; Zhang, X.; Choi, S.; Tran, H.; Penmetsa, K.V.; Viswanadha, S.; Fu, L.; Pan, Z. Targeting Orai1-mediated store-operated calcium entry by RP4010 for anti-tumor activity in esophagus squamous cell carcinoma. Cancer Lett. 2018, 432, 169–179. [Google Scholar] [CrossRef]
- Bryant, J.A.; Finn, R.S.; Slamon, D.J.; Cloughesy, T.F.; Charles, A.C. EGF activates intracellular and intercellular calcium signaling by distinct pathways in tumor cells. Cancer Biol. Ther. 2004, 3, 1243–1249. [Google Scholar] [CrossRef] [Green Version]
- Meisenhelder, J.; Suh, P.G.; Rhee, S.G.; Hunter, T. Phospholipase C-gamma is a substrate for the PDGF and EGF receptor protein-tyrosine kinases in vivo and in vitro. Cell 1989, 57, 1109–1122. [Google Scholar] [CrossRef]
- Pottier, C.; Fresnais, M.; Gilon, M.; Jerusalem, G.; Longuespee, R.; Sounni, N.E. Tyrosine Kinase Inhibitors in Cancer: Breakthrough and Challenges of Targeted Therapy. Cancers 2020, 12, 731. [Google Scholar] [CrossRef] [Green Version]
- Minkovsky, N.; Berezov, A. BIBW-2992, a dual receptor tyrosine kinase inhibitor for the treatment of solid tumors. Curr. Opin. Investig. Drugs 2008, 9, 1336–1346. [Google Scholar]
- Hong, M.H.; Heo, S.G.; Lee, Y.G.; Kim, H.S.; Park, K.U.; Kim, H.G.; Ko, Y.H.; Chung, I.J.; Min, Y.J.; Kim, M.K.; et al. Phase 2 study of afatinib among patients with recurrent and/or metastatic esophageal squamous cell carcinoma. Cancer 2020, 126, 4521–4531. [Google Scholar] [CrossRef]
- Ma, P.; Fu, Y.; Chen, M.; Jing, Y.; Wu, J.; Li, K.; Shen, Y.; Gao, J.X.; Wang, M.; Zhao, X.; et al. Adaptive and Acquired Resistance to EGFR Inhibitors Converge on the MAPK Pathway. Theranostics 2016, 6, 1232–1243. [Google Scholar] [CrossRef] [Green Version]
- Roy, S.; Pan, Z.; Pal, S. A Fokker-Planck feedback control framework for optimal personalized therapies in colon cancer-induced angiogenesis. arXiv 2021, arXiv:2109.00166. [Google Scholar]
- Roy, S.; Pal, S.; Manoj, A.; Kakarla, S.; Villegas, J.; Alajmi, M. A Fokker-Planck framework for parameter estimation and sen-sitivity analysis in colon cancer. AIP Conf. Proc. 2021. to appear. [Google Scholar]
- Chang, Y.; Roy, S.; Pan, Z. Store-Operated Calcium Channels as Drug Target in Gastroesophageal Cancers. Front. Pharmacol. 2021, 12, 668730. [Google Scholar] [CrossRef] [PubMed]
- Kim, M.S.; Kim, S.H.; Yang, S.H. Restricting extracellular Ca2+ on gefitinib-resistant non-small cell lung cancer cells reverses altered epidermal growth factor-mediated Ca2+ response, which consequently enhances gefitinib sensitivity. PLoS ONE 2020, 15, e0238155. [Google Scholar] [CrossRef] [PubMed]
- Casas-Rua, V.; Tomas-Martin, P.; Lopez-Guerrero, A.M.; Alvarez, I.S.; Pozo-Guisado, E.; Martin-Romero, F.J. STIM1 phosphorylation triggered by epidermal growth factor mediates cell migration. Biochim. Biophys. Acta 2015, 1853, 233–243. [Google Scholar] [CrossRef] [PubMed] [Green Version]
- Smedler, E.; Uhlén, P. Frequency decoding of calcium oscillations. Biochim. Biophys. Acta 2014, 1840, 964–969. [Google Scholar] [CrossRef] [PubMed] [Green Version]
- Dupont, G.; Combettes, L.; Bird, G.S.; Putney, J.W. Calcium Oscillations. Cold Spring Harb. Perspect. Biol. 2011, 3, a004226. [Google Scholar] [CrossRef] [PubMed] [Green Version]
- Bogacki, P.; Shampine, L.F. A 3(2) pair of Runge-Kutta formulas. Appl. Math. Lett. 1989, 2, 321–325. [Google Scholar] [CrossRef] [Green Version]
- Marquardt, D. An Algorithm for Least-squares Estimation of Nonlinear Parameters. SIAM J. Appl. Math. 1963, 11, 431–441. [Google Scholar] [CrossRef]
- Chou, T.C. Drug combination studies and their synergy quantification using the Chou-Talalay method. Cancer Res. 2010, 70, 440–446. [Google Scholar] [CrossRef] [Green Version]


| Drug Concentration (µM) | Period (s) Mean ± SEM | |
|---|---|---|
| RP4010 | Afatinib | |
| 10 | 122 ± 6.6 | / |
| 5 | 111 ± 6.2 | 73.4 ± 4.3 |
| 2.5 | 60.8 ± 4.0 | 61.9 ± 3.5 |
| 2 | 56.5 ± 2.7 | / |
| 1.25 | 55.4 ± 3.5 | 54.2 ± 2.5 |
| 1 | 53.5 ± 2.9 | 52.7 ± 2 |
| 0.625 | 44.1 ± 3.3 | 48.2 ± 2.4 |
| 0.5 | 38.8 ± 1.3 | 47.1 ± 1.5 |
| 0.3125 | / | 41.9 ± 2.6 |
| 0.25 | 35.9 ± 1.3 | 41.8 ± 1.4 |
| 0.125 | 34.4 ± 2 | 39.8 ± 1.4 |
| 0.0625 | / | 38.6 ± 2.2 |
| 0.0 | 32.8 ± 1.2 | |
| Parameter | Description | Value | Units |
|---|---|---|---|
| δ | Used to adjust ratio of [Ca2+] across plasma membrane to ER membrane | 1.5 | n/a |
| Kτ | The concentration of Ca2+ in response to β | 0.1 | µM |
| Kc | Half-maximal [Ca2+] for IP3R | 0.2 | µM |
| k f | Scaling factor that controls [Ca2+] release through IP3R; IP3R density and channel activity | 3.9 | s−1 |
| Vserca | Maximum capacity of SERCA pump | 0.9 | µMs−1 |
| γ | Ratio of cytoplasmic volume to ER volume | 5.5 | n/a |
| Vpm | Maximum capacity of plasma membrane pump | 0.11 | µMs−1 |
| α0 | Flow of calcium into the cell through an unspecified leak | 0.0027 | µMs−1 |
| KP | Half-maximal [IP3] for IP3R | 0.2 | µM |
| τmax | Controls rate that β responds to [Ca2+] changes | 1420 | s−1 |
| βp | Rate of decay of p to its steady state | 0.027 | s−1 |
| Kh | The concentration of Ca2+ activated IP3R | 0.08 | µM |
| K¯ | Used to adjust the Ca2+ concentration in ER | 1.9 × 10⁻⁵ | n/a |
| Ke | Half-maximal [Ca2+] ER for SOC channels | 8 | µM |
| Kpm | Half-maximal [Ca2+] for plasma membrane pump | 0.3 | µM |
| α1 | Rate constant for SOC channels | 0.385 | µMs−1 |
| Dose (µM) | Parameter | Baseline | p-Value | PRCC Value |
|---|---|---|---|---|
| Aft: 0.5 RP: 1.0 | kf | 3.9 | 0.643 | 0.034 |
| α1 | 0.385 | 1.44 × 10−50 | −0.831 | |
| c1 | 0.51 | 0.272 | 0.079 | |
| c2 | 1 | 1.74 × 10−46 | 0.812 | |
| c3 | 0.76 | 4.6 × 10⁻¹⁶ | −0.541 | |
| k1 | 0.34 | 0.061 | −0.1353 | |
| k2 | 0.6 | 4.01 × 10⁻¹² | −0.4724 | |
| k3 | 0.8 | 8.45 × 10⁻⁸ | 0.3740 |
| Concentration of Combined Drugs (µM) | Period (s) | |
|---|---|---|
| RP4010 | Afatinib | |
| 5 | 2.5 | 92.3 ± 4.6 |
| 2.5 | 1.25 | 90.8 ± 4.4 |
| 2 | 1 | 89.4 ± 6.4 |
| 1.5 | 0.75 | 76.8 ± 4.6 |
| 1.25 | 0.625 | 73.1 ± 3.8 |
| 1 | 0.5 | 68.7 ± 3.9 |
| 0.625 | 0.3125 | 64.2 ± 3.7 |
| 0.25 | 0.125 | 61.1 ± 3.1 |
| 0.125 | 0.0625 | 59.6 ± 2.5 |
Publisher’s Note: MDPI stays neutral with regard to jurisdictional claims in published maps and institutional affiliations. |
© 2022 by the authors. Licensee MDPI, Basel, Switzerland. This article is an open access article distributed under the terms and conditions of the Creative Commons Attribution (CC BY) license (https://creativecommons.org/licenses/by/4.0/).
Share and Cite
Chang, Y.; Funk, M.; Roy, S.; Stephenson, E.; Choi, S.; Kojouharov, H.V.; Chen, B.; Pan, Z. Developing a Mathematical Model of Intracellular Calcium Dynamics for Evaluating Combined Anticancer Effects of Afatinib and RP4010 in Esophageal Cancer. Int. J. Mol. Sci. 2022, 23, 1763. https://doi.org/10.3390/ijms23031763
Chang Y, Funk M, Roy S, Stephenson E, Choi S, Kojouharov HV, Chen B, Pan Z. Developing a Mathematical Model of Intracellular Calcium Dynamics for Evaluating Combined Anticancer Effects of Afatinib and RP4010 in Esophageal Cancer. International Journal of Molecular Sciences. 2022; 23(3):1763. https://doi.org/10.3390/ijms23031763
Chicago/Turabian StyleChang, Yan, Marah Funk, Souvik Roy, Elizabeth Stephenson, Sangyong Choi, Hristo V. Kojouharov, Benito Chen, and Zui Pan. 2022. "Developing a Mathematical Model of Intracellular Calcium Dynamics for Evaluating Combined Anticancer Effects of Afatinib and RP4010 in Esophageal Cancer" International Journal of Molecular Sciences 23, no. 3: 1763. https://doi.org/10.3390/ijms23031763
APA StyleChang, Y., Funk, M., Roy, S., Stephenson, E., Choi, S., Kojouharov, H. V., Chen, B., & Pan, Z. (2022). Developing a Mathematical Model of Intracellular Calcium Dynamics for Evaluating Combined Anticancer Effects of Afatinib and RP4010 in Esophageal Cancer. International Journal of Molecular Sciences, 23(3), 1763. https://doi.org/10.3390/ijms23031763