
Histological Grade and Tumor Stage Are Correlated with Expression of Receptor Activator of Nuclear Factor Kappa b (Rank) in Epithelial Ovarian Cancers

 , ,
, ,
Abstract
:1. Introduction
2. Results
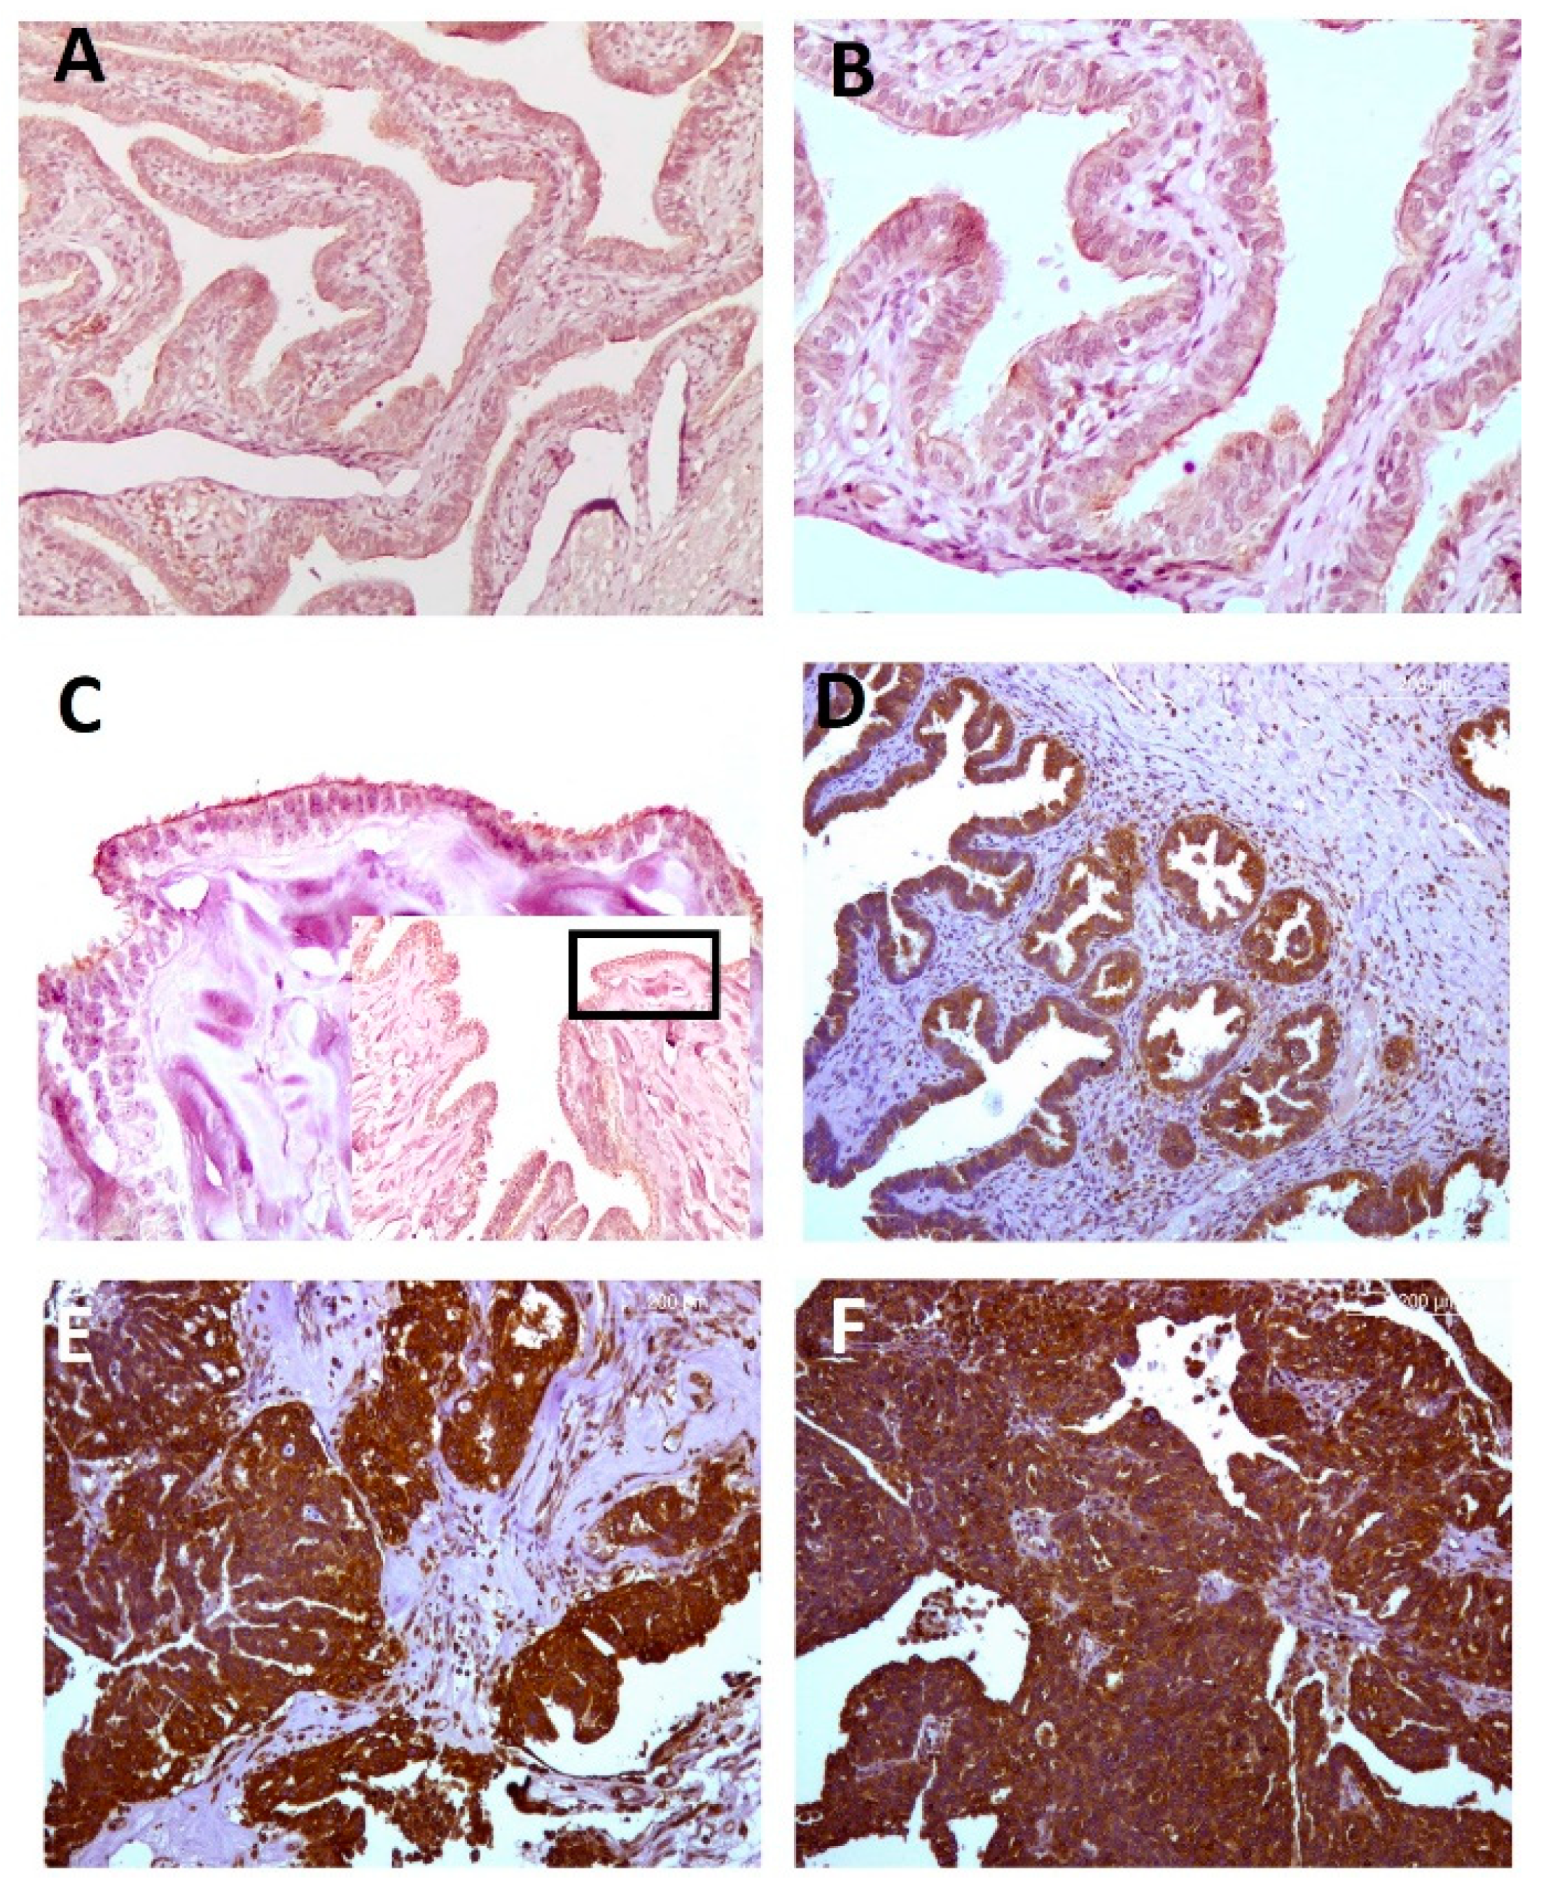
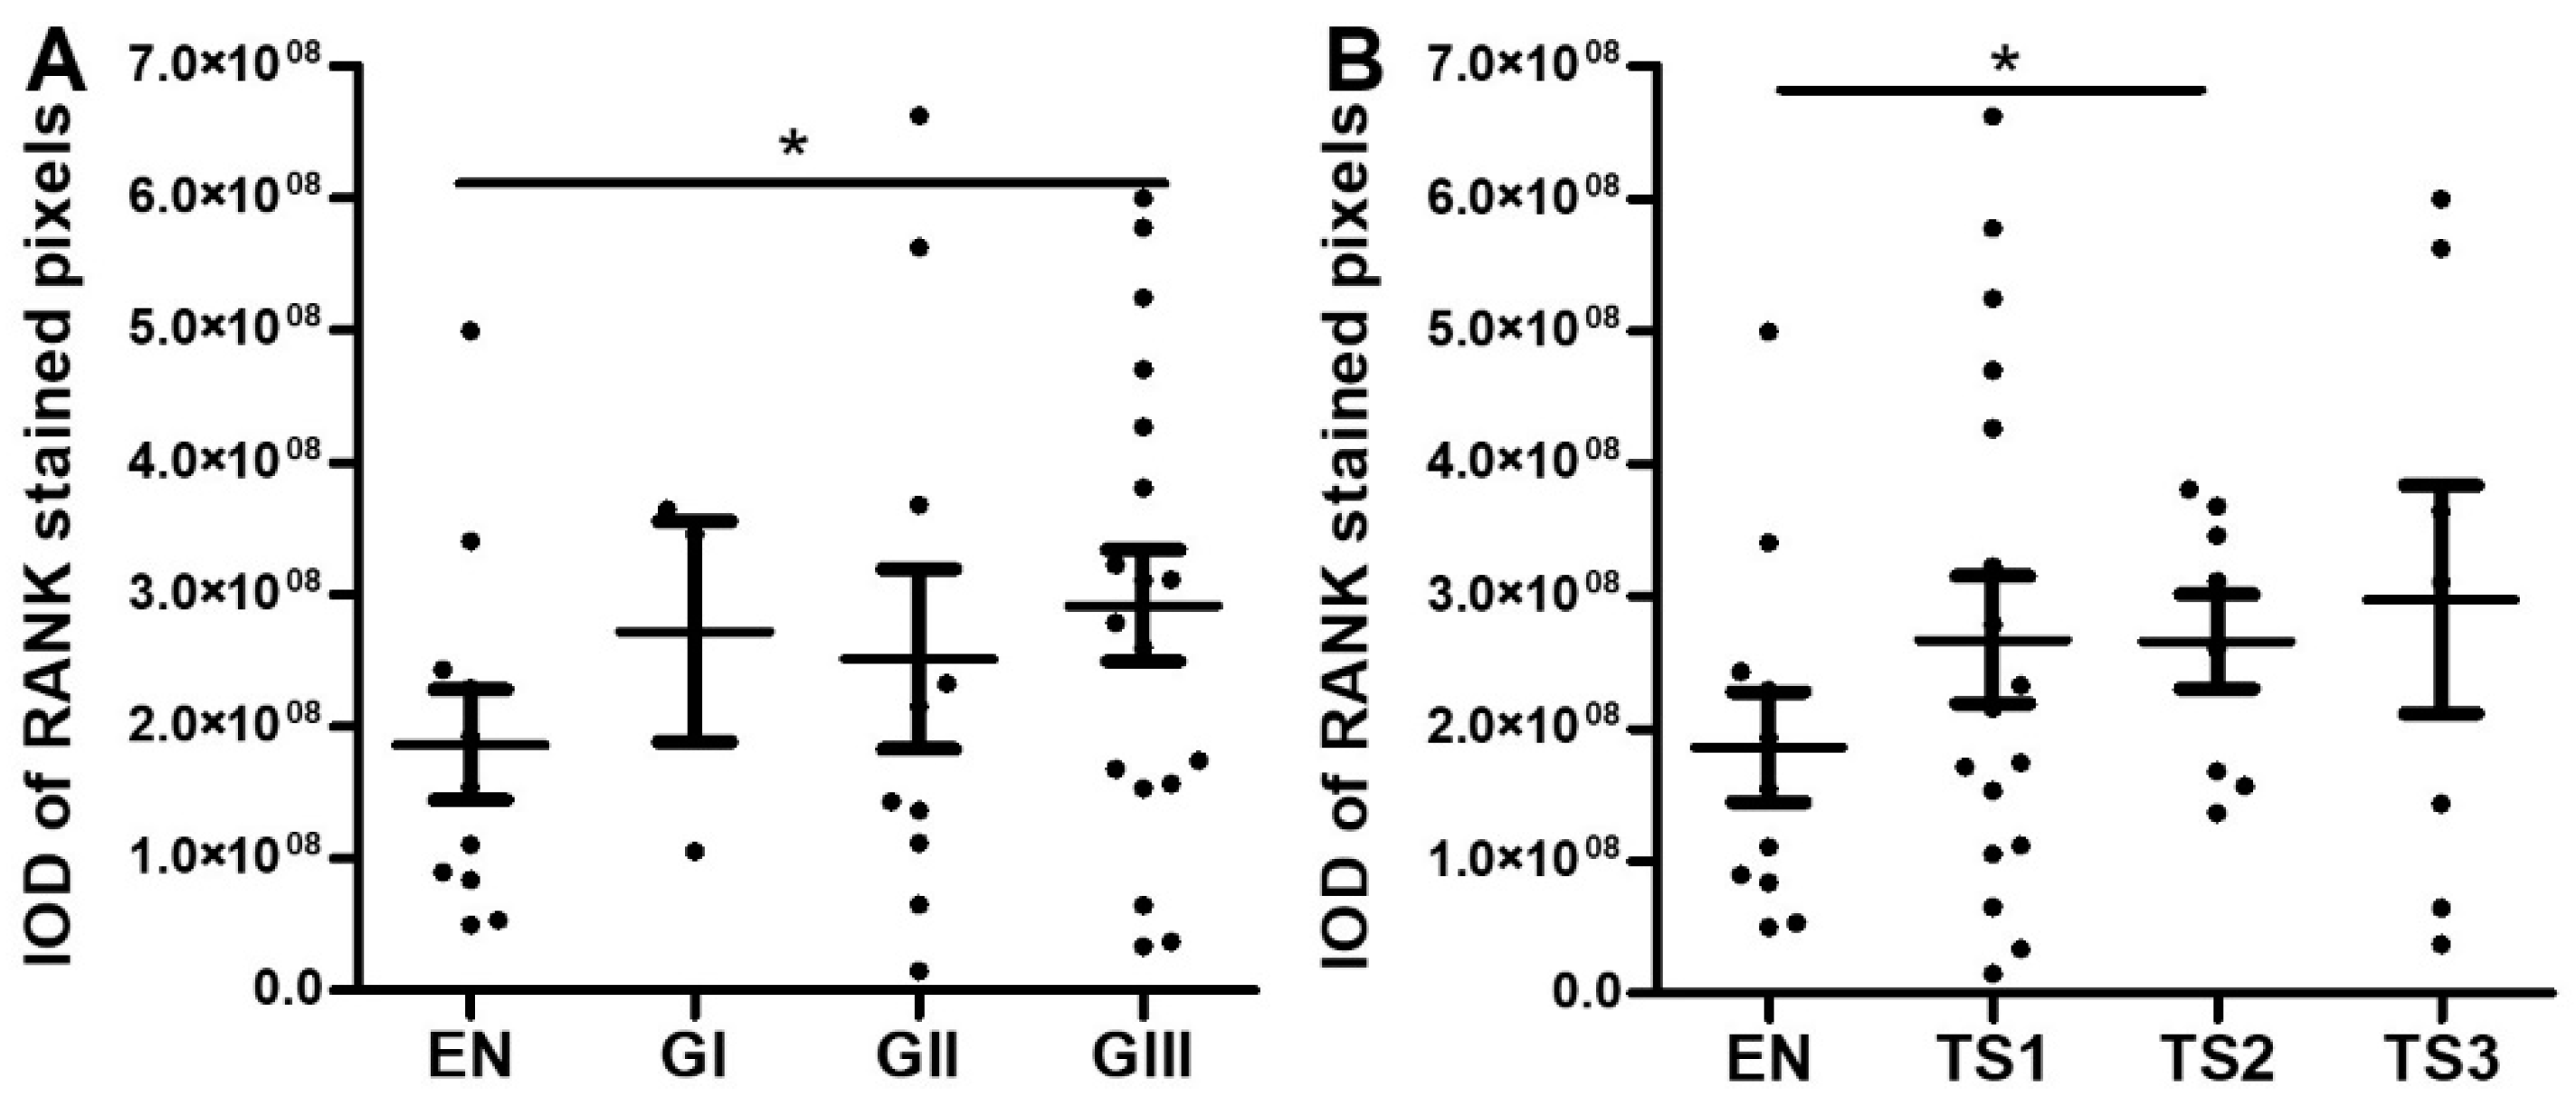
2.1. Serous EOC
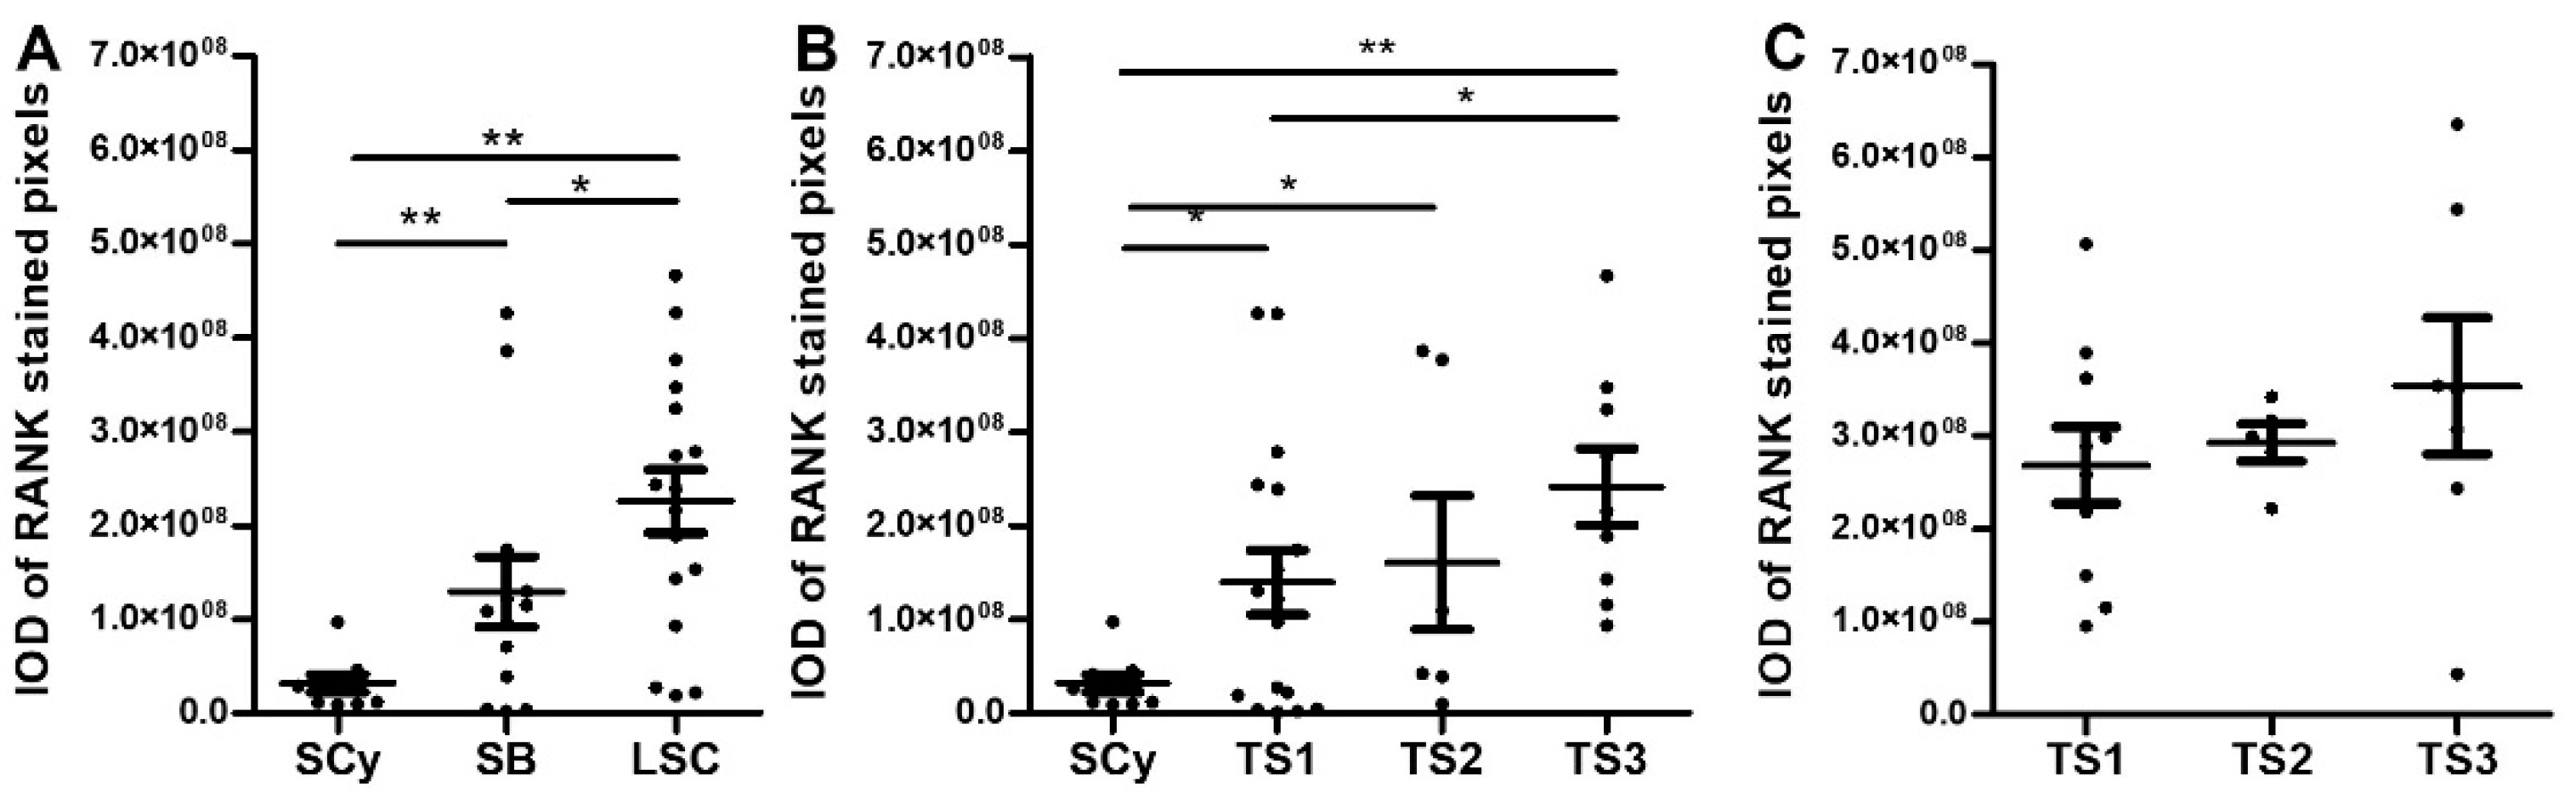
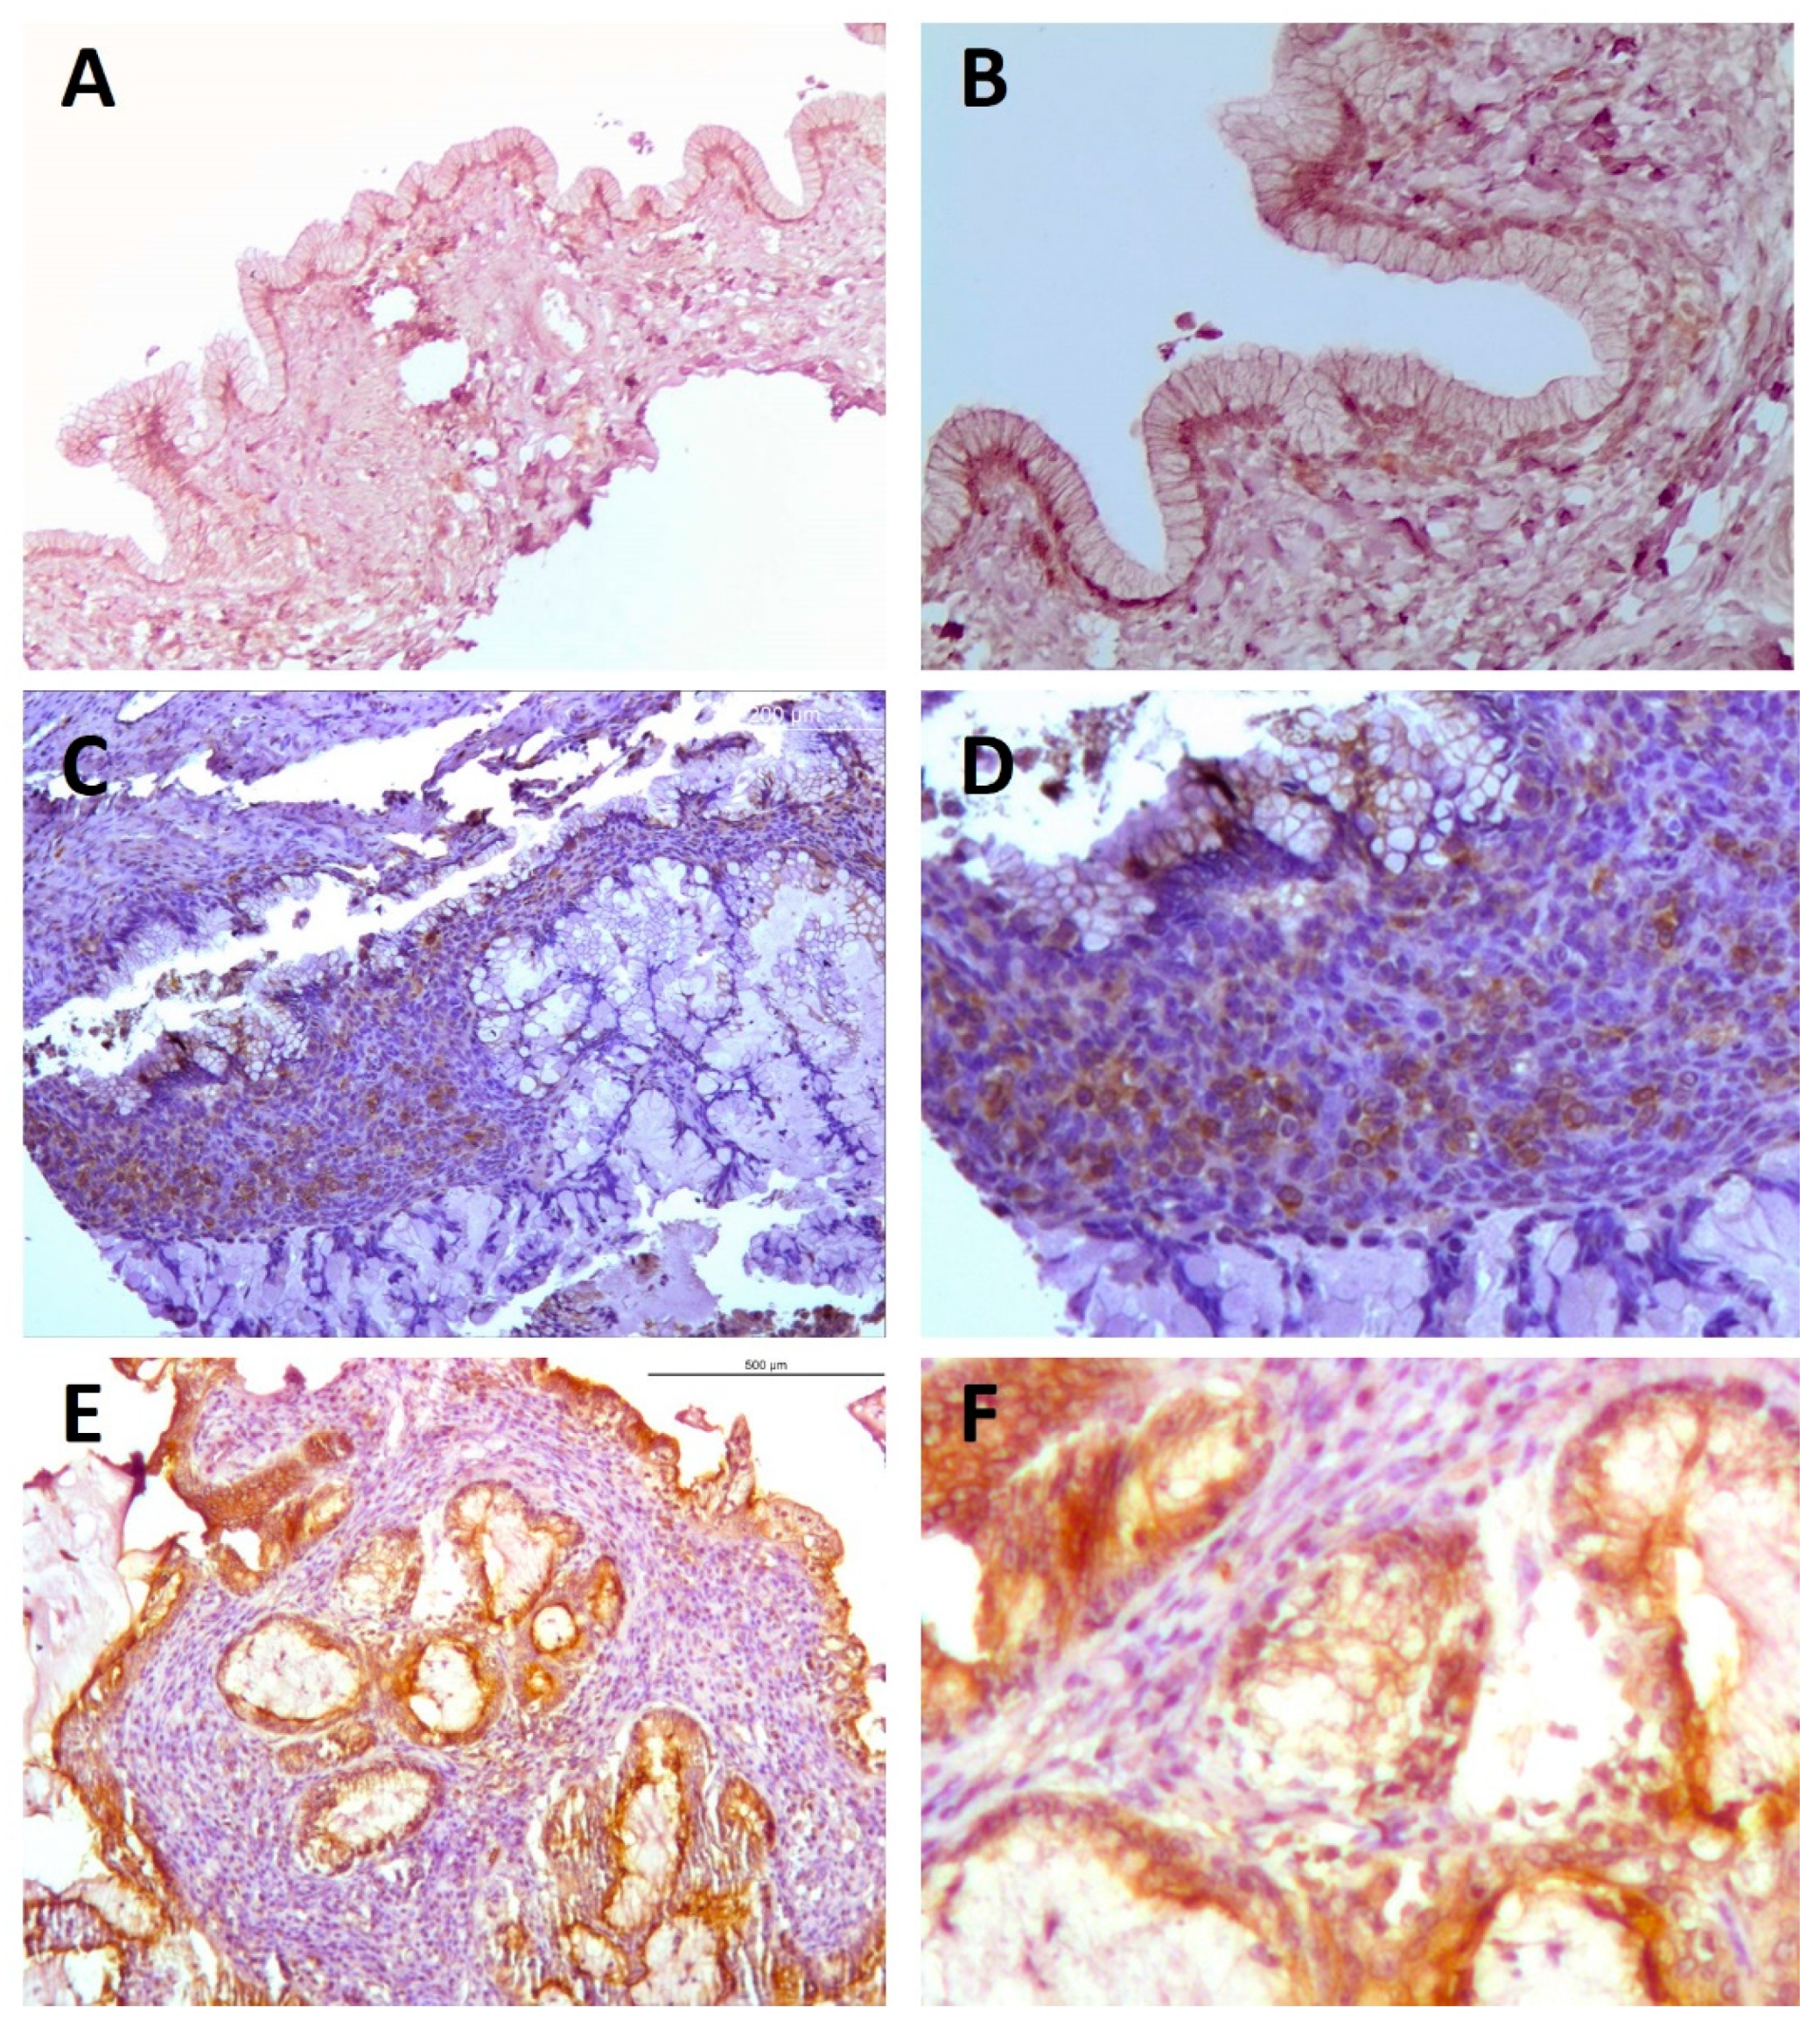
2.1.1. Immunohistochemical Analyses
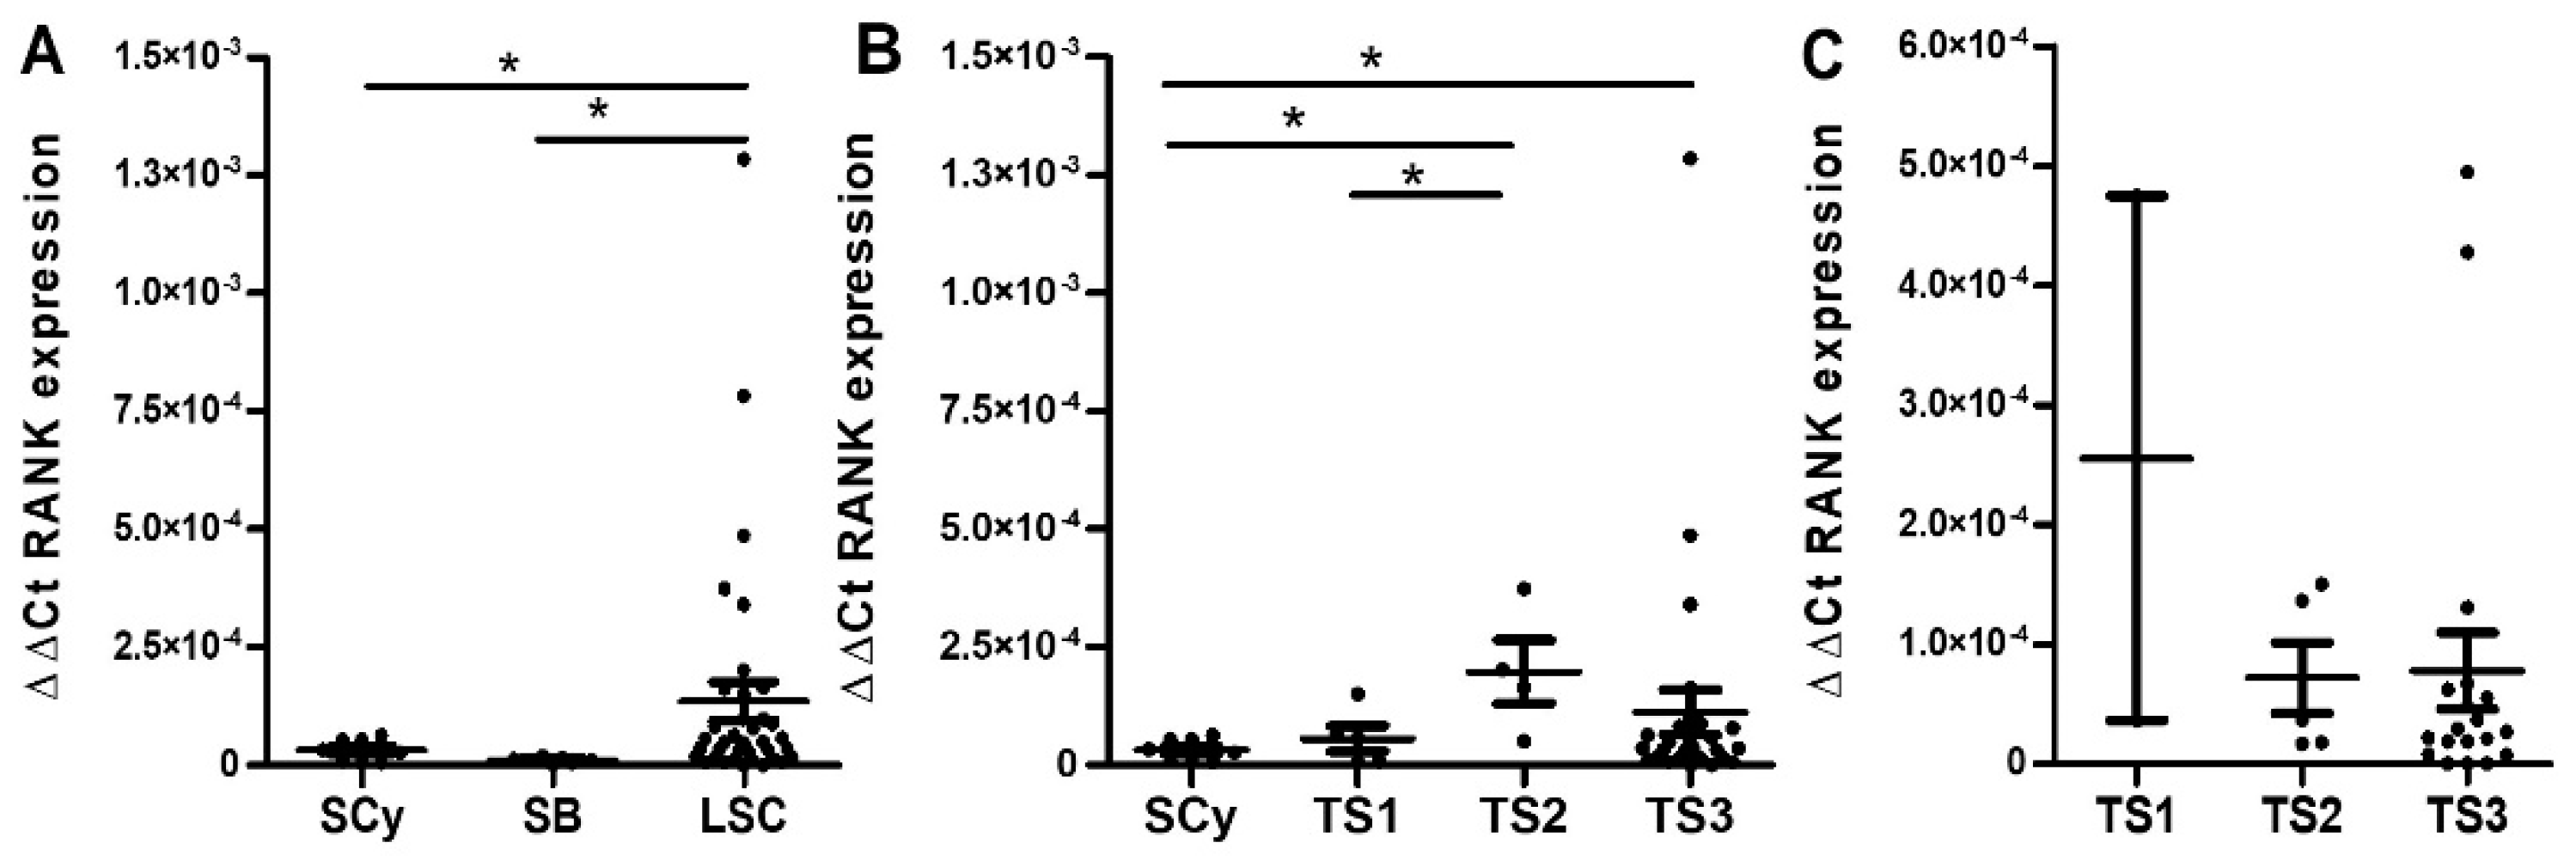
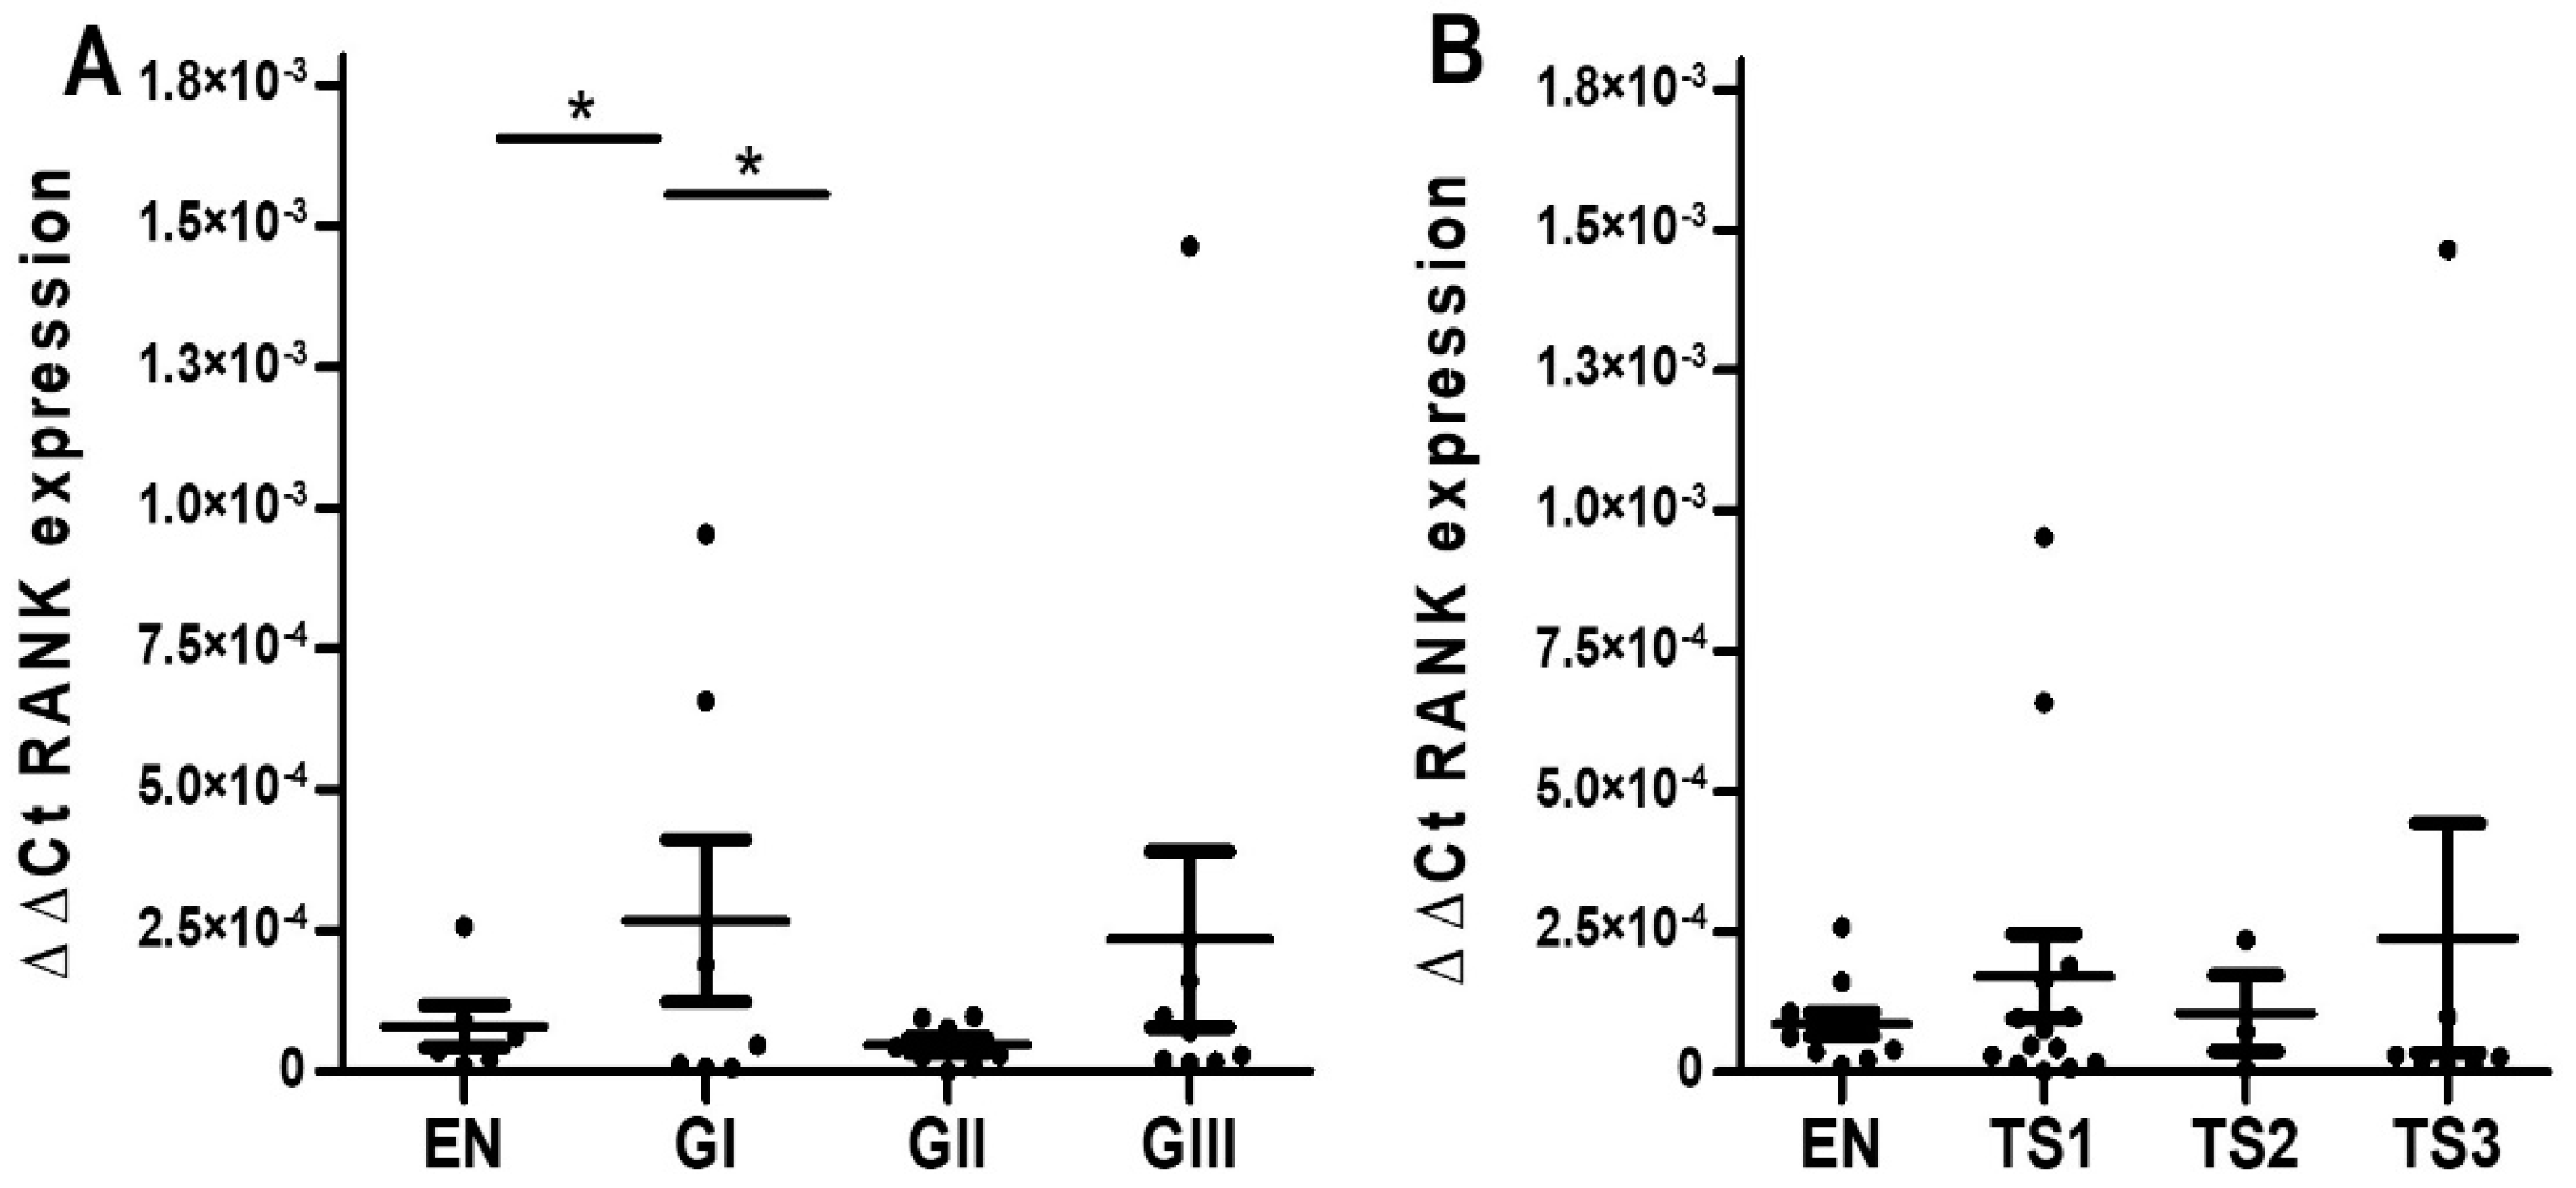
2.1.2. Quantitative RT-PCR Analyses
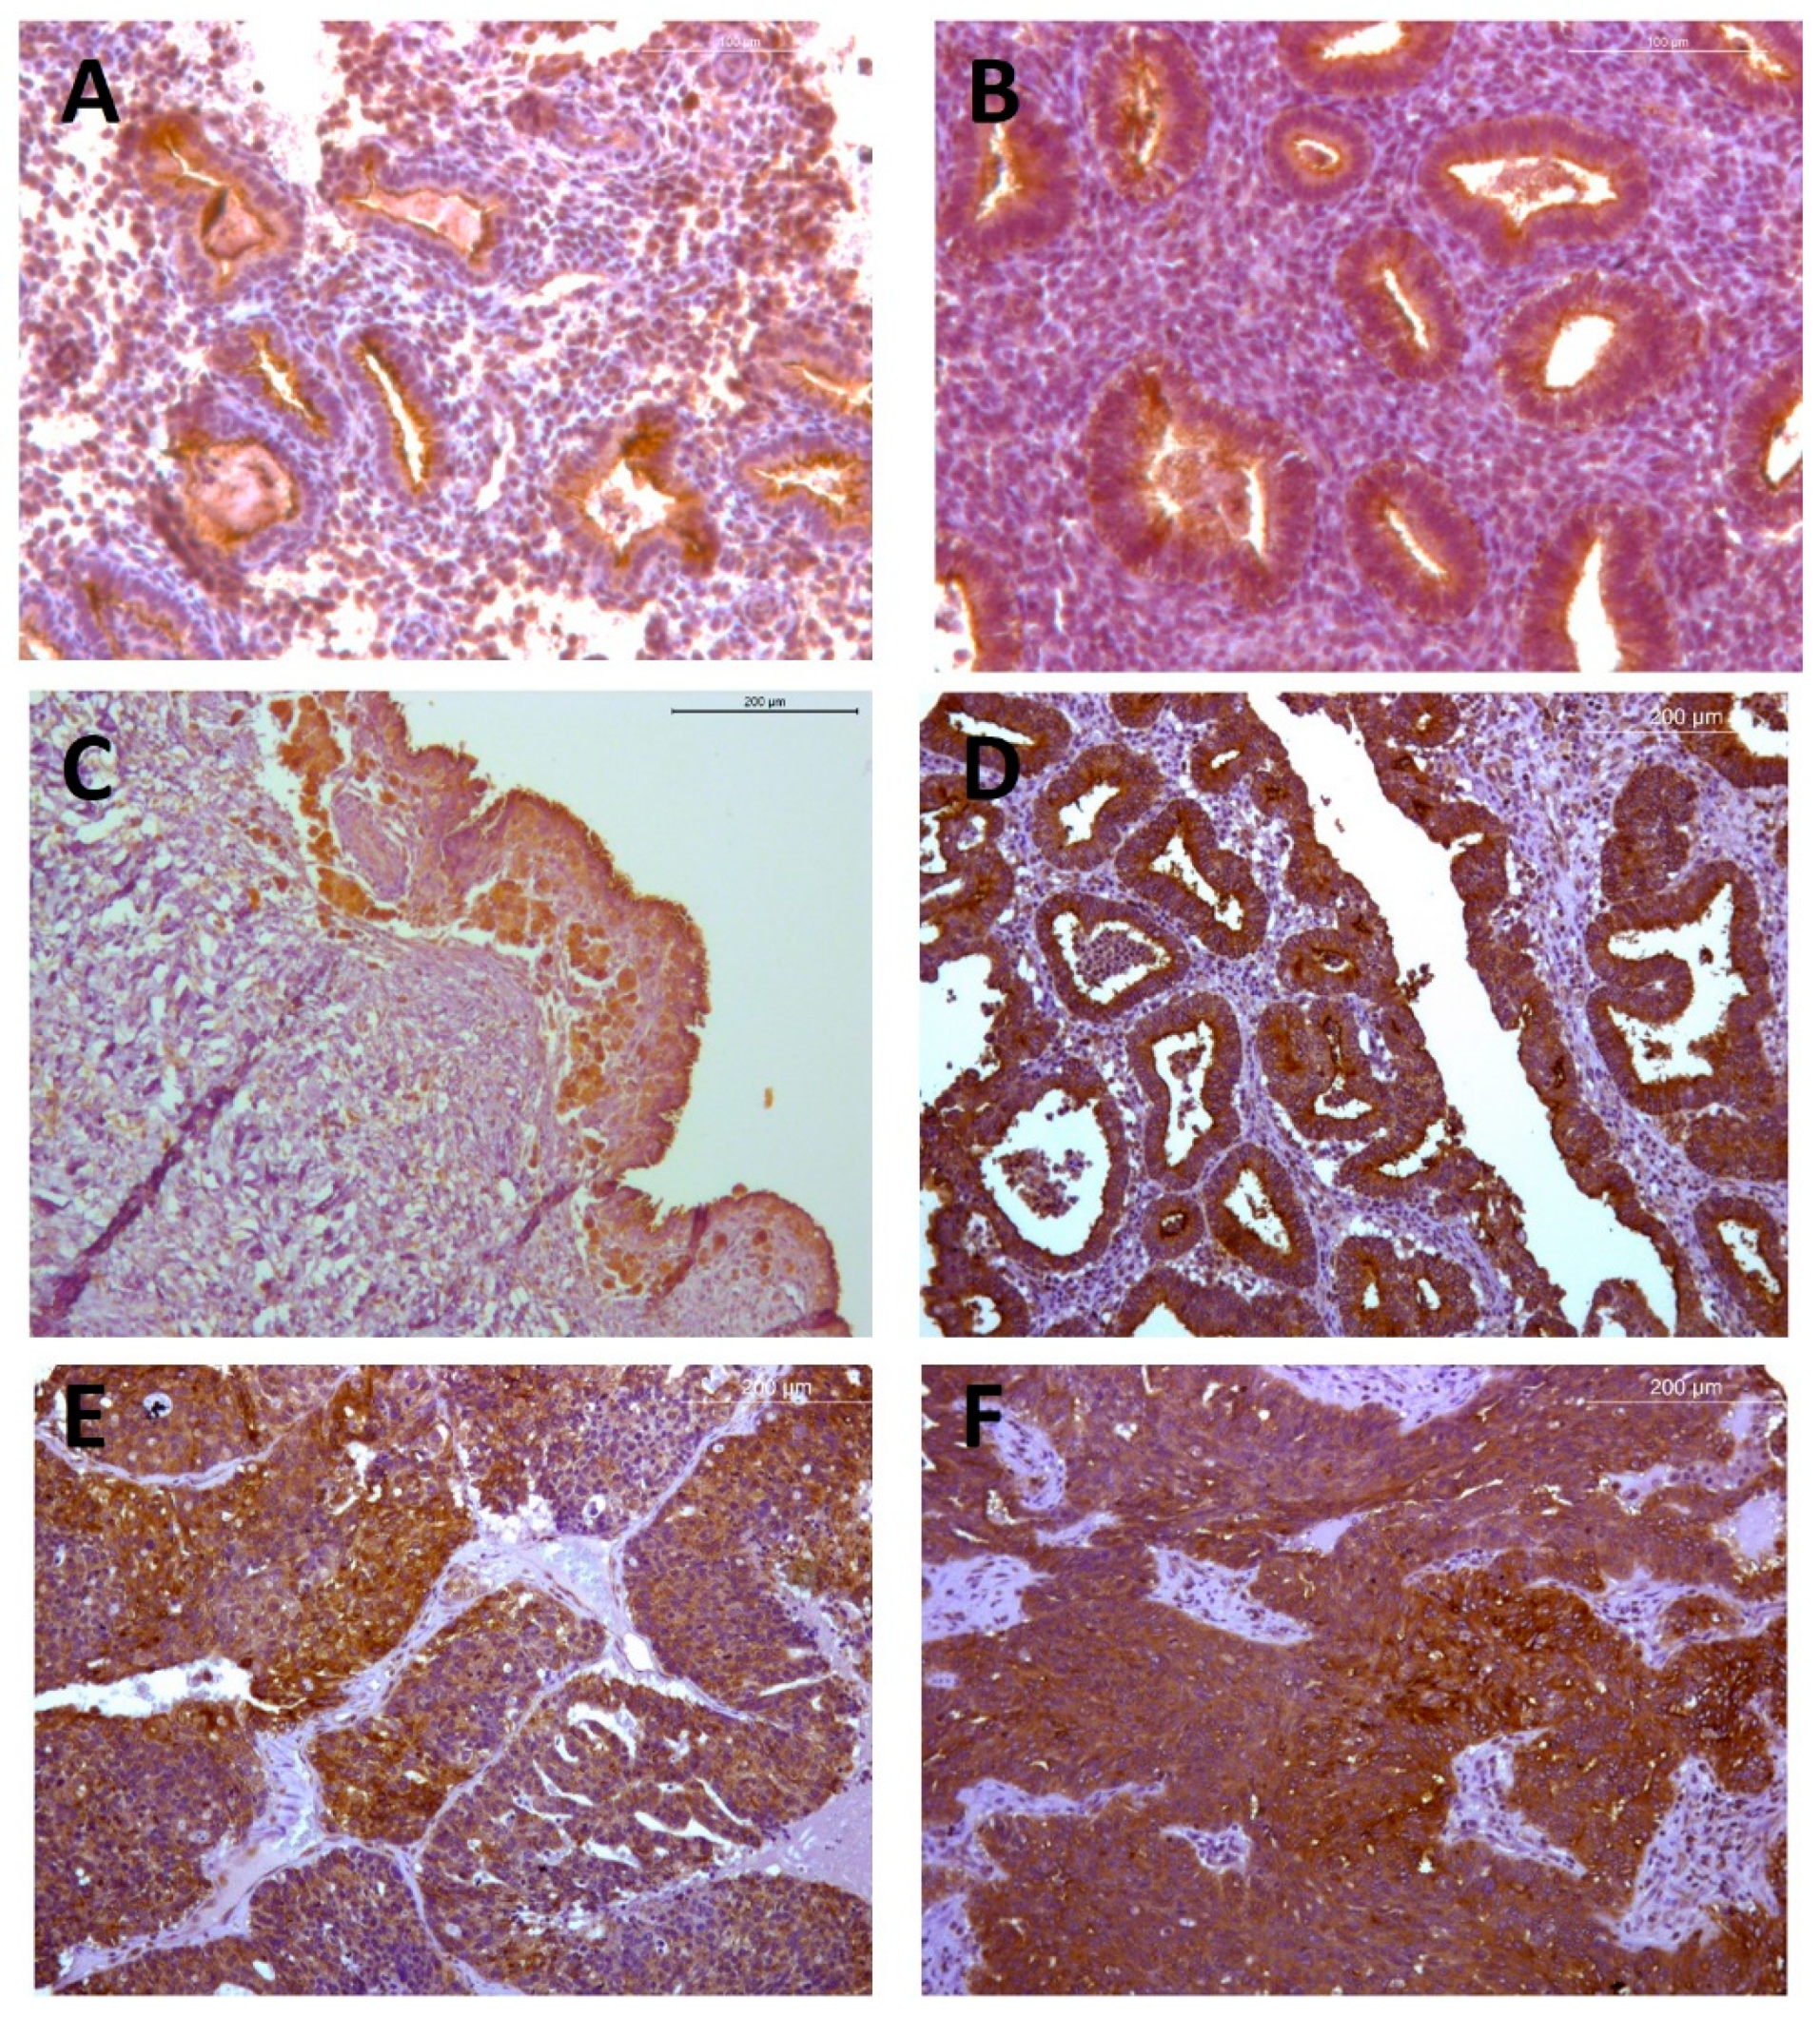
2.2. Endometrioid EOC
2.2.1. Immunohistochemical Analyses
2.2.2. Quantitative RT-PCR Analyses
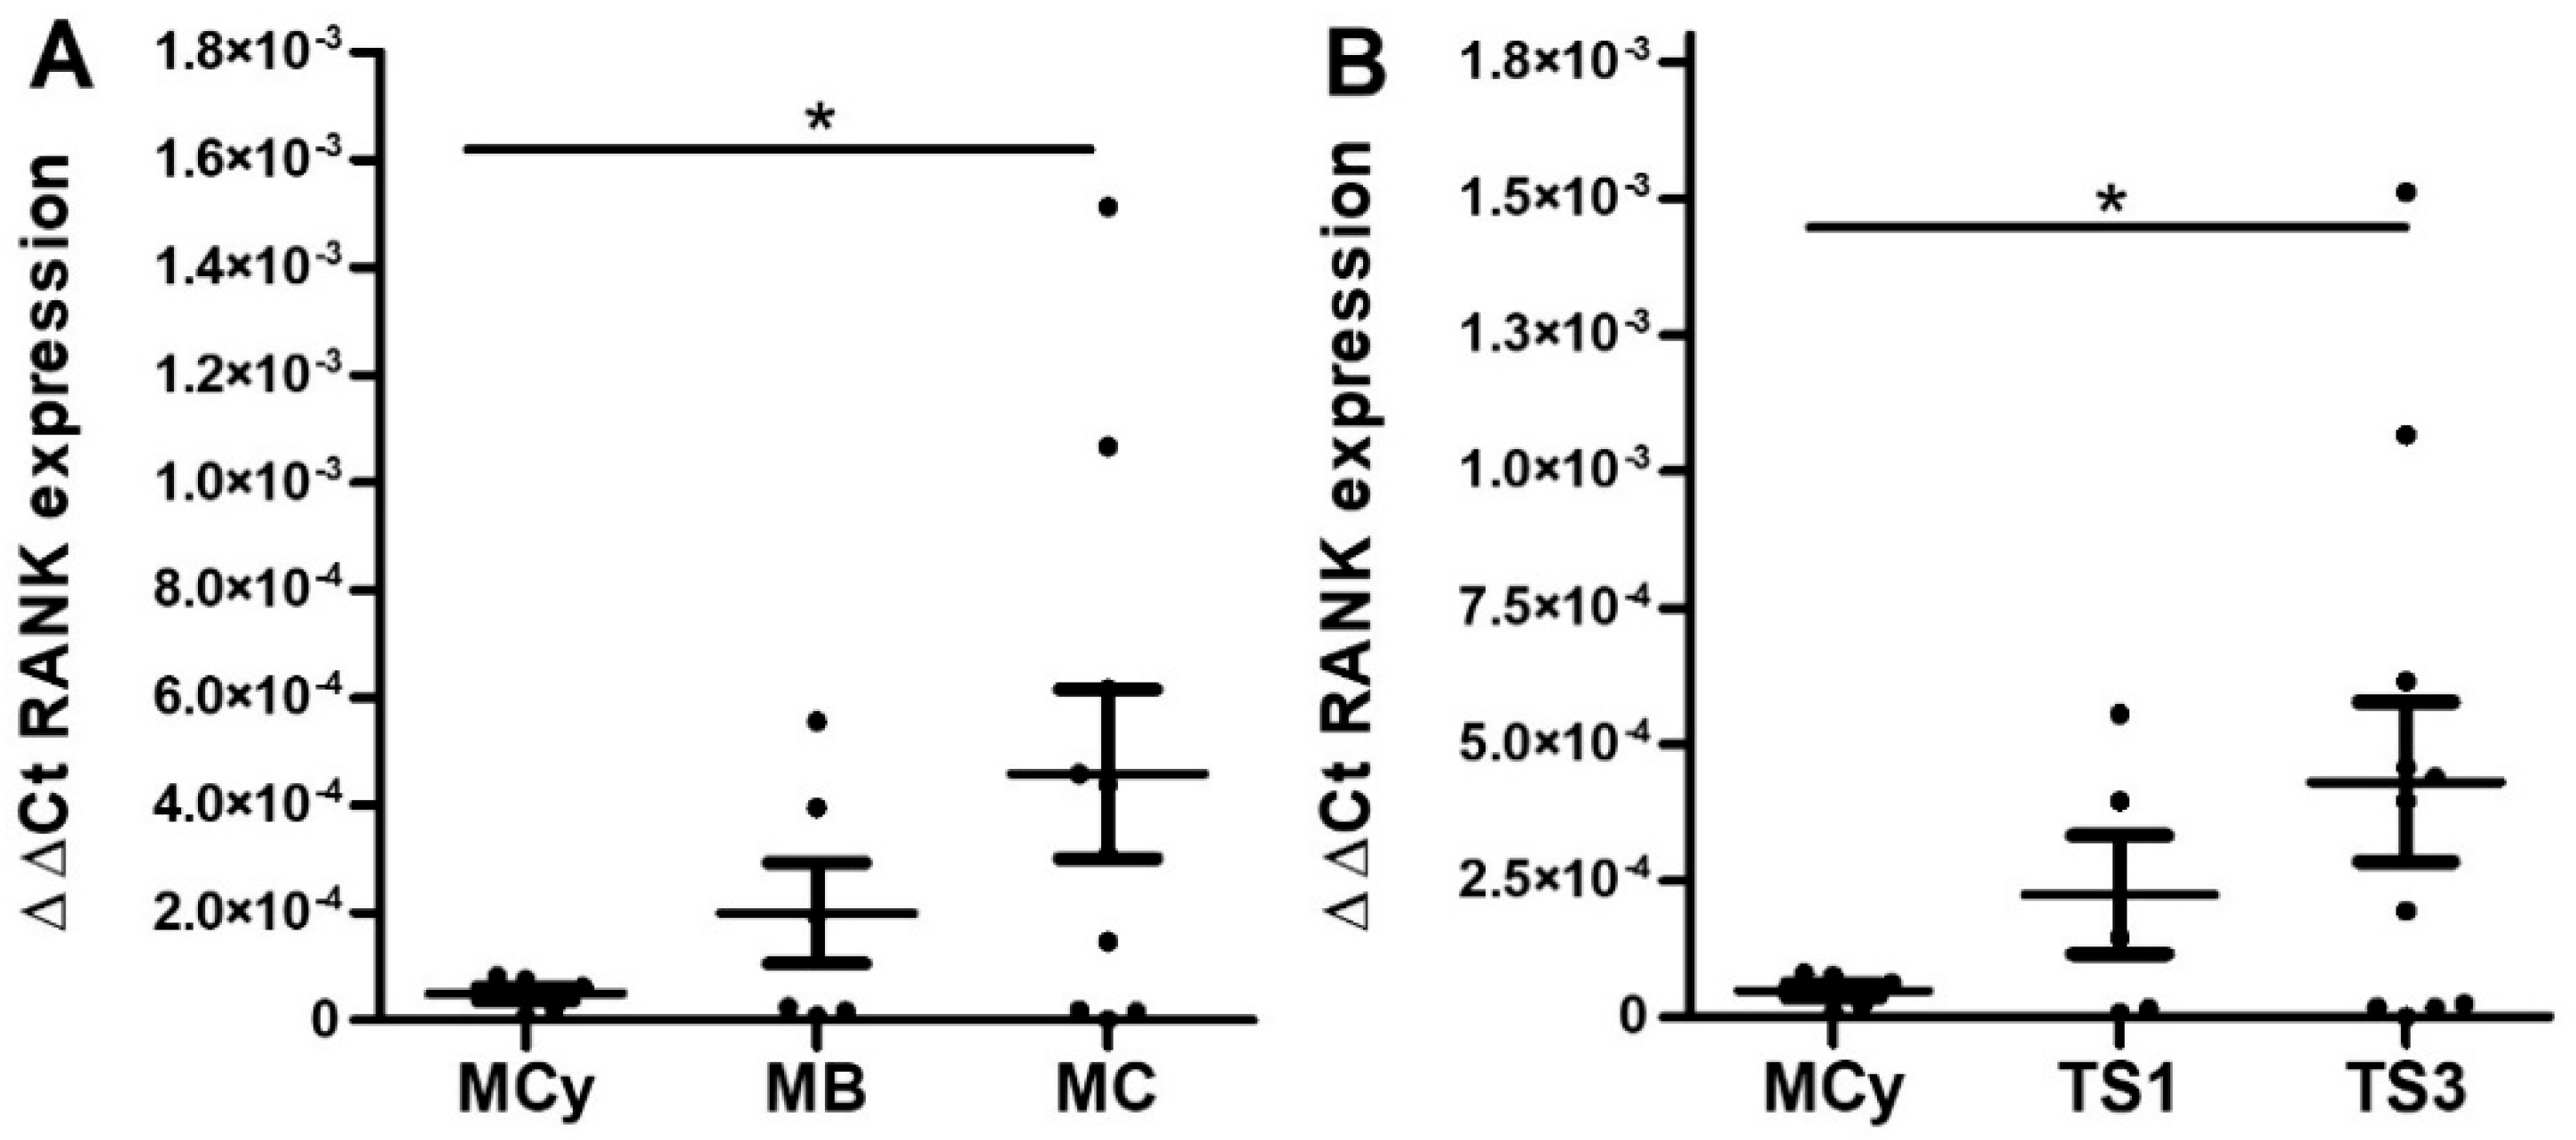
2.3. Mucinous EOC
2.3.1. Immunohistochemical Analyses
2.3.2. Quantitative RT-PCR Analyses
3. Discussion
4. Materials and Methods
4.1. Sample Description
4.2. Immunohistochemical Quantification of RANK Protein
4.2.1. Immunohistochemical Detection
4.2.2. Image Acquisition
4.2.3. RANK IHC Staining Signal Analysis
4.3. QF-RT-PCR Quantification of Wildtype and Truncated RANK mRNA Isoforms
4.4. Statistics and Figure Representation
Supplementary Materials
Author Contributions
Funding
Institutional Review Board Statement
Informed Consent Statement
Data Availability Statement
Conflicts of Interest
References
- Lheureux, S.; Gourley, C.; Vergote, I.; Oza, A.M. Epithelial ovarian cancer. Lancet 2019, 393, 1240–1253. [Google Scholar] [CrossRef] [Green Version]
- Lheureux, S.; Braunstein, M.; Oza, A.M. Epithelial ovarian cancer: Evolution of management in the era of precision medicine. CA Cancer J. Clin. 2019, 69, 280–304. [Google Scholar] [CrossRef] [PubMed] [Green Version]
- Yang, W.L.; Lu, Z.; Bast, R.C. The role of biomarkers in the management of epithelial ovarian cancer. Expert. Rev. Mol. Diagn. 2017, 17, 577–591. [Google Scholar] [CrossRef] [PubMed]
- Cortez, A.J.; Tudrej, P.; Kujawa, K.A.; Lisowska, K.M. Advances in ovarian cancer therapy. Cancer Chemother. Pharmacol. 2018, 81, 17–38. [Google Scholar] [CrossRef] [PubMed] [Green Version]
- Hanada, R.; Hanada, T.; Penninger, J.M. Physiology and pathophysiology of the RANKL/RANK system. Biol. Chem. 2010, 391, 1365–1370. [Google Scholar] [CrossRef] [PubMed]
- Anderson, D.M.; Maraskovsky, E.; Billingsley, W.L.; Dougall, W.C.; Tometsko, M.E.; Roux, E.R.; Teepe, M.C.; DuBose, R.F.; Cosman, D.; Galibert, L. A homologue of the TNF receptor and its ligand enhance T-cell growth and dendritic-cell function. Nature 1997, 390, 175–179. [Google Scholar] [CrossRef]
- Rao, S.; Cronin, S.J.F.; Sigl, V.; Penniger, J.M. RANKL and RANK: From Mammalian Physiology to Cancer Treatment. Trends Cell. Biol. 2018, 28, 213–223. [Google Scholar] [CrossRef]
- Papanastasiou, A.D.; Sirinian, C.; Kalofonos, H.P. Identification of novel human receptor activator of nuclear factor-kB isoforms generated through alternative splicing: Implications in breast cancer cell survival and migration. Breast Cancer Res. 2012, 14, R112. [Google Scholar] [CrossRef] [PubMed] [Green Version]
- González-Suárez, E.; Sanz-Moreno, A. RANK as a therapeutic target in cancer. FEBS J. 2016, 283, 2018–2033. [Google Scholar] [CrossRef]
- Cummings, S.R.; San Martin, J.; McClung, M.R.; Siris, E.S.; Eastell, R.; Reid, I.R.; Delmas, P.; Zoog, H.B.; Austin, M.; Wang, A.; et al. Denosumab for prevention of fractures in postmenopausal women with osteoporosis. N. Engl. J. Med. 2009, 361, 756–765. [Google Scholar] [CrossRef] [Green Version]
- Matsumoto, T.; Endo, I. RANKL as a target for the treatment of osteoporosis. J. Bone Miner. Metab. 2020, 39, 91–105. [Google Scholar] [CrossRef] [PubMed]
- Renema, N.; Navet, B.; Heymann, M.F.; Lezot, F.; Heymann, D. RANK-RANKL signalling in cancer. Biosci. Rep. 2016, 36, e00366. [Google Scholar] [CrossRef] [PubMed] [Green Version]
- Coleman, R.; Finkelstein, D.M.; Barrios, C.; Martin, M.; Iwata, H.; Hegg, R.; Glaspy, J.; Montaño Periañez, A.; Tonkin, K.; Deleu, I.; et al. Adjuvant denosumab in early breast cancer (D-CARE): An international, multicentre, randomised, controlled, phase 3 trial. Lancet Oncol. 2020, 21, 60–72. [Google Scholar] [CrossRef]
- Simatou, A.; Sarantis, P.; Koustas, E.; Papavassiliou, A.G.; Karamouzis, M.V. The Role of the RANKL/RANK Axis in the Prevention and Treatment of Breast Cancer with Immune Checkpoint Inhibitors and Anti-RANKL. Int. J. Mol. Sci. 2020, 21, 7570. [Google Scholar] [CrossRef] [PubMed]
- Ming, J.; Cronin, S.J.F.; Penninger, J.M. Targeting the RANKL/RANK/OPG Axis for Cancer Therapy. Front. Oncol. 2020, 10, 1283. [Google Scholar] [CrossRef]
- Gómez, R.; Castro, A.; Martínez, J.; Rodríguez-García, V.; Burgués, O.; Tarín, J.J.; Cano, A. Receptor Activator of Nuclear Factor Kappa B (RANK) and Clinicopathological Variables in Endometrial Cancer: A Study at Protein and Gene Level. Int. J. Mol. Sci. 2018, 19, 1848. [Google Scholar] [CrossRef] [Green Version]
- Wang, J.; Liu, Y.; Wang, L.; Sun, X.; Wang, Y. Clinical prognostic significance and pro-metastatic activity of RANK/RANKL via the AKT pathway in endometrial cancer. Oncotarget 2016, 7, 5564–5575. [Google Scholar] [CrossRef] [Green Version]
- Gregori, E.; Rodríguez-García, V.; Martínez, J.; Burgués, O.; Tarín, J.J.; Cano, A.; Gómez, R. Differential expression of receptor activator of nuclear factor kappa B in healthy endometrium, ovarian endometrioma, and endometrioid ovarian cancer. Am. J. Obstet. Gynecol. 2020, 222, 279–281. [Google Scholar] [CrossRef]
- Herreros-Villanueva, M.; Chen, C.C.; Tsai, E.M.; Er, T.K. Endometriosis-associated ovarian cancer: What have we learned so far? Clin. Chim. Acta. 2019, 493, 63–72. [Google Scholar] [CrossRef]
- Wieser, V.; Sprung, S.; Tsibulak, I.; Haybaeck, J.; Hackl, H.; Fiegl, H.; Marth, C.; Zeimet, A.C. Clinical Impact of RANK Signalling in Ovarian Cancer. Cancers 2019, 11, 791. [Google Scholar] [CrossRef] [Green Version]
- Chen, L.; Kashina, A. Post-translational Modifications of the Protein Termini. Front. Cell Dev. Biol. 2021, 9, 719590. [Google Scholar] [CrossRef] [PubMed]
- Audagnotto, M.; Dal Peraro, M. Protein post-translational modifications: In silico prediction tools and molecular modeling. Comput. Struct. Biotechnol. J. 2017, 15, 307–319. [Google Scholar] [CrossRef] [PubMed]
- Sirinian, C.; Papanastasiou, A.D.; Schizas, M.; Spella, M.; Stathopoulos, G.T.; Repanti, M.; Zarkadis, I.K.; King, T.A.; Kalofonos, H.P. RANK-c attenuates aggressive properties of ER-negative breast cancer by inhibiting NF-κB activation and EGFR signaling. Oncogene 2018, 37, 5101–5114. [Google Scholar] [CrossRef]
- Pfitzner, B.M.; Branstetter, D.; Loibl, S.; Denkert, C.; Lederer, B.; Schmitt, W.D.; Dombrowski, F.; Werner, M.; Rüdiger, T.; Dougall, W.C.; et al. RANK expression as a prognostic and predictive marker in breast cancer. Breast Cancer Res. Treat. 2014, 145, 307–315. [Google Scholar] [CrossRef]
- Park, H.S.; Lee, A.; Chae, B.J.; Bae, J.S.; Song, B.J.; Jung, S.S. Expression of receptor activator of nuclear factor kappa-B as a poor prognostic marker in breast cancer. J. Surg. Oncol. 2014, 110, 807–812. [Google Scholar] [CrossRef] [PubMed]
- Santini, D.; Schiavon, G.; Vincenzi, B.; Gaeta, L.; Pantano, F.; Russo, A.; Ortega, C.; Porta, C.; Galluzzo, S.; Armento, G. Receptor activator of NF-kB (RANK) expression in primary tumors associates with bone metastasis occurrence in breast cancer patients. PLoS ONE 2011, 6, e19234. [Google Scholar] [CrossRef] [PubMed] [Green Version]
- Liu, Y.; Wang, J.; Ni, T.; Wang, L.; Wang, Y.; Sun, X. 2CCL20 mediates RANK/RANKL-induced epithelial-mesenchymal transition in endometrial cancer cells. Oncotarget 2016, 7, 25328–25339. [Google Scholar] [CrossRef] [PubMed] [Green Version]
- Gonzalez-Suarez, E.; Jacob, A.P.; Jones, J.; Miller, R.; Roudier-Meyer, M.P.; Erwert, R.; Pinkas, J.; Branstetter, D.; Dougall, W.C. RANK ligand mediates progestin-induced mammary epithelial proliferation and carcinogenesis. Nature 2010, 468, 103–107. [Google Scholar] [CrossRef]
- Beral, V.; Bull, D.; Reeves, G. Million Women Study Collaborators. Endometrial cancer and hormone-replacement therapy in the Million Women Study. Lancet 2005, 365, 1543–1551. [Google Scholar] [CrossRef]
- Mungenast, F.; Thalhammer, T. Estrogen biosynthesis and action in ovarian cancer. Front. Endocrinol. 2014, 5, 192. [Google Scholar] [CrossRef] [Green Version]
- Modugno, F.; Laskey, R.; Smith, A.L.; Andersen, C.L.; Haluska, P.; Oesterreich, S. Hormone response in ovarian cancer: Time to reconsider as a clinical target? Endocr. Relat. Cancer 2012, 19, R255–R2579. [Google Scholar] [CrossRef] [PubMed] [Green Version]
- Schüler, S.; Ponnath, M.; Engel, J.; Ortmann, O. Ovarian epithelial tumors and reproductive factors: A systematic review. Arch. Gynecol. Obstet. 2013, 287, 1187–1204. [Google Scholar] [CrossRef] [PubMed]
- Sigl, V.; Owusu-Boaitey, K.; Joshi, P.A.; Kavirayani, A.; Wirnsberger, G.; Novatchkova, M.; Kozieradzki, I.; Schramek, D.; Edokobi, N.; Hersl, J.; et al. RANKL/RANK control BRCA1 mutation-driven mammary tumors. Cell Res. 2016, 26, 761–774. [Google Scholar] [CrossRef] [PubMed] [Green Version]
- Jones, D.H.; Nakashima, T.; Sanchez, O.H.; Kozieradzki, I.; Komarova, S.V.; Sarosi, I.; Morony, S.; Rubin, E.; Sarao, R.; Hojilla, C.V.; et al. Regulation of cancer cell migration and bone metastasis by RANKL. Nature 2006, 440, 692–696. [Google Scholar] [CrossRef] [Green Version]
- Kurman, R.J.; Carcangiu, M.L.; Herrington, C.S.; Young, R.H. WHO Classification of Tumors of Female Reproductive Organs; International Agency for Research on Cancer: Lyon, France, 2014.


| Serous | Endometrioid | Mucinous | ||||||||||
|---|---|---|---|---|---|---|---|---|---|---|---|---|
| Low | High | |||||||||||
| Benign | 9 | 11 | 9 | |||||||||
| Borderline | TS1 | TS2 | TS3 | 0 | TS1 | TS2 | TS3 | |||||
| 10 | 3 | 1 | 8 | 1 | 0 | |||||||
| Malignant | TS1 | TS2 | TS3 | TS1 | TS2 | TS3 | TS1 | TS2 | TS3 | TS1 | TS2 | TS3 |
| 8 | 3 | 8 | 10 | 5 | 7 | 17 | 8 | 7 | 6 | 4 | 0 | |
| Serous | Endometrioid | Mucinous | ||||||||||
|---|---|---|---|---|---|---|---|---|---|---|---|---|
| Low | High | |||||||||||
| Benign | 9 | 11 | 6 | |||||||||
| Borderline | TS1 | TS2 | TS3 | 0 | TS1 | TS2 | TS3 | |||||
| 3 | 2 | 2 | 2 | 0 | 4 | |||||||
| Malignant | TS1 | TS2 | TS3 | TS1 | TS2 | TS3 | TS1 | TS2 | TS3 | TS1 | TS2 | TS3 |
| 2 | 2 | 26 | 2 | 5 | 19 | 14 | 3 | 7 | 3 | 0 | 7 | |
Publisher’s Note: MDPI stays neutral with regard to jurisdictional claims in published maps and institutional affiliations. |
© 2022 by the authors. Licensee MDPI, Basel, Switzerland. This article is an open access article distributed under the terms and conditions of the Creative Commons Attribution (CC BY) license (https://creativecommons.org/licenses/by/4.0/).
Share and Cite
Gomez, R.; Tejada, M.Á.; Rodríguez-García, V.; Burgués, O.; Santos-Llamas, A.I.; Martínez-Massa, A.; Marín-Montes, A.; Tarín, J.J.; Cano, A. Histological Grade and Tumor Stage Are Correlated with Expression of Receptor Activator of Nuclear Factor Kappa b (Rank) in Epithelial Ovarian Cancers. Int. J. Mol. Sci. 2022, 23, 1742. https://doi.org/10.3390/ijms23031742
Gomez R, Tejada MÁ, Rodríguez-García V, Burgués O, Santos-Llamas AI, Martínez-Massa A, Marín-Montes A, Tarín JJ, Cano A. Histological Grade and Tumor Stage Are Correlated with Expression of Receptor Activator of Nuclear Factor Kappa b (Rank) in Epithelial Ovarian Cancers. International Journal of Molecular Sciences. 2022; 23(3):1742. https://doi.org/10.3390/ijms23031742
Chicago/Turabian StyleGomez, Raul, Miguel Á. Tejada, Víctor Rodríguez-García, Octavio Burgués, Ana I. Santos-Llamas, Andrea Martínez-Massa, Antonio Marín-Montes, Juan J. Tarín, and Antonio Cano. 2022. "Histological Grade and Tumor Stage Are Correlated with Expression of Receptor Activator of Nuclear Factor Kappa b (Rank) in Epithelial Ovarian Cancers" International Journal of Molecular Sciences 23, no. 3: 1742. https://doi.org/10.3390/ijms23031742
APA StyleGomez, R., Tejada, M. Á., Rodríguez-García, V., Burgués, O., Santos-Llamas, A. I., Martínez-Massa, A., Marín-Montes, A., Tarín, J. J., & Cano, A. (2022). Histological Grade and Tumor Stage Are Correlated with Expression of Receptor Activator of Nuclear Factor Kappa b (Rank) in Epithelial Ovarian Cancers. International Journal of Molecular Sciences, 23(3), 1742. https://doi.org/10.3390/ijms23031742