Article

Analysis of mRNA and Protein Levels of CAP2, DLG1 and ADAM10 Genes in Post-Mortem Brain of Schizophrenia, Parkinson’s and Alzheimer’s Disease Patients

1
Laboratory of Translational Neuroscience, CEINGE Biotecnologie Avanzate, 80145 Naples, Italy
2
Department of Experimental Medicine, Sapienza University of Rome, 00185 Rome, Italy
3
Department of Pharmacological and Biomolecular Sciences (DiSFeB), University of Milan, 20133 Milan, Italy
4
Department of Environmental, Biological and Pharmaceutical Science and Technologies, Università degli Studi della Campania “Luigi Vanvitelli”, 81100 Caserta, Italy
5
Department of Agricultural Sciences, University of Naples “Federico II”, 80055 Naples, Italy
6
Section of Psychiatry Laboratory of Molecular and Translational Psychiatry, Department of Neuroscience, Reproductive Science and Odontostomatology, School of Medicine, University “Federico II”, 80131 Naples, Italy
*
Authors to whom correspondence should be addressed.
These authors contributed equally to this work.
Int. J. Mol. Sci. 2022, 23(3), 1539; https://doi.org/10.3390/ijms23031539
Submission received: 1 December 2021 / Revised: 25 January 2022 / Accepted: 26 January 2022 / Published: 28 January 2022
(This article belongs to the Special Issue Molecular Mechanisms of Schizophrenia and Novel Targets)

Abstract

:
Schizophrenia (SCZ) is a mental illness characterized by aberrant synaptic plasticity and connectivity. A large bulk of evidence suggests genetic and functional links between postsynaptic abnormalities and SCZ. Here, we performed quantitative PCR and Western blotting analysis in the dorsolateral prefrontal cortex (DLPFC) and hippocampus of SCZ patients to investigate the mRNA and protein expression of three key spine shapers: the actin-binding protein cyclase-associated protein 2 (CAP2), the sheddase a disintegrin and metalloproteinase 10 (ADAM10), and the synapse-associated protein 97 (SAP97). Our analysis of the SCZ post-mortem brain indicated increased DLG1 mRNA in DLPFC and decreased CAP2 mRNA in the hippocampus of SCZ patients, compared to non-psychiatric control subjects, while the ADAM10 transcript was unaffected. Conversely, no differences in CAP2, SAP97, and ADAM10 protein levels were detected between SCZ and control individuals in both brain regions. To assess whether DLG1 and CAP2 transcript alterations were selective for SCZ, we also measured their expression in the superior frontal gyrus of patients affected by neurodegenerative disorders, like Parkinson’s and Alzheimer’s disease. Interestingly, also in Parkinson’s disease patients, we found a selective reduction of CAP2 mRNA levels relative to controls but unaltered protein levels. Taken together, we reported for the first time altered CAP2 expression in the brain of patients with psychiatric and neurological disorders, thus suggesting that aberrant expression of this gene may contribute to synaptic dysfunction in these neuropathologies.

1. Introduction

Schizophrenia (SCZ) is a polygenic and multifactorial disorder with complex phenotypes encompassing multiple domains, such as delusions and hallucinations (positive symptoms), avolition, anhedonia, lack of social interaction (negative symptoms), and deficit of executive functions (cognitive symptoms) [1,2]. SCZ has been conceptualized as a neurodevelopmental disorder [3,4] affecting synaptic plasticity [4] and cortical–subcortical connectome. Dendritic spines are critical elements of brain circuits since they establish most excitatory synapses. The tip of dendritic spines contains a disk-shaped structure, named the postsynaptic density (PSD), that is believed to be deranged in SCZ [5,6]. The PSD is constituted of approximately 1500 molecules including glutamate receptors, scaffolding proteins, adhesion molecules, and enzymes. Therefore, the PSD has also been recognized as a structural and functional hub [7], responsible for postsynaptic signaling and synaptic plasticity. The molecules of the PSD are believed to be grouped in nanoclusters around a few proteins and organized dynamically by phase separation [8]. Dendritic spines are highly dynamic elements and have the capacity to undergo structural changes that are tightly coordinated with synaptic function and modifications in glutamate receptors [9]. Remarkably, the morphological alterations of spines are considered as the structural basis for learning and encoding memories [10,11]. In line with the glutamatergic hypothesis of SCZ, a significant reduction in spine density has been identified within the dorsolateral prefrontal cortex (DLPFC) and hippocampus of patients affected by this mental illness [12]. This view is reinforced by structural imaging studies of SCZ patients showing smaller whole brain volumes, such as a reduction of the prefrontal cortex (PFC) [13,14] and the hippocampus [15,16]. The essential elements that control dendritic spine shape and its remodeling in response to plasticity are the actin cytoskeleton [17] and the cell adhesion molecules, which comprise a diverse set of proteins working as trans-synaptic anchors [18]. The actin cytoskeleton dynamics are orchestrated by the coordinated activity of actin-binding proteins [19,20], while cell adhesion molecules are subject to ectodomain shedding, a process that modifies pre- and postsynaptic contacts and mediates activity-dependent signaling [21,22]. Consistent with the main role of such pathways in regulating dendritic spine morphology and functions, here we investigated within DLPFC and hippocampus of SCZ brains, the expression levels of three synaptic elements that can be regarded as key spine shapers: the actin-binding protein cyclase-associated protein 2 (CAP2) [23], the sheddase a disintegrin and metalloproteinase 10 (ADAM10), and its binding partner the synapse-associated protein 97 (SAP97) [24], responsible for the trafficking of ADAM10 and glutamate receptor subunits to the synaptic membrane [25]. In addition, we investigated whether the mRNA and protein expression of CAP2, SAP97, and ADAM10 are also affected in patients with neurodegenerative disorders such as Parkinson’s Disease (PD) and Alzheimer’s Disease (AD), which are also characterized by spine defects.

2. Results

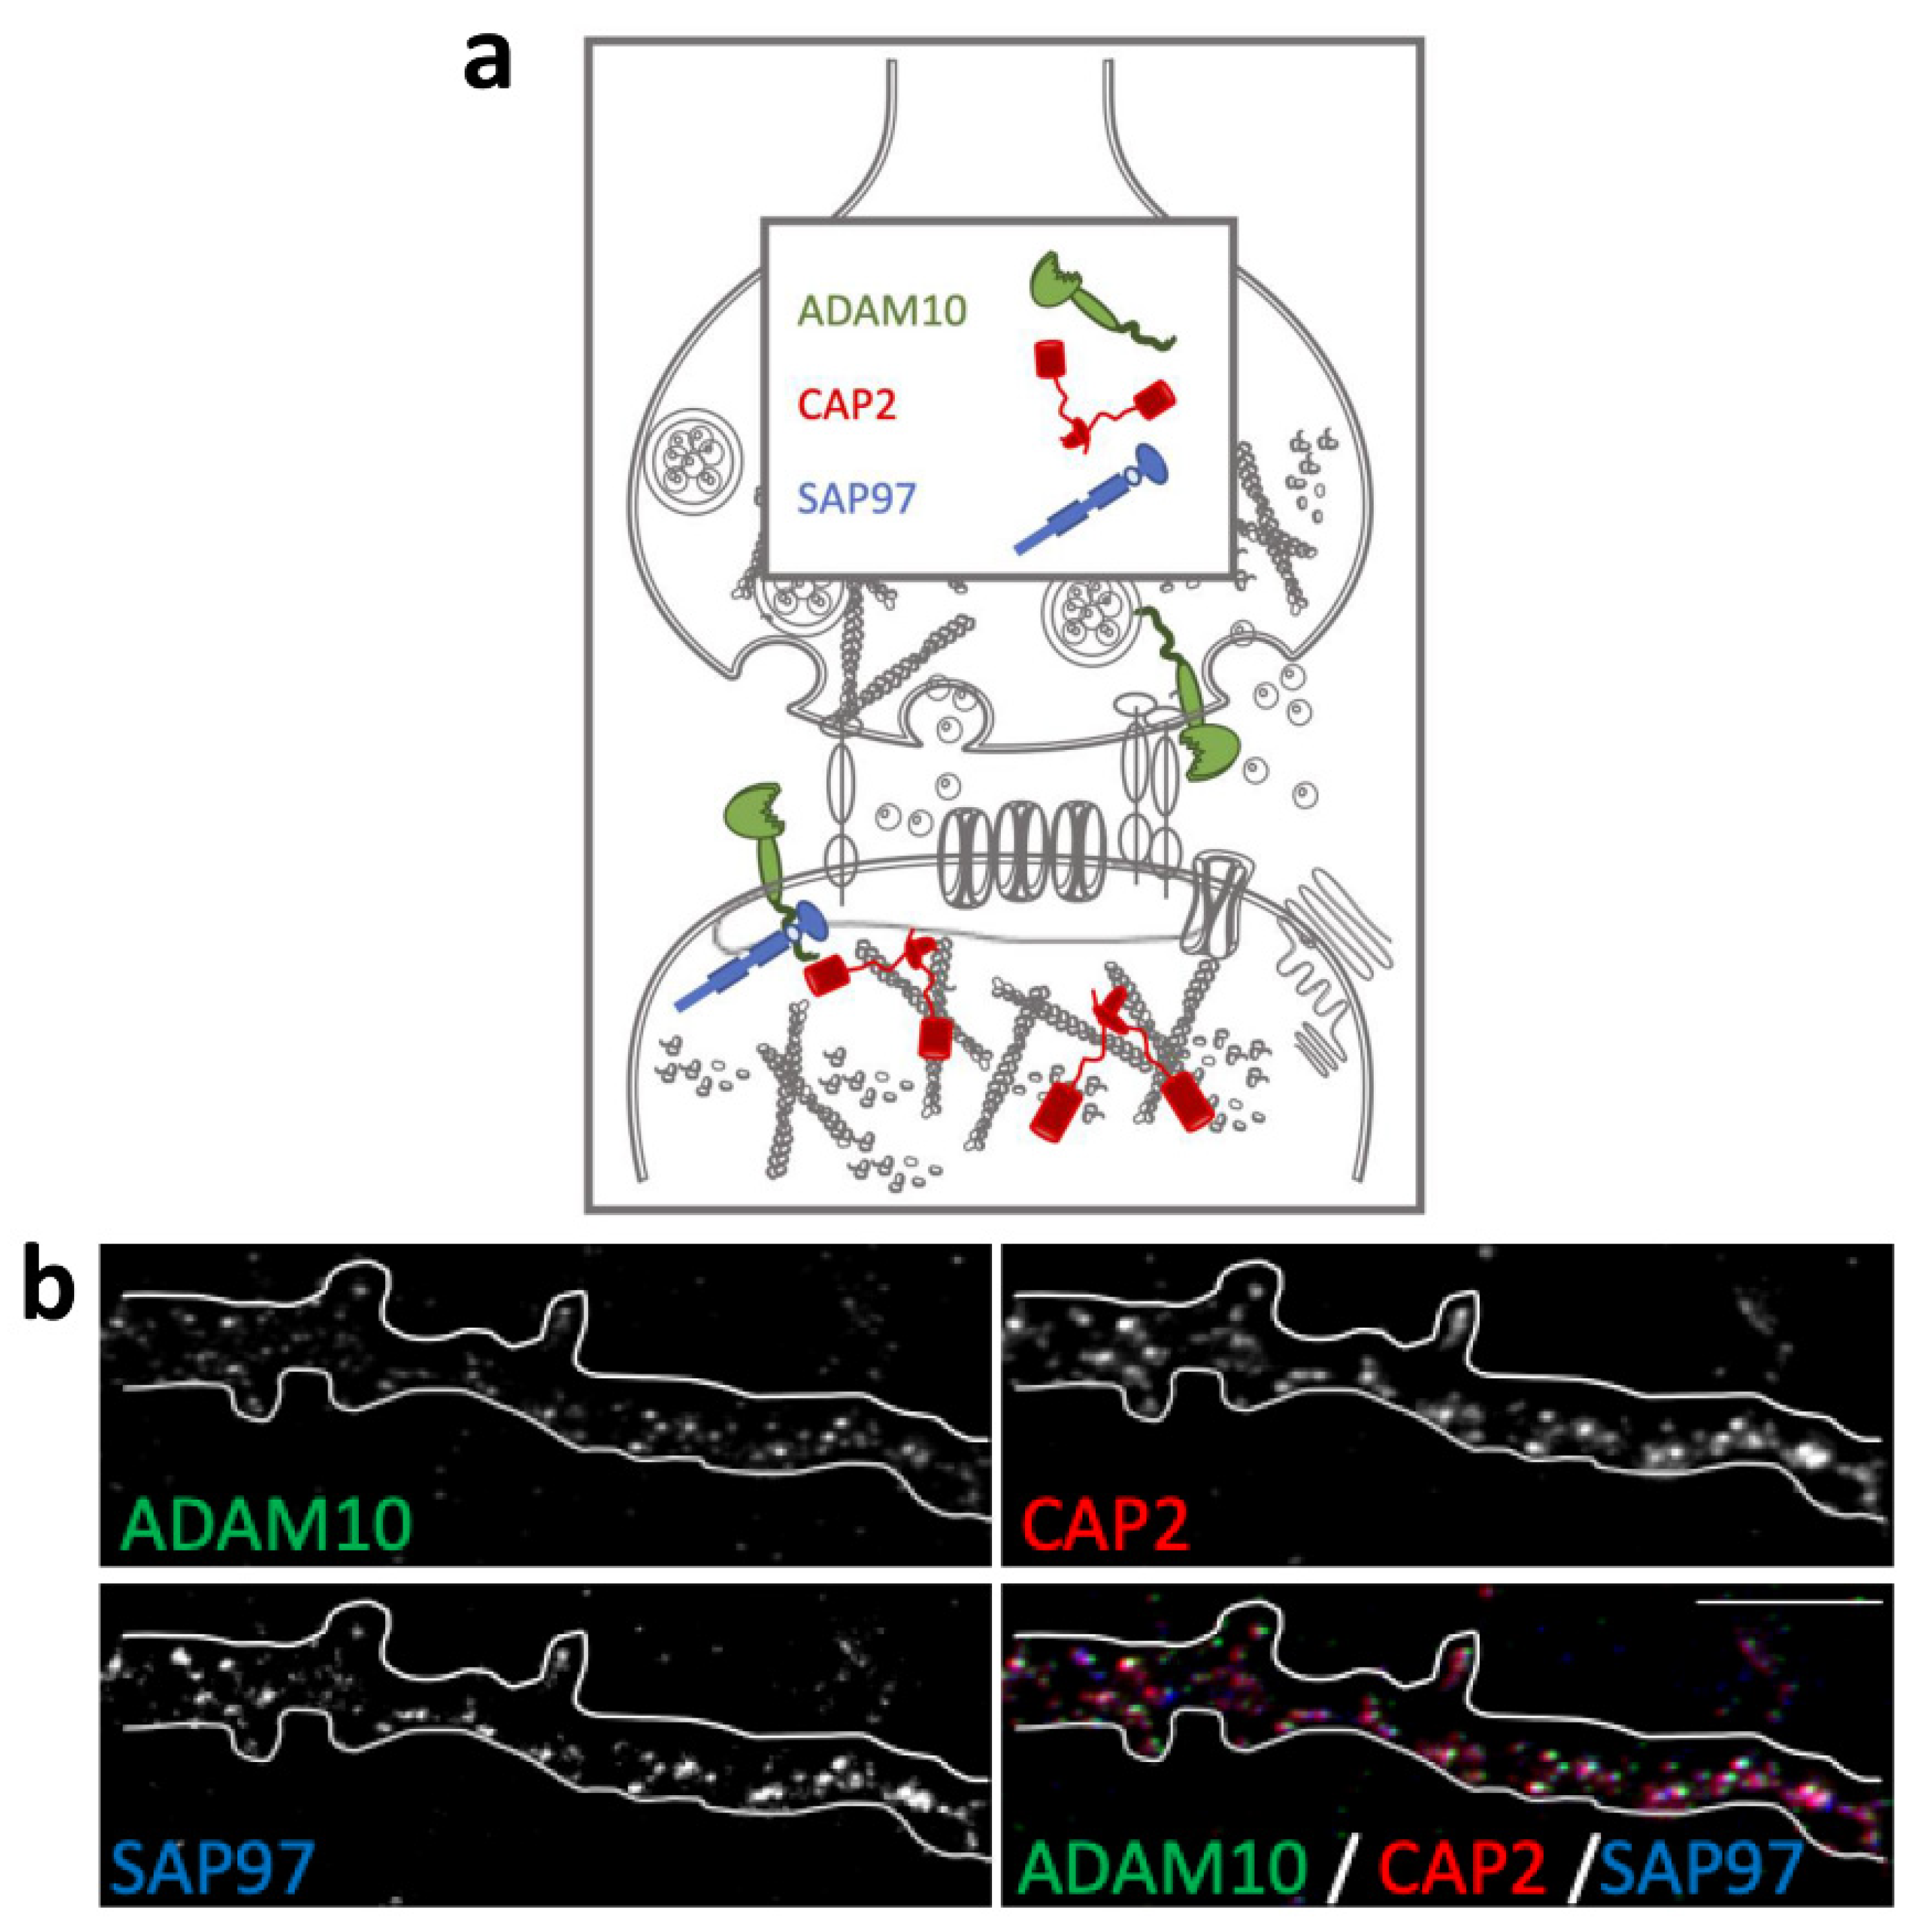
2.1. Colocalization of CAP2, SAP97, and ADAM10 in Primary Hippocampal Neurons

The actin-binding proteins CAP2, ADAM10, and its binding partner SAP97 are synaptic proteins enriched in the postsynaptic compartment (Figure 1a) and their synaptic localization is finely modulated by activity-dependent synaptic plasticity [23,26]. To assess their colocalization in dendritic spines, we performed an immunocytochemistry experiment in primary hippocampal neuronal cultures. As shown in Figure 1b, the staining revealed that the spine shapers are localized along dendrites and in dendritic spines, where they colocalize in the head of the spines.

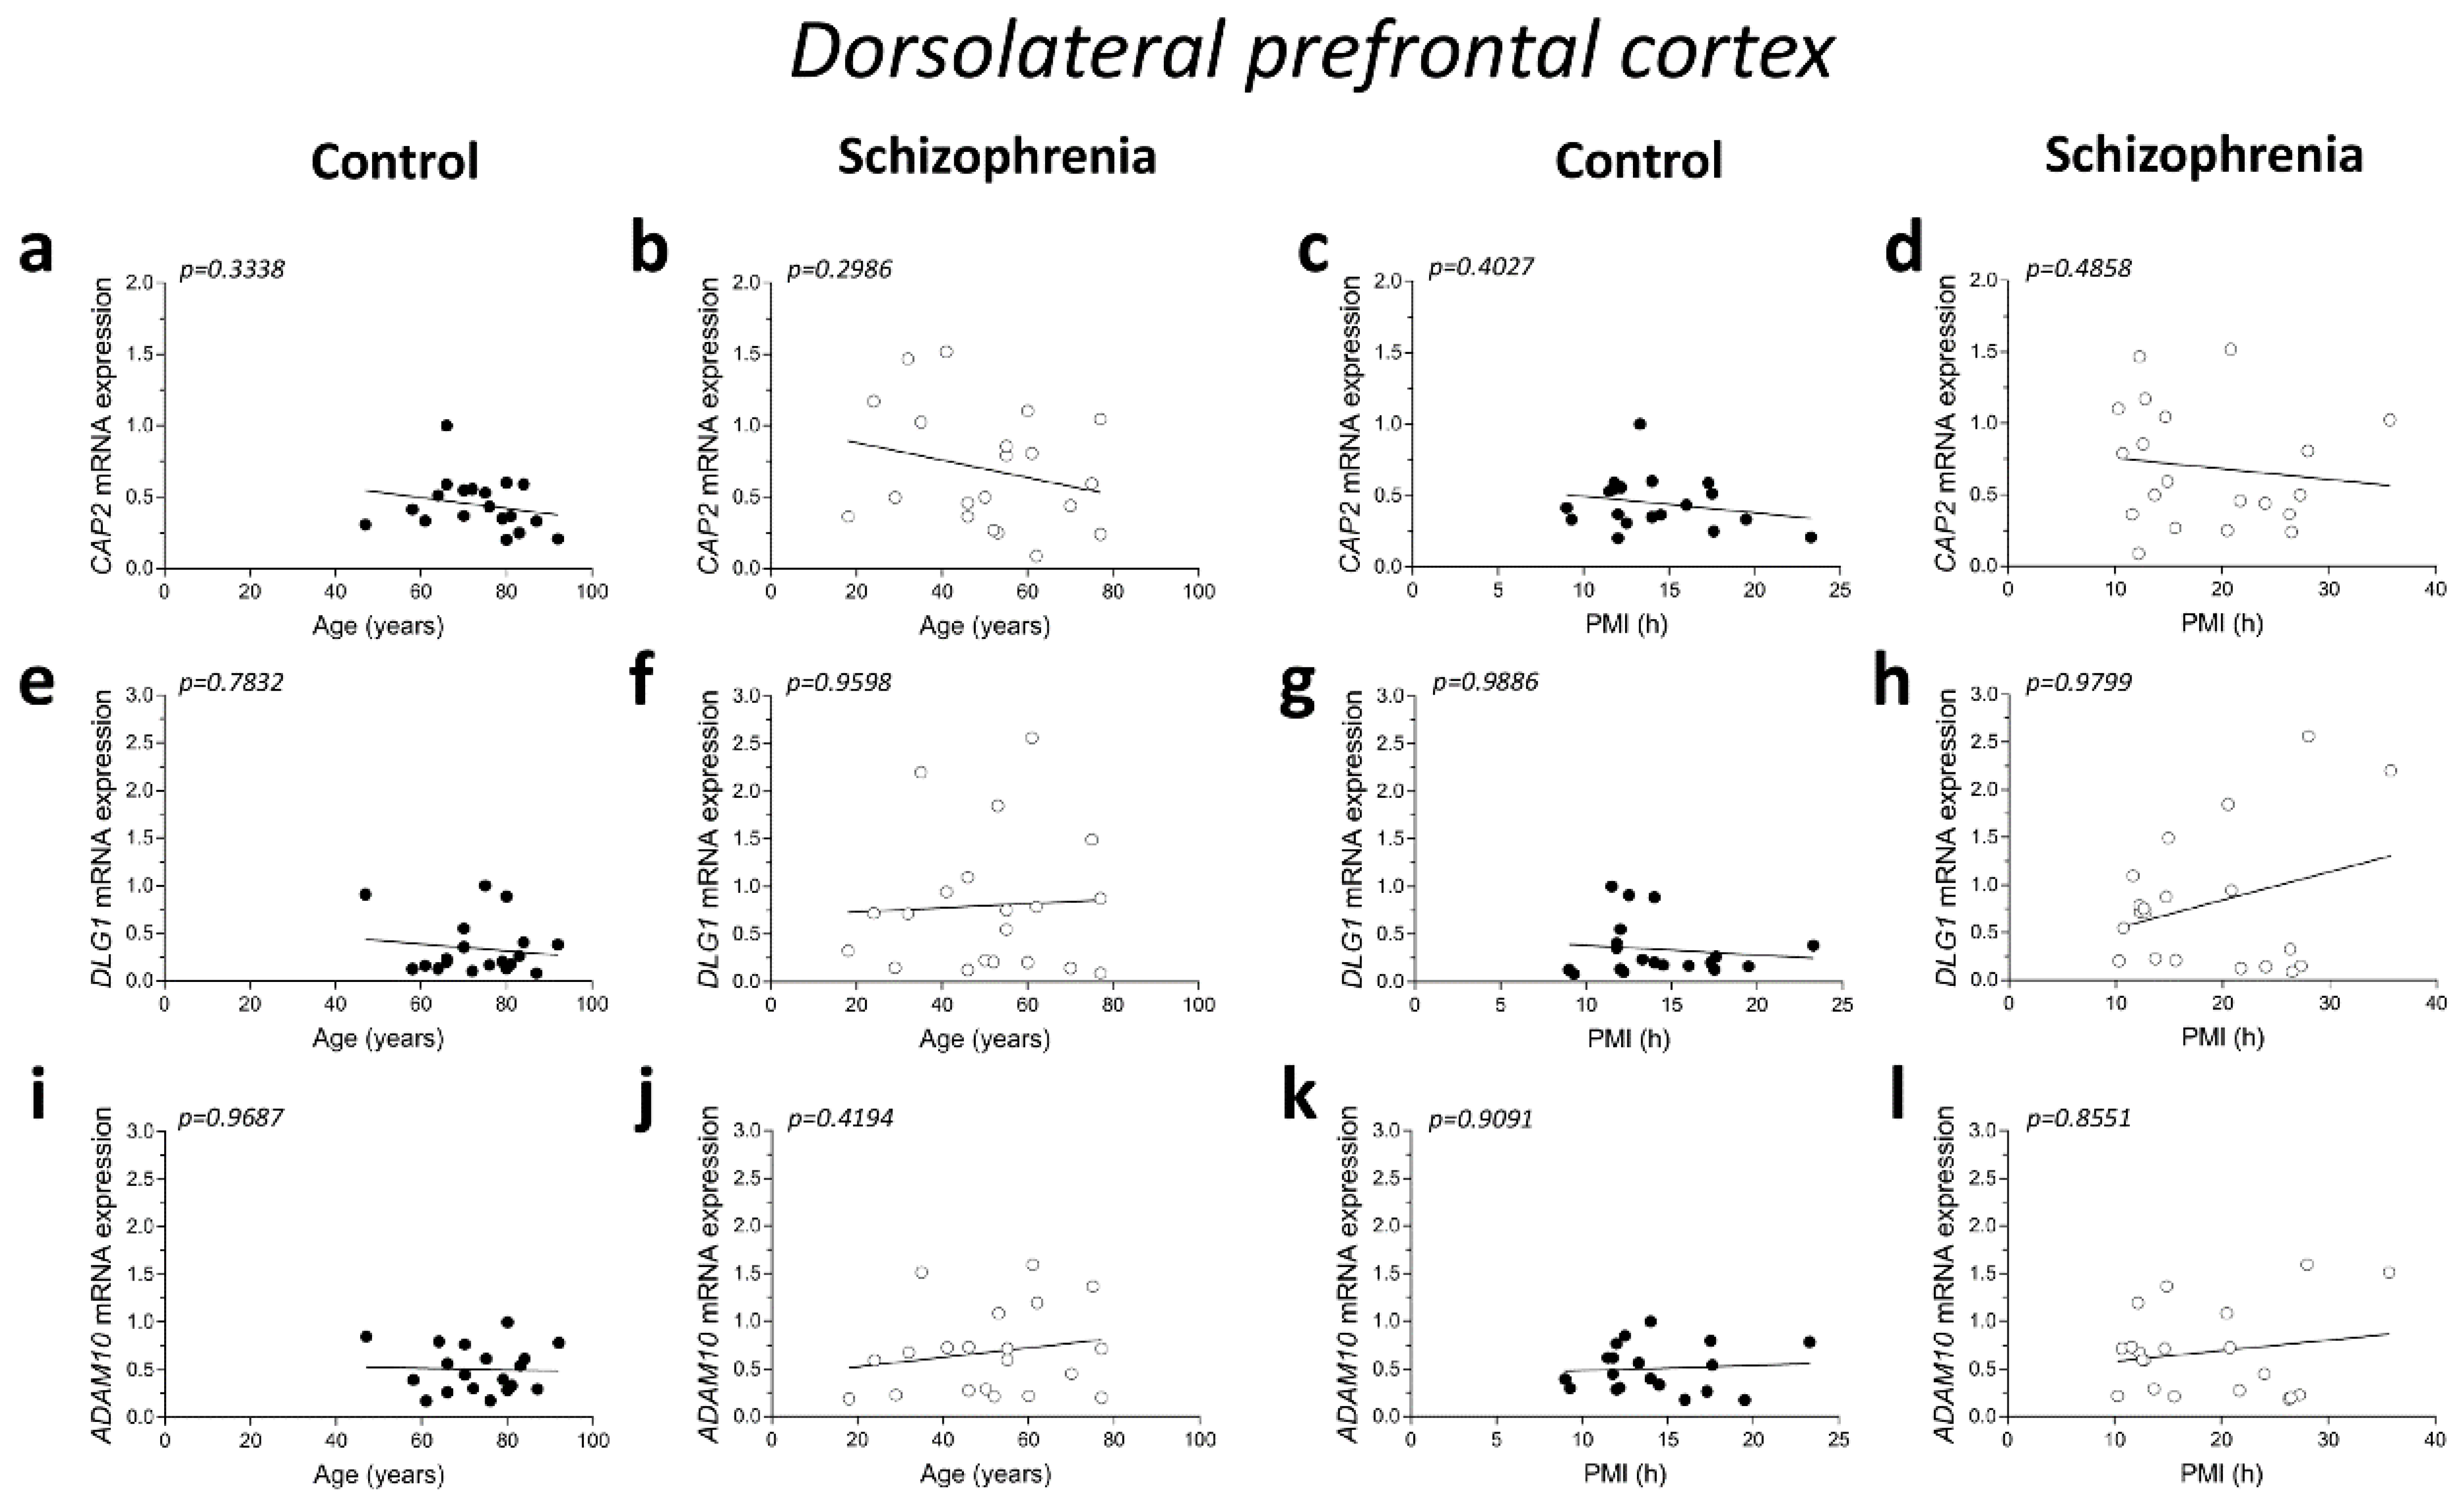
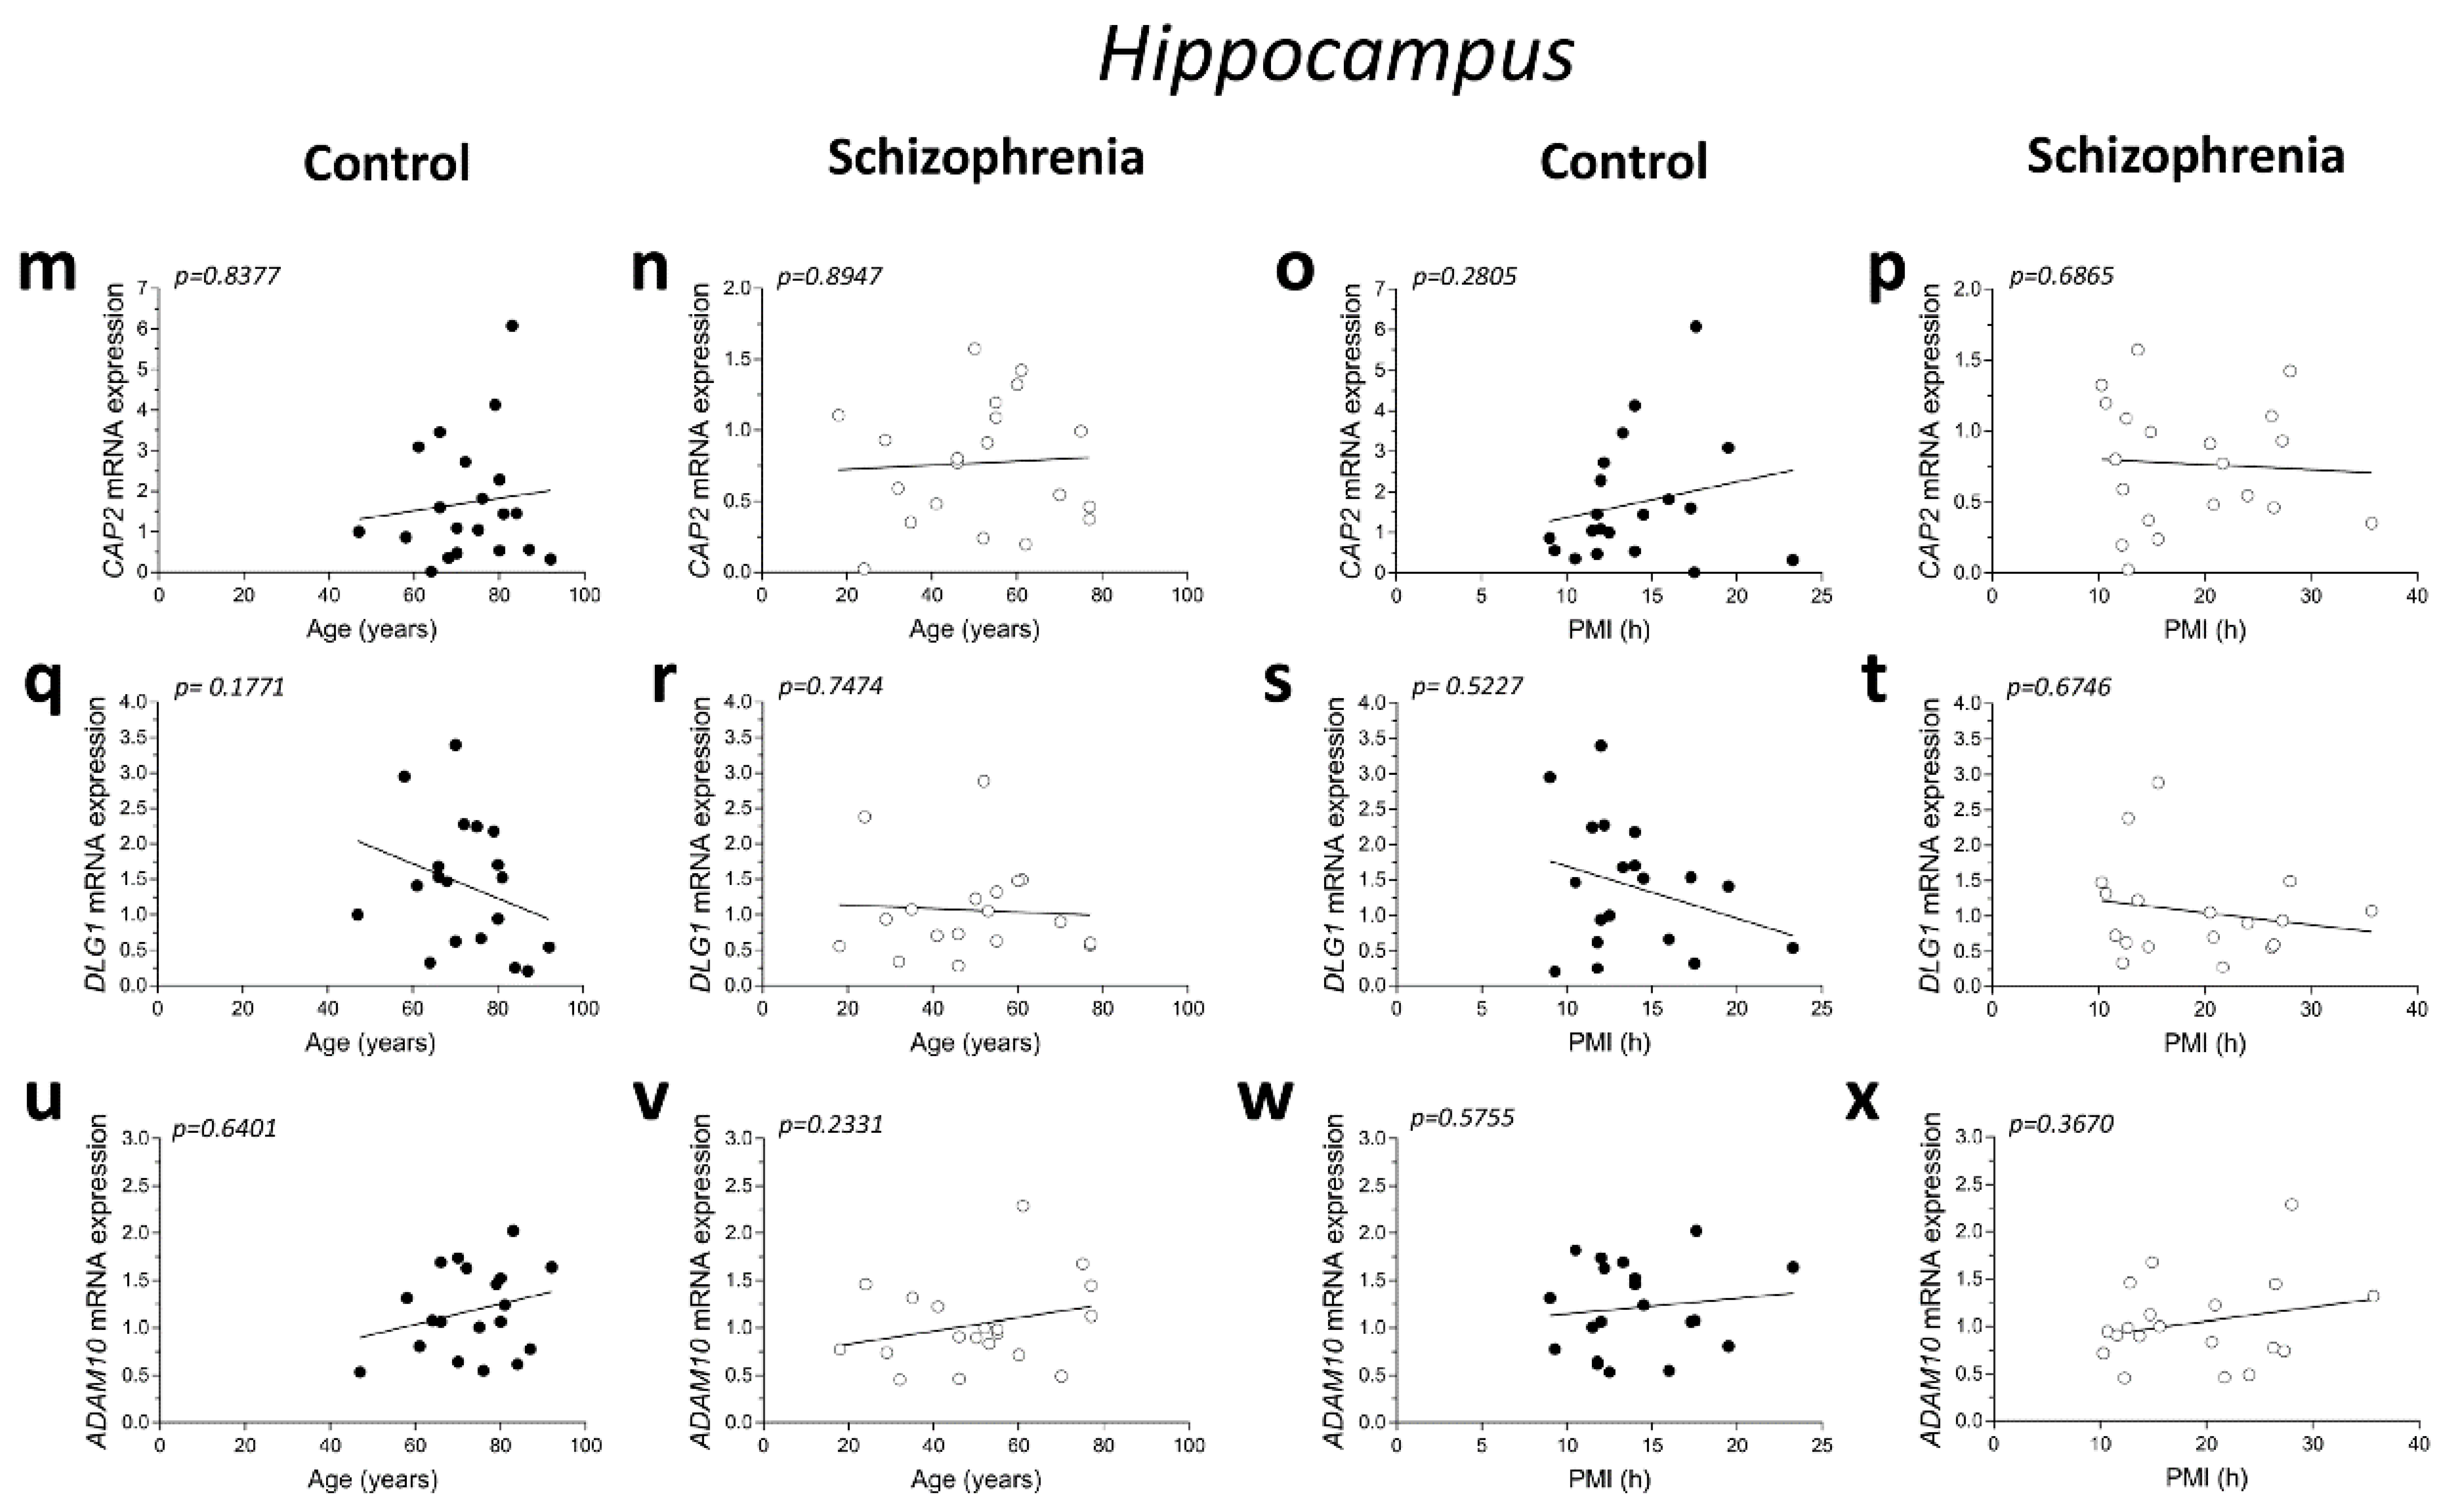
2.2. Correlation Analysis of CAP2, DLG1, and ADAM10 mRNA Expression with Age and PMI in the Post-Mortem Dorsolateral Prefrontal Cortex and Hippocampus of Schizophrenia Patients

Here we investigated the correlations between CAP2, DLG1 (encoding SAP97 protein), and ADAM10 mRNA expression with demographic and post-mortem storage characteristics such as age and PMI, respectively (Table 1).
No significant correlations were found between mRNA expression and age in the DLPFC of both control and SCZ patients (CAP2 CTRL: r = −0.2345; p = 0.3338; n = 19; CAP2 SCZ: r = −0.2446; p = 0.2986; n = 20; DLG1 CTRL: r = 0.06763; p = 0.7832; n = 19; DLG1 SCZ: r = 0.01204; p = 0.9598; n = 20; ADAM10 CTRL: r = 0.009662; p = 0.9687; n = 19; ADAM10 SCZ: r = 0.1912; p = 0.4194; n = 20; Spearman correlation) (Figure 2a,b,e,f,i,j). Next, we investigated whether the mRNA levels correlated with PMI. Overall, qPCR results showed that CAP2, DLG1, and ADAM10 transcript levels did not significantly change with PMI in the DLPFC of controls (CAP2: r = −0.2038; p = 0.4027; n = 19; DLG1: r = 0.003513; p = 0.9886; n = 19; ADAM10: r = −0.02811; p = 0.9091; n = 19; Spearman correlation) (Figure 2c,g,k) as well as in SCZ patients (CAP2: r = −0.1654; p = 0.4858; n = 20; DLG1: r = −0.006015; p = 0.9799; n = 20; ADAM10: r = −0.04361; p = 0.8551; n = 20; Spearman correlation) (Figure 2d,h,l).
Additionally, in the hippocampus we failed to find significant correlation between CAP2, DLG1, and ADAM10 mRNA and age in SCZ patients and non-psychiatric controls (CAP2 CTRL: r = 0.04893; p = 0.8377; n = 20; CAP2 SCZ: r = 0.03161; p = 0.8947; n = 20; DLG1 CTRL: r = −0.3232; p = 0.1771; n = 19; DLG1 SCZ: r = 0.08165; p = 0.7474; n = 18; ADAM10 CTRL: r = 0.1114; p = 0.6401; n = 20; ADAM10 SCZ: r = 0.2872; p = 0.2331; n = 19; Spearman correlation) (Figure 2m,n,q,r,u,v). Moreover, we failed to observe any significant correlation between gene expression and PMI in the hippocampus of control individuals (CAP2: r = 0.2537; p = 0.2805; n = 20; DLG1: r = −0.1563; p = 0.5227; n = 19; ADAM10: r = 0.1332; p = 0.5755; n = 20; Spearman correlation) (Figure 2o,s,w) and in SCZ patients (CAP2: r = −0.09624; p = 0.6865; n = 20; DLG1: r = −0.1063; p = 0.6746; n = 18; ADAM10: r = 0.2193; p = 0.3670; n = 19; Spearman correlation) (Figure 2p,t,x).

2.3. Analysis of mRNA Expression of CAP2, DLG1, and ADAM10 in the Post-Mortem Dorsolateral Prefrontal Cortex and Hippocampus of SCZ Patients

Here, we evaluated potential alterations in CAP2, DLG1, and ADAM10 mRNA expression in the DLPFC of SCZ patients compared to control subjects. Statistical analysis indicated no significant difference in CAP2 and ADAM10 transcript levels in SCZ patients, compared to non-psychiatric controls (CAP2: p = 0.0893, ADAM10: p = 0.4780; Mann–Whitney test) (Figure 3a,c). Conversely, we reported increased levels of DLG1 transcript in SCZ patients compared to control subjects (p = 0.0407; Mann–Whitney test) (Figure 3b). Next, we extended gene expression analysis of CAP2, DLG1, and ADAM10 to the post-mortem hippocampus of SCZ patients and control individuals. Interestingly, RT-PCR experiments revealed decreased CAP2 mRNA levels in the SCZ group compared to control subjects (p = 0.0309; Mann–Whitney test) (Figure 3d). On the other hand, no significant difference in DLG1 and ADAM10 transcripts was observed between the two diagnostic groups (DLG1: p = 0.2485; ADAM10: p = 0.1682; Mann–Whitney test) (Figure 3e,f).

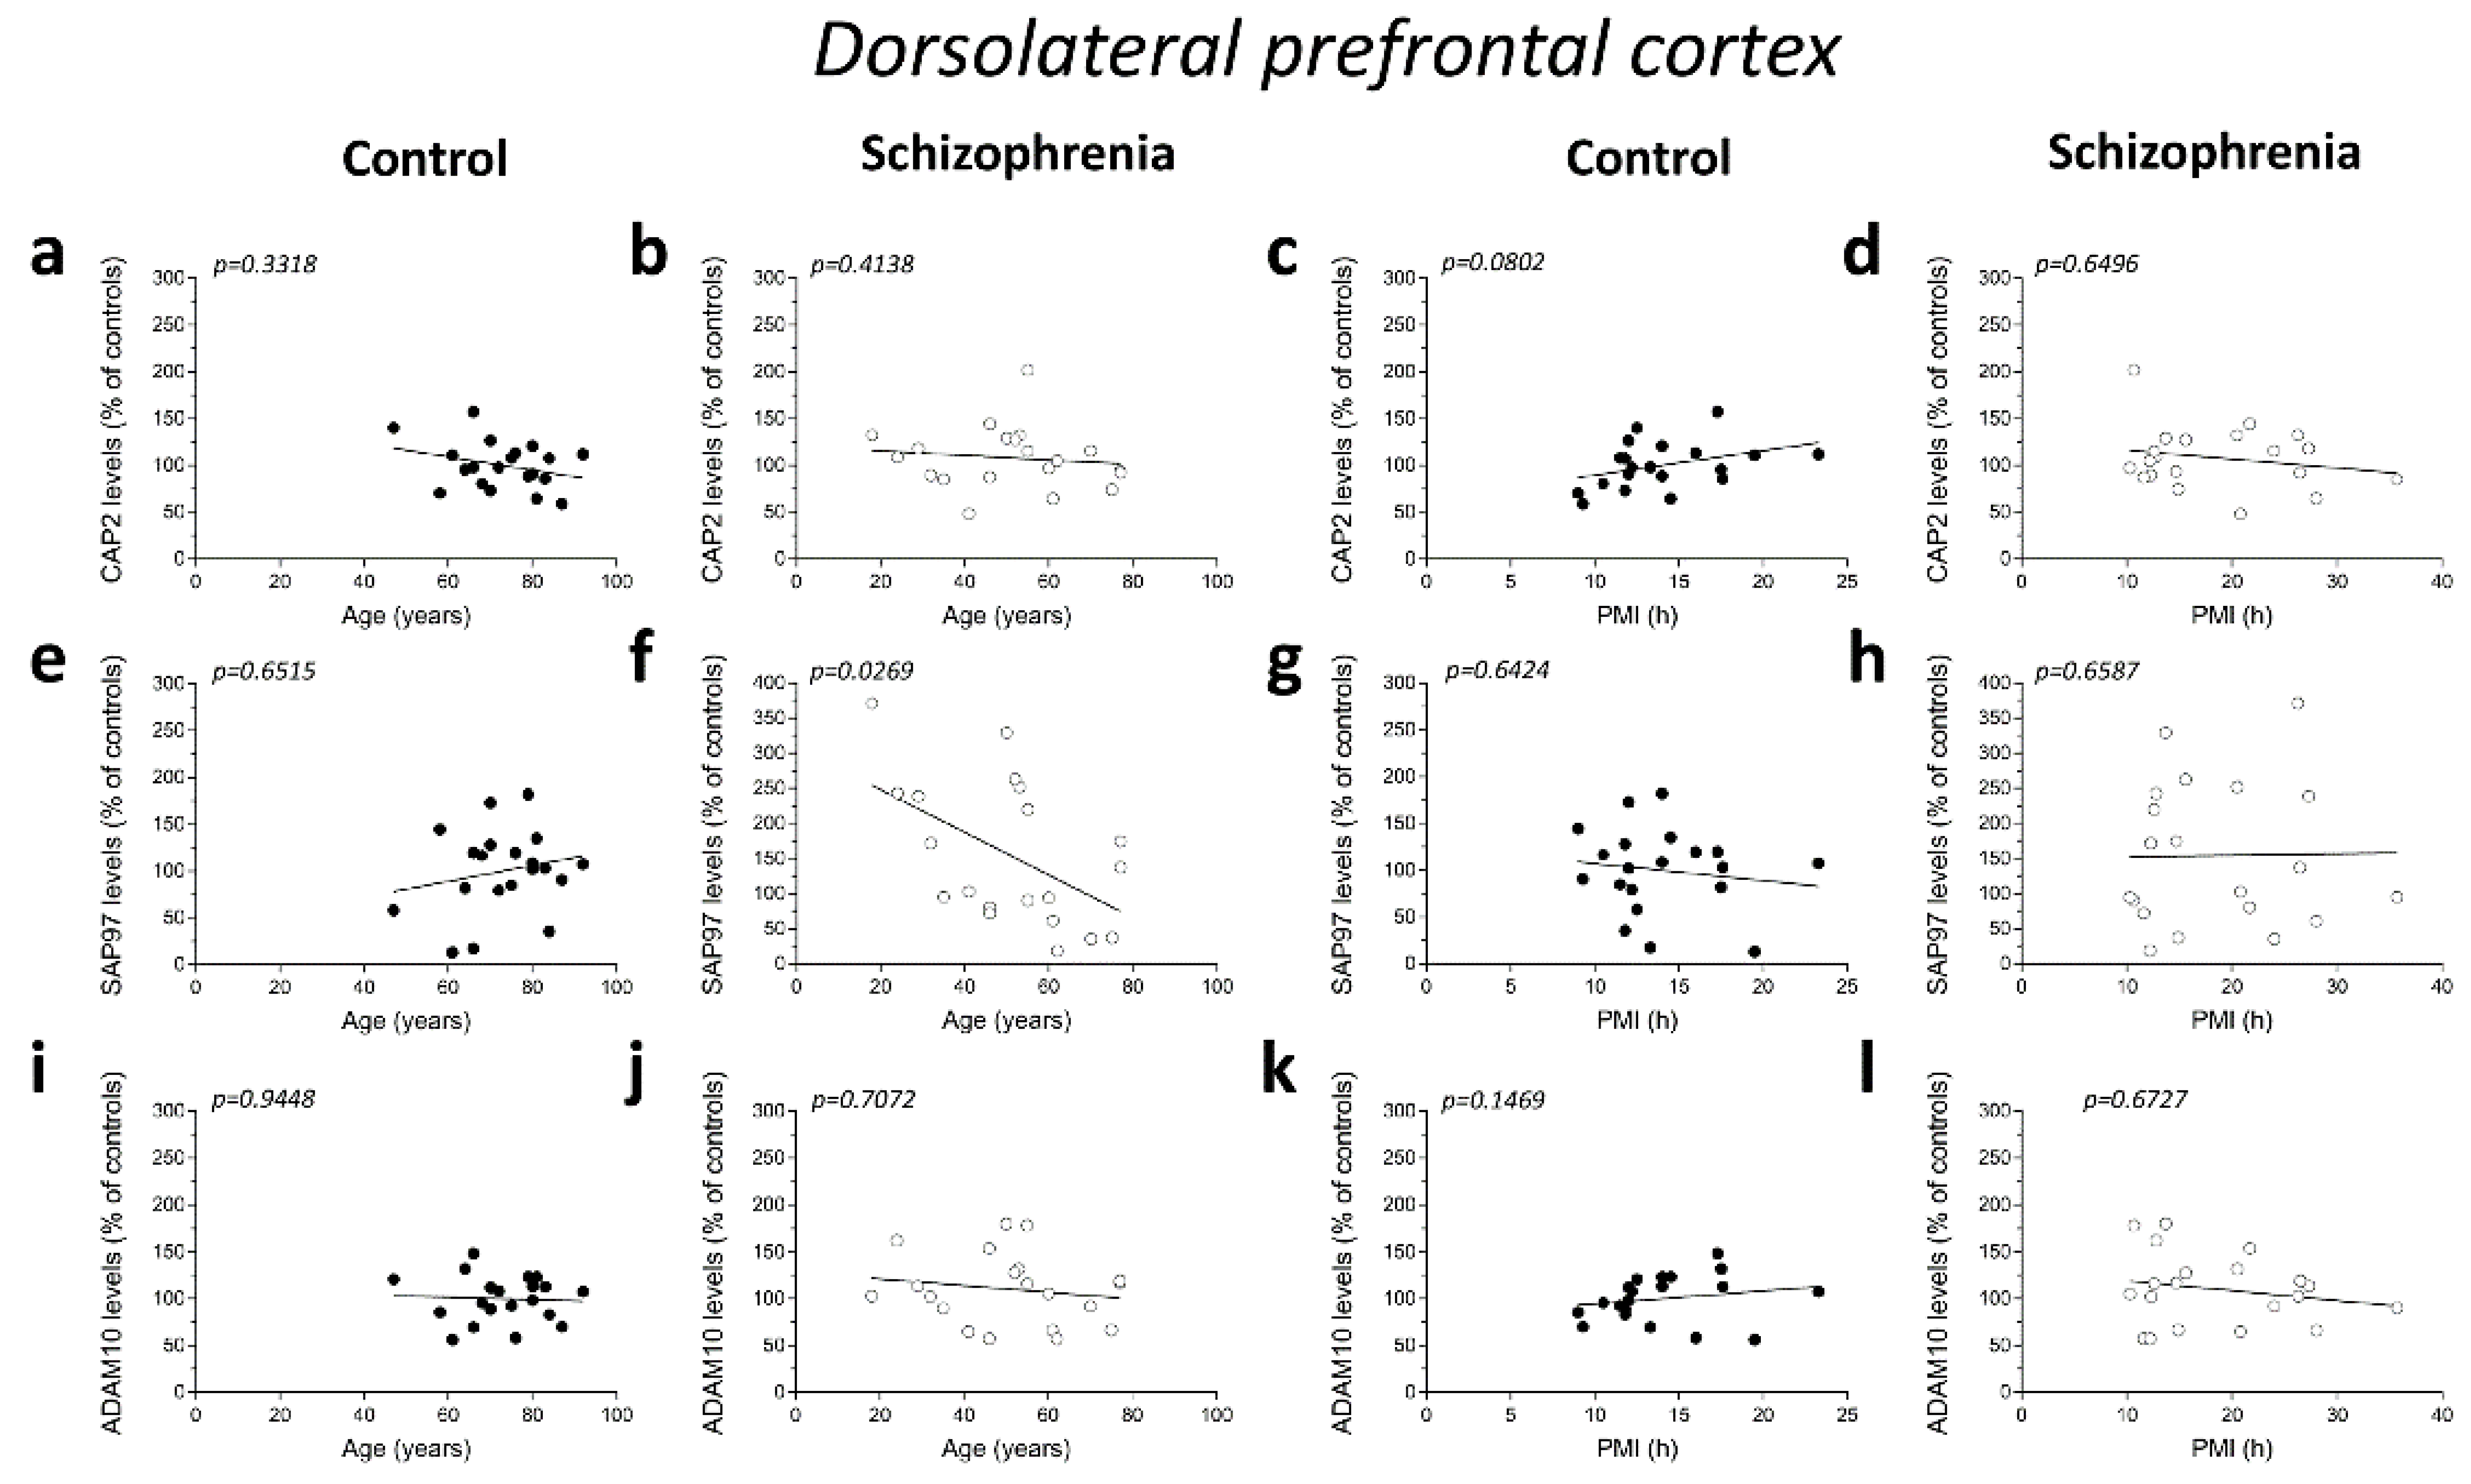
2.4. Correlation Analysis of CAP2, SAP97, and ADAM10 Protein Levels with Age and PMI in the Post-Mortem Dorsolateral Prefrontal Cortex and Hippocampus of Schizophrenia Patients

We analyzed possible age- and PMI-related variations in CAP2, SAP97, and ADAM10 protein levels in the post-mortem DLPFC and hippocampus from individuals with SCZ and controls. Overall, we failed to observe any significant correlation in the DLPFC between the amount of proteins and the age in the non-psychiatric group (CAP2: r = −0.2288; p = 0.3318; n = 20; SAP97: r = 0.1076; p = 0.6515; n = 20; ADAM10: r = −0.01656; p = 0.9448; n = 20; Spearman correlation) (Figure 4a,e,i). Similarly, the results obtained in the SCZ patients did not show a significant correlation between CAP2 and ADAM10 levels and age (CAP2: r = −0.1935; p = 0.4138; n = 20; ADAM10: r = −0.08957; p = 0.7072; n = 20; Spearman correlation) (Figure 4b,j). Conversely, we reported a negative correlation between SAP97 protein levels and age (r = −0.4938; p = 0.0269; n = 20; Spearman correlation) (Figure 4f). On the other hand, our results showed no correlation between CAP2, SAP97, and ADAM10 protein expression and PMI in the DLPFC of both diagnostic groups (CAP2 CTRL: r = 0.4005; p = 0.0802; n = 20; CAP2 SCZ: r = −0.1083; p = 0.6496; n = 20; SAP97 CTRL: r = −0.1107; p = 0.6424; n = 20; SAP97 SCZ: r = 0.1053; p = 0.6587; n = 20; ADAM10 CTRL: r = 0.3365; p = 0.1469; n = 20; ADAM10 SCZ: r = −0.1008; p = 0.6726; n = 20; Spearman correlation) (Figure 4c,d,g,h,k,l). Finally, we analyzed the correlation of CAP2, SAP97, and ADAM10 protein levels with age and PMI also in the hippocampus. In the control group, we did not observe significant correlation of CAP2 (r = −0.4321; p = 0.0571; n = 20; Spearman correlation) (Figure 4m) and SAP97 levels (r = −0.2492; p= 0.2895; n = 20; Spearman correlation) (Figure 4q) with the age, while we found a negative correlation between ADAM10 and age (r = −0.4772; p = 0.0334; n = 20; Spearman correlation) (Figure 4u). Our results showed no significant correlation between CAP2, SAP97, and ADAM10 protein levels and age in the SCZ patients (CAP2: r = −0.1016; p = 0.6699; n = 20; SAP97: r = −0.2559; p = 0.2761; n = 20; ADAM10: r = 0.1054; p = 0.6584; n = 20; Spearman correlation) (Figure 4n,r,v). Next, we analyzed the correlation between CAP2, SAP97, and ADAM10 protein expression and PMI. We failed to find any significant correlation in both diagnostic groups (CAP2 CTRL: r = 0.1859; p = 0.4326; n = 20; CAP2 SCZ: r = −0.2872; p = 0.2195; n = 20; SAP97 CTRL: r = −0.1942; p = 0.4120; n = 20; SAP97 SCZ: r = −0.06015; p = 0.8011; n = 20; ADAM10 CTRL: r = 0.1965; p = 0.4064; n = 20; ADAM10 SCZ: r = −0.2902; p = 0.2145; n = 20; Spearman correlation) (Figure 4o,p,s,t,w,x).

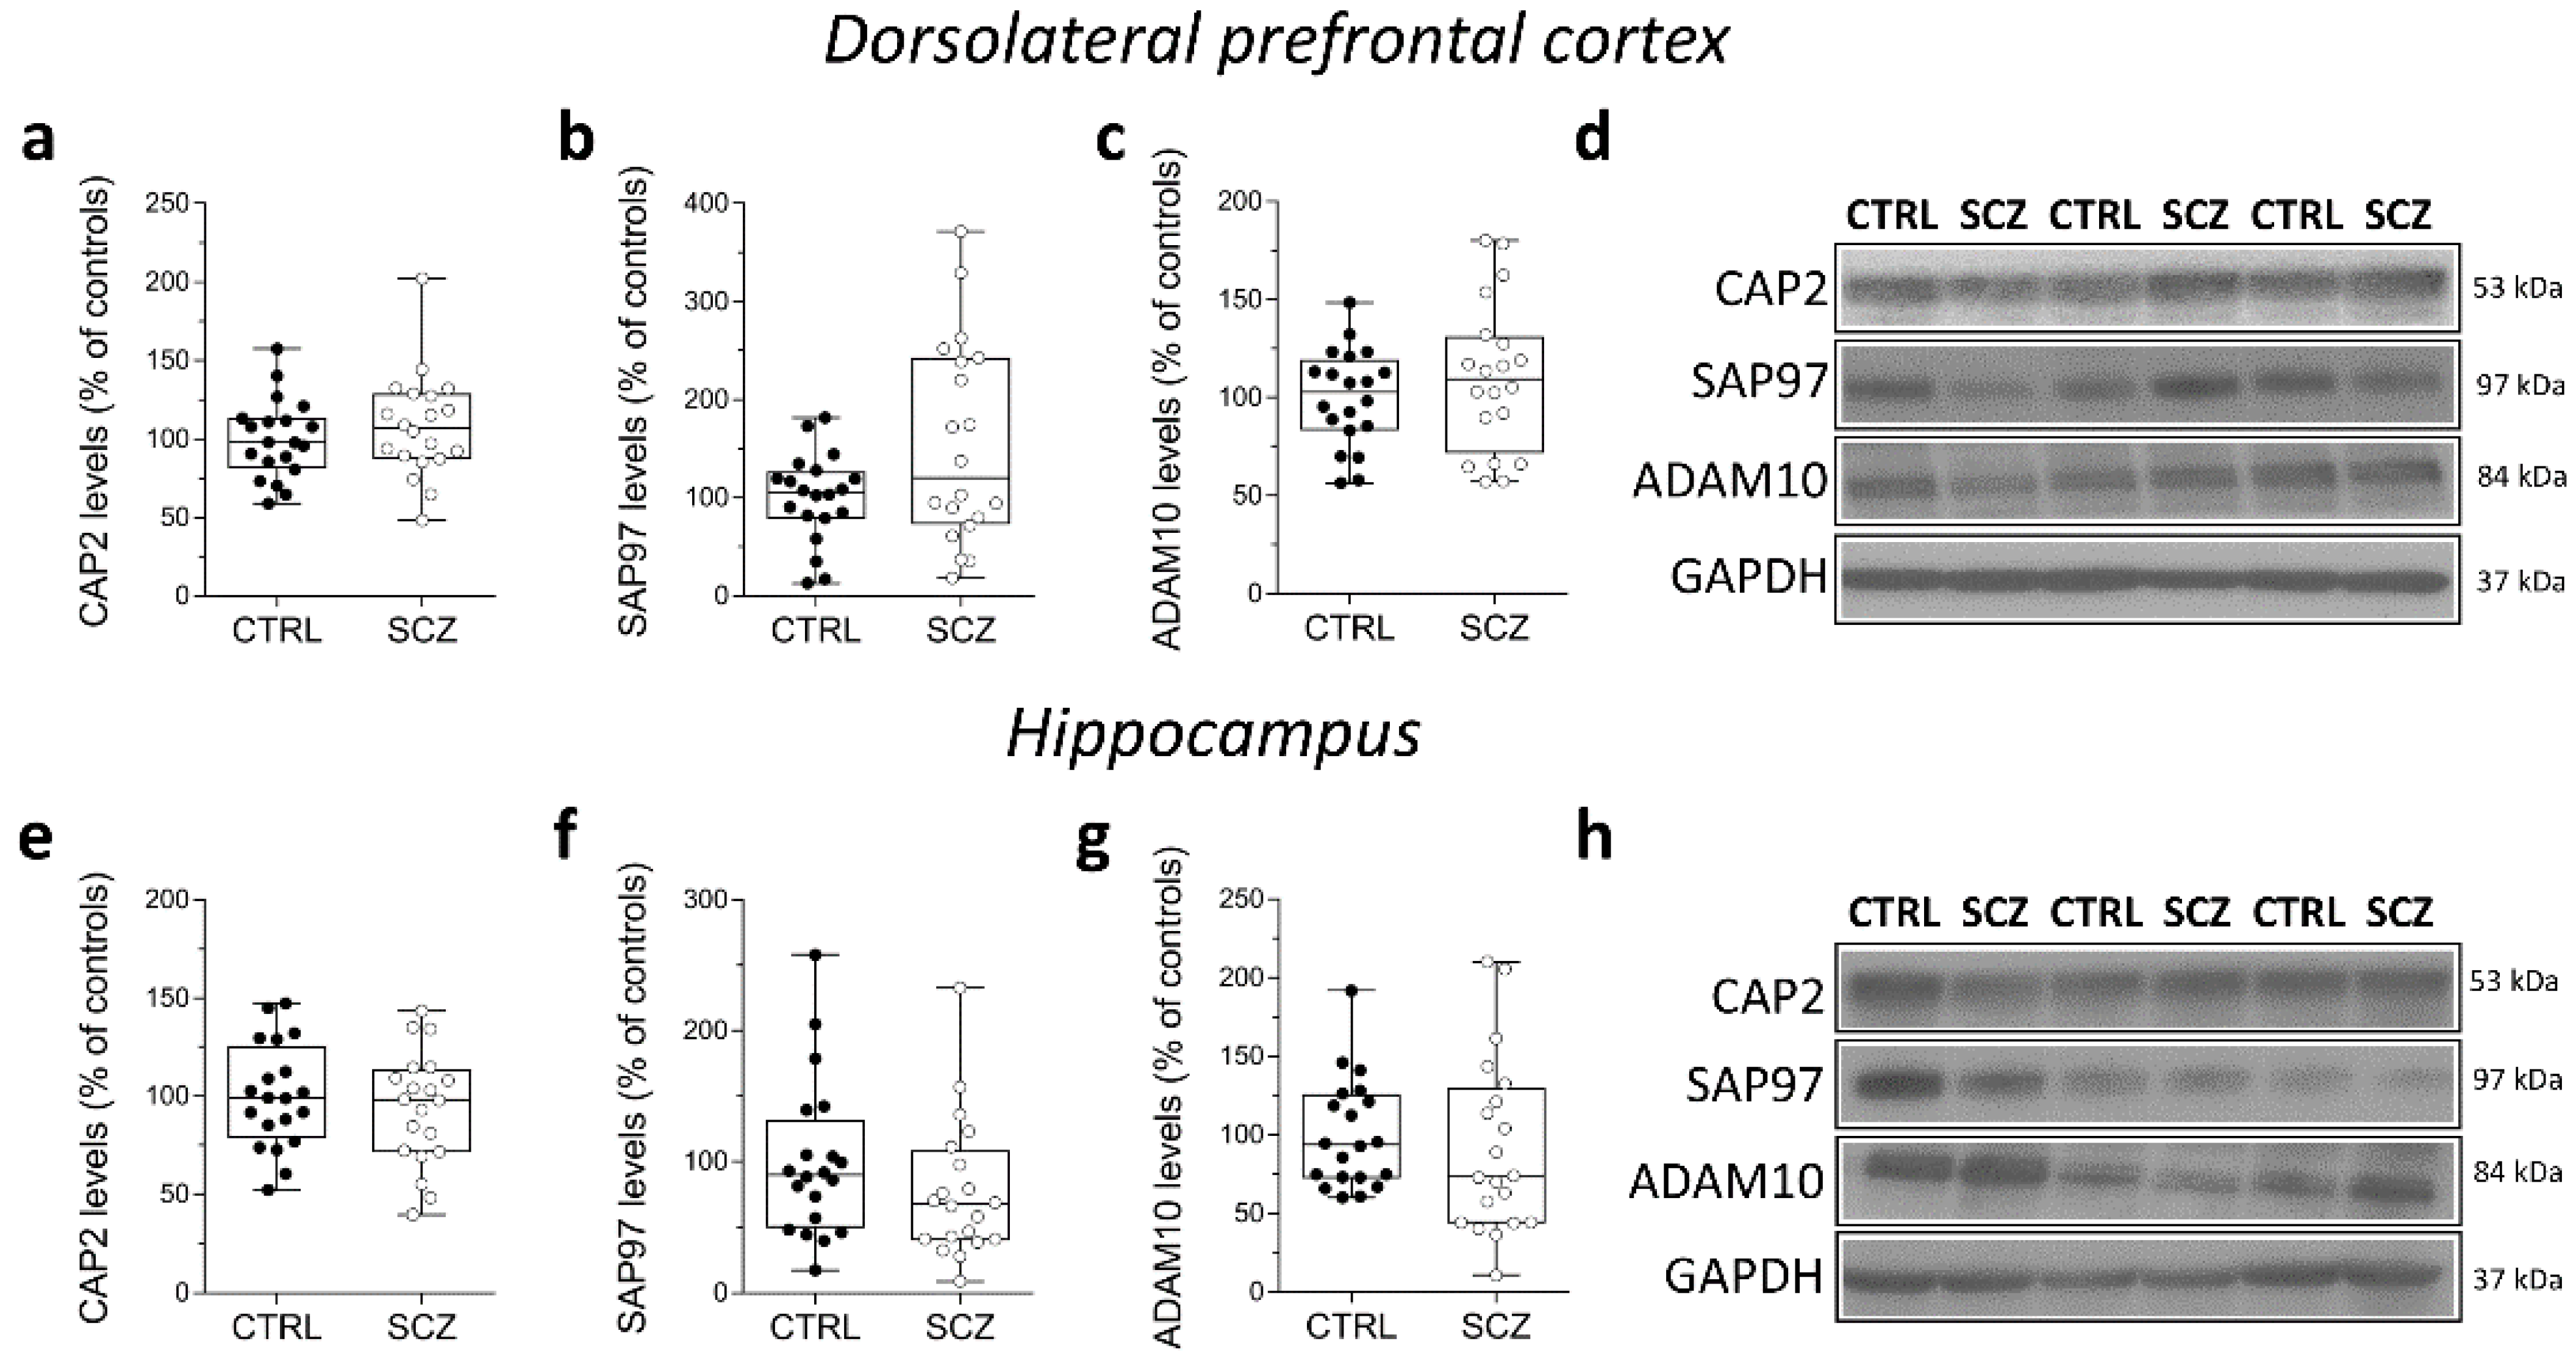
2.5. Analysis of Protein Expression of CAP2, SAP97, and ADAM10 in the Post-Mortem Dorsolateral Prefrontal Cortex and Hippocampus of SCZ Patients

We also analyzed CAP2, SAP97, and ADAM10 protein levels in total homogenates of DLPFC of the same cohort of post-mortem samples. Western blot analysis indicated no alterations of CAP2, SAP97, and ADAM10 protein levels in the DLPFC of SCZ patients compared to non-psychiatric controls (CAP2: p = 0.4135; SAP97: p = 0.2110; ADAM10 p = 0.4612; Mann–Whitney test) (Figure 5a–d). Similarly, in the hippocampus we found comparable CAP2, SAP97, and ADAM10 protein levels between SCZ patients and control subjects (CAP2: p = 0.6205; SAP97: p = 0.1344; ADAM10: p = 0.2766; Mann–Whitney test) (Figure 5e–h).

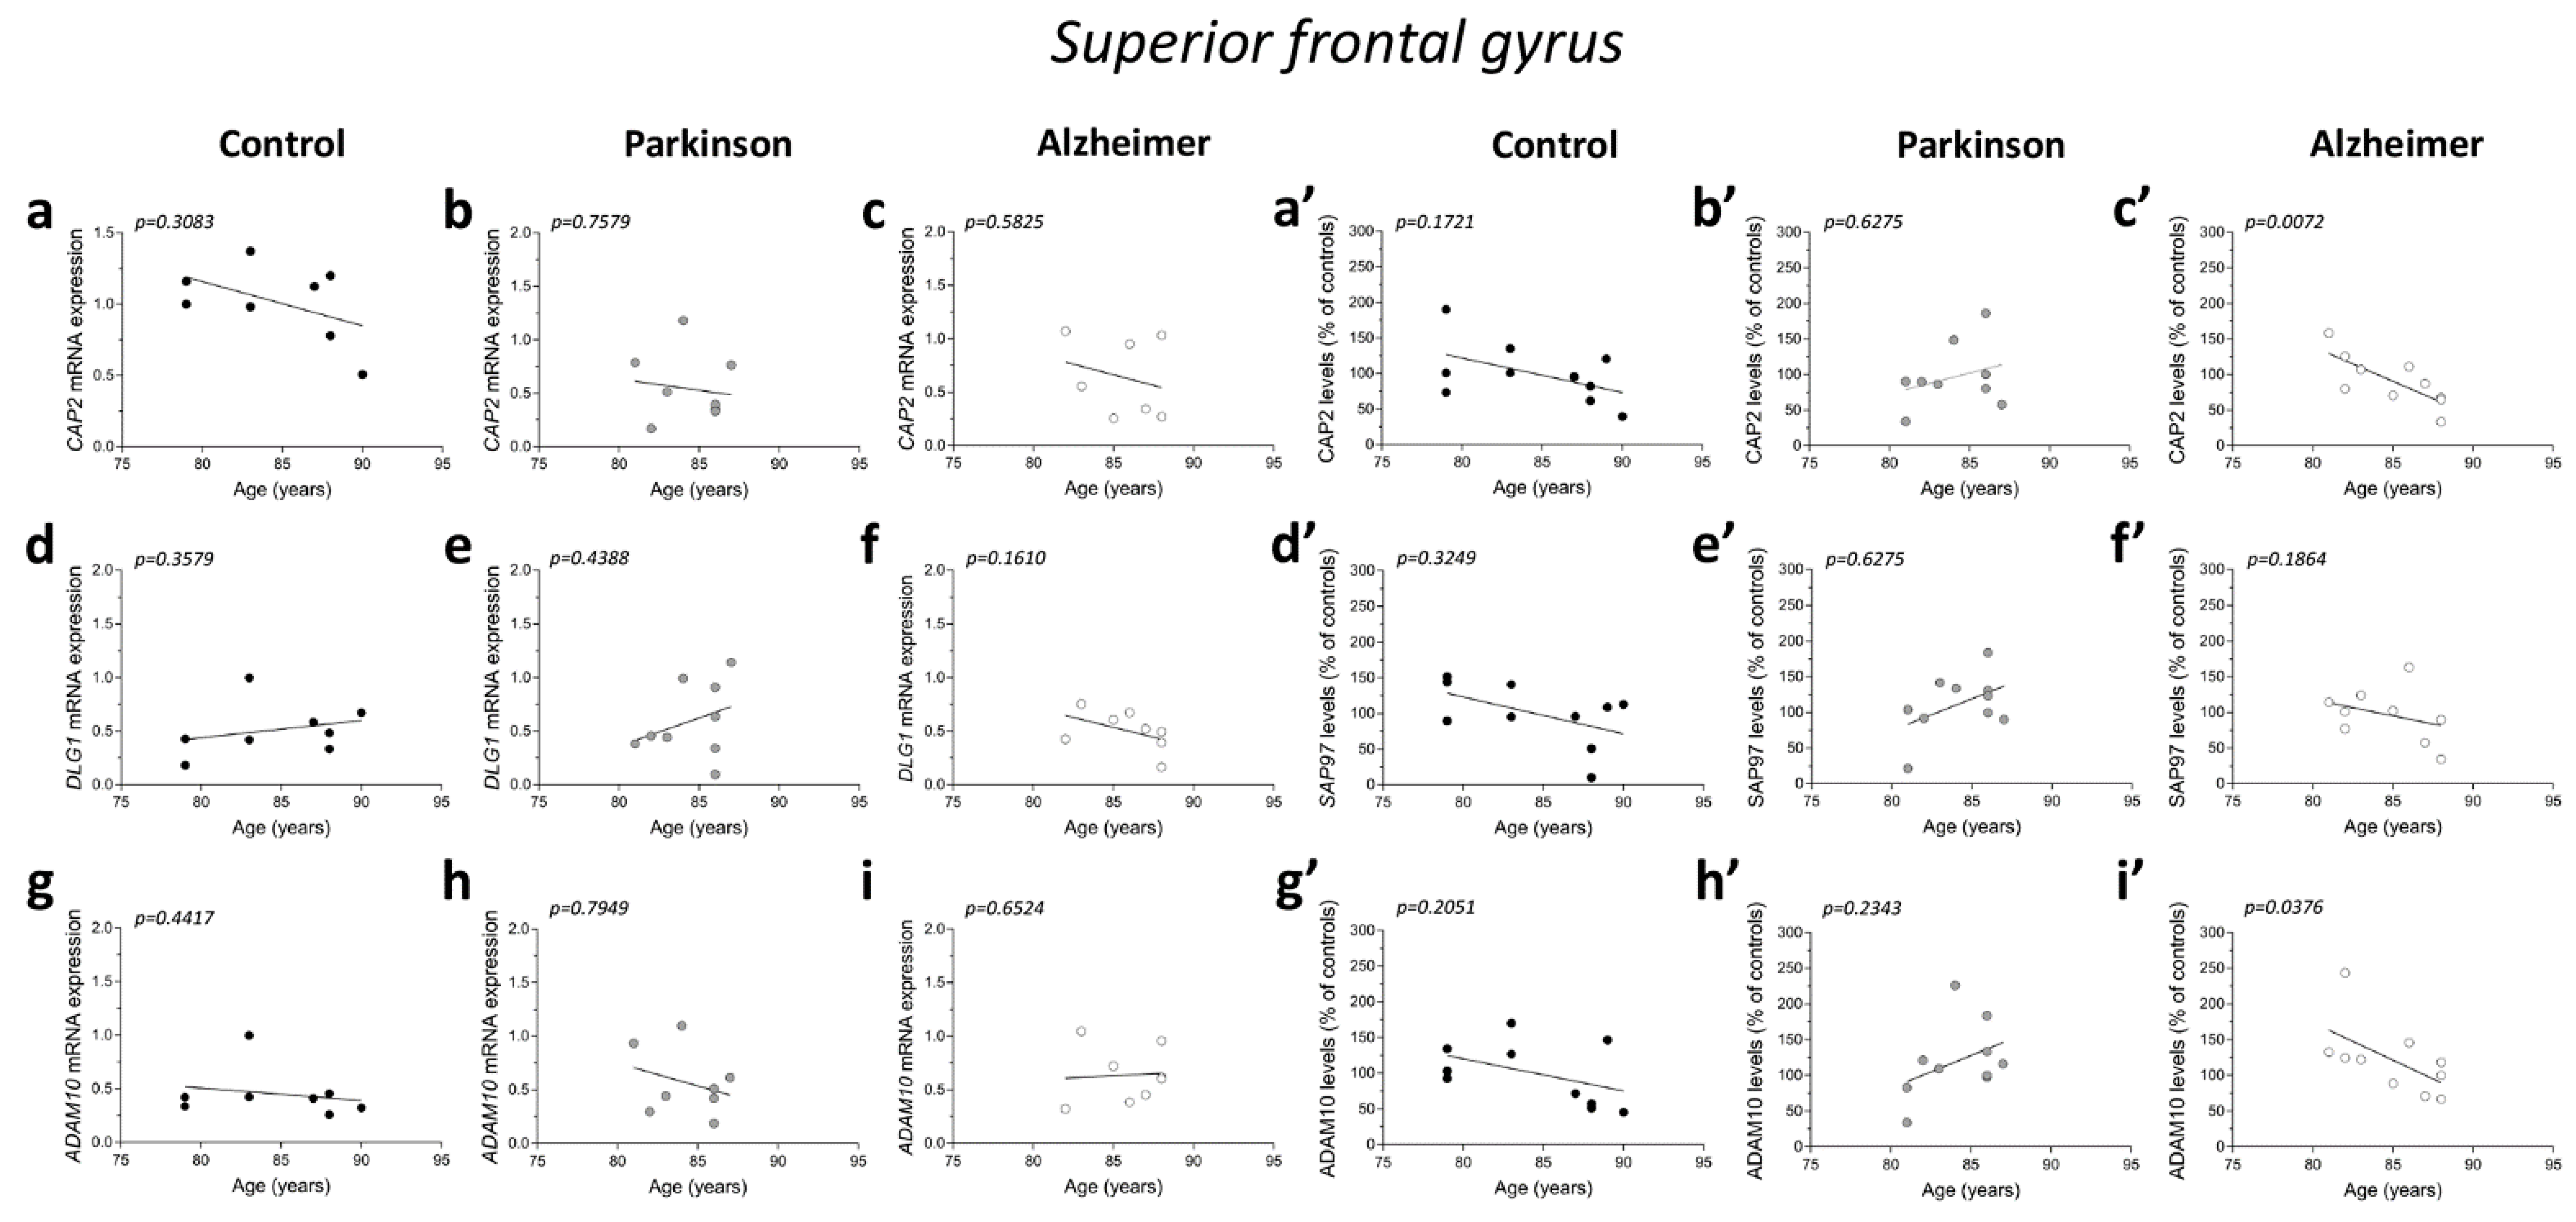
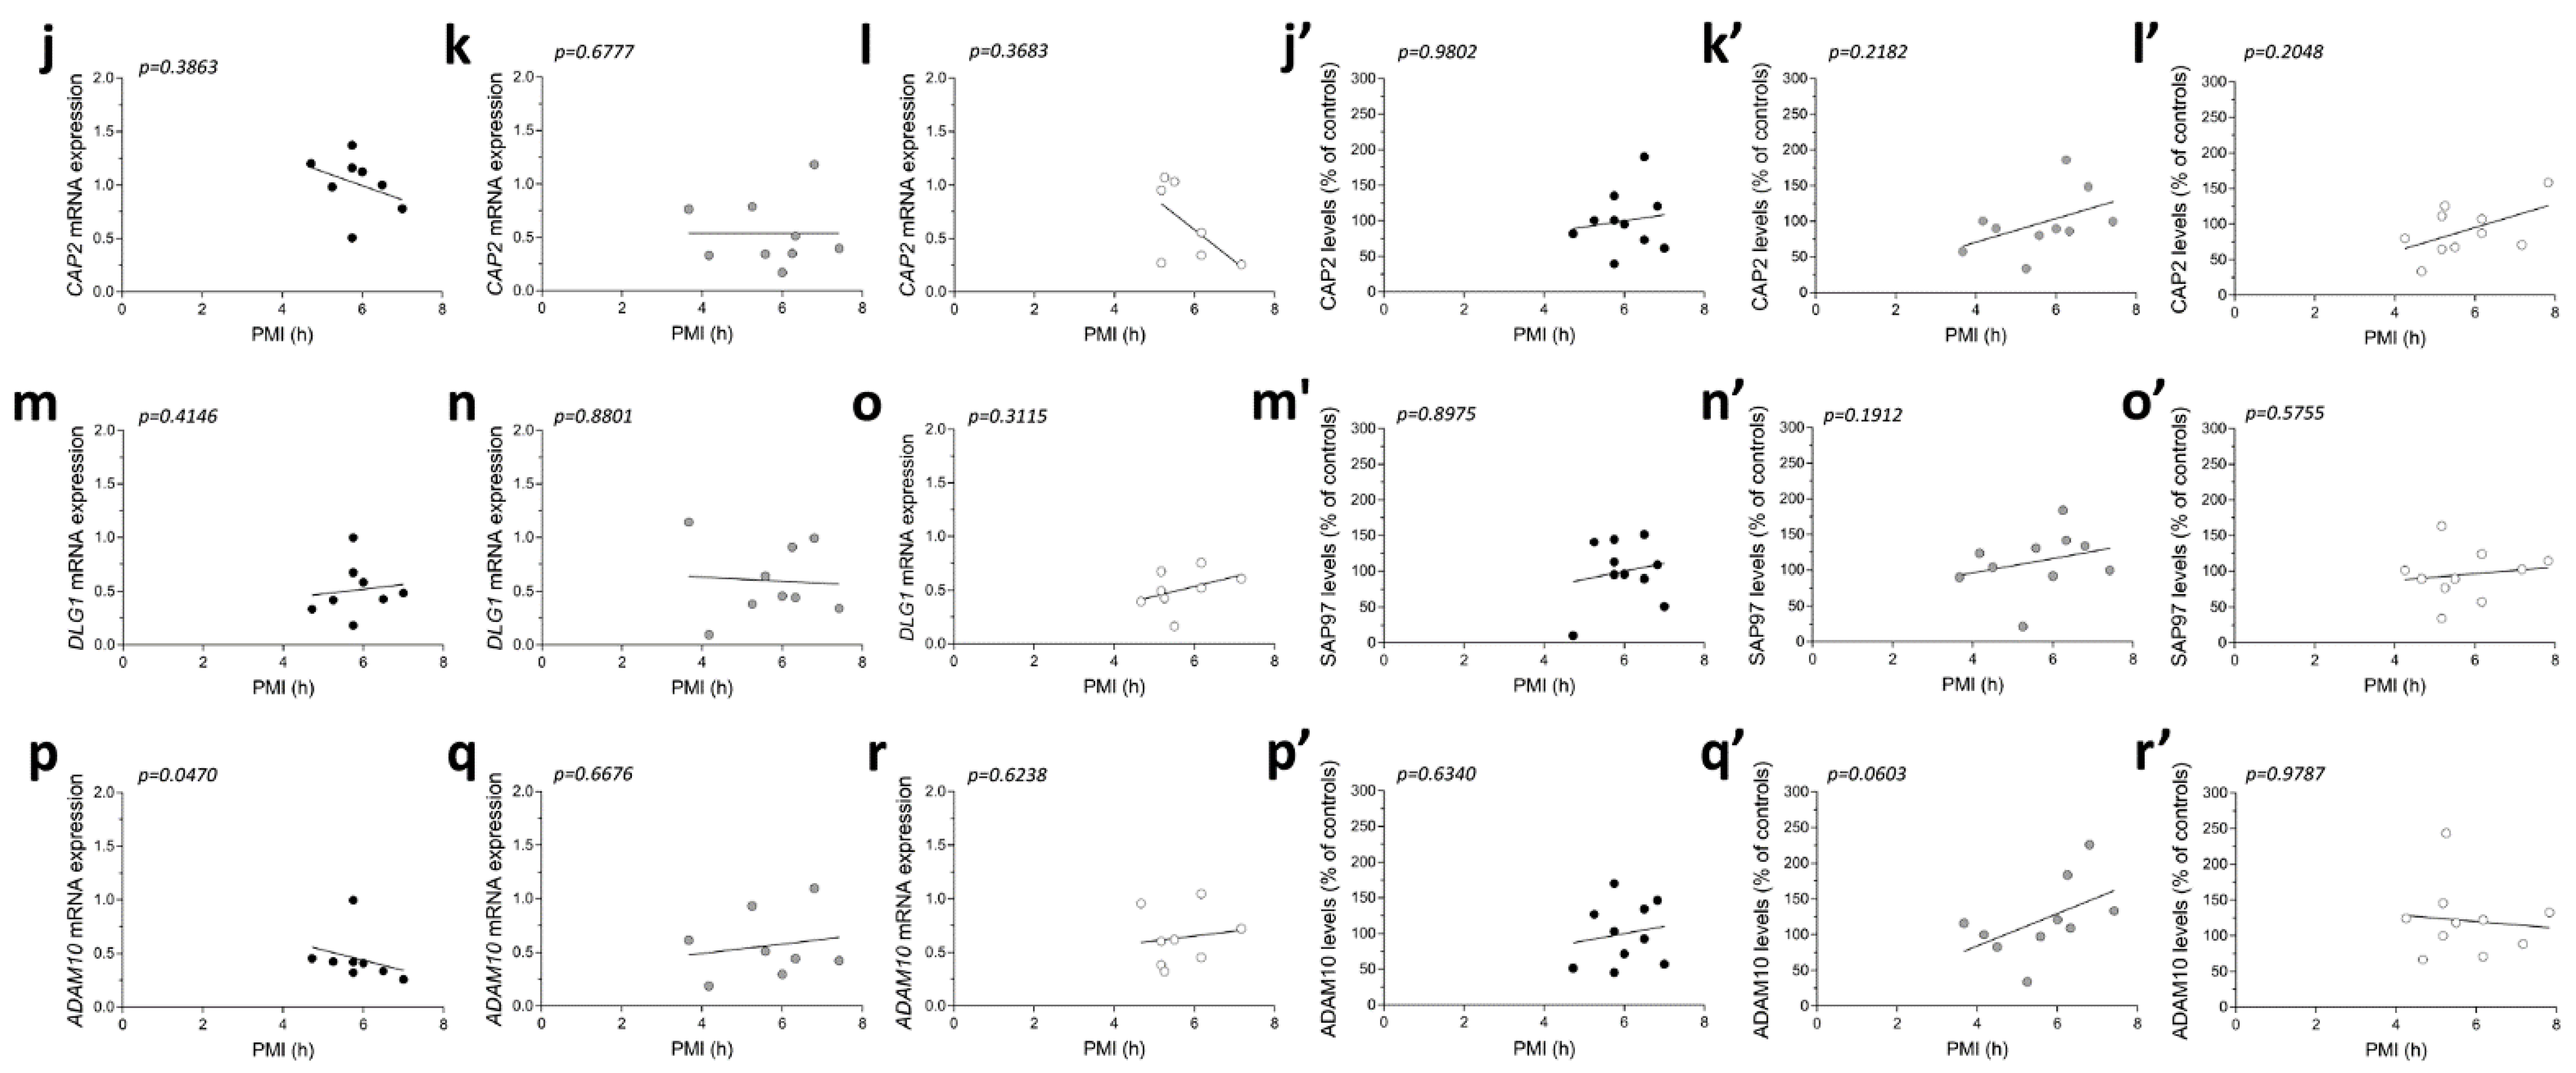
2.6. Correlation Analysis of CAP2, SAP97, and ADAM10 mRNA and Protein Expression with Age and PMI in the Post-Mortem Superior Frontal Gyrus of Alzheimer’s and Parkinson’s Disease Patients

Synaptic dysfunction has been considered a major determinant of many neurological diseases, including AD, PD, and Huntington’s Disease [27,28]. Therefore, we extended our assessment of CAP2, DLG1, and ADAM10 gene and protein expression levels to the post-mortem superior frontal gyrus (SFG) of patients affected by neurodegenerative diseases such as PD and AD.
First, we examined the correlations of CAP2, DLG1, and ADAM10 mRNA with age and PMI in the SFG of AD and PD patients and the control group (Table 2).
No significant correlations were observed between gene expression and age in the three diagnostic groups (CAP2 CTRL: r = −0.4122; p = 0.3083; n = 8; CAP2 PD: r = −0.1219; p = 0.7579; n = 9; CAP2 AD: r = −0.2523; p = 0.5825; n = 7; DLG1 CTRL: r = 0.3758; p = 0.3579; n = 8; DLG1 PD: r = 0.2959; p = 0.4388; n = 9; DLG1 AD: r = −0.5611; p = 0.1610; n = 8; ADAM10 CTRL: r = −0.3152; p = 0.4417; n = 8; ADAM10 PD: r = −0.122; p = 0.7949; n = 8; ADAM10 AD: r = 0.1952; p = 0.6524; n = 8 Spearman correlation) (Figure 6a–i). We also failed to find any difference in the correlation of CAP2, DLG1, and ADAM10 mRNA with PMI in AD and PD patients and control group (CAP2 CTRL: r = −0.366; p = 0.3863; n = 8; CAP2 PD: r = 0.1667; p = 0.6777; n = 9; CAP2 AD: r = −0.4001; p = 0.3683; n = 7; DLG1 CTRL: r = 0.3416; p = 0.4146; n = 8; DLG1 PD: r = −0.06667; p = 0.8801; n = 9; DLG1 AD: r = 0.4097; p = 0.3115; n = 8; ADAM10 PD: r = 0.1812; p = 0.6676; n = 8; ADAM10 AD: r = 0.2048; p = 0.6238; n = 8; Spearman correlation) (Figure 6j–o,q,r), except for ADAM10 in the control group (r = −0.7319; p = 0.0470; n = 8; Spearman correlation) (Figure 6p).
Next, we investigated if the protein expression of these genes is correlated with both age and PMI in the same brain region. We found a significant negative correlation of CAP2 and ADAM10 protein levels with age in AD patients (CAP2: r = −0.8062; p = 0.0072; n = 10; ADAM10: r = −0.677; p = 0.0376; n = 10 Spearman correlation) (Figure 6c′,i′). No other significant correlation was found between our proteins of interest and age or PMI in the SFG of the three diagnostic groups (protein vs. age: CAP2 CTRL: r =−0.4692; p = 0.1721; n = 10; CAP2 PD: r = 0.1757; p = 0.6275; n = 10; SAP97 CTRL: r = −0.3457; p = 0.3249; n = 10; SAP97 PD: r = 0.1757; p = 0.6275; n = 10; SAP97 AD: r = −0.4554; p = 0.1864; n = 10; ADAM10 CTRL: r = −0.4383 p = 0.2051; n = 10; ADAM10 PD: r = 0.414; p = 0.2343; n = 10; Spearman correlation) (Figure 6a′,b′,d′–h′) (protein vs. PMI: CAP2 CTRL: r = 0.01231; p = 0.9802; n = 10; CAP2 PD: r = 0.4303; p = 0.2182; n = 10; CAP2 AD: r = 0.439; p = 0.2048; n = 10; SAP97 CTRL: r = −0.04924; p = 0.8975; n = 10; SAP97 PD: r = 0.4545.; p = 0.1912; n = 10; SAP97 AD: r = 0.2012; p = 0.5755; n = 10; ADAM10 CTRL: r = 0.1723; p = 0.6340; n = 10; ADAM10 PD: r = 0.6242; p = 0.0603; n = 10; ADAM10 AD: r = −0.0122; p = 0.9787; n = 10; Spearman correlation) (Figure 6j′–r′).

2.7. Analysis of CAP2, DLG1, and ADAM10 Transcript Levels in the Post-Mortem Superior Frontal Gyrus of Alzheimer’s and Parkinson’s Disease Patients

Then, we analyzed CAP2, DLG1, and ADAM10 gene expression levels in the post-mortem SFG of PD and AD. RT-PCR analysis showed a significant reduction of CAP2 transcript in PD patients and a decreasing trend in AD patients, compared with non-neurological subjects (CTRL vs. PD p = 0.0111; CTRL vs. AD p = 0.0541; Mann–Whitney test) (Figure 7a). Conversely, we did not observe any alteration in DLG1 and ADAM10 mRNA expression levels between groups (DLG1: CTRL vs. PD p = 0.7430; CTRL vs. AD p = 0.8785; ADAM10: CTRL vs. PD p = 0.3823; CTRL vs. AD p = 0.1304; Mann–Whitney test) (Figure 7b,c).

2.8. Analysis of Protein Expression of CAP2, SAP97, and ADAM10 in the Post-Mortem Superior Frontal Gyrus of Alzheimer’s and Parkinson’s Disease Patients

Finally, in the same brain samples, we performed Western blot analysis to investigate eventual variations in CAP2, SAP97, and ADAM10 protein content in individuals with PD and AD. Our analyses showed unaltered CAP2, SAP97, and ADAM10 protein levels in the SFG of PD and AD patients compared to control subjects (CAP2: CTRL vs. PD p = 0.6842; CTRL vs. AD p = 0.6842; SAP97: CTRL vs. PD p = 0.6842; CTRL vs. AD p = 0.6305; ADAM10: CTRL vs. PD p = 0.5288; CTRL vs. AD p = 0.5787; Mann–Whitney test) (Figure 8a–d).

3. Discussion

Several psychiatric and neurological disorders are associated with alterations in spine number and dendritic arborization [29,30]. The spine shapers CAP2, SAP97, and ADAM10 are localized in the postsynaptic compartment and their localization is under the control of activity-dependent synaptic plasticity [23,26]. CAP2 translocation into spines is required for spine enlargement upon long-term potentiation induction [23]. SAP97 controls the abundance of ADAM10 at the synapse and their association is essential for the long-term depression-triggered spine shrinkage [26]. Based on the well-recognized synaptic defects in the SCZ brain [12], here we investigated the mRNA and protein levels of CAP2, SAP97, and ADAM10 in the post-mortem brain of SCZ patients. In particular, we performed the analysis in total homogenates of DLPFC and hippocampus, two brain regions involved in deregulated cortical–subcortical network typical of this psychiatric disorder [31,32,33,34].
Our data indicated a significant increase of DLG1 mRNA levels within DLPFC, but not in the hippocampus of SCZ patients, when compared to controls. Conversely, no changes were observed in the expression levels of the protein encoded by the DLG1 gene, SAP97, in both brain regions.
Taken together, these results are puzzling since it has been demonstrated a pivotal role of this synaptic element in regulating the trafficking of the glutamate AMPA receptors, whose expression, and function have been reported to be altered in SCZ [35]. In this regard, compelling evidence, including genetic-imaging studies, suggests that genetic variants of the DLG1 gene are functionally linked to abnormal cognitive patterns in SCZ patients [36,37,38,39,40]. In particular, Xu and colleagues reported that SAP97 rs3915512 polymorphism in patients with first-episode schizophrenia was associated with low structural and functional connectivity within the orbitofrontal–striatal–thalamic circuitry [41]. Despite this finding, protein expression analysis of SAP97 in DLPFC reported conflicting data, showing either a reduction [42] or increased protein amount in SCZ brains, compared to healthy controls [43]. In addition, no difference was detected in DLG1 gene expression in both DLPFC and occipital cortex of post-mortem old adults with SCZ [44].
Notably, we observed a decrease of CAP2 transcript level, selectively in the hippocampus, but not in the DLPFC of SCZ patients, while no changes in CAP2 protein levels were detected in both brain regions. To the best of our knowledge, this is the first work reporting CAP2 mRNA reduction in the post-mortem brain of SCZ patients. In humans, the CAP2 gene is located on chromosome 6p22.3. Interestingly, patients with an interstitial 6p22−24 deletion syndrome show a complex and variable phenotype including a developmental delay and cognitive disorders [45,46]. It is worth mentioning that the expression of CAP1, another member of the CAP family, is increased in the mediodorsal thalamus of SCZ patients compared to control subjects [47] and is altered in the cortex of an animal model of SCZ [48]. Despite CAP2 transcript alteration in the hippocampus of SCZ patients, we found that the protein levels were unaffected in this brain area thus making it difficult to argue a direct consequence of mRNA reduction in modulating excitatory synaptic transmission. Further investigations are warranted to understand the relevance of CAP2 at the glutamatergic synapse of the SCZ brain.
Overall, our data indicate alterations in both DLG1 (increase) and CAP2 (decrease) gene expression in SCZ brains but not in their corresponding protein levels. It should be remarked that our analysis has been carried out using total homogenate extracts. Therefore, future studies are needed to assess whether differences in the expression levels of these proteins occur in selective neuronal compartments, like the postsynaptic fraction where they exert their specific function.
Our data also indicated an unaltered mRNA and protein expression of ADAM10 in the post-mortem brain of SCZ patients, compared to normal controls in both DLPFC and hippocampus. These results are in line with a recent report indicating no changes in transcript and protein expression of ADAM10 in post-mortem PFC of SCZ patients [49]. However, a very recent study showed a significant reduction of ADAM10 mRNA in several brain regions of SCZ patients [50]. The apparent discrepancy between our results on CAP2, SAP97, and ADAM10 mRNA and protein expression and those obtained from other cohorts of post-mortem SCZ brains should take into account diverse confounding variables, including antipsychotics, age, disease duration, and gender. In particular, pharmacological therapy could have played a role in regulating the expression of these synaptic proteins at multiple levels, such as type of antipsychotic, dosage, and duration of treatment. Consistent with this assumption, evidence suggests that the expression of key scaffold proteins can be significantly affected in animal models exposed to antipsychotic drugs [51,52,53]. Moreover, we found that the age of SCZ patients was significantly lower than control individuals. This is in line with literature reporting a reduced life expectancy in patients with SCZ compared with the general population [54,55]. On the other hand, we did not find any effect of gender, so that, therefore, should not have affected our results.
In the present work, as a reference of synaptopathy-related diseases, we analyzed CAP2, SAP97, and ADAM10 expression in post-mortem brains of patients affected by PD and AD. Indeed, aberrant synapse functioning is a common trait of several brain disorders, including the aforementioned neurodegenerative diseases [27]. Moreover, the relevance of postsynaptic proteins in spine pathology is also supported by evidence showing alterations of spine shapers in AD [23,56]. Consistent with this, CAP2 protein levels were found to be reduced in the hippocampus of patients and animal models of AD [23]. It is noteworthy that even though our results show a remarkable decreasing tendency of CAP2 mRNA levels in the SFG of AD individuals, CAP2 protein levels were not affected, confirming the results obtained in previous studies [23]. CAP2 has never been analyzed in PD, while ADAM10 and SAP97 gene variants have already been associated with PD [57,58]. In the present work, we show a significant reduction of CAP2 mRNA levels in the SFG of the PD group, while no alterations in SAP97 and ADAM10 expression were detected in patients, compared to controls. In contrast to our observations, earlier immunohistochemical studies carried out in the human post-mortem hippocampus of PD patients showed a significant increase of SAP97 [59]. This synapse-associated protein was also altered in the striatum of animal models of PD and Levodopa-induced dyskinesia [60]. We can hypothesize that the alterations in SAP97 expression in PD can depend on different factors, including the brain area analyzed, the disease stage, and drug administration. In conclusion, our data suggest that aberrant gene expression of spine shapers may contribute significantly to synaptic dysfunction-related neuropsychiatric disorders. The involvement of key molecules of the synapse may highlight the need for a more vigorous translational approach towards the search of novel molecular targets paving the way for innovative treatments beyond or in augmentation with the ones presently available.

4. Materials and Methods

4.1. Neuronal Cultures Preparation and Immunocytochemistry

Hippocampal neuronal primary cultures were prepared from embryonic day 19 (E19) rat hippocampi as previously described [61]. For colocalization studies, day in vitro (DIV) 14 hippocampal neurons were fixed with 4% Paraformaldehyde (PFA)—4% sucrose in PBS solution for 5 min at 4 °C and washed several times with PBS. Cells were permeabilized with 0.1% Triton X-100 in PBS for 15 min at room temperature (RT) and then blocked with 5% bovine serum albumin (BSA) in PBS for 1 h at RT. Cells were then labeled with primary antibodies at 4 °C overnight. The following antibodies were used: anti-CAP2 (anta Cruz Biotechnology, cod. SC-167378), anti-SAP97 (Enzo, cod. ADI-VAM-PS005), and anti-ADAM10 (Abcam, cod. ab39153). Cells were washed and then incubated with secondary antibodies for 1 h at RT. The Alexa Fluor dye secondary antibodies used (donkey anti-rabbit-Alexa488, donkey anti-mouse-Alexa555, donkey anti-goat-Alexa647) were purchased from Thermo Fisher Scientific. After, the cells were washed in PBS and mounted on glass slides with Fluoromount mounting medium (Sigma Aldrich 20149,Milano, Italy). Images for the analysis of neuronal spine morphology were acquired with an Airyscan (resolution 100–120 nm) microscopy using Zeiss LSM 900, 63× oil objective, PLAN Apochromat, NA 1.42.

4.2. Human Post-Mortem Tissue Collection

Human tissue collection DLPFC and hippocampus samples from post-mortem brains of non-psychiatric controls and SCZ patients (n = 20/brain region/clinical condition) were obtained from The Human Brain and Spinal Fluid Resource Center (Los Angeles Healthcare Center, Los Angeles, CA, USA). Clinical diagnosis of SCZ was performed according to DSMIII-R criteria. Demographic characteristics of control and SCZ subjects are described in Table 1 and Table S1. We obtained human SFG samples of normal controls, PD, and AD patients from The Netherlands Brain Bank (Netherlands Institute for Neuroscience, Amsterdam, open access: www.brainbank.nl, accessed on 27 January 2022). We selected cases with a clinical diagnosis of AD (n = 10) and neuropathological staging of Braak ≥ 5. PD patients (n = 10) were characterized by Braak LB stage ≥ 4. Controls (n  =  10) were adults without cognitive decline and Braak ≤ 3 in accordance with the Braak and Braak criteria [62]. The control subjects had no known clinical history of neurological or psychiatric disorders and were also fully neuropathologically evaluated to confirm that they were free of neurodegenerative pathologies. AD patients had a clinical diagnosis of dementia or probable AD, according to the National Institute of Neurological and Communicative Disorders and Stroke and the Alzheimer’s Disease and Related Disorders Association (NINCDS-ADRDA) criteria [63]. Clinical diagnosis of PD was based on diagnostic procedure according to the UK Brain Bank criteria for PD [64] and confirmed by neuropathological findings [65]. Frozen tissues were pulverized in liquid nitrogen and stored at −80 °C for subsequent processing.

4.3. RNA Extraction and Quantitative RT-PCR Analysis

Total RNA was extracted from post-mortem tissues using RNeasy® mini kit (Qiagen, Hilden, Germany) according to the manufacturer’s instructions (Querques et al. 2015). Total RNA was purified to eliminate potentially contaminating genomic DNA using recombinant DNase (Qiagen, Hilden, Germany). RNA integrity number (RIN) of samples was assessed using Agilent 2100 Bioanalyzer Expert (Santa Clara, CA, USA) and BioRad Experion Automated electrophoresis Station (Hercules, CA, USA) prior to cDNA synthesis using Transcriptor First Strand cDNA Synthesis kit (Roche Diagnostics, Mannheim, Germany). A total of 1 μg of total RNA of each sample was reverse transcribed with QuantiTect Reverse Transcription (Qiagen, Hilden, Germany) using oligo-dT and random primers according to the manufacturer’s instructions. Quantitative RT-PCR with Real Time ready catalogue Assays (Roche Diagnostics) and LightCycler® 480 Probe Master (Roche Diagnostics) was performed on a Light Cycler 480 Real Time PCR thermocycler with 96-well format (Roche Diagnostics). All measurements from each subject were performed in duplicate. CAP2, DLG1, and ADAM10 mRNA expression levels were normalized to the mean of two housekeeping genes: β-actin (ACTB) and cyclophilin (PPIA). The following protocol was used: 10 s for initial denaturation at 95 °C followed by 40 cycles consisting of 10 s at 94 °C for denaturation, 10 s at 60 °C for annealing, and 6 s for elongation at 72 °C temperature. The following primers were used for CAP2, DLG1, and ADAM10 cDNA amplification: CAP2 forward, 5′-GCC GCC TGG AGT CGC TGT C-3′ and CAP2 reverse, 5′-AAA ACT CGG CCA CCA TAC TGT CCA-3′; DLG1 forward, 5′-GAG ATG ACT CAA GTA TTT TCA TTA CCA-3′ and DLG1 reverse, 5′-CAC GAA CAT CTA CTT CAT TTA CTC G-3′; ADAM10 forward, 5′-CTGCCCAGCATCTGACCCTAA-3′, and ADAM10 reverse, 5′-TTG CCA TCA GAA CTG GCA CAC-3′. mRNA expression was calculated using the geometric mean of the two reference genes selected and the relative quantification method (2−ΔΔCt).

4.4. Western Blotting

Frozen, powdered samples from post-mortem DLPFC and hippocampus and from SFG of respective brain banks were sonicated in 1% SDS and boiled for 10 min. Aliquots (2 µL) of the homogenate were used for protein determination using a BioRad Protein Assay kit. Equal amounts of total proteins (30 µg) for each sample were loaded on precast 4–20% gradient gels (BioRad Laboratories, Hercules, CA, USA). Proteins were separated by SDS-PAGE and transferred to PVDF membranes (GE Healthcare, Chicago, IL, USA) via the Trans Blot Turbo System (BioRad Laboratories, Hercules, CA, USA). To investigate the targets of interest the blots were incubated with antibodies against CAP2 (1:1000; 15865-1-AP, Proteintech), SAP97 (1:1000; ADI-VAM-PS005, Enzo Life Sciences), and ADAM10 (1:4000; AbCaM Ab 39153). GAPDH (1:1000; sc-32233, Santa Cruz Biotechnology) was used to normalize the levels of analyzed proteins for variations in loading and transfer. All blots were incubated in horseradish peroxidase-conjugated secondary antibodies and target proteins visualized by ECL detection (Pierce, Rockford, IL, USA), followed by quantification through the “Quantity One” software (BioRad Laboratories, Hercules, CA, USA). Normalized values were then averaged and used for statistical comparisons. All representative blots shown in the figures arise from cut-out and pasted bands for reassembling the image. Of note, for each graph, the representative bands come from the same films.

4.5. Statistical Analysis

Normal distribution assumption for continuous variables was checked by Shapiro–Wilks and Kolmogorov–Smirnov tests. We observed a non-normal distribution of our data; therefore, a nonparametric approach was used for all statistical analyses. Data are reported as medians, along with interquartile range (first-third quartiles—IQR). Statistical analysis of qPCR and western blot experiments was performed in GraphPad Prism 7 by Mann–Whitney test. Statistical significance was also corrected for multiple comparisons using the Bonferroni-Dunn method (see Table S2). Spearman’s nonparametric correlation was used to test possible associations between nonparametric variables. Asterisks denote statistical significance as calculated by the specific statistical tests (*, p < 0.05).

5. Conclusions

In conclusion, we reported increased expression of DLG1 transcript in DLPFC and a reduction in CAP2 mRNA expression in the hippocampus of post-mortem SCZ brains, thus suggesting an overall altered expression of the genes encoding these dendritic spine proteins in SCZ.

Supplementary Materials

The following supporting information can be downloaded at: https://www.mdpi.com/article/10.3390/ijms23031539/s1.

Author Contributions

Conceptualization, A.U. and E.M.; methodology and data analysis, A.D.M., A.D.R., S.P., M.G., B.M. and T.N.; data revisions, A.M.I.; writing—original draft preparation, A.U. and E.M.; writing—review and editing, F.G., M.D.L., F.E., A.D.B. and E.M.; project administration, A.U.; A.D.M. and A.D.R. share co-first authorship. All authors have read and agreed to the published version of the manuscript.

Funding

This research was funded by MIUR (Ministero dell’Istruzione, dell’Università e della Ricerca, Progetto PRIN 2017—Project nr 2017M42834 to A.U. and A.d.B.), by the Brain and Behavior Research Foundation 2015 NARSAD Young Investigator Grant, no 23968 to F.E.), by the Italian Ministry of University and Research (PRIN 2017MYJ5TH to M.D.L., PRIN 2017B9NCSX to E.M., MIUR Progetto Eccellenza), by Fondazione Cariplo (Grant no. 2018-0511 to E.M.).

Institutional Review Board Statement

All procedures performed in studies involving animals were in accordance with the ethical standards of the Institutional Animal Care and Use Committee of the University of Milan (Italian Ministry of Health permit #5247B.N.YCK/2018). Animals were maintained on a 12 h light/dark cycle in a temperature-controlled room (22 °C) in cages with free access to food and water. Housing in the animal facility was performed in conformity with local and European Community regulations under the control of veterinarians with the assistance of trained personnel. All human tissue collection and processing were carried out under the regulations and licenses of the Human Tissue Authority and in accordance with the Human Tissue Act of 2004.

Informed Consent Statement

All material has been collected from donors for or from whom a written informed consent has been obtained.

Data Availability Statement

The data that support the findings of this study are available from the corresponding author upon reasonable request.

Acknowledgments

We thank Andrea Fontana for discussion and critical suggestions. Post-mortem human brain samples were provided by the Human Brain and Spinal Fluid Resource Center (Los Angeles Healthcare Center, Los Angeles, CA, USA) and the Netherlands Brain Bank (NBB) (Netherlands Institute for Neuroscience, Amsterdam).

Conflicts of Interest

The authors declare no conflict of interest.

References

  1. Rahman, T.; Lauriello, J. Schizophrenia: An Overview, Focus. Am. Psychiatr. Publ. 2016, 14, 300–307. [Google Scholar]
  2. Wang, S.H.; Hsiao, P.C.; Yeh, L.L.; Liu, C.M.; Liu, C.C.; Hwang, T.J.; Hsieh, M.H.; Chien, Y.L.; Lin, Y.T.; Chandler, S.D.; et al. Polygenic risk for schizophrenia and neurocognitive performance in patients with schizophrenia. Genes Brain Behav. 2018, 17, 49–55. [Google Scholar] [CrossRef] [PubMed] [Green Version]
  3. Lewis, D.A.; Levitt, P. Schizophrenia as a disorder of neurodevelopment. Annu. Rev. Neurosci. 2002, 25, 409–432. [Google Scholar] [CrossRef] [PubMed]
  4. Murray, R.M.; Bhavsar, V.; Tripoli, G.; Howes, O. 30 Years on: How the Neurodevelopmental Hypothesis of Schizophrenia Morphed into the Developmental Risk Factor Model of Psychosis. Schizophr. Bull. 2017, 43, 1190–1196. [Google Scholar] [CrossRef]
  5. Rujescu, D. Schizophrenia genes: On the matter of their convergence. Curr. Top. Behav. Neurosci. 2012, 12, 429–440. [Google Scholar] [CrossRef] [PubMed]
  6. MacDonald, M.L.; Alhassan, J.; Newman, J.T.; Richard, M.; Gu, H.; Kelly, R.M.; Sampson, A.R.; Fish, K.N.; Penzes, P.; Wills, Z.P.; et al. Selective Loss of Smaller Spines in Schizophrenia. Am. J. Psychiatry 2017, 174, 586–594. [Google Scholar] [CrossRef] [PubMed]
  7. Kaizuka, T.; Takumi, T. Postsynaptic density proteins and their involvement in neurodevelopmental disorders. J. Biochem. 2018, 163, 447–455. [Google Scholar] [CrossRef]
  8. Feng, Z.; Wu, X.; Zhang, M. Presynaptic bouton compartmentalization and postsynaptic density-mediated glutamate receptor clustering via phase separation. Neuropharmacology 2021, 193, 108622. [Google Scholar] [CrossRef]
  9. Sala, C.; Segal, M. Dendritic spines: The locus of structural and functional plasticity. Physiol. Rev. 2014, 94, 141–188. [Google Scholar] [CrossRef]
  10. Yang, G.; Pan, F.; Gan, W.B. Stably maintained dendritic spines are associated with lifelong memories. Nature 2009, 462, 920–924. [Google Scholar] [CrossRef] [Green Version]
  11. Bourne, J.; Harris, K.M. Do thin spines learn to be mushroom spines that remember? Curr. Opin. Neurobiol. 2007, 17, 381–386. [Google Scholar] [CrossRef] [PubMed]
  12. Glausier, J.R.; Lewis, D.A. Dendritic spine pathology in schizophrenia. Neuroscience 2013, 251, 90–107. [Google Scholar] [CrossRef] [PubMed] [Green Version]
  13. McIntosh, A.M.; Owens, D.C.; Moorhead, W.J.; Whalley, H.C.; Stanfield, A.C.; Hall, J.; Johnstone, E.C.; Lawrie, S.M. Longitudinal volume reductions in people at high genetic risk of schizophrenia as they develop psychosis. Biol. Psychiatry 2011, 69, 953–958. [Google Scholar] [CrossRef] [PubMed]
  14. Kuo, S.S.; Pogue-Geile, M.F. Variation in fourteen brain structure volumes in schizophrenia: A comprehensive meta-analysis of 246 studies. Neurosci. Biobehav. Rev. 2019, 98, 85–94. [Google Scholar] [CrossRef] [PubMed]
  15. Harrison, P.J. The hippocampus in schizophrenia: A review of the neuropathological evidence and its pathophysiological implications. Psychopharmacology 2004, 174, 151–162. [Google Scholar] [CrossRef] [PubMed]
  16. Tamminga, C.A.; Stan, A.D.; Wagner, A.D. The hippocampal formation in schizophrenia. Am. J. Psychiatry 2010, 167, 1178–1193. [Google Scholar] [CrossRef] [PubMed]
  17. Bourne, J.N.; Harris, K.M. Balancing structure and function at hippocampal dendritic spines. Annu. Rev. Neurosci. 2008, 31, 47–67. [Google Scholar] [CrossRef] [Green Version]
  18. Dalva, M.B.; McClelland, A.C.; Kayser, M.S. Cell adhesion molecules: Signalling functions at the synapse. Nat. Rev. Neurosci. 2007, 8, 206–220. [Google Scholar] [CrossRef] [Green Version]
  19. Cingolani, L.A.; Goda, Y. Actin in action: The interplay between the actin cytoskeleton and synaptic efficacy. Nat. Rev. Neurosci. 2008, 9, 344–356. [Google Scholar] [CrossRef]
  20. Hotulainen, P.; Hoogenraad, C.C. Actin in dendritic spines: Connecting dynamics to function. J. Cell Biol. 2010, 189, 619–629. [Google Scholar] [CrossRef] [Green Version]
  21. McGeachie, A.B.; Cingolani, L.A.; Goda, Y. Stabilising influence: Integrins in regulation of synaptic plasticity. Neurosci. Res. 2011, 70, 24–29. [Google Scholar] [CrossRef] [PubMed] [Green Version]
  22. Rudenko, G. Dynamic Control of Synaptic Adhesion and Organizing Molecules in Synaptic Plasticity. Neural. Plast. 2017, 2017, 6526151. [Google Scholar] [CrossRef] [PubMed] [Green Version]
  23. Pelucchi, S.; Vandermeulen, L.; Pizzamiglio, L.; Aksan, B.; Yan, J.; Konietzny, A.; Bonomi, E.; Borroni, B.; Padovani, A.; Rust, M.B.; et al. Cyclase-associated protein 2 dimerization regulates cofilin in synaptic plasticity and Alzheimer’s disease. Brain Commun. 2020, 2, fcaa086. [Google Scholar] [CrossRef] [PubMed]
  24. Marcello, E.; Gardoni, F.; Mauceri, D.; Romorini, S.; Jeromin, A.; Epis, R.; Borroni, B.; Cattabeni, F.; Sala, C.; Padovani, A.; et al. Synapse-associated protein-97 mediates alpha-secretase ADAM10 trafficking and promotes its activity. J. Neurosci. 2007, 27, 1682–1691. [Google Scholar] [CrossRef] [Green Version]
  25. Elias, G.M.; Nicoll, R.A. Synaptic trafficking of glutamate receptors by MAGUK scaffolding proteins. Trends Cell Biol. 2007, 17, 343–352. [Google Scholar] [CrossRef]
  26. Marcello, E.; Saraceno, C.; Musardo, S.; Vara, H.; de la Fuente, A.G.; Pelucchi, S.; Di Marino, D.; Borroni, B.; Tramontano, A.; Perez-Otano, I.; et al. Endocytosis of synaptic ADAM10 in neuronal plasticity and Alzheimer’s disease. J. Clin. Investig. 2013, 123, 2523–2538. [Google Scholar] [CrossRef]
  27. Lepeta, K.; Lourenco, M.V.; Schweitzer, B.C.; Martino Adami, P.V.; Banerjee, P.; Catuara-Solarz, S.; de La Fuente Revenga, M.; Guillem, A.M.; Haidar, M.; Ijomone, O.M.; et al. Synaptopathies: Synaptic dysfunction in neurological disorders—A review from students to students. J. Neurochem. 2016, 138, 785–805. [Google Scholar] [CrossRef]
  28. Taoufik, E.; Kouroupi, G.; Zygogianni, O.; Matsas, R. Synaptic dysfunction in neurodegenerative and neurodevelopmental diseases: An overview of induced pluripotent stem-cell-based disease models. Open Biol. 2018, 8, 180138. [Google Scholar] [CrossRef] [Green Version]
  29. Penzes, P.; Cahill, M.E.; Jones, K.A.; VanLeeuwen, J.E.; Woolfrey, K.M. Dendritic spine pathology in neuropsychiatric disorders. Nat. Neurosci. 2011, 14, 285–293. [Google Scholar] [CrossRef] [Green Version]
  30. Shirao, T.; Gonzalez-Billault, C. Actin filaments and microtubules in dendritic spines. J. Neurochem. 2013, 126, 155–164. [Google Scholar] [CrossRef]
  31. Begre, S.; Koenig, T. Cerebral disconnectivity: An early event in schizophrenia. Neuroscientist 2008, 14, 19–45. [Google Scholar] [CrossRef] [PubMed]
  32. Meyer-Lindenberg, A. From maps to mechanisms through neuroimaging of schizophrenia. Nature 2010, 468, 194–202. [Google Scholar] [CrossRef] [PubMed]
  33. Chen, Q.; Ursini, G.; Romer, A.L.; Knodt, A.R.; Mezeivtch, K.; Xiao, E.; Pergola, G.; Blasi, G.; Straub, R.E.; Callicott, J.H.; et al. Schizophrenia polygenic risk score predicts mnemonic hippocampal activity. Brain 2018, 141, 1218–1228. [Google Scholar] [CrossRef] [PubMed] [Green Version]
  34. Rampino, A.; Di Carlo, P.; Fazio, L.; Ursini, G.; Pergola, G.; De Virgilio, C.; Gadaleta, G.; Giordano, G.M.; Bertolino, A.; Blasi, G. Association of functional genetic variation in PP2A with prefrontal working memory processing. Behav. Brain Res. 2017, 316, 125–130. [Google Scholar] [CrossRef] [PubMed]
  35. Zeppillo, T.; Schulmann, A.; Macciardi, F.; Hjelm, B.E.; Focking, M.; Sequeira, P.A.; Guella, I.; Cotter, D.; Bunney, W.E.; Limon, A.; et al. Functional impairment of cortical AMPA receptors in schizophrenia. Schizophr. Res. 2020, in press. [CrossRef] [PubMed]
  36. Uezato, A.; Kimura-Sato, J.; Yamamoto, N.; Iijima, Y.; Kunugi, H.; Nishikawa, T. Further evidence for a male-selective genetic association of synapse-associated protein 97 (SAP97) gene with schizophrenia. Behav. Brain Funct. 2012, 8, 2. [Google Scholar] [CrossRef] [PubMed] [Green Version]
  37. Uezato, A.; Yamamoto, N.; Jitoku, D.; Haramo, E.; Hiraaki, E.; Iwayama, Y.; Toyota, T.; Umino, M.; Umino, A.; Iwata, Y.; et al. Genetic and molecular risk factors within the newly identified primate-specific exon of the SAP97/DLG1 gene in the 3q29 schizophrenia-associated locus. Am. J. Med. Genet. B Neuropsychiatr. Genet. 2017, 174, 798–807. [Google Scholar] [CrossRef] [PubMed]
  38. Xu, X.; Liang, C.; Lv, D.; Yin, J.; Luo, X.; Fu, J.; Yan, H.; Zhou, X.; Dai, Z.; Zhu, D.; et al. Association of the Synapse-Associated Protein 97 (SAP97) Gene Polymorphism with Neurocognitive Function in Schizophrenic Patients. Front. Psychiatry 2018, 9, 458. [Google Scholar] [CrossRef]
  39. Xu, X.; Wang, Y.; Zhou, X.; Yin, J.; Yu, H.; Wen, X.; Lv, D.; Zhu, D.; Xiong, S.; Yan, H.; et al. The genetic variations in SAP97 gene and the risk of schizophrenia in the Chinese Han population: A further study. Psychiatr. Genet. 2020, 30, 110–118. [Google Scholar] [CrossRef] [PubMed]
  40. Xu, X.; He, B.; Lin, Z.; Wang, X.; Yin, J.; Luo, X.; Luo, S.; Liang, C.; Wen, X.; Xiong, S.; et al. SAP97 rs3915512 Polymorphism Affects the Neurocognition of Schizophrenic Patients: A Genetic Neuroimaging Study. Front. Genet. 2020, 11, 572414. [Google Scholar] [CrossRef]
  41. Xu, X.; Luo, S.; Wen, X.; Wang, X.; Yin, J.; Luo, X.; He, B.; Liang, C.; Xiong, S.; Zhu, D.; et al. Genetic Contribution of Synapse-Associated Protein 97 to Orbitofrontal-Striatal-Thalamic Circuitry Connectivity Changes in First-Episode Schizophrenia. Front. Psychiatry 2021, 12, 691007. [Google Scholar] [CrossRef] [PubMed]
  42. Toyooka, K.; Iritani, S.; Makifuchi, T.; Shirakawa, O.; Kitamura, N.; Maeda, K.; Nakamura, R.; Niizato, K.; Watanabe, M.; Kakita, A.; et al. Selective reduction of a PDZ protein, SAP-97, in the prefrontal cortex of patients with chronic schizophrenia. J. Neurochem. 2002, 83, 797–806. [Google Scholar] [CrossRef] [PubMed]
  43. Hammond, J.C.; McCullumsmith, R.E.; Funk, A.J.; Haroutunian, V.; Meador-Woodruff, J.H. Evidence for abnormal forward trafficking of AMPA receptors in frontal cortex of elderly patients with schizophrenia. Neuropsychopharmacology 2010, 35, 2110–2119. [Google Scholar] [CrossRef] [PubMed] [Green Version]
  44. Dracheva, S.; McGurk, S.R.; Haroutunian, V. mRNA expression of AMPA receptors and AMPA receptor binding proteins in the cerebral cortex of elderly schizophrenics. J. Neurosci. Res. 2005, 79, 868–878. [Google Scholar] [CrossRef] [PubMed]
  45. Davies, A.F.; Mirza, G.; Sekhon, G.; Turnpenny, P.; Leroy, F.; Speleman, F.; Law, C.; van Regemorter, N.; Vamos, E.; Flinter, F.; et al. Delineation of two distinct 6p deletion syndromes. Hum. Genet. 1999, 104, 64–72. [Google Scholar] [CrossRef]
  46. Bremer, A.; Schoumans, J.; Nordenskjold, M.; Anderlid, B.M.; Giacobini, M. An interstitial deletion of 7.1 Mb in chromosome band 6p22.3 associated with developmental delay and dysmorphic features including heart defects, short neck, and eye abnormalities. Eur. J. Med. Genet. 2009, 52, 358–362. [Google Scholar] [CrossRef]
  47. Martins-de-Souza, D.; Maccarrone, G.; Wobrock, T.; Zerr, I.; Gormanns, P.; Reckow, S.; Falkai, P.; Schmitt, A.; Turck, C.W. Proteome analysis of the thalamus and cerebrospinal fluid reveals glycolysis dysfunction and potential biomarkers candidates for schizophrenia. J. Psychiatr. Res. 2010, 44, 1176–1189. [Google Scholar] [CrossRef]
  48. Wong, A.H.; Likhodi, O.; Trakalo, J.; Yusuf, M.; Sinha, A.; Pato, C.N.; Pato, M.T.; Van Tol, H.H.; Kennedy, J.L. Genetic and post-mortem mRNA analysis of the 14-3-3 genes that encode phosphoserine/threonine-binding regulatory proteins in schizophrenia and bipolar disorder. Schizophr. Res. 2005, 78, 137–146. [Google Scholar] [CrossRef]
  49. Hill, S.L.; Shao, L.; Beasley, C.L. Diminished levels of the chemokine fractalkine in post-mortem prefrontal cortex in schizophrenia but not bipolar disorder. World J. Biol. Psychiatry 2021, 22, 94–103. [Google Scholar] [CrossRef]
  50. Pantazopoulos, H.; Katsel, P.; Haroutunian, V.; Chelini, G.; Klengel, T.; Berretta, S. Molecular signature of extracellular matrix pathology in schizophrenia. Eur. J. Neurosci. 2021, 53, 3960–3987. [Google Scholar] [CrossRef]
  51. Tomasetti, C.; Dell’Aversano, C.; Iasevoli, F.; de Bartolomeis, A. Homer splice variants modulation within cortico-subcortical regions by dopamine D2 antagonists, a partial agonist, and an indirect agonist: Implication for glutamatergic postsynaptic density in antipsychotics action. Neuroscience 2007, 150, 144–158. [Google Scholar] [CrossRef] [PubMed]
  52. Tomasetti, C.; Dell’Aversano, C.; Iasevoli, F.; Marmo, F.; de Bartolomeis, A. The acute and chronic effects of combined antipsychotic-mood stabilizing treatment on the expression of cortical and striatal postsynaptic density genes. Prog. Neuropsychopharmacol. Biol. Psychiatry 2011, 35, 184–197. [Google Scholar] [CrossRef] [PubMed]
  53. De Bartolomeis, A.; Prinzivalli, E.; Callovini, G.; D’Ambrosio, L.; Altavilla, B.; Avagliano, C.; Iasevoli, F. Treatment resistant schizophrenia and neurological soft signs may converge on the same pathology: Evidence from explanatory analysis on clinical, psychopathological, and cognitive variables. Prog. Neuropsychopharmacol. Biol. Psychiatry 2018, 81, 356–366. [Google Scholar] [CrossRef] [PubMed]
  54. Laursen, T.M. Causes of premature mortality in schizophrenia: A review of literature published in 2018. Curr. Opin. Psychiatry 2019, 32, 388–393. [Google Scholar] [CrossRef] [PubMed]
  55. Olfson, M.; Gerhard, T.; Huang, C.; Crystal, S.; Stroup, T.S. Premature Mortality among Adults with Schizophrenia in the United States. JAMA Psychiatry 2015, 72, 1172–1181. [Google Scholar] [CrossRef] [PubMed] [Green Version]
  56. Marcello, E.; Epis, R.; Saraceno, C.; Gardoni, F.; Borroni, B.; Cattabeni, F.; Padovani, A.; Di Luca, M. SAP97-mediated local trafficking is altered in Alzheimer disease patients’ hippocampus. Neurobiol. Aging 2012, 33, 422.e1–422.e10. [Google Scholar] [CrossRef] [Green Version]
  57. Xu, X.; Xiong, S.; Zhou, X.; Chen, X.; Wang, X.; Liang, C.; Yin, J.; Luo, X.; Fu, J.; Wen, X.; et al. SAP97 polymorphisms associated with early onset Parkinson’s disease. Neurosci. Lett. 2020, 728, 134931. [Google Scholar] [CrossRef]
  58. Zhou, M.; Lin, Y.; Lu, L.; Zhang, Z.; Guo, W.; Peng, G.; Zhang, W.; Zhu, Z.; Wu, Z.; Mo, M.; et al. Association of ADAM10 gene variants with sporadic Parkinson’s disease in Chinese Han population. J. Gene Med. 2021, 23, e3319. [Google Scholar] [CrossRef]
  59. Fourie, C.; Kim, E.; Waldvogel, H.; Wong, J.M.; McGregor, A.; Faull, R.L.; Montgomery, J.M. Differential Changes in Postsynaptic Density Proteins in Postmortem Huntington’s Disease and Parkinson’s Disease Human Brains. J. Neurodegener. Dis. 2014, 2014, 938530. [Google Scholar] [CrossRef] [Green Version]
  60. Nash, J.E.; Johnston, T.H.; Collingridge, G.L.; Garner, C.C.; Brotchie, J.M. Subcellular redistribution of the synapse-associated proteins PSD-95 and SAP97 in animal models of Parkinson’s disease and L-DOPA-induced dyskinesia. FASEB J. 2005, 19, 583–585. [Google Scholar] [CrossRef]
  61. Piccoli, G.; Verpelli, C.; Tonna, N.; Romorini, S.; Alessio, M.; Nairn, A.C.; Bachi, A.; Sala, C. Proteomic analysis of activity-dependent synaptic plasticity in hippocampal neurons. J. Proteome Res. 2007, 6, 3203–3215. [Google Scholar] [CrossRef] [PubMed]
  62. Braak, H.; Braak, E. Neuropathological stageing of Alzheimer-related changes. Acta Neuropathol. 1991, 82, 239–259. [Google Scholar] [CrossRef] [PubMed]
  63. McKhann, G.; Drachman, D.; Folstein, M.; Katzman, R.; Price, D.; Stadlan, E.M. Clinical diagnosis of Alzheimer’s disease: Report of the NINCDS-ADRDA Work Group under the auspices of Department of Health and Human Services Task Force on Alzheimer’s Disease. Neurology 1984, 34, 939–944. [Google Scholar] [CrossRef] [PubMed] [Green Version]
  64. Hughes, A.J.; Daniel, S.E.; Kilford, L.; Lees, A.J. Accuracy of clinical diagnosis of idiopathic Parkinson’s disease: A clinico-pathological study of 100 cases. J. Neurol. Neurosurg. Psychiatry 1992, 55, 181–184. [Google Scholar] [CrossRef] [PubMed] [Green Version]
  65. Braak, H.; Braak, E. Staging of Alzheimer’s disease-related neurofibrillary changes. Neurobiol. Aging 1995, 16, 271–278; discussion 278–284. [Google Scholar] [CrossRef]
Figure 1. Colocalization of CAP2, SAP97, and ADAM10 in primary hippocampal neurons. (a) Schematic representation of CAP2, SAP97, and ADAM10 in the glutamatergic synapse. (b) Fluorescence immunocytochemistry of ADAM10 (green), CAP2 (red), and SAP97 (blue) in primary hippocampal neurons. In the last panel (merge), a colocalization image is shown. Scale bar: 5 μm.
Ijms 23 01539 g001
Figure 2. Correlation analysis of CAP2, DLG1, and ADAM10 mRNA expression with age and PMI in the post-mortem dorsolateral prefrontal cortex and hippocampus of schizophrenia patients. Analysis of correlation between age and mRNA expression of CAP2, DLG1, and ADAM10 in the dorsolateral prefrontal cortex of (a,e,i) control subjects (CTRL, n = 19) and (b,f,j) schizophrenia patients (SCZ, n = 20). Correlation analysis between PMI and mRNA expression of CAP2, DLG1, and ADAM10 in the dorsolateral prefrontal cortex of (c,g,k) control subjects (n = 19) and (d,h,l) schizophrenia patients (n = 20). Analysis of correlation between age and mRNA expression of CAP2, DLG1, and ADAM10 in the hippocampus of (m,q,u) control subjects (CAP2/ADAM10: n = 20; DLG1: n = 19) and (n,r,v) schizophrenia patients (CAP2: n = 20; DLG1: n = 18; ADAM10: n = 19). Correlation analysis between PMI and mRNA expression of CAP2, DLG1, and ADAM10 in the hippocampus of (o,s,w) control subjects (CAP2/ADAM10: n = 20; DLG1: n = 19) and (p,t,x) schizophrenia patients (CAP2: n = 20; DLG1: n = 18; ADAM10: n = 19).
Ijms 23 01539 g002aIjms 23 01539 g002b
Figure 3. Analysis of mRNA expression of CAP2, DLG1, and ADAM10 in the post-mortem dorsolateral prefrontal cortex and hippocampus of SCZ patients. Expression levels of (a) CAP2, (b) DLG1 and (c) ADAM10 mRNA in the post-mortem dorsolateral prefrontal cortex (DLPFC) of schizophrenia-affected patients (SCZ) (n = 20) and control subjects (CTRL) (n = 19). Expression levels of (d) CAP2, (e) DLG1, and (f) ADAM10 mRNA in the post-mortem hippocampus of schizophrenic patients and controls (CAP2: CTRL/SCZ, n = 20; DLG1: CTRL, n = 19 SCZ, n = 18; ADAM10: CTRL, n = 20, SCZ, n = 19). CAP2, DLG1, and ADAM10 transcript levels were detected by quantitative RT-PCR, normalized to the mean of two housekeeping genes (ACTB and PPIA), and expressed as 2−ΔΔCt. Each dot represents values from a single subject. * p < 0.05 compared to the control group (Mann–Whitney test).
Ijms 23 01539 g003
Figure 4. Correlation analysis of CAP2, SAP97, and ADAM10 protein levels with age and PMI in the post-mortem dorsolateral prefrontal cortex and hippocampus of schizophrenia patients. Analysis of correlation between age and protein levels of CAP2, SAP97, and ADAM10 in the dorsolateral prefrontal cortex of (a,e,i) control subjects (CTRL, n = 20) and (b,f,j) schizophrenia patients (SCZ, n = 20). Correlation analysis between PMI and protein levels of CAP2, SAP97, and ADAM10 in the dorsolateral prefrontal cortex of (c,g,k) control subjects (n = 20) and (d,h,l) schizophrenia patients (n = 20). Analysis of correlation between age and protein levels of CAP2, SAP97, and ADAM10 in the hippocampus of (m,q,u) control subjects (n = 20) and (n,r,v) schizophrenia patients (n = 20). Correlation analysis between PMI and protein levels of CAP2, SAP97, and ADAM10 in the hippocampus of (o,s,w) control subjects (n = 20) and (p,t,x) schizophrenia patients (n = 20).
Ijms 23 01539 g004aIjms 23 01539 g004b
Figure 5. Analysis of protein expression of CAP2, SAP97, and ADAM10 in the post-mortem dorsolateral prefrontal cortex and hippocampus of schizophrenia patients. Quantification of CAP2, SAP97, and ADAM10 protein levels in the total homogenates of post-mortem (ac) dorsolateral prefrontal cortex (DLPFC) and (eg) hippocampus of schizophrenic subjects (SCZ, n = 20) and control group (CTRL, n = 20). The variations of CAP2, SAP97, and ADAM10 levels in schizophrenic patients are expressed as a percentage (%) of the control subjects. All markers were normalized to GAPDH for variations in loading and transfer. (d,h) Representative images of immunoblots of CAP2, SAP97, ADAM10 performed in the DLPFC and hippocampus of the control group and schizophrenia patients. Each dot represents values from a single subject. All experiments were analyzed by the Mann–Whitney test.
Ijms 23 01539 g005
Figure 6. Correlation analysis of CAP2, SAP97, and ADAM10 mRNA and protein expression with age and PMI in the post-mortem superior frontal gyrus of Alzheimer’s and Parkinson’s disease patients. Analysis of correlation between age and mRNA expression of CAP2, DLG1, and ADAM10 in the superior frontal gyrus of (a,d,g) control subjects (CTRL, n = 8), (b,e,h) Parkinson’s disease patients (PD, CAP2/DLG1 n = 9, ADAM10: n = 8), and (c,f,i) Alzheimer’s (AD, CAP2: n = 7, DLG1/ADAM10: n = 8). Analysis of correlation between age and protein levels of CAP2, SAP97, and ADAM10 in the superior frontal gyrus of (a′,d′,g′) control subjects (CTRL, n = 10), (b′,e′,h′) Parkinson’s disease patients (PD, n = 10), and (c′,f′,i′) Alzheimer’s disease patients (AD, n = 10). Analysis of correlation between PMI and mRNA expression of CAP2, DLG1, and ADAM10 in the superior frontal gyrus of (j,m,p) control subjects (CTRL, n = 8), (k,n,q) Parkinson’s disease patients (PD, CAP2/DLG1 n = 9, ADAM10: n = 8), and (l,o,r) Alzheimer’s disease patients (AD, CAP2: n = 7, DLG1/ADAM10: n = 8). Analysis of correlation between PMI and protein levels of CAP2, SAP97, and ADAM10 in the superior frontal gyrus of (j′,m′,p′) control subjects (CTRL, n = 10), (k′,n′,q′) Parkinson’s disease patients (PD, n = 10), and (l′,o′,r′) Alzheimer’s disease patients (AD, n = 10).
Ijms 23 01539 g006aIjms 23 01539 g006b
Figure 7. Analysis of transcript of CAP2, DLG1, and ADAM10 in the post-mortem superior frontal gyrus of Alzheimer’s and Parkinson’s disease patients. mRNA expression levels of (a) CAP2 (CTRL, n = 8, PD, n = 9, AD, n = 7), (b) DLG1 (CTRL, n = 8, PD, n = 9, AD, n = 8), and (c) ADAM10 (CTRL/PD/AD, n = 8) in the post-mortem superior frontal gyrus. CAP2, DLG1, and ADAM10 transcript levels were detected by quantitative RT-PCR, normalized to the mean of two housekeeping genes (ACTB and PPIA), and expressed as 2−ΔΔCt. Each dot represents values from a single subject. * p < 0.05 compared to the control group (Mann–Whitney test).
Ijms 23 01539 g007
Figure 8. Analysis of protein expression of CAP2, SAP97, and ADAM10 in the post-mortem superior frontal gyrus of Alzheimer’s and Parkinson’s disease patients. Quantification of western blot analysis of (a) CAP2, (b) SAP97, and (c) ADAM10 protein levels in the total homogenates of post-mortem superior frontal gyrus (SFG) of Parkinson’s (n = 10), Alzheimer’s disease patients (n = 10), and control subjects (n = 10). The variations of CAP2, SAP97, and ADAM10 levels in patients with Parkinson’s and Alzheimer’s disease are expressed as a percentage (%) of the control subjects. All markers were normalized to GAPDH for variations in loading and transfer. (d) Representative images of immunoblots of CAP2, SAP97, and ADAM10 performed in the SFG of Parkinson’s, Alzheimer’s disease patients, and control subjects. Each dot represents values from a single subject. All experiments were analyzed by the Mann–Whitney test.
Ijms 23 01539 g008
Table 1. Demographic and clinical characteristics of control subjects and schizophrenia patients.
CharacteristicsControlSchizophreniap-Value
Subjects (total number)2020--
Gender (M/F)16/412/80.301 a
Age (years, median (IQR))73.50 (66.00–80.25)52.50 (39.50–61.25)<0.001 b
PMI (hours, median (IQR))12.90 (11.80–16.32)15.25 (12.52–24.58)0.020 c
pH (median, (IQR))6.54 (6.49–6.63)6.50 (6.42–6.56)0.485 c
Abbreviations: M/F: number of males/females; PMI: post-mortem interval; IQR: Interquartile Range (i.e., first-third quartiles). Continuous variables are reported as median along with IQR; a Chi-Square test; b two-sample t-test; c two-sample t-test on log-transformed values.
Table 2. Demographic and clinical characteristics of control subjects, Alzheimer’s and Parkinson’s disease patients.
CharacteristicsControlAlzheimer’s DiseaseParkinson’s Disease
NMedianNMedianNMedian
Subjects (total number)10 10 10
Gender (M/F)10/0 10/0 10/0
Age (years, median (IQR)) 85.00 (79.00–88.25) 85.50 (82.00–88.00) 85.00 (81.75–86.00)
PMI (hours, median (IQR)) 5.87 (5.62–6.58) 5.37 (5.04–6.42) 5.79 (4.42–6.45)
Amyloid (A/B/C/O)6/2/0/2 0/1/9/0 3/3/0/4
Braak (0/I/II/III/IV/V/VI)0/0/3/5/2/0/0 0/0/0/0/0/7/3 0/0/3/4/0/0/0
Braak LB (0/I/II/III/IV/V/VI)2/2/0/0/0/0/0 0/0/0/0/0/0/0 0/0/0/0/2/2/6
Liquor pH (median (IQR)) 6.37 (6.29–6.72) 6.28 (6.13–6.49) 6.33 (6.16–6.72)
Abbreviations: M/F: males/females; PMI: post-mortem interval; IQR: interquartile range (i.e., first-third quartiles); N: number. Continuous variables are reported as median along with IQR.
Publisher’s Note: MDPI stays neutral with regard to jurisdictional claims in published maps and institutional affiliations.

