Article

Identification of a Novel Theranostic Signature of Metabolic and Immune-Inflammatory Dysregulation in Myocardial Infarction, and the Potential Therapeutic Properties of Ovatodiolide, a Diterpenoid Derivative

by
Alexander T. H. Wu
1,2,3,4,5,†,
Bashir Lawal
6,7,†,
Yew-Min Tzeng
8,
Chun-Che Shih
5,9,10,11 and
Chun-Ming Shih
5,12,13,*
1
The Ph.D. Program of Translational Medicine, College of Medical Science and Technology, Taipei Medical University, Taipei 11031, Taiwan
2
Clinical Research Center, Taipei Medical University Hospital, Taipei Medical University, Taipei 11031, Taiwan
3
TMU Research Center of Cancer Translational Medicine, Taipei Medical University, Taipei 11031, Taiwan
4
Graduate Institute of Medical Sciences, National Defense Medical Center, Taipei 11490, Taiwan
5
Taipei Heart Institute, Taipei Medical University, Taipei 11031, Taiwan
6
Ph.D. Program for Cancer Molecular Biology and Drug Discovery, College of Medical Science and Technology, Taipei Medical University and Academia Sinica, Taipei 11031, Taiwan
7
Graduate Institute for Cancer Biology & Drug Discovery, College of Medical Science and Technology, Taipei Medical University, Taipei 11031, Taiwan
8
Department of Life Science, National Taitung University, Taitung 95092, Taiwan
9
Division of Cardiovascular Surgery, Department of Surgery, Wan Fang Hospital, Taipei Medical University, Taipei 11696, Taiwan
10
Department of Surgery, School of Medicine, College of Medicine, Taipei Medical University, Taipei 11031, Taiwan
11
Institute of Clinical Medicine, National Yang Ming Chiao Tung University, Taipei 11221, Taiwan
12
Department of Internal Medicine, School of Medicine, College of Medicine, Taipei Medical University, Taipei 11031, Taiwan
13
Division of Cardiology, Department of Internal Medicine, Taipei Medical University Hospital, Taipei 11031, Taiwan
*
Author to whom correspondence should be addressed.
These authors contributed equally to this work.
Int. J. Mol. Sci. 2022, 23(3), 1281; https://doi.org/10.3390/ijms23031281
Submission received: 2 December 2021 / Revised: 18 January 2022 / Accepted: 21 January 2022 / Published: 24 January 2022
(This article belongs to the Special Issue Application of In Silico Techniques in Drug Design)

Abstract

:
Myocardial infarction (MI) is a multifactorial global disease, recognized as one of the leading causes of cardiovascular morbidity and mortality. Timely and correct diagnoses and effective treatments could significantly reduce incidence of complications and improve patient prognoses. In this study, seven unconventional differentially expressed genes (DEGs) (MAN2A2, TNFRSF12A, SPP1, CSNK1D, PLAUR, PFKFB3, and CXCL16, collectively termed the MTSCPPC signature) were identified through integrating DEGs from six MI microarray datasets. The pathological and theranostic roles of the MTSCPPC signature in MI were subsequently analyzed. We evaluated interactions of the MTSCPPC signature with ovatodiolide, a bioactive compound isolated from Anisomeles indica (L.) Kuntze, using in silico molecular docking tools and compared it to specific inhibitors of the members of the MTSCPPC signature. Single-cell transcriptomic analysis of the public databases revealed high expression levels of the MTSCPPC signature in immune cells of adult human hearts during an MI event. The MTSCPPC signature was significantly associated with the cytokine–cytokine receptor interactions, chemokine signaling, immune and inflammatory responses, and metabolic dysregulation in MI. Analysis of a micro (mi)RNA regulatory network of the MTSCPPC signature suggested post-transcriptional activation and the roles of miRNAs in the pathology of MI. Our molecular docking analysis suggested a higher potential for ovatodiolide to target MAN2A2, CSNK1D, and TNFRSF12A. Collectively, the results derived from the present study further advance our understanding of the complex regulatory mechanisms of MI and provide a potential MI theranostic signature with ovatodiolide as a therapeutic candidate.

1. Introduction

Myocardial infarction (MI) is a multifactorial global disease, recognized as one of the leading causes of cardiovascular morbidity and mortality in both men and women [1]. It is caused by the partial or complete occlusion of a coronary artery, which blocks the supply of oxygen and nutrients to the myocardium, leading to myocardial cell death [2]. MI may occur transiently or in a disastrous manner that could lead to hemodynamic valve deterioration and sudden death [2,3]. Risk factors for MI are classified into non-modifiable, modifiable, and emerging risk factors [4]. Non-modifiable risk factors include age, gender, and family history; modifiable risk factors are related to one’s lifestyle (such as a poor diet, smoking, alcohol intake, a sedentary lifestyle, etc.), dyslipidemia, diabetes, hypertension, and metabolic disorders, while emerging risk factors are coronary artery calcification (CAC), C-reactive protein (CRP), homocysteine, fibrinogen, and lipoproteins [4].
Timely and correct diagnoses and effective treatments can significantly reduce incidence of complications and improve the prognosis of patients with MI [5]. The current diagnostic methods for MI involve a physical examination, clinical history, cardiac markers, electrocardiography, and evidence of myocardial ischemia. The levels of cardiac-specific troponins T (cTnT) and I (cTnI) are the preferred biomarkers for the evaluation of myocardial injury and high-sensitivity (hs)-cTn assays are recommended for routine clinical use [4,6]. Other less important serum biomarkers include creatine kinase (CK), MB isoforms of creatine (CK-MB), and myoglobin [4]. However, the reliability of these biomarkers is limited by their inadequate specificity and sensitivity [7,8,9,10], which can lead to false diagnostic outcomes.
Although myocardial injury (defined by an elevated cTn value) is a prerequisite for the diagnosis of MI, the presence or absence of nonischemic myocardial injury must be confirmed in order to establish a reliable diagnosis [11]. Hence, the current Fourth Universal Definition of Myocardial Infarction Consensus Document defined clinical criteria for MI as the presence of acute myocardial injury detected by elevated cTn values above the 99th percentile upper reference limit (URL) in the setting of evidence of acute myocardial ischemia [12].
Despite increased understanding of the causes and treatments of MI, high rates of morbidity and mortality still remain [13]. Although great progress has been made with percutaneous coronary intervention (PCI), which provided good treatment outcomes in MI Patients presenting with ST-segment elevation [14] as well as in patients presenting without persistent ST-segment elevation [15], there is an urgent need to find more sensitive and specific genetic markers for early diagnoses and for the development of novel targeted therapies for better prognoses of patients with MI [16].
Bioinformatics or in silico analysis of clinical data, novel targets, and drug candidate identification are indispensable parts of modern research strategies for disease prevention and treatment [17]. Targets for drug discovery could be biological pathways, abnormal molecular phenotypes, essential nodes of biological network or molecular functions, and disease-related microRNAs, genes, or proteins [18,19,20,21,22,23]. In the present study, differentially expressed genes (DEGs) from six MI microarray datasets were integrated to identify overlapping DEGs, and the pathological and theranostic roles of these DEGs in MI were subsequently analyzed. The pathological mechanisms of MI involved the interaction of several regulatory networks involving cytokine–cytokine receptors, chemokine signaling, immune and inflammatory responses, and metabolic dysregulation. Hence, targeted modulation of immune, inflammatory, and metabolic pathways could yield a novel and effective therapeutic approach for preventing and treating MI.
Natural products are rich sources of health-promoting bioactive compounds for treating numerous diseases [24,25,26,27]. Ovatodiolide is a bioactive compound isolated from a Taiwanese plant, Anisomeles indica (L.) Kuntze, that is commonly and traditionally used for treating inflammation-associated diseases [28]. The therapeutic properties of ovatodiolide against various diseases are well described in the literature [28,29,30,31,32,33,34]. It is also an important modulator of inflammatory responses [35] and can serve as a potential immunotherapeutic agent [36]. However, despite the extensive medicinal use of the plant, there are no reports available on its use for MI. The use of molecular docking has greatly aided drug development by providing information related to interactions of therapeutic agents with molecular targets of disease [37,38]. Hence, we evaluated interactions of ovatodiolide with DEGs using in silico molecular docking studies. Collectively, results from the present study have aided our understanding of the complex regulatory mechanisms of MI and provide a promising approach for MI theranostic markers. We await future validation and investigation of the therapeutic role of ovatodiolide in experimental and clinical MI.

2. Results

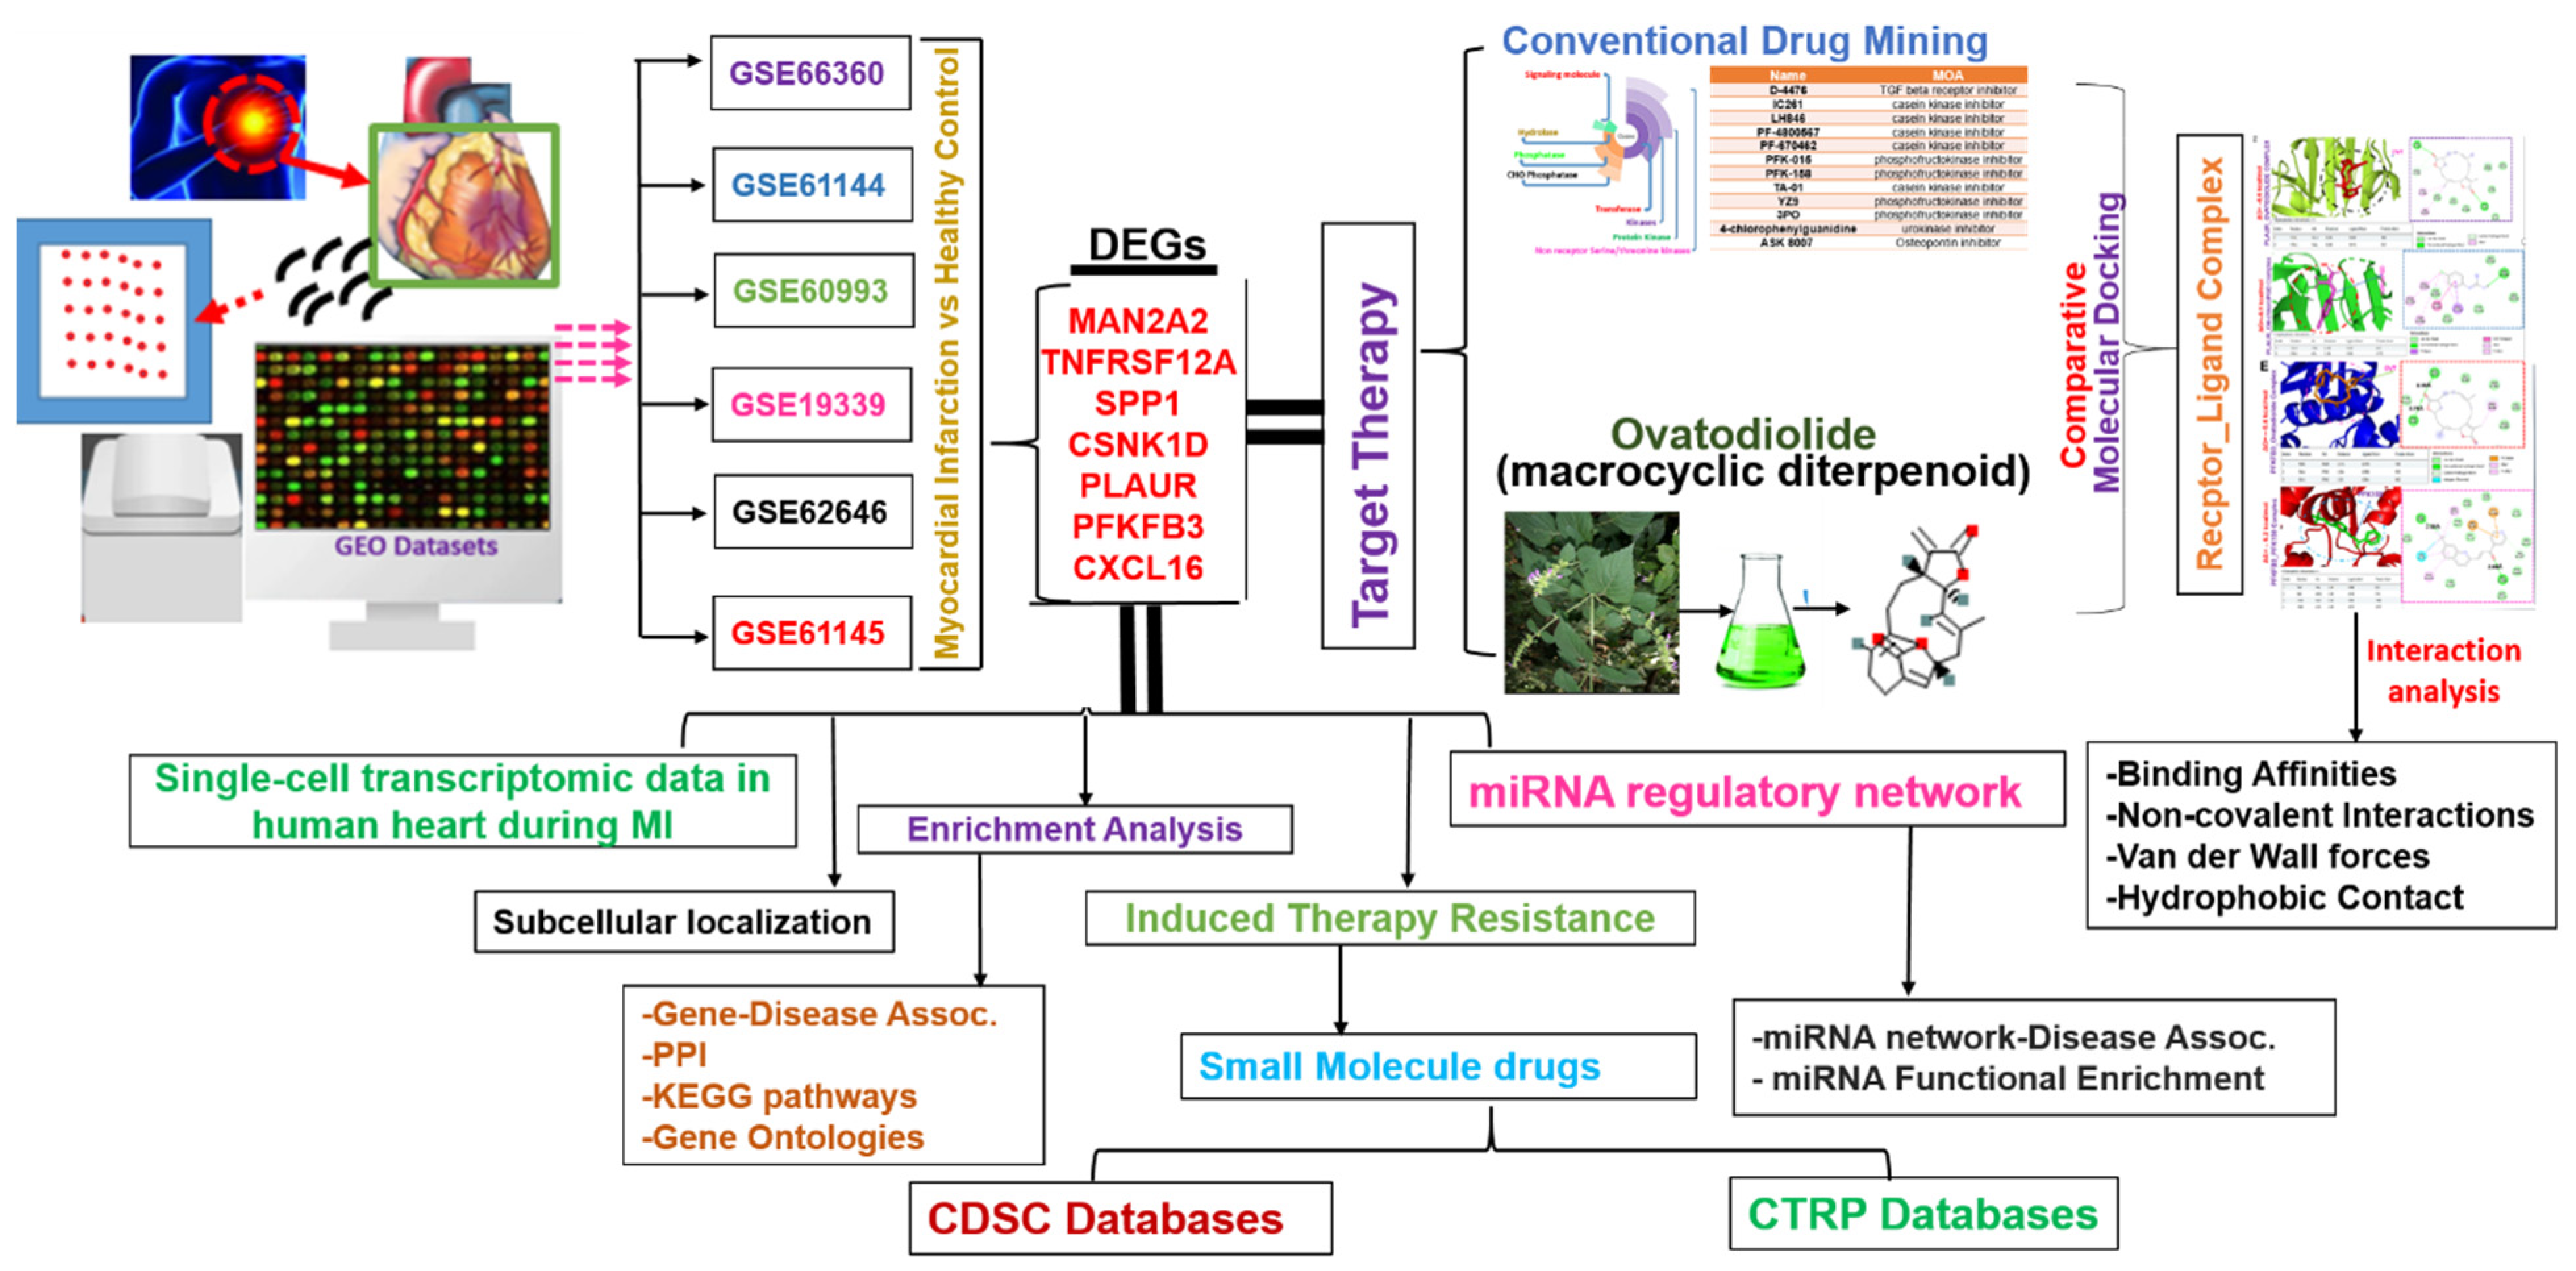
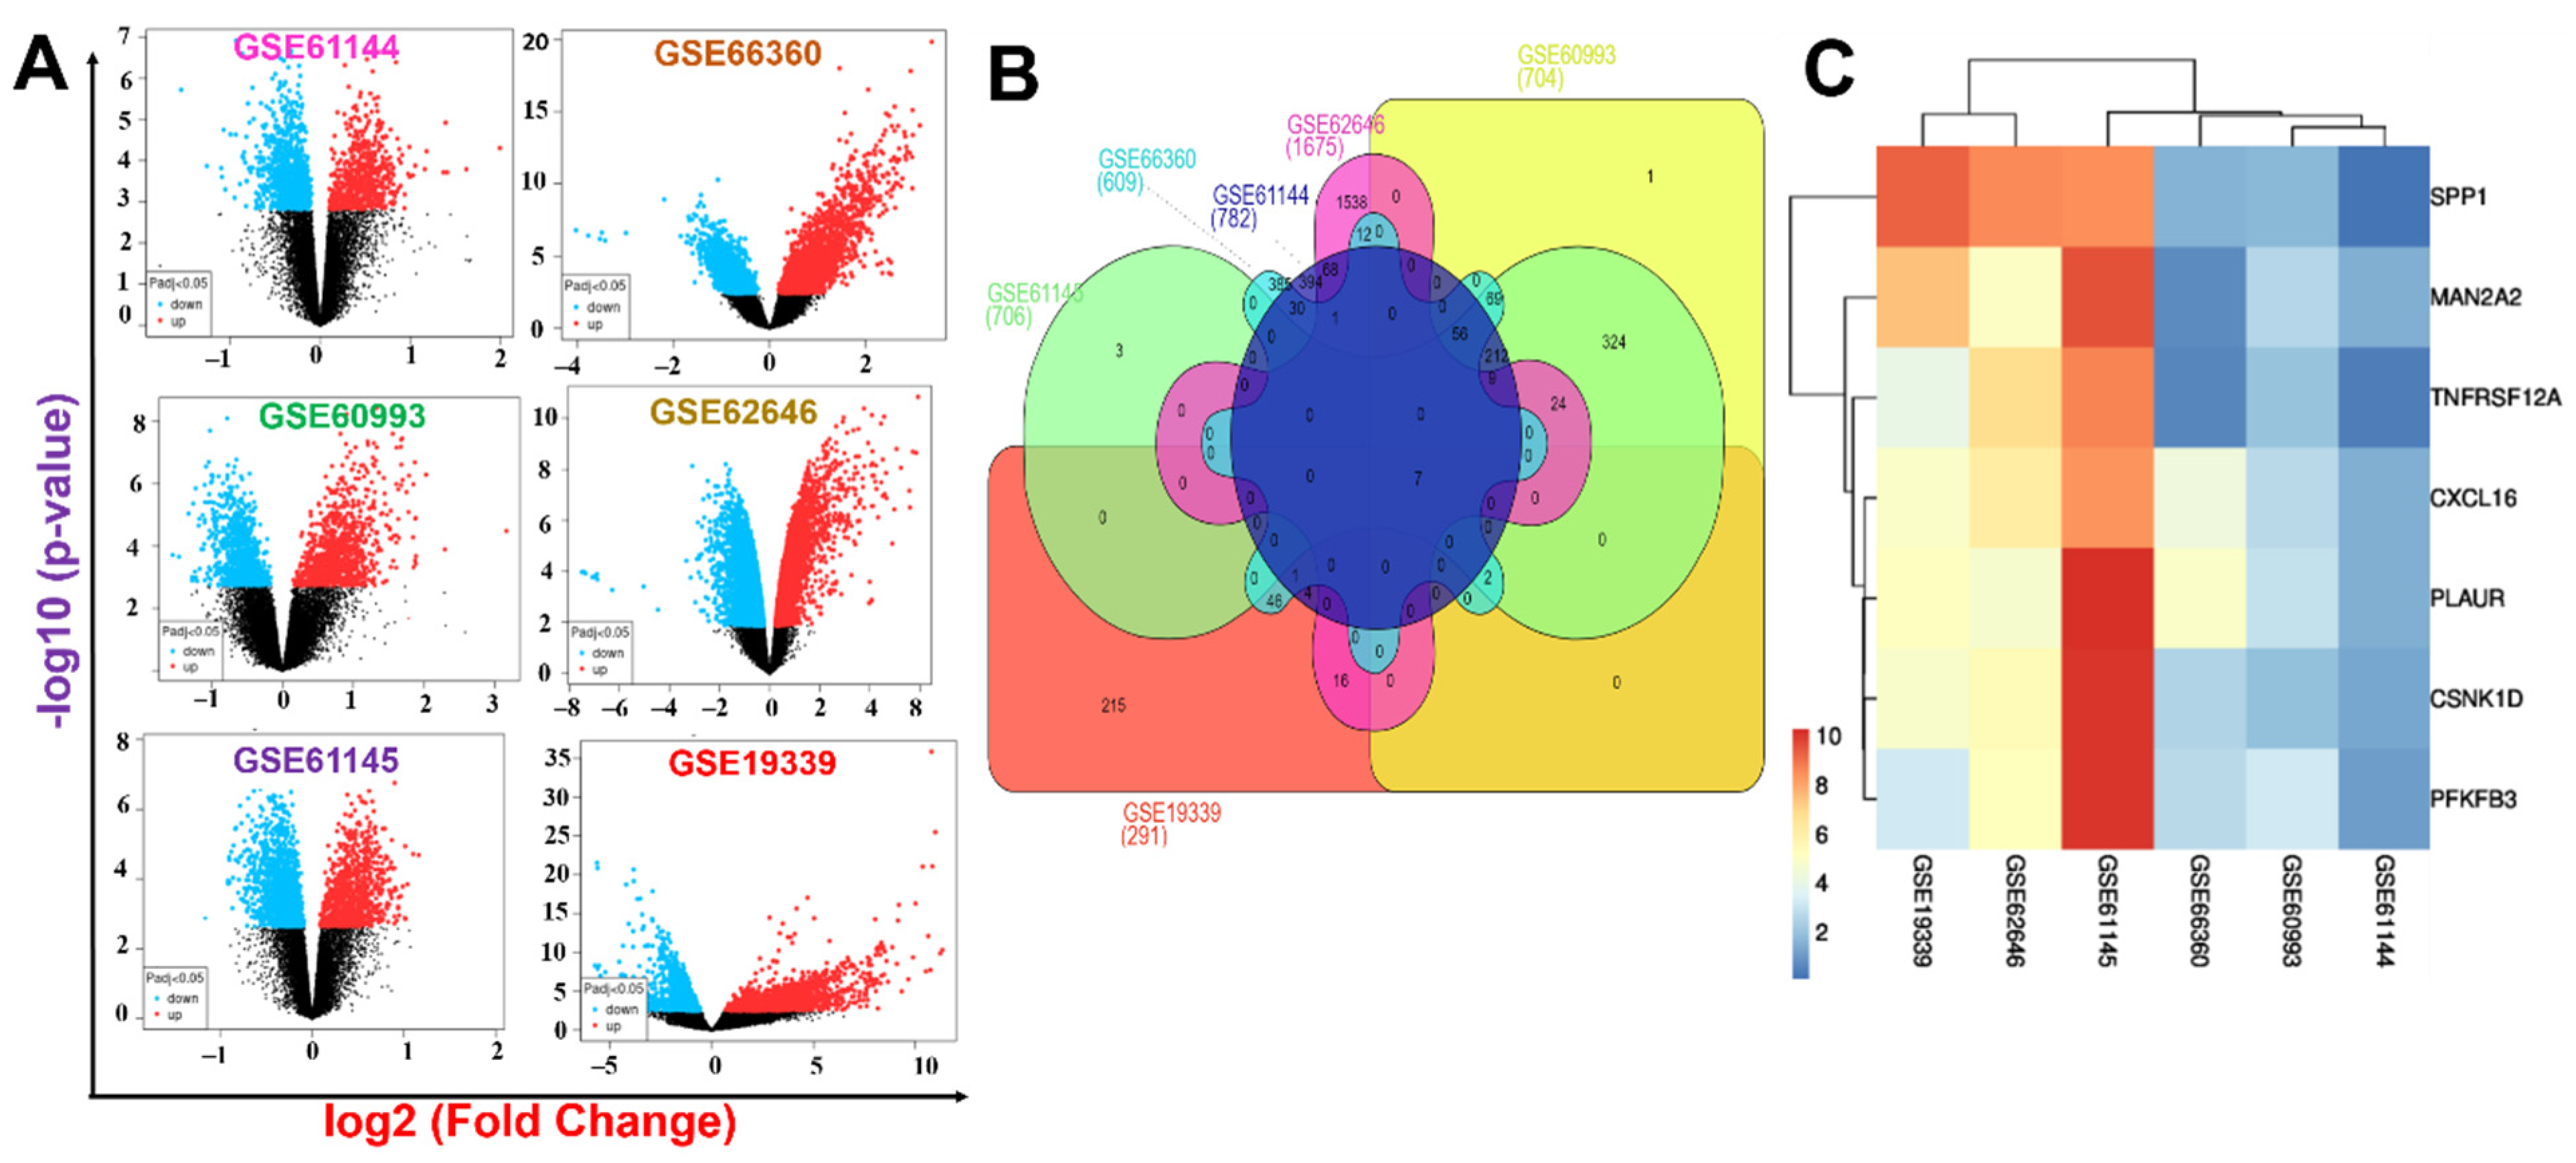
2.1. Identification of MAN2A2/TNFRSF12A/SPP1/CSNK1D/PLAUR/PFKFB3/CXCL16 as a Novel Pathological Signature of Myocardial Infarction

To study deregulated genes associated with MI, we analyzed DEGs between healthy and MI cohorts. The workflow of the entire study is summarized in Figure 1. DEGs from six GEO transcriptomic datasets of MI patients (GSE66360, GSE62646, GSE19339, GSE62646, GSE61145, and GSE61144) were selected based on established cutoff values. The distributions and numbers of DEGs in each dataset, including up- and downregulated DEGs are presented in volcano plots (Figure 2A). When DEGs in each series were intersected with one another (Figure 2B), seven genes (MAN2A2, TNFRSF12A, SPP1, CSNK1D, PLAUR, PFKFB3, and CXCL16), considered as integrated DEGs (Figure 2C), were obtained. Furthermore, we conducted a meta-analysis of the six databases and identified a total of 4258 and 4754 differentially expressed genes based on the size effect combination and p-value combination analysis, respectively (Figure 2). Similar to the DEGs integration method, our meta-analysis also revealed that MAN2A2, TNFRSF12A, SPP1, CSNK1D, PLAUR, PFKFB3, and CXCL16 were significantly over-expressed in all the datasets with effect size combination and p-value combination ranges of 5.5~10 zval and 0.0081~1.5 × 10⁻⁹ fdr_pval respectively (Table 1). The complete results of size effect and p-value combination meta-analysis are presented in supplementary file (File S3). Meeting all the cutoff criteria across all the data set analyzed, MAN2A2/TNFRSF12A/SPP1/CSNK1D/PLAUR/PFKFB3/CXCL16 (herein we termed it MTSCPPC signature) was identified as a novel pathological signature of myocardial infarction and was used for subsequent analyses.

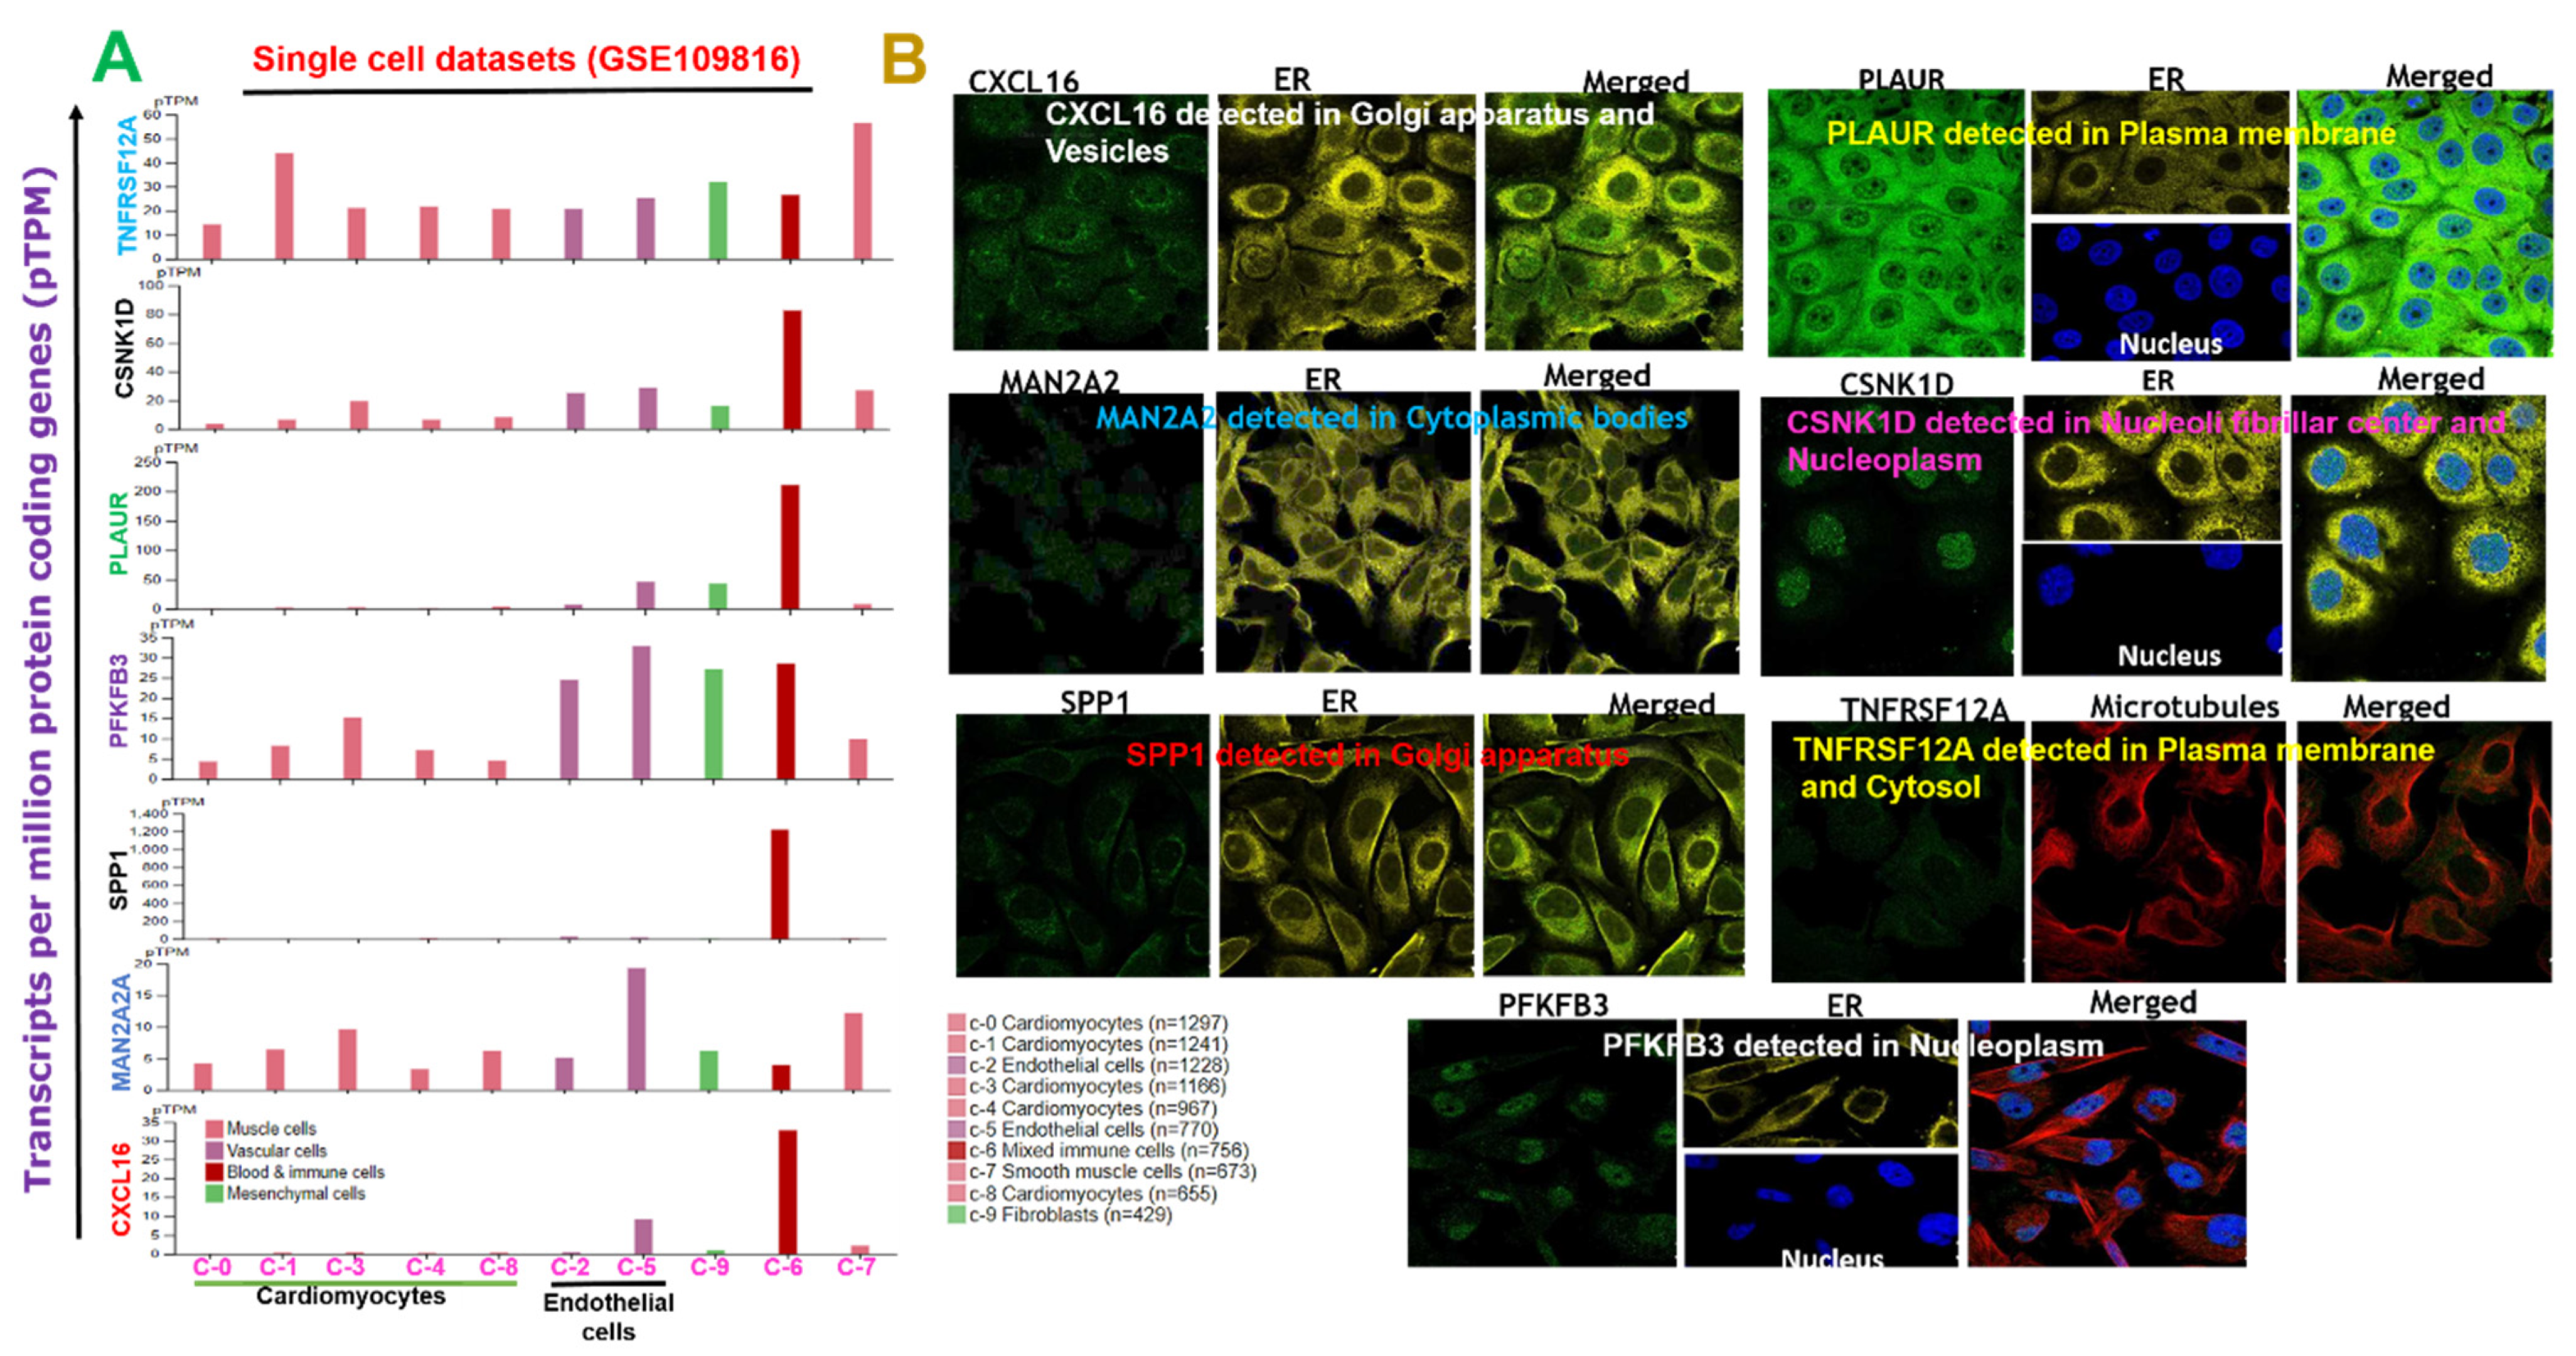
2.2. Subcellular Localization and Single-Cell Transcriptomic Data of DEGs Signature in the Adult Human Heart during MI

We retrieved single-cell transcriptomic datasets of the adult human heart during MI and compared transcript levels of DEGs in different cells. Our analysis revealed that out of the nine single cells comprising cardiomyocytes, immune cells, endothelial cells, smooth muscle cells, and fibroblasts, expressions of the gene set were highly expressed in immune cells and endothelial cells compared to other single cells of heart tissues during MI (Figure 3A). However, analysis of immunofluorescence (IF) staining from the HPA database for subcellular localizations revealed localization discrepancies of the target genes; PLAUR and TNFRSF12A were localized to plasma membranes, CSNK1D and PFKFB3 were localized in the nucleoplasm, and CXCL16 and SPP1 were localized to the Golgi apparatus (Figure 3B).

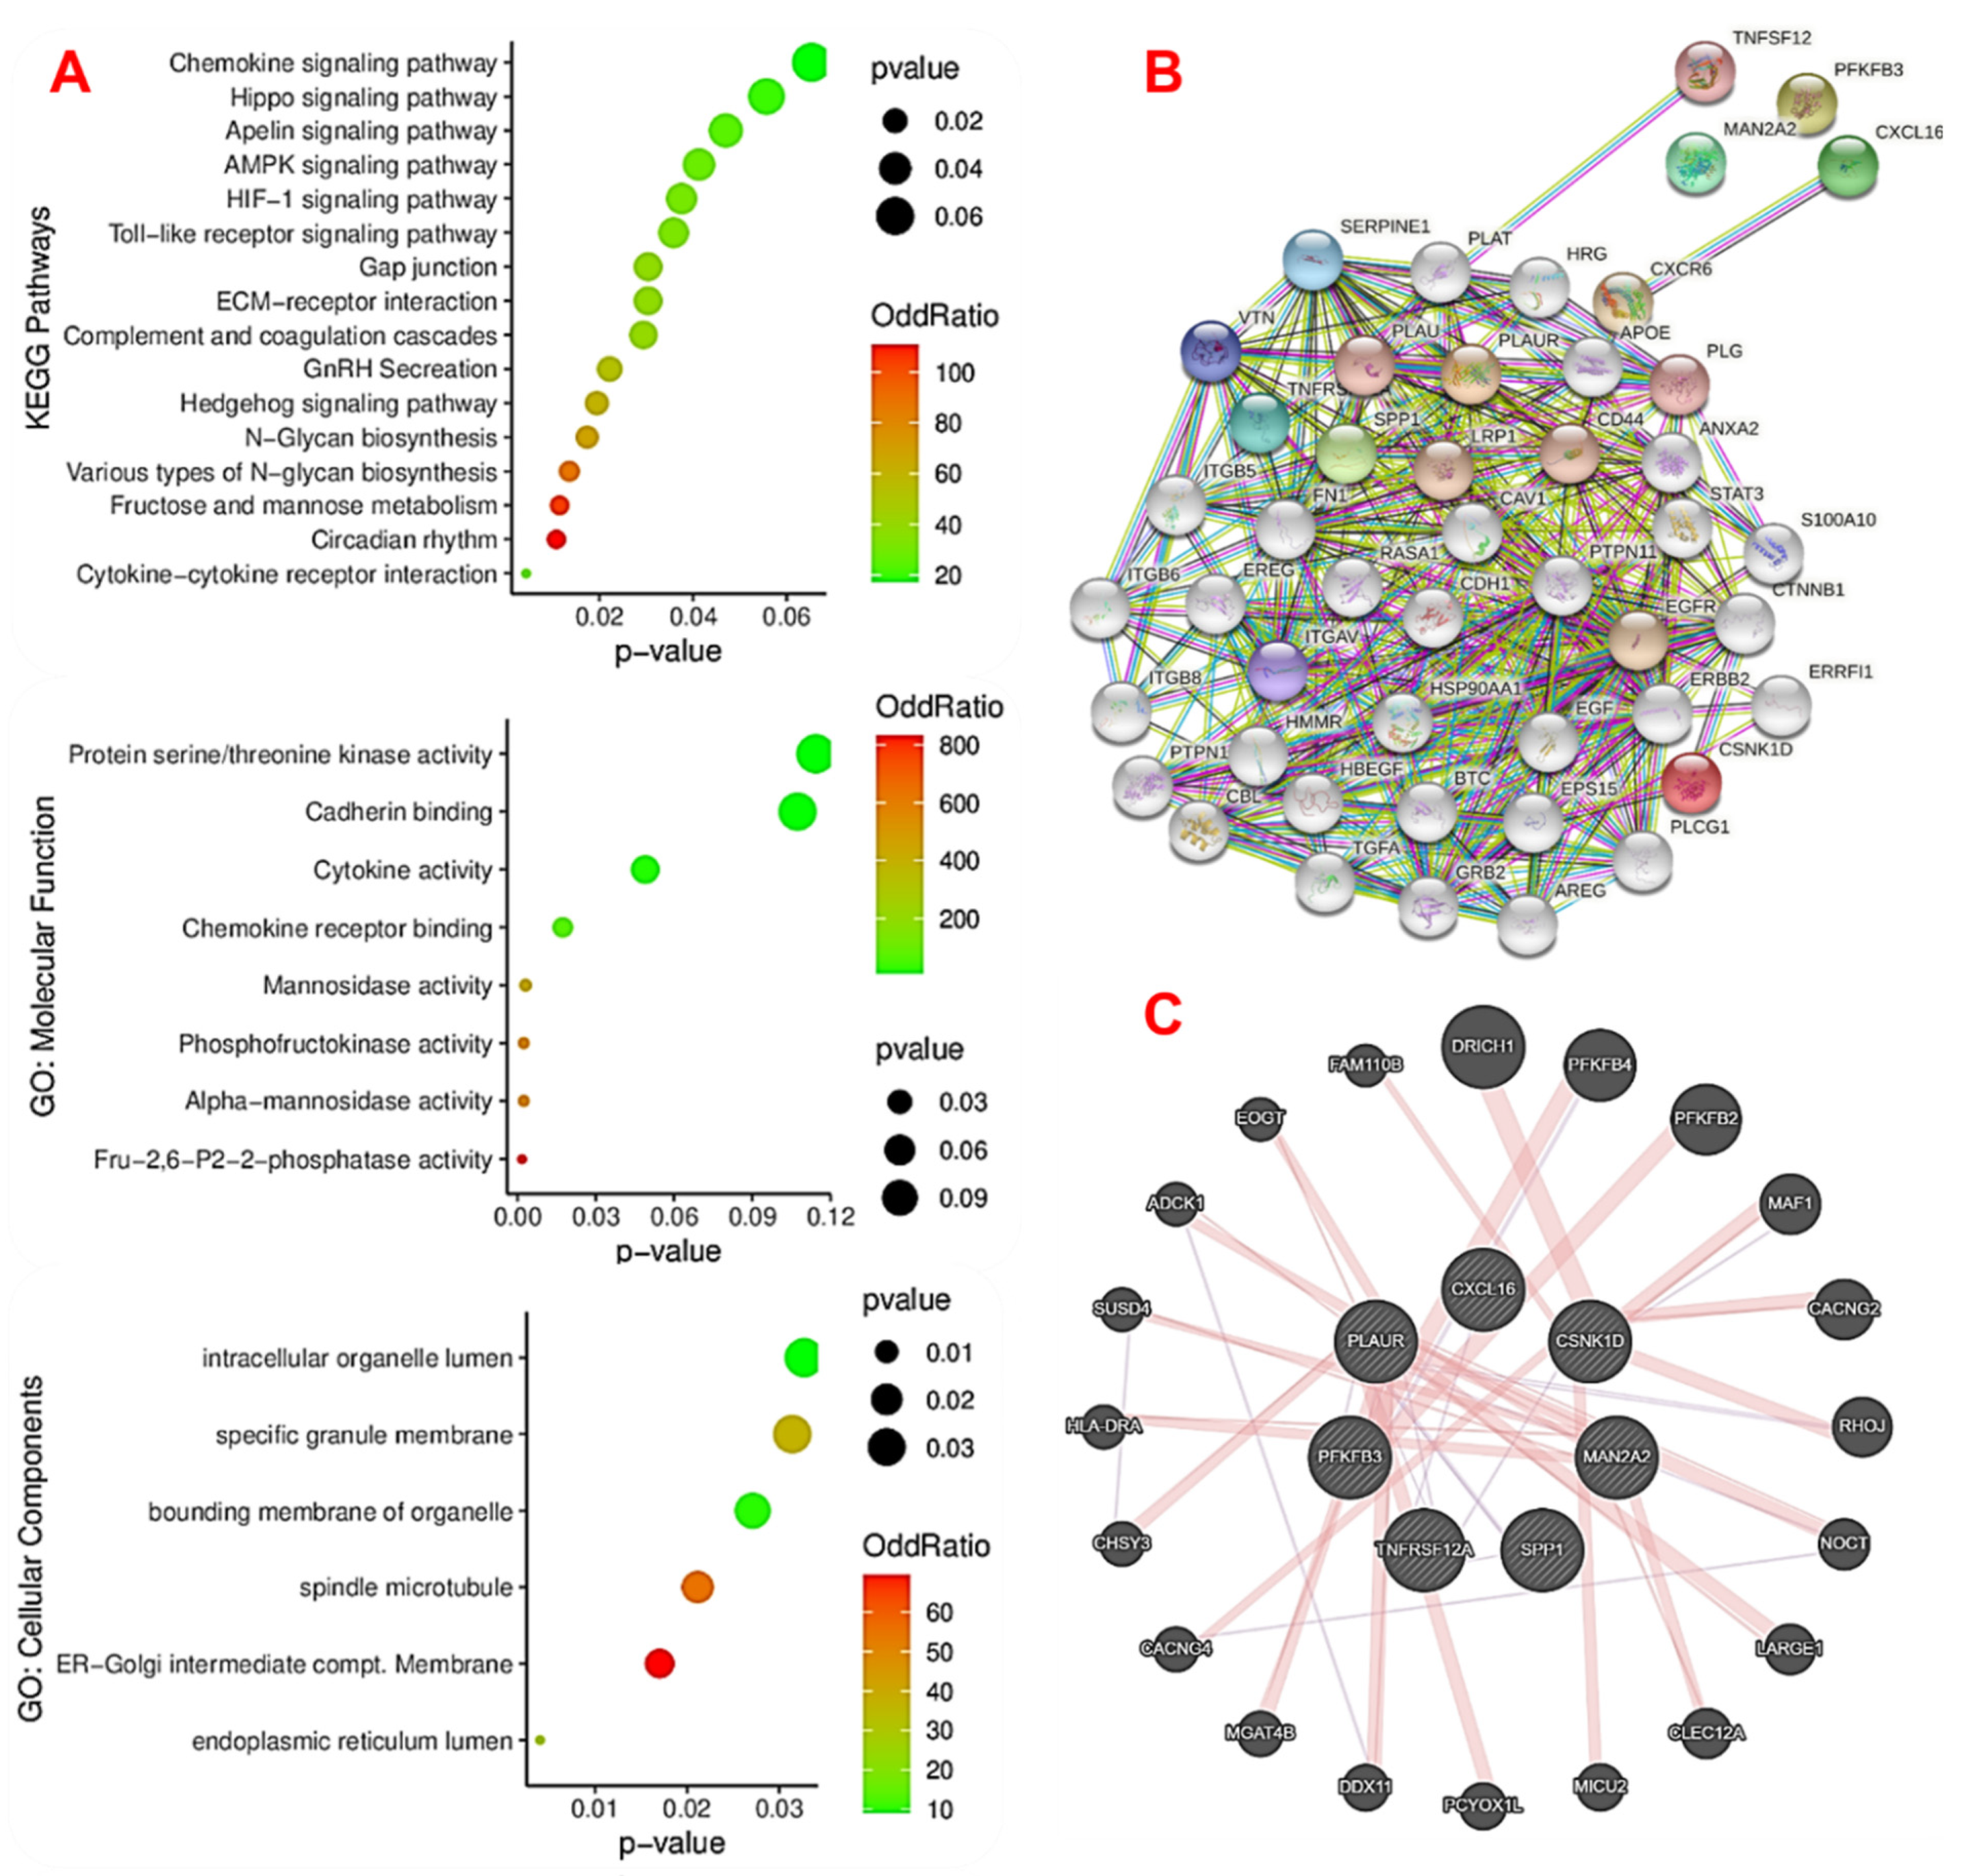
2.3. The Novel MTSCPPC Signature Is Associated with Disruption of Metabolic and Immune-Inflammatory Pathways during the Pathogenesis of MI

To further understand the pathological mechanisms of the DEGs in MI, we conducted functional enrichment and biological network analysis of the MTSCPPC signature. Our results revealed the significant involvement of the MTSCPPC signature in several immune, inflammatory, and metabolic remodelings (Figure 4). In the KEGG pathway analysis, cytokine–cytokine receptor interactions, Toll-like receptor signaling, gonadotropin-releasing hormone (GnRH) secretion, gap junctions, extracellular matrix (ECM)-receptor interactions, complement and coagulation cascades, hypoxia-inducible factor (HIF)-1, adenosine monophosphate-activated protein kinase (AMPK), apelin, Hippo, Hedgehog, chemokine signaling, and various sugar-metabolism pathways were significantly enriched (Figure 4A). Similarly, our GO molecular function enrichment analysis of the MTSCPPC signature identified cytokine activity, chemokine receptor binding, cadherin binding, and activities of various sugar-metabolizing enzymes. The biological process analysis also indicated that several metabolic processes (including carbohydrate, lipid, and protein metabolism pathways), hormonal (androgen and testosterone), and other biological processes (including non-canonical Wnt signaling, fibrinolysis, and T cell chemotaxis) were the most significantly enriched processes of the DEGs (Table 2). To investigate interactions between the proteins encoded by the MTSCPPC signature, PPI and GGI networks were employed (Figure 4B,C). Based on the STRING database, the PPI network was constructed with the MTSCPPC signature, yielding 47 nodes, 359 edges, and a PPI enrichment p-value of <1.0 × 10⁻¹⁶. The most significantly enriched genes in the PPI included EGFR (23 node degrees), CAV1 (23 node degrees), EGF (22 node degrees), CD44 (22 node degrees), and ANXA2 (19 node degrees) (Figure 4B). On the other hand, the GGI network of the MTSCPPC signature contained 27 human genes (nodes) and 52 interactions (edges, Figure 4C) and generated strict functional enrichment of metabolic pathways associated with carbohydrates, nucleotides, and ATP metabolic processes.

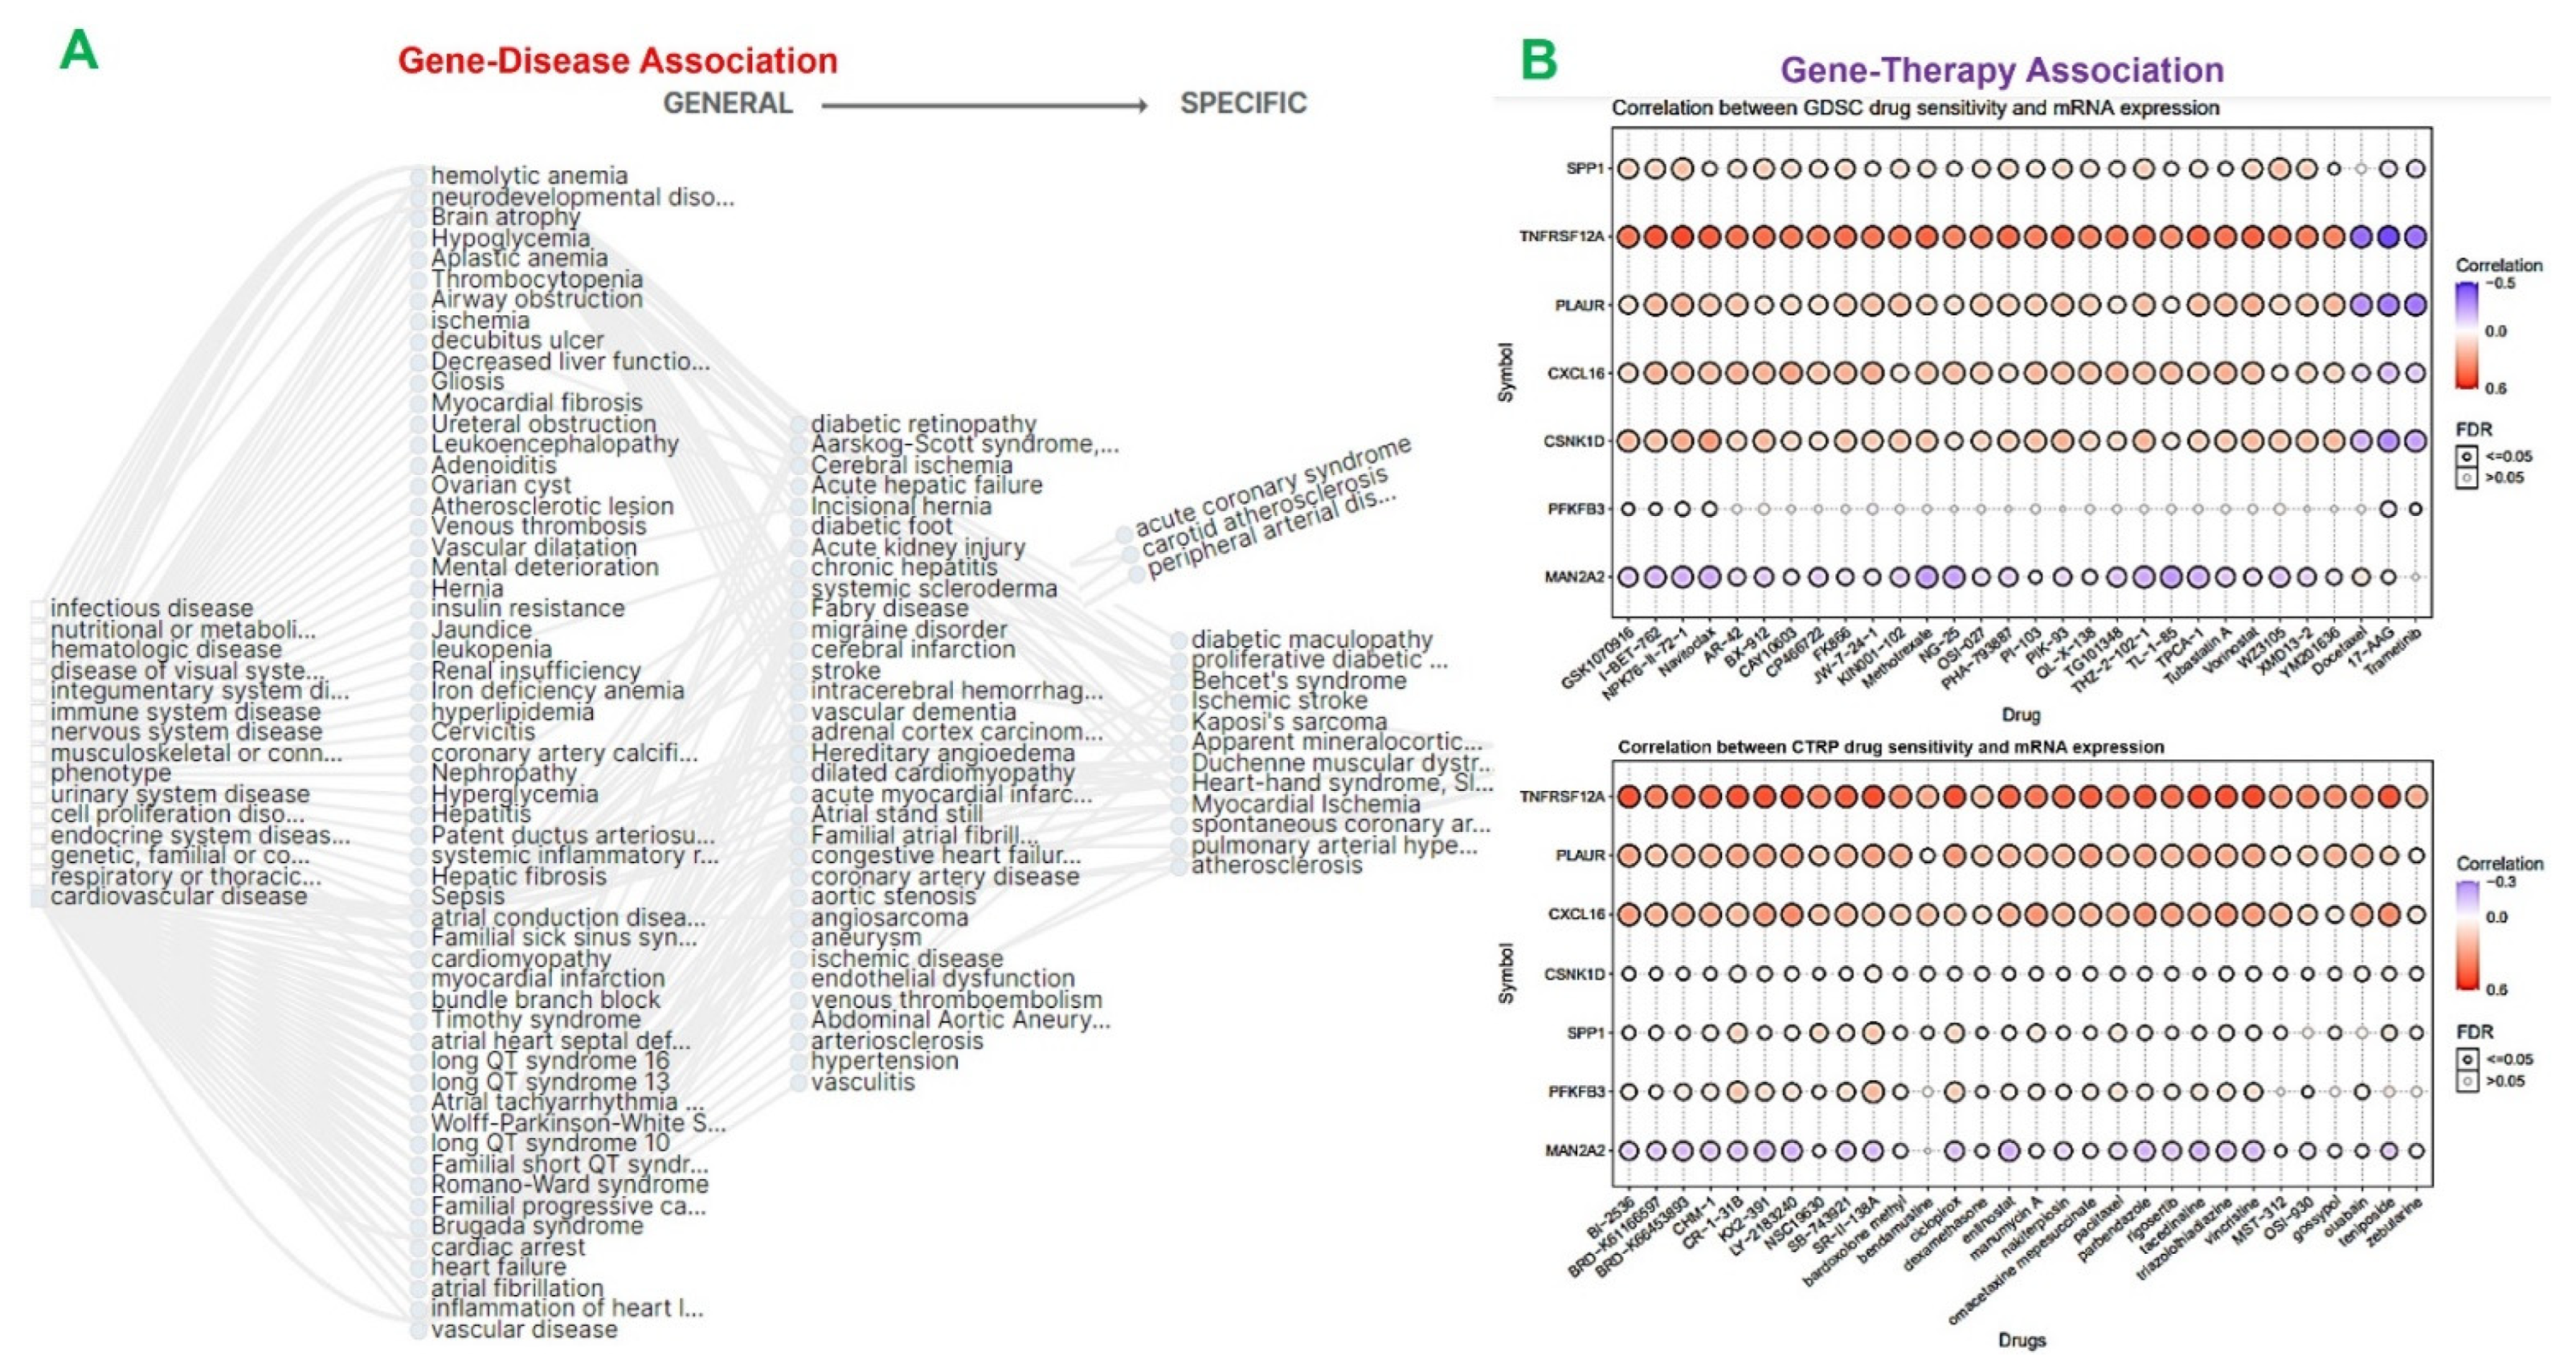
2.4. The MTSCPPC Signature Is Implicated in Therapy Resistance and Pathogenesis of Heart Related Diseases

Genomic aberrations are major drivers of disease progression and therapy response. We queried the gene–disease association network of the DEGs. Our analysis suggested the involvement of DEGs in several diseases including ischemic stroke, myocardial ischemia, atherosclerosis, acute coronary syndrome, carotid atherosclerosis, diabetic maculopathy, and so on (Figure 5A). To investigate the roles of the MTSCPPC signature in response to therapy, drug sensitivity and gene expression profiling data were integrated. Our results demonstrated that high expression levels of TNFRSF12A, SPP1, CSNK1D, PLAUR, PFKFB3, and CXCL16 were associated with drug resistance to several small molecules (Figure 5B). However, expression levels of MAN2A2 were associated with increased drug sensitivity. Collectively, our results suggested that the dysregulated expressions of the members of the MTSCPPC signature were associated with the development and progression of several heart-related diseases and could mediate resistance to small molecule drugs.

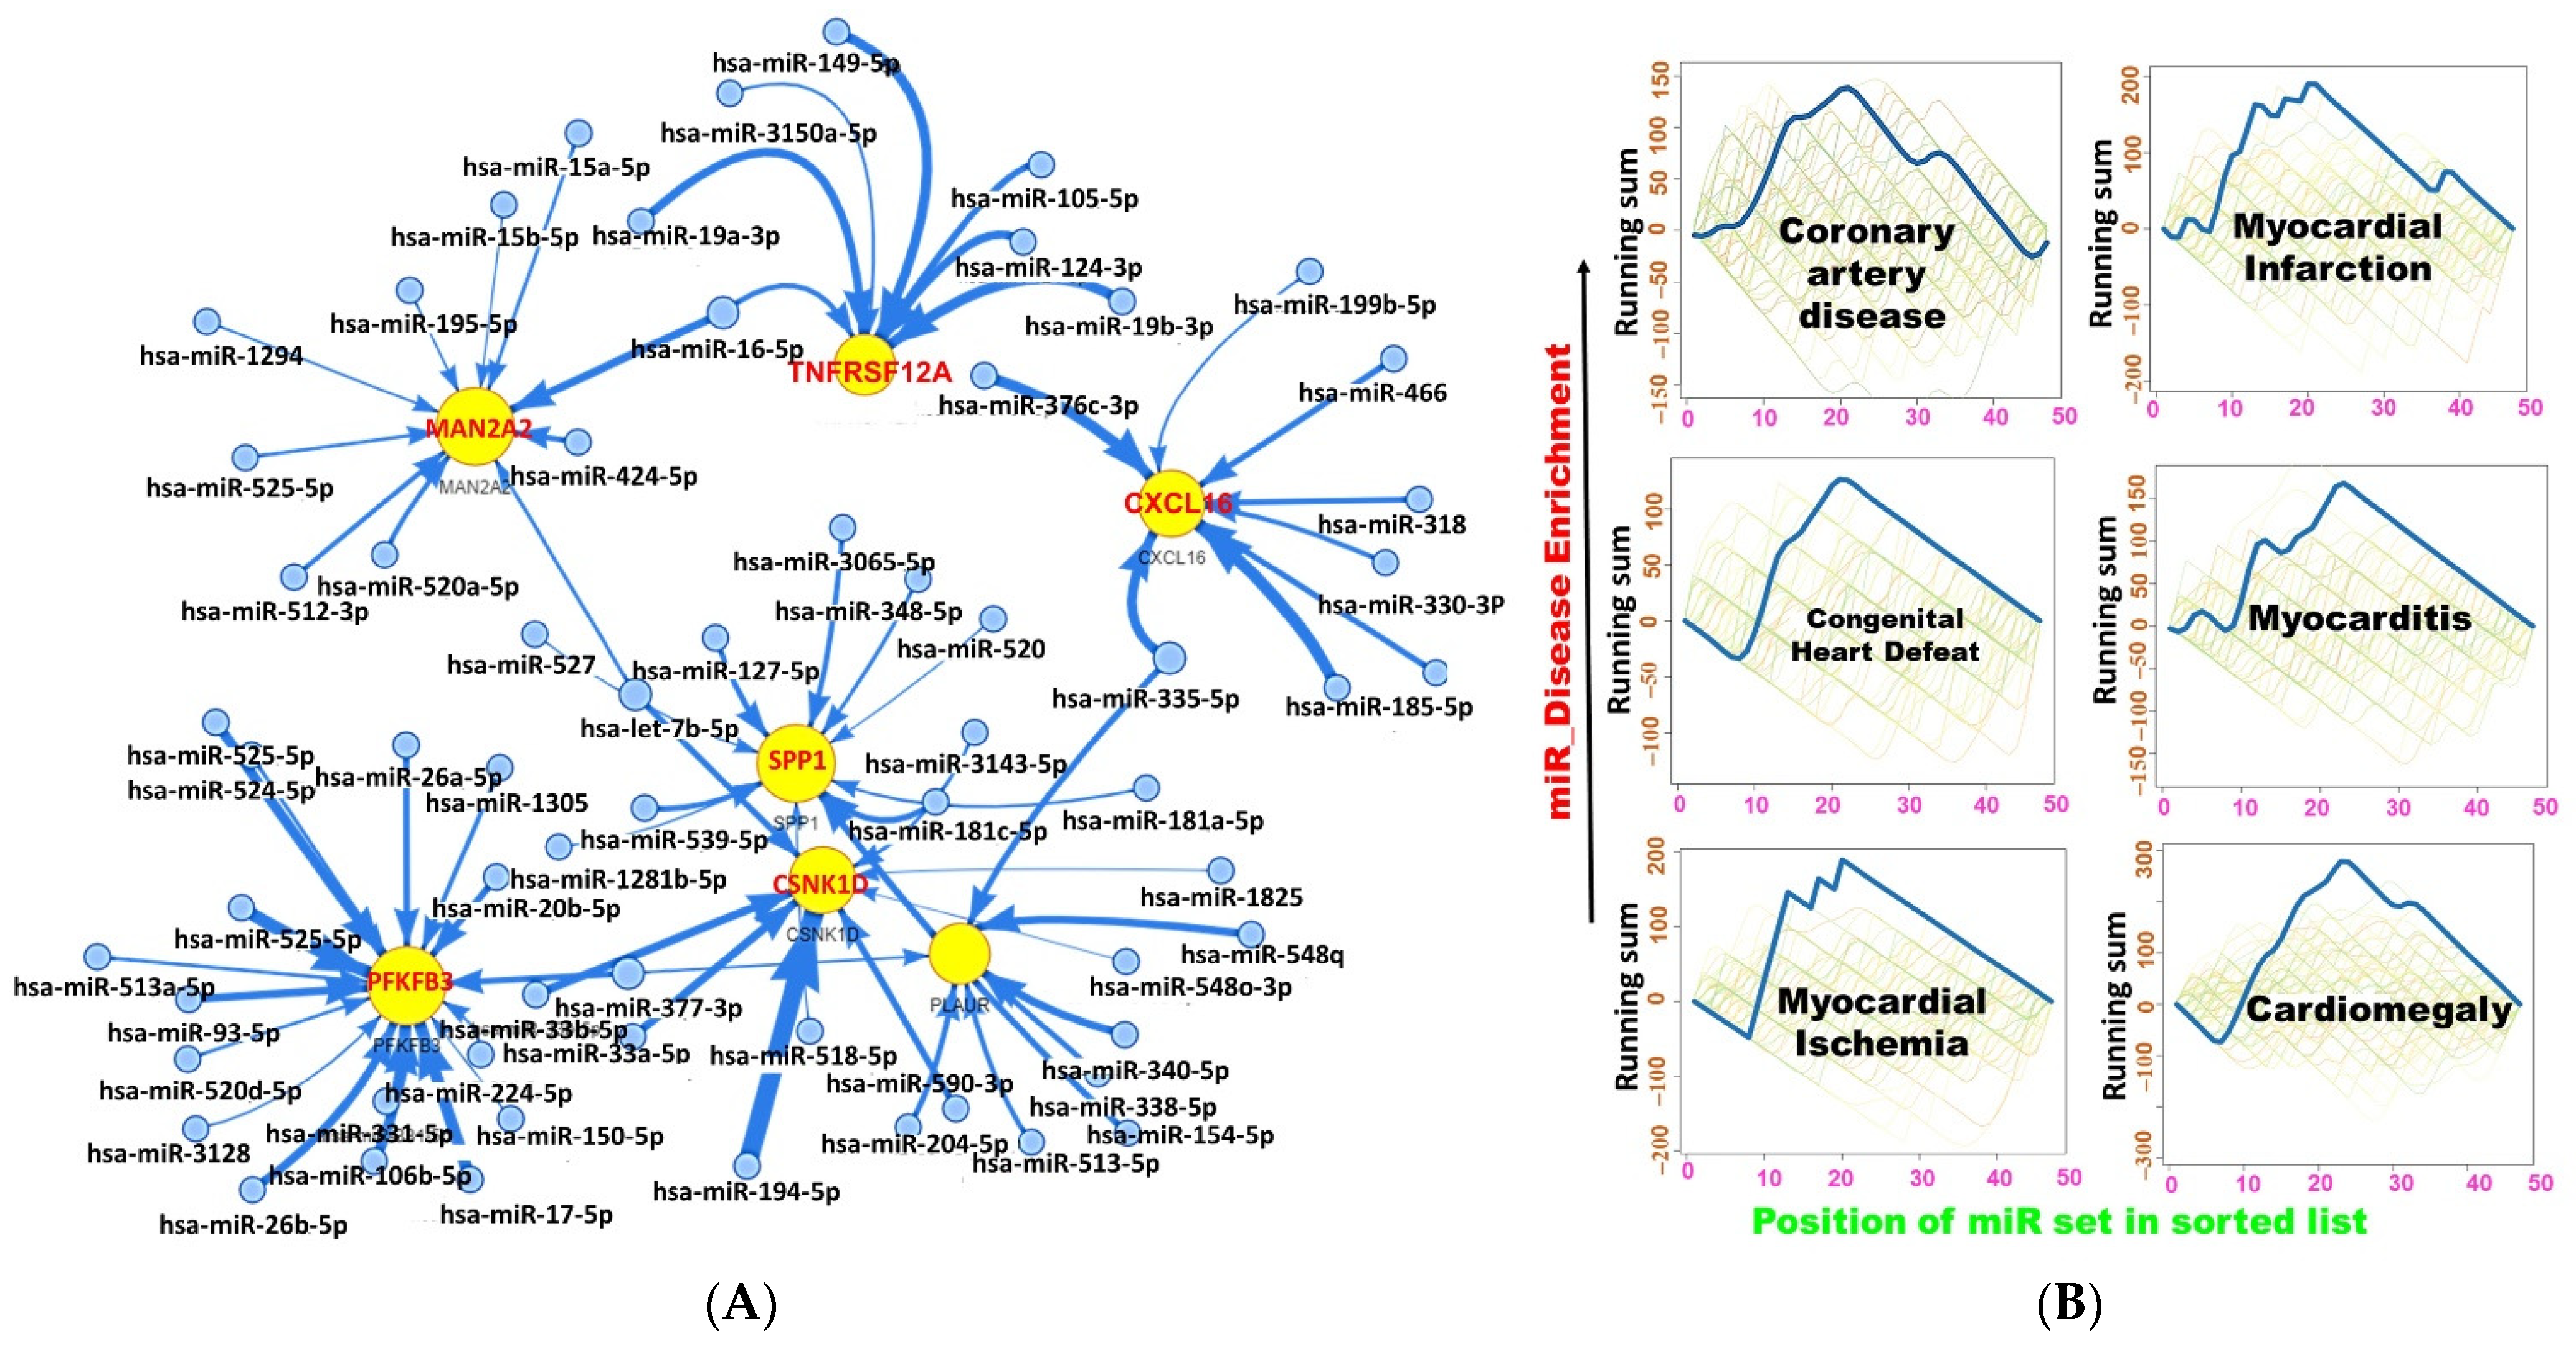
2.5. miRNA Regulatory Network of the DEGs

In order to further understand the mechanisms and pathological roles of the MTSCPPC signature, we queried the miRNA regulation network targets for this signature (Figure 6A). Our analysis revealed that the MAN2A2, TNFRSF12A, SPP1, CSNK1D, PLAUR, PFKFB3, and CXCL16 were regulated by several miRNA regulatory networks involving hsa-miR-149-5p, hsa-miR-3150a-3p, hsa-miR-105-5p, hsa-miR-124-3p, hsa-miR-16-5p, hsa-miR-15a-5p, hsa-miR-15b-5p, hsa-miR-195-5p, hsa-miR-1294, hsa-miR-525-5p, hsa-miR-424-5p, hsa-miR-195-5p, hsa-miR-520a-5p, hsa-miR-512-3p, and several other miRNAs (Figure 6A). Furthermore, we found that the miR regulatory networks were enriched in several pathways, GOs, and disease networks (Figure 6B and Figure S1). Of importance, we found high enrichment of miRNAs in coronary artery disease, MI, myocarditis, congenital heart defects, cardiomegaly, and myocardial ischemia (Figure 6B).

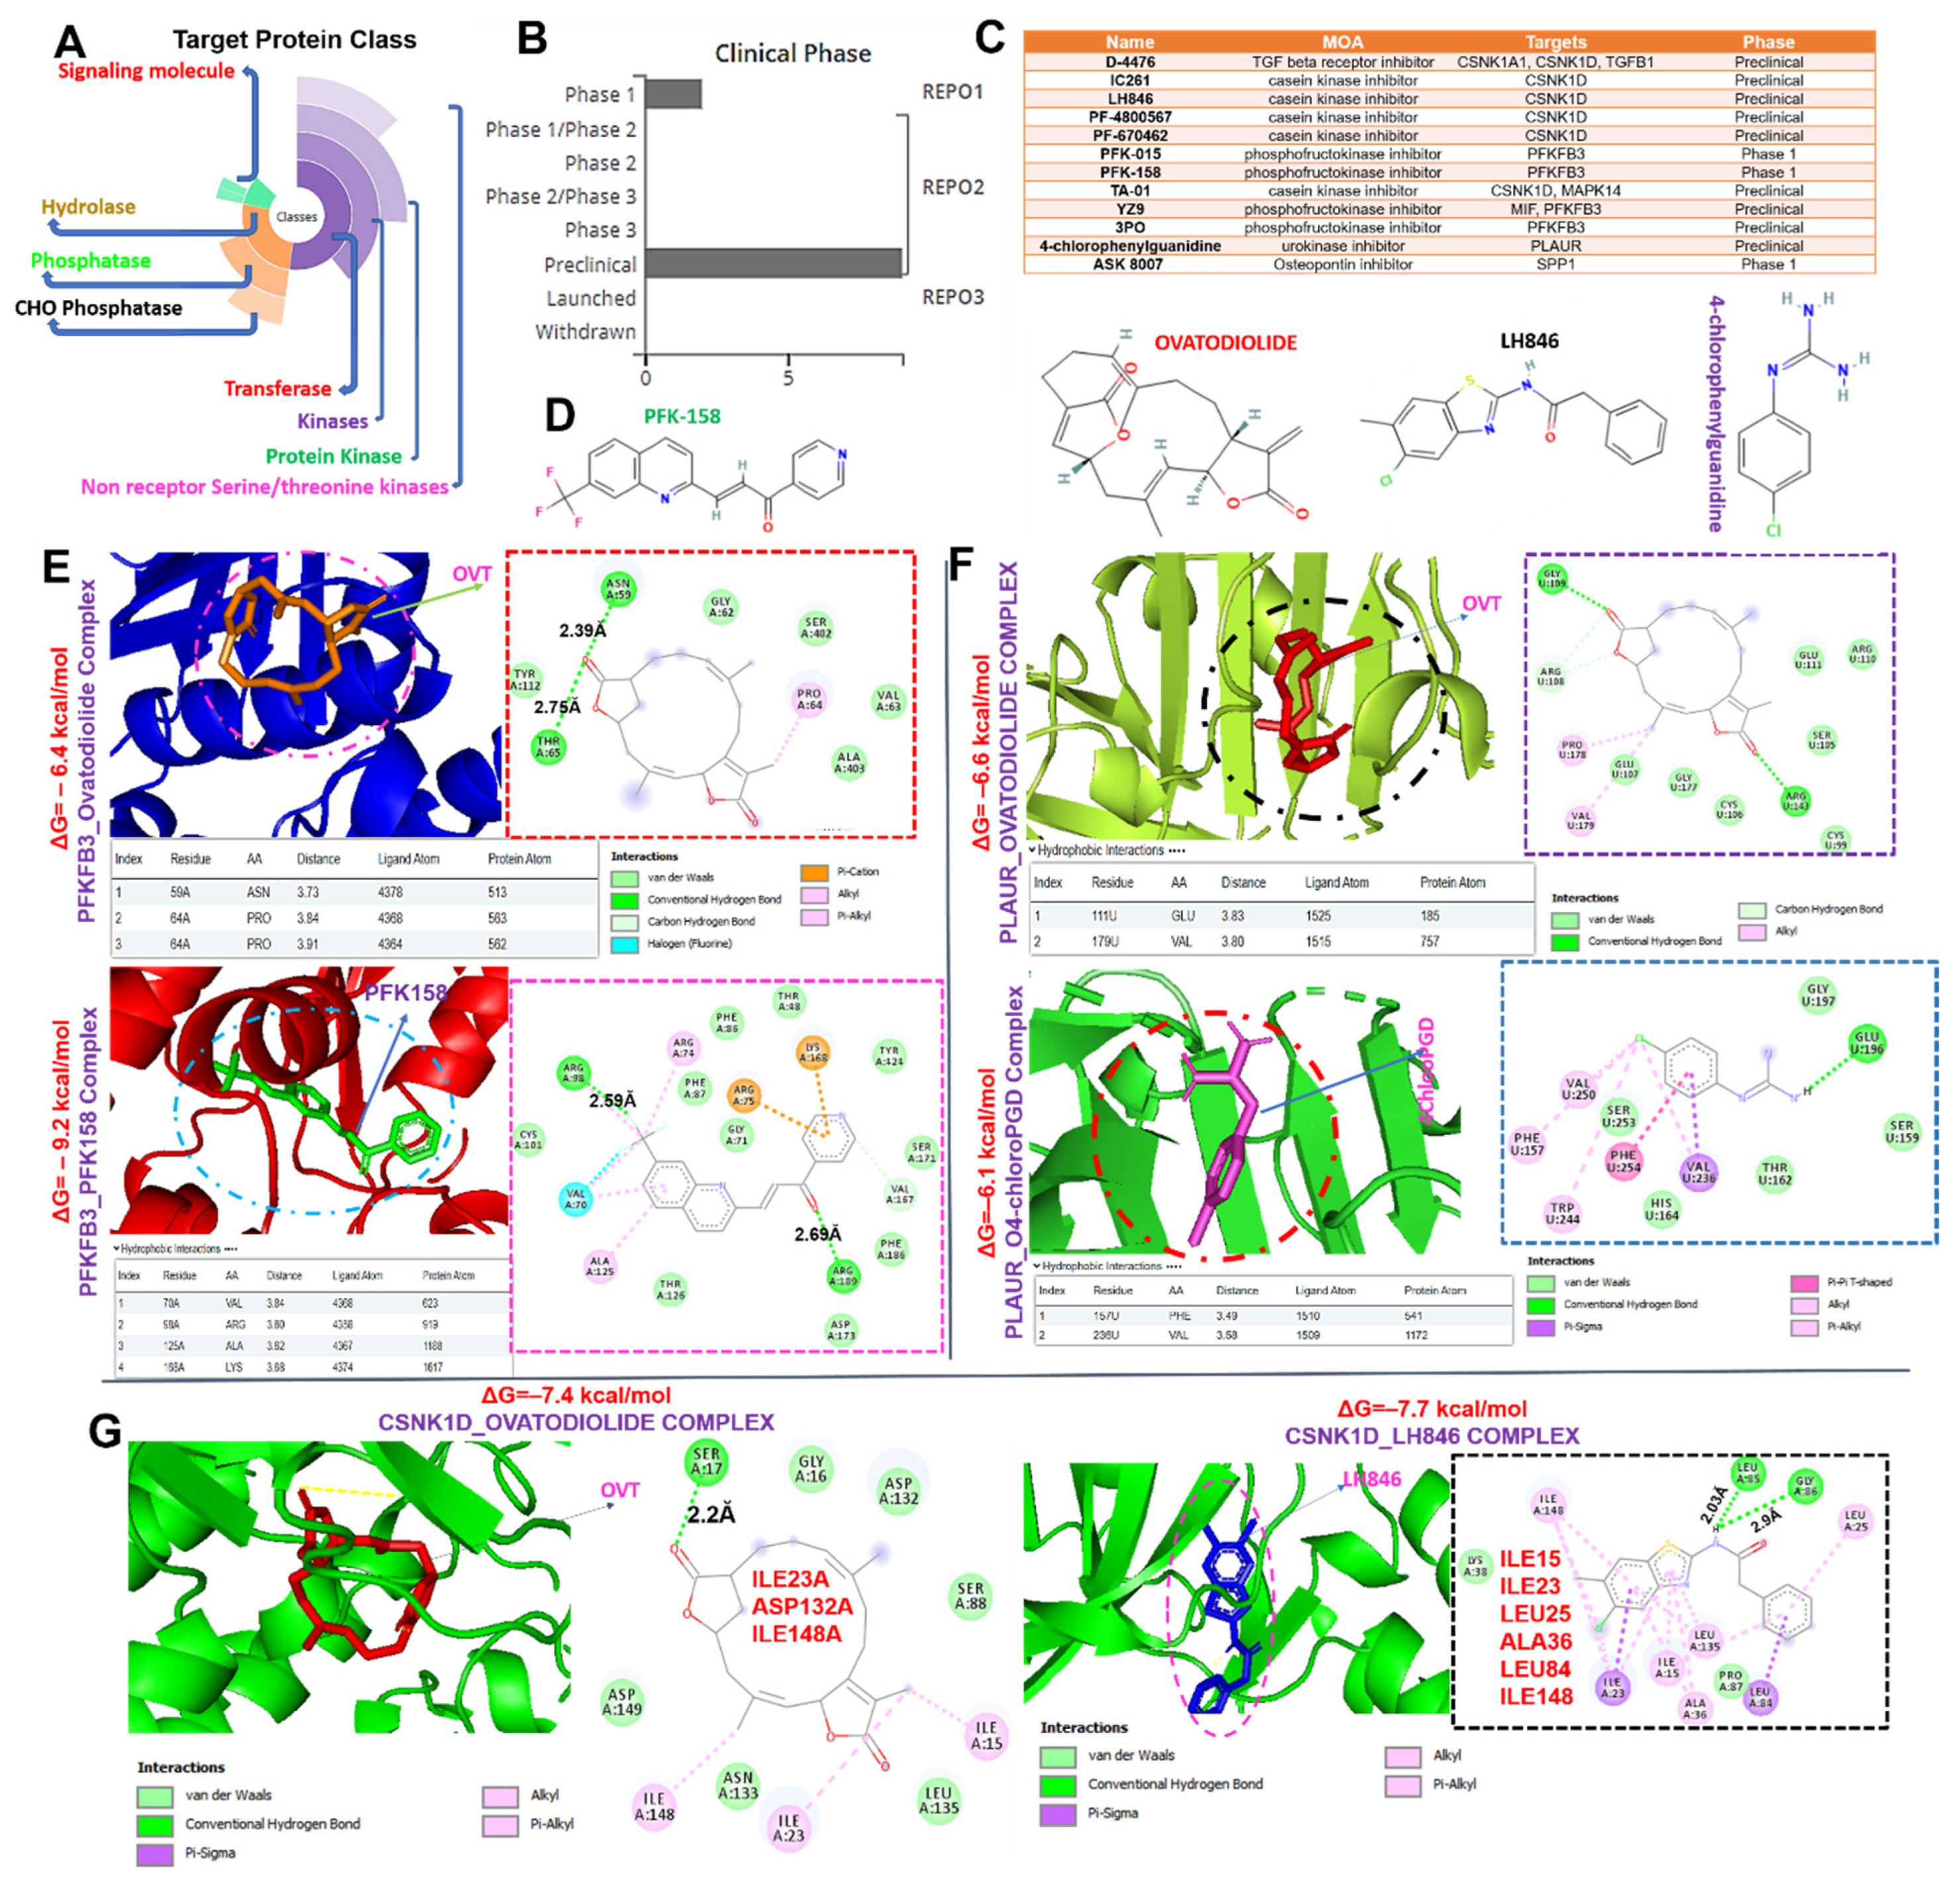
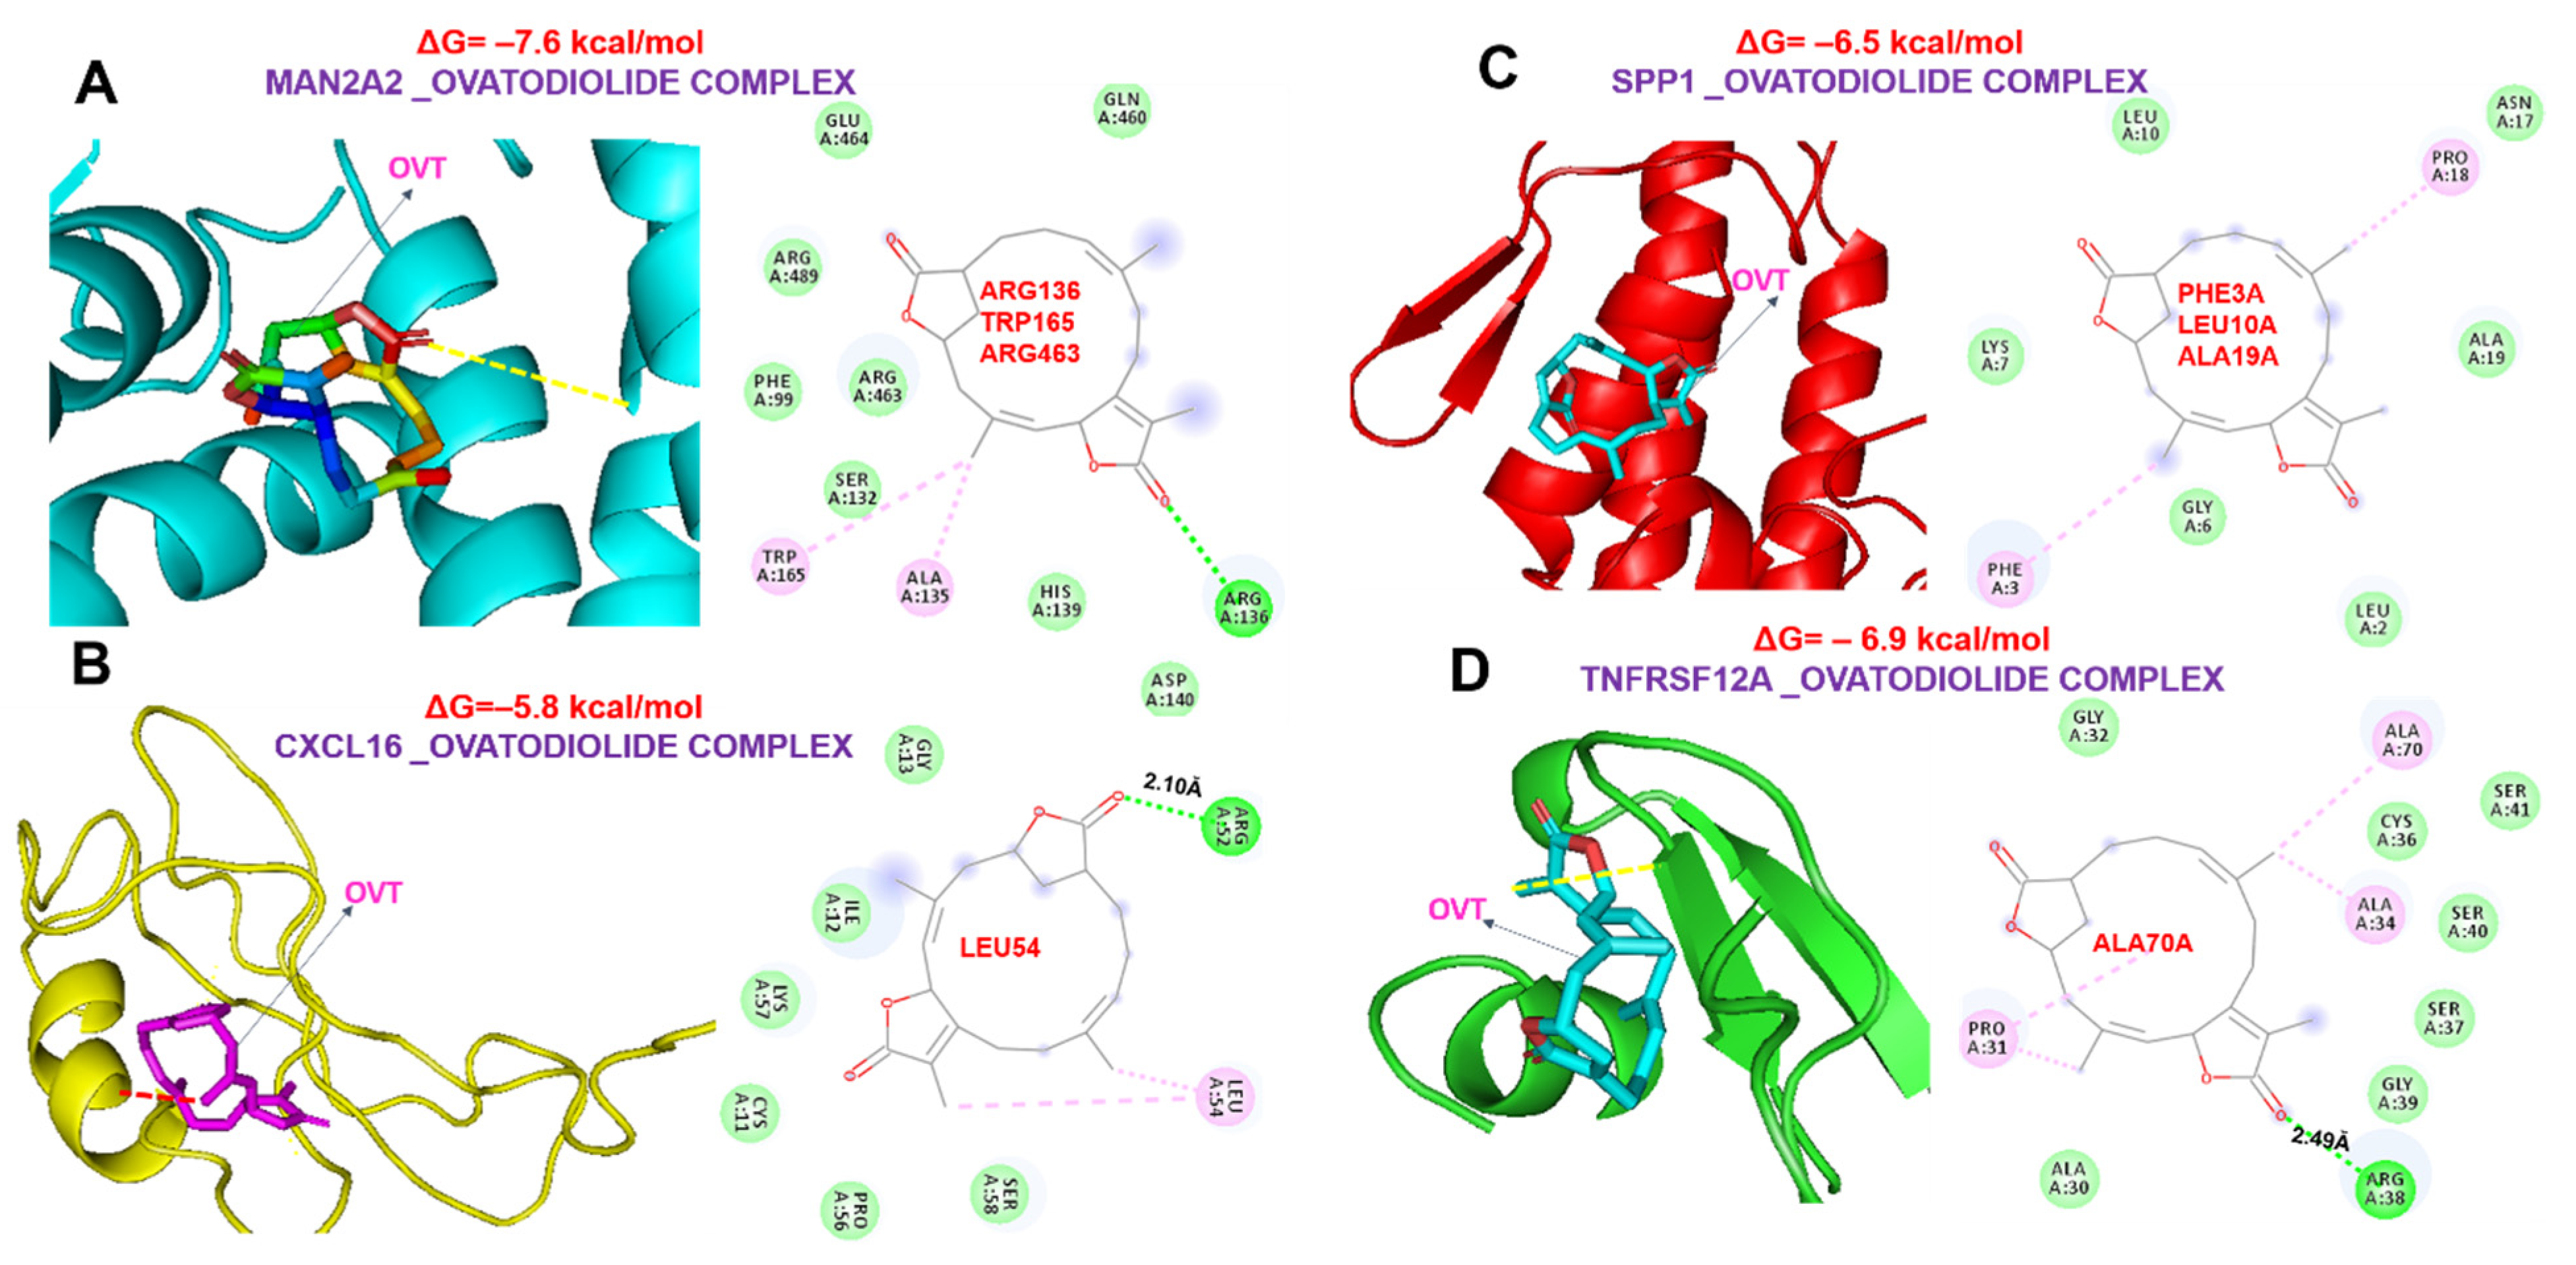
2.6. Ovatodiolide, a Macrocyclic Diterpenoid, a Potential Drug for Targeting the MTSCPPC Signature

We queried the MTSCPPC signature for the available clinical/preclinical drug targets (Figure 7A–D) and identified several kinase- and phosphatase-targeting small molecules in clinical and preclinical settings. Specifically, two clinical drugs, PFK-015 and PFK-158, for targeting PFKFB3 were identified. The preclinical drugs, including 4-chlorophenylguanidine (PLAUR inhibitor), ASK 8007 (SPP1 inhibitor), LH846, and several other inhibitors of CSNK1D (Figure 7C,D) were identified. Furthermore, we evaluated the therapeutic potential of a natural compound, ovatodiolide, a macrocyclic diterpenoid, by comparing it with the identified clinical/preclinical drugs, its binding affinities, and interaction with amino acid residues of the targets binding sites. Our molecular docking analysis revealed that ovatodiolide docked to the binding cavities of the DEGs with different binding affinities; MAN2A2 (−7.6 kcal/mol), CSNK1D (−7.4 kcal/mol), TNFRSF12A (−6.9 kcal/mol), PLAUR (−6.6 kcal/mol), SPP1 (−6.5 kcal/mol), PFKFB3 (−6.4 kcal/mol), and CXCL16 (−5.8 kcal/mol) (Figure 7 and Figure 8). Several non-covalent interactions, including the H-bonds, halogen bonds, and multiple π-interactions, were found in the complexes formed between the ovatodiolide and the targets (Figure 7 and Figure 8). Furthermore, several hydrophobic contacts and van der Waals forces were found around the ovatodiolide backbone with the respective binding amino acid residues of the receptor’s binding pockets. Judging by the number of interactions and the binding affinities of ovatodiolide, our results suggest that MAN2A2, CSNK1D, and TNFRSF12A are more favored ligands for ovatodiolide therapeutic utility than are PFKFB3, PLAUR, SPP1, and CXCL16. Ovatodiolide demonstrated a higher potential for targeting PLAUR than the preclinical inhibitor of the protein and was comparable to LH846 in its affinity for binding to CSNK1D. However, PFK158, a clinical inhibitor, demonstrated a higher potential for targeting PFKB3 in silico than ovatodiolide. Altogether, our results suggest that ovatodiolide has molecular features for targeting the MTSCPPC signature with higher efficiency for three members of the MTSCPPC signature, namely, MAN2A2, CSNK1D, and TNFRSF12A.

3. Discussion

Annual cases of myocardial infarction (MI, acute and chronic) are steadily increasing. Exploring molecular mechanisms of MI is critical to controlling the number of patients with MI and developing precision therapeutic strategies. This study analyzed DEGs from six independent microarray datasets and identified seven overlapping genes (termed the MTSCPPC signature), subsequently analyzed for their pathogenic roles in MI and as therapeutic targets. GO biological and function enrichment analyses identified that the MTSCPPC signature was mainly enriched in several metabolic- (particularly carbohydrate metabolic pathways), hormonal-, immune-, and inflammation-related pathways. Similarly, our KEGG pathway analysis identified cytokine–cytokine receptor interactions, Toll-like receptor signaling, GnRH secretion, gap junctions, ECM-receptor interactions, complement and coagulation cascades, HIF-1, AMPK, Apelin, Hippo, Hedgehog, chemokine signaling, and various sugar-metabolism pathways. Results of these enrichment analyses are in line with higher levels of the MTSCPPC signature in the immune cells than in other cells of the human heart during an MI event, as revealed by our analysis from single-cell transcriptomic databases (Figure 3A). These findings suggest the critical roles of immune and inflammatory responses during MI. Furthermore, the GGI network of the DEGs generated strict functional enrichment of metabolic pathways associated with carbohydrate, nucleotide, and ATP metabolic processes which correlated with our KEGG and ontological findings.
Results of our analysis may provide future directions for better diagnoses and treatments of AMI. Innate immune responses and inflammatory reactions are essential regulators of tissue damage and repair after an MI [39]. Myocardial necrosis induces complement activation, free radical generation, cellular depletion of free radical scavengers, lipid peroxidation, and release of chemotactic factors and triggers a tumor necrosis factor (TNF)-α-mediated cytokine cascade [40,41]. During an MI, immune responses are induced by activating Toll-like receptors on circulating blood cells, increasing the infarct size and mediating ventricular transformation [42]. The chemokine (C-X-C motif) ligand family (Cxcl) contains neutrophil chemoattractants [43], whose overexpression was implicated in aggressive acute inflammation after an MI [44]. Pharmacologic inhibition of Cxcl attenuated MI via neutrophil exclusion at the infarct site [43].
We further investigated interactions between proteins encoded by the MTSCPPC signature via a PPI network and found a significantly higher degree of interactions with EGFR, CAV1, EGF, CD44, and ANXA2. Therefore, we speculated that these genes, which were core genes in the PPI network, might play important roles in regulating cardiac remodeling and be more closely related to MI. Our literature survey revealed that these genes were implicated in immune differentiation, regulation of inflammation, and MI [45,46,47], which indicated that our results of integrated bioinformatics analysis, KEGG, and GO enrichment analysis were reliable. Cav1 was shown to play a critical role in regulating inflammatory responses to an MI by regulating macrophage differentiation in mice [48]. EGF and EGFR were also implicated in the proliferation of cardiac fibroblasts and cardiac remodeling after an MI in rats [47]. CircANXA2 promotes myocardial apoptosis in myocardial ischemia-reperfusion injury [46].
Integrating these genes with the MTSCPPC signature of MI would produce a significantly pronounced pathological phenotype compared to phenotypes of individual genes [49,50]. Per our hypothesis, targeting genes that interact with disease hallmark genes were proposed as a therapeutic concept [51,52] and adopted in clinical trials [53]. Altogether, our study identified the importance of cytokine–cytokine receptor interactions and chemokine signaling, immune and inflammation responses, and metabolic abnormalities in the pathology of MI and identified novel biomarker signature of theranostic relevance for these processes.
Increasing evidence has revealed that dysfunction of 3′- and 5′-untranslated regions (UTRs) of mRNAs is often associated with the pathophysiology of several diseases [54]. miRNAs are small non-coding RNAs that bind to the UTR region and regulate the mRNA translation of target genes [55] and, hence, contribute to the development of various diseases, including MI [56,57]. The binding of miRNAs to the 3′-UTR of target mRNAs is a mechanism (canonical mode) of post-transcriptional repression of target genes [58]. However, recent studies revealed other miRNA regulatory modes that favor post-transcriptional activation [55,59]. We showed that several miRNAs regulated the MTSCPPC signature. These miRNA networks were significantly associated and implicated in coronary artery disease, MI, myocarditis, congenital heart defects, cardiomegaly, and myocardial ischemia (Figure 6B). Our data provided new insights into the molecular mechanism of MI, where miRNA-mediated post-transcriptional activation and regulation of many bioprocesses.
In silico receptor–ligand interaction studies are an important stage in drug discovery and development pipelines. By studying receptor–ligand interactions, behaviors of therapeutic agents around the accommodating cavity of a target protein can be known, and hence we can speculate on the biological activities of drug candidate [21,60] Interestingly, our molecular docking study revealed the potential of ovatodiolide for targeting the MTSCPPC signature in the order of MAN2A2 (−7.6 kcal/mol) > CSNK1D (−7.4 kcal/mol) > TNFRSF12A (−6.9 kcal/mol) > PLAUR (−6.6 kcal/mol) > SPP1 (−6.5 kcal/mol) > PFKFB3 (−6.4 kcal/mol) > CXCL16 (−5.8 kcal/mol). The importance of hydrogen, ionic, hydrophobic, and other non-covalent bonds is crucial to the stability and behavior of a drug candidate within the cavity of a target molecule. The higher affinities of ovatodiolide for MAN2A2, CSNK1D, and TNFRSF12A suggest the differences in therapeutic susceptibilities of the MTSCPPC signature to ovatodiolide. This target favoritism could be attributed to the higher numbers of interactions between amino acid residues of the target proteins and reacting molecules of ovatodiolide. It was reported that high van der Waals forces between a drug candidate and amino acid residues in the binding cavity of the target create a strong, cohesive environment for stabilization of the complexes [60]. Interestingly, ovatodiolide demonstrated a higher potential for targeting PLAUR than the preclinically-validated protein inhibitor and was comparable to the preclinically-validated inhibitor of CSNK1D. However, as expected, PFK158, a clinical inhibitor, demonstrated higher in silico potential for targeting PFKB3 than did ovatodiolide. Collectively, the results from the present study aid our understanding of the complex regulatory mechanisms of MI and provide a promising approach for MI theranostic markers with ovatodiolide as a promising therapeutic candidate.
However, the limitations of the present study merit discussion. The sample size was relatively small as only a few datasets of MI from the GEO database qualified for inclusion. Therefore, larger cohorts of patients with MI are required to confirm the diagnostic relevance of the identified genes. In addition, no validation experiment was performed. In future studies, we plan to perform experiments such as qPCR and Western blot to verify the expression changes of MAN2A2, TNFRSF12A, SPP1, CSNK1D, PLAUR, PFKFB3, and CXCL16, as well as microRNAs that might target the DEGs in experimental models of MI and clinical samples. As we described, the DEGs were associated with metabolic and immune-inflammatory dysregulation. Whether these screened biomarkers are linked to the above indicators in MI patients also requires confirmation. In-depth functional studies including gene over-expressing/silencing and clinical studies such as correlations analysis between gene expression and clinical indicators in MI patients will also be conducted. Furthermore, the full therapeutic potential of ovatodiolide for targeting the DEGs awaits our experimental validation with in vitro and in vivo models.

4. Materials and Methods

4.1. Transcriptomic Data Acquisition and Identification of DEGs in MI

In total, six datasets (GSE66360, GSE19339, GSE61145, GSE61144, GSE62646, and GSE60993) [61,62,63] consisting of high-throughput gene expression profiles from MI patients and healthy cohorts were downloaded from the NCBI Gene Expression Omnibus (GEO). Detailed information of the microarray datasets is presented in Table 3. Data processing and analysis of DEGs were conducted using the GEOR2 embedded LIMMA package [64] and excel sorting. Analyses were conducted based on the limma contrast selection of all possible pairwise contrasts. The Benjamini–Hochberg correction method was used for p-value adjustment of the false discovery rate (FDR) as reported previously [36]. InteractiVenn, a web tool, was used to visualize the intersecting DEGs and generate a Venn diagram to visualize overlapping DEGs [65]. The corresponding raw files from each dataset are presented in supplementary file 1 (File S1). In addition to the conventional DEG integration, we also conducted a meta-analysis of the datasets based on p-value integration and effect size combination methods. The web-based application ImaGEO was used to perform the meta-analysis [66]. The effect size, defined as Z value based on statistical Z-tests, reflects the inter-study variation and the different quantitative measurements used to explain the strength of a phenomenon in different datasets while a p-value reflects whether an effect exists [67]. Therefore, both the substantive significance (effect size) and statistical significance (p-values) are essential for dataset meta-analyses [68]. All our p-value analysis was adjusted for multiple testing by the FDR (<0.05) method. All the necessary codes and files to repeat the main analysis are presented in the supplementary section (File S2).

4.2. Subcellular Localization and Single-Cell Transcriptomic Data Analysis of the Adult Human Heart during MI

We used the Human Protein Atlas (HPA) database to acquire the subcellular localization of the DEGs based on immunofluorescence staining of the proteins within the nucleus, endoplasmic reticulum (ER), and microtubules [69]. In addition, the single-cell transcriptomic dataset of the adult human heart during heart failure was retrieved from the GEO, with the accession number GSE109816 [70]. The total read counts for genes in each cluster were calculated by adding up the read counts of the genes in all cells belonging to the corresponding cluster. Finally, read counts were normalized to transcripts per million protein-coding genes (pTPM) for each single-cell cluster.

4.3. Interaction and Disease Networks, and Gene Set Enrichment Analysis of the DEGs

A DEG enrichment analysis including the Kyoto Encyclopedia of Genes and Genomes (KEGG) pathways and gene ontology (GO) enrichment analyses of the DEGs was conducted using the Enrichr server [71,72], with the enrichment value set to p < 0.05. Protein–protein interaction (PPI) enrichment of the DEGs was analyzed using the Multiple Protein modules of the String server [73], while gene–gene interactions (GGIs) of hub genes were evaluated via the GENEMANIA web tool [74]. In order to analyze gene/disease-specific associations of the DEGs, we explored the disease/phenotype-specific filters of the Open Targets Genetics server [75].

4.4. Drug Response and Sensitivity Analysis of the DEGs

A drug-sensitivity analysis of the DEGs was conducted through the GSCALite server [76]. We explored Spearman correlation methods to analyze correlations between messenger (m)RNA expression levels of the DEGs and values of the 50% inhibitory concentration (IC50) of small molecules against various cells in the Therapeutics Response Portal (CTRP) and Genomics of Drug Sensitivity (GDSC) databases.

4.5. Micro (mi)RNA Regulatory Network and Enrichment Analysis of the DEGs

miRNA regulatory networks of the DEGs were collected from experimentally verified databases (TarBase, mir2disease, and miRTarBase) and predicted databases (miRanda and targetscan). The miRNA regulatory network was visualized using the visNetwork R package. We used the miRNA Enrichment Analysis and Annotation (miEAA) tool to conduct a functional enrichment analysis of sets of miRNA targets [77]. Analyses were conducted using an FDR (Benjamini–Hochberg) adjustment p-value of 0.05 and a minimum required hit of four miRNAs.

4.6. Comparative Analysis of Ovatodiolide, a Macrocyclic Diterpenoid and Conventional Drugs for Targeting the DEGs

We used the DGIDB database, a drug–gene interaction database [78] and ConnectivityMap, a perturbation-driven gene expression dataset [79] to identify clinical and preclinical drugs for targeting the DEGs. The AutoDock Vina (vers. 0.8, Scripps Research Institute, La Jolla, CA, USA) [80] was used for molecular docking analyses to explore ligand–receptor interactions between target DEGs and drug candidates. All ligand preparations before docking were conducted according to the method described in our previous studies [81,82]. PDB files of the three-dimensional (3D) structures of the target DEGs of MAN2A2 (PDB:1PS3), TNFRSF12A (PDB:2RPJ), SPP1 (PDB:5VFJ), CSNK1D (PDB:4TN6), PLAUR (PDB:6AEX), PFKFB3 (PDB:3QPW), and CXCL16 (PDB:1RJT) were obtained from the Protein Data Bank (PDB). The Avogadro molecular builder and visualization tool version 1.XX [83] was used to build the 3D structure of ovatodiolide in Sybyl mol2 format. SDF files of standard drugs of LH846 (CID: 851474), PFK-158 (CID: 19739459), and 4-chlorophenylguanidine (CID: 2757788) were obtained from Pubchem. All mol2 files were converted to PDB format using the PyMOL Molecular Graphics System, vers. 1.2r3pre, while PDB files were converted to pdbqt format using AutoDock VINA. All dockings were visualized and analyzed with the aid of Discovery studio visualizer (vers. 19.1.0.18287, BIOVIA, San Diego, CA, USA) [84].

5. Conclusions

The present study identified MAN2A2/TNFRSF12A/SPP1/CSNK1D/PLAUR/PFKFB3/CXCL16 as a novel and potential signature of cytokine–cytokine receptor interactions, chemokine signaling, immune and inflammatory responses, and metabolic dysregulation associated with MI. Based on the molecular docking of receptor–ligand interaction, ovatodiolide demonstrated the potential for targeting this signature and could be considered for subsequent experimental validation for the development of a new drug.

Supplementary Materials

The following are available online at https://www.mdpi.com/article/10.3390/ijms23031281/s1.

Author Contributions

A.T.H.W. and B.L. wrote the manuscript; Y.-M.T. provided a crystalized form of ovatodiolide and helped with the in silico docking analyses; C.-C.S. participated in molecular docking and revision of the manuscript. C.-M.S. oversaw the study. All authors have read and agreed to the published version of the manuscript.

Funding

A.T.H.W. is funded by the Ministry of Education, Taipei Medical University (DP2-110-21121-03-C-09 and DP2-110-21121-01-H-03-03).

Institutional Review Board Statement

Not applicable.

Informed Consent Statement

Not applicable.

Data Availability Statement

The datasets generated and analyzed in this study can be made available upon reasonable request. http://www.interactivenn.net/ (accessed on 24 August 2021); http://www.ncbi.nlm.nih.gov/geo/ (accessed on 9 August 2021); www.proteinatlas.org; http://string-db.org/ (accessed on 22 August 2021); https://genemania.org/ (accessed on 9 September 2021); https://platform.opentargets.org/ (accessed on 9 September 2021); http://bioinfo.life.hust.edu.cn/web/GSCALite/ (accessed on 5 October 2021); https://ccb-compute2.cs.uni-saarland.de/mieaa2/ (accessed on 28 August 2021); https://www.dgidb.org/interaction; https://clue.io/repg-appurposin (accessed on 1 Septembe 2021).

Conflicts of Interest

The authors declare no conflict of interest.

References

  1. Zhang, R.; Ji, Z.; Qu, Y.; Yang, M.; Su, Y.; Zuo, W.; Zhao, Q.; Ma, G.; Li, Y. Clinical value of ARG1 in acute myocardial infarction patients: Bioinformatics-based approach. Biomed. Pharmacother. 2020, 121, 109590. [Google Scholar] [CrossRef] [PubMed]
  2. Ojha, N.; Dhamoon, A.S. Myocardial infarction. In StatPearls; StatPearls Publishing LLC.: Treasure Island, FL, USA, 2021. [Google Scholar]
  3. Murphy, D.A.; Craver, J.M.; Jones, E.L.; King, S.B., 3rd; Curling, P.E.; Douglas, J.S., Jr. Hemodynamic deterioration after coronary angioplasty in the presence of previous left ventricular infarction. Am. J. Cardiol. 1984, 54, 448–450. [Google Scholar] [CrossRef]
  4. Boateng, S.; Sanborn, T. Acute myocardial infarction. Disease-a-Month 2013, 59, 83–96. [Google Scholar] [CrossRef] [PubMed]
  5. Bajaj, A.; Sethi, A.; Rathor, P.; Suppogu, N.; Sethi, A. Acute complications of myocardial infarction in the current era: Diagnosis and management. J. Investig. Med. 2015, 63, 844–855. [Google Scholar] [CrossRef] [PubMed]
  6. De Winter, R.J.; Koster, R.W.; Sturk, A.; Sanders, G.T. Value of myoglobin, troponin T, and CK-MBmass in ruling out an acute myocardial infarction in the emergency room. Circulation 1995, 92, 3401–3407. [Google Scholar] [CrossRef] [PubMed]
  7. Jaffe, A.S.; Ravkilde, J.; Roberts, R.; Naslund, U.; Apple, F.S.; Galvani, M.; Katus, H. It’s time for a change to a troponin standard. Circulation 2000, 102, 1216–1220. [Google Scholar] [CrossRef] [Green Version]
  8. Collinson, P.; Hadcocks, L.; Foo, Y.; Rosalki, S.; Stubbs, P.; Morgan, S.; O’Donnell, J. Cardiac troponins in patients with renal dysfunction. Ann. Clin. Biochem. 1998, 35, 380–386. [Google Scholar] [CrossRef]
  9. Agewall, S.; Giannitsis, E.; Jernberg, T.; Katus, H. Troponin elevation in coronary vs. non-coronary disease. Eur. Heart J. 2011, 32, 404–411. [Google Scholar] [CrossRef]
  10. Katus, H.; Ziegler, A.; Ekinci, O.; Giannitsis, E.; Stough, W.G.; Achenbach, S.; Blankenberg, S.; Brueckmann, M.; Collinson, P.; Comaniciu, D. Early diagnosis of acute coronary syndrome. Eur. Heart J. 2017, 38, 3049–3055. [Google Scholar] [CrossRef]
  11. Sarkisian, L.; Saaby, L.; Poulsen, T.S.; Gerke, O.; Hosbond, S.; Jangaard, N.; Diederichsen, A.C.; Thygesen, K.; Mickley, H. Prognostic impact of myocardial injury related to various cardiac and noncardiac conditions. Am. J. Med. 2016, 129, 506–514.e501. [Google Scholar] [CrossRef] [Green Version]
  12. Thygesen, K.; Alpert, J.S.; Jaffe, A.S.; Chaitman, B.R.; Bax, J.J.; Morrow, D.A.; White, H.D. Fourth Universal Definition of Myocardial Infarction. Circulation 2018, 138, e618–e651. [Google Scholar] [CrossRef] [PubMed]
  13. Khera, R.; Haimovich, J.; Hurley, N.C.; McNamara, R.; Spertus, J.A.; Desai, N.; Rumsfeld, J.S.; Masoudi, F.A.; Huang, C.; Normand, S.-L.; et al. Use of Machine Learning Models to Predict Death After Acute Myocardial Infarction. JAMA Cardiol. 2021, 6, 633–641. [Google Scholar] [CrossRef] [PubMed]
  14. Ibanez, B.; James, S.; Agewall, S.; Antunes, M.J.; Bucciarelli-Ducci, C.; Bueno, H.; Caforio, A.L.P.; Crea, F.; Goudevenos, J.A.; Halvorsen, S.; et al. 2017 ESC Guidelines for the management of acute myocardial infarction in patients presenting with ST-segment elevation: The Task Force for the management of acute myocardial infarction in patients presenting with ST-segment elevation of the European Society of Cardiology (ESC). Eur. Heart J. 2018, 39, 119–177. [Google Scholar] [CrossRef] [Green Version]
  15. Collet, J.-P.; Thiele, H.; Barbato, E.; Barthélémy, O.; Bauersachs, J.; Bhatt, D.L.; Dendale, P.; Dorobantu, M.; Edvardsen, T.; Folliguet, T.; et al. 2020 ESC Guidelines for the management of acute coronary syndromes in patients presenting without persistent ST-segment elevation: The Task Force for the management of acute coronary syndromes in patients presenting without persistent ST-segment elevation of the European Society of Cardiology (ESC). Eur. Heart J. 2021, 42, 1289–1367. [Google Scholar] [CrossRef]
  16. Zhong, Z.; Wu, H.; Zhong, W.; Zhang, Q.; Yu, Z. Expression profiling and bioinformatics analysis of circulating microRNAs in patients with acute myocardial infarction. J. Clin. Lab. Anal. 2020, 34, e23099. [Google Scholar] [CrossRef]
  17. Agamah, F.E.; Mazandu, G.K.; Hassan, R.; Bope, C.D.; Thomford, N.E.; Ghansah, A.; Chimusa, E.R. Computational/in silico methods in drug target and lead prediction. Brief. Bioinform. 2020, 21, 1663–1675. [Google Scholar] [CrossRef]
  18. Khedkar, H.N.; Wang, Y.-C.; Yadav, V.K.; Srivastava, P.; Lawal, B.; Mokgautsi, N.; Sumitra, M.R.; Wu, A.T.H.; Huang, H.-S. In-Silico Evaluation of Genetic Alterations in Ovarian Carcinoma and Therapeutic Efficacy of NSC777201, as a Novel Multi-Target Agent for TTK, NEK2, and CDK1. Int. J. Mol. Sci. 2021, 22, 5895. [Google Scholar] [CrossRef]
  19. Lawal, B.; Lin, L.-C.; Lee, J.-C.; Chen, J.-H.; Bekaii-Saab, T.S.; Wu, A.T.H.; Ho, C.-L. Multi-Omics Data Analysis of Gene Expressions and Alterations, Cancer-Associated Fibroblast and Immune Infiltrations, Reveals the Onco-Immune Prognostic Relevance of STAT3/CDK2/4/6 in Human Malignancies. Cancers 2021, 13, 954. [Google Scholar] [CrossRef]
  20. Wu, S.-Y.; Lin, K.-C.; Lawal, B.; Wu, A.T.H.; Wu, C.-Z. MXD3 as an onco-immunological biomarker encompassing the tumor microenvironment, disease staging, prognoses, and therapeutic responses in multiple cancer types. Comput. Struct. Biotechnol. J. 2021, 19, 4970–4983. [Google Scholar] [CrossRef]
  21. Wu, A.T.H.; Lawal, B.; Wei, L.; Wen, Y.-T.; Tzeng, D.T.W.; Lo, W.-C. Multiomics Identification of Potential Targets for Alzheimer Disease and Antrocin as a Therapeutic Candidate. Pharmaceutics 2021, 13, 1555. [Google Scholar] [CrossRef]
  22. Lawal, B.; Lo, W.-C.; Mokgautsi, N.; Sumitra, M.R.; Khedkar, H.; Wu, A.T.; Huang, H.-S. A preclinical report of a cobimetinib-inspired novel anticancer small-molecule scaffold of isoflavones, NSC777213, for targeting PI3K/AKT/mTOR/MEK in multiple cancers. Am. J. Cancer Res. 2021, 11, 2590–2617. [Google Scholar] [PubMed]
  23. Boon, R.A.; Dimmeler, S. MicroRNAs in myocardial infarction. Nat. Rev. Cardiol. 2015, 12, 135–142. [Google Scholar] [CrossRef] [PubMed]
  24. Lawal, B.; Shittu, O.K.; Oibiokpa, F.I.; Berinyuy, E.B.; Mohammed, H. African natural products with potential antioxidants and hepatoprotectives properties: A review. Clin. Phytoscience 2016, 2, 23. [Google Scholar] [CrossRef] [Green Version]
  25. Lawal, B.; Shittu, O.K.; Kabiru, A.Y.; Jigam, A.A.; Umar, M.B.; Berinyuy, E.B.; Alozieuwa, B.U. Potential antimalarials from African natural products: A reviw. J. Intercult. Ethnopharmacol. 2015, 4, 318. [Google Scholar] [CrossRef]
  26. Kim, J.H.; Kismali, G.; Gupta, S.C. Natural Products for the Prevention and Treatment of Chronic Inflammatory Diseases: Integrating Traditional Medicine into Modern Chronic Diseases Care. Evid.-Based Complementary Altern. Med. 2018, 2018, 9837863. [Google Scholar] [CrossRef]
  27. Onikanni, A.S.; Lawal, B.; Olusola, A.O.; Olugbodi, J.O.; Sani, S.; Ajiboye, B.O.; Ilesanmi, O.B.; Alqarni, M.; Mostafa-Hedeab, G.; Obaidullah, A.J.; et al. Sterculia tragacantha Lindl Leaf Extract Ameliorates STZ-Induced Diabetes, Oxidative Stress, Inflammation and Neuronal Impairment. J. Inflamm. Res. 2021, 14, 6749–6764. [Google Scholar] [CrossRef]
  28. Chen, Y.-L.; Lan, Y.-H.; Hsieh, P.-W.; Wu, C.-C.; Chen, S.-L.; Yen, C.-T.; Chang, F.-R.; Hung, W.-C.; Wu, Y.-C. Bioactive cembrane diterpenoids of Anisomeles indica. J. Nat. Prod. 2008, 71, 1207–1212. [Google Scholar] [CrossRef]
  29. Liu, S.-C.; Huang, C.-M.; Chang, Y.-L.; Bamodu, O.A.; Yeh, C.-T.; Wang, H.-W.; Lee, F.-P.; Lin, C.-S. Ovatodiolide suppresses inflammatory response in BEAS-2B cells by regulating the CREB/AQP5 pathway, and sensitizes nasopharyngeal carcinoma cells to radiation therapy. Eur. J. Pharmacol. 2019, 859, 172548. [Google Scholar] [CrossRef]
  30. Bamodu, O.A.; Huang, W.-C.; Tzeng, D.T.W.; Wu, A.; Wang, L.S.; Yeh, C.-T.; Chao, T.-Y. Ovatodiolide sensitizes aggressive breast cancer cells to doxorubicin, eliminates their cancer stem cell-like phenotype, and reduces doxorubicin-associated toxicity. Cancer Lett. 2015, 364, 125–134. [Google Scholar] [CrossRef]
  31. Chen, J.-H.; Wu, A.T.H.; Bamodu, O.A.; Yadav, V.K.; Chao, T.-Y.; Tzeng, Y.-M.; Mukhopadhyay, D.; Hsiao, M.; Lee, J.-C. Ovatodiolide Suppresses Oral Cancer Malignancy by Down-Regulating Exosomal Mir-21/STAT3/β-Catenin Cargo and Preventing Oncogenic Transformation of Normal Gingival Fibroblasts. Cancers 2020, 12, 56. [Google Scholar] [CrossRef] [Green Version]
  32. Lin, C.-S.; Bamodu, O.A.; Kuo, K.-T.; Huang, C.-M.; Liu, S.-C.; Wang, C.-H.; Tzeng, Y.-M.; Chao, T.-Y.; Yeh, C.-T. Investigation of ovatodiolide, a macrocyclic diterpenoid, as a potential inhibitor of oral cancer stem-like cells properties via the inhibition of the JAK2/STAT3/JARID1B signal circuit. Phytomedicine 2018, 46, 93–103. [Google Scholar] [CrossRef] [PubMed]
  33. Ho, J.-Y.; Hsu, R.-J.; Wu, C.-L.; Chang, W.-L.; Cha, T.-L.; Yu, D.-S.; Yu, C.-P. Ovatodiolide Targets β-Catenin Signaling in Suppressing Tumorigenesis and Overcoming Drug Resistance in Renal Cell Carcinoma. Evid.-Based Complementary Altern. Med. 2013, 2013, 161628. [Google Scholar] [CrossRef] [Green Version]
  34. Su, Y.-K.; Bamodu, O.A.; Tzeng, Y.-M.; Hsiao, M.; Yeh, C.-T.; Lin, C.-M. Ovatodiolide inhibits the oncogenicity and cancer stem cell-like phenotype of glioblastoma cells, as well as potentiate the anticancer effect of temozolomide. Phytomedicine 2019, 61, 152840. [Google Scholar] [CrossRef] [PubMed]
  35. Momose, Y.; Nimura, M.; Arisawa, M.; Hayashi, T.; Takeda, R.; Nakanishi, S. Hypotensive activity of ovatodiolides isolated from a Chinese crude drug ‘Fang Feng Cao’. Phytother. Res. 1994, 8, 482–484. [Google Scholar] [CrossRef]
  36. Chen, J.-H.; Wu, A.T.H.; Lawal, B.; Tzeng, D.T.W.; Lee, J.-C.; Ho, C.-L.; Chao, T.-Y. Identification of Cancer Hub Gene Signatures Associated with Immune-Suppressive Tumor Microenvironment and Ovatodiolide as a Potential Cancer Immunotherapeutic Agent. Cancers 2021, 13, 3847. [Google Scholar] [CrossRef]
  37. Meng, X.-Y.; Zhang, H.-X.; Mezei, M.; Cui, M. Molecular docking: A powerful approach for structure-based drug discovery. Curr. Comput.-Aided Drug Des. 2011, 7, 146–157. [Google Scholar] [CrossRef]
  38. Lawal, B.; Liu, Y.-L.; Mokgautsi, N.; Khedkar, H.; Sumitra, M.R.; Wu, A.T.H.; Huang, H.-S. Pharmacoinformatics and Preclinical Studies of NSC765690 and NSC765599, Potential STAT3/CDK2/4/6 Inhibitors with Antitumor Activities against NCI60 Human Tumor Cell Lines. Biomedicines 2021, 9, 92. [Google Scholar] [CrossRef]
  39. Arslan, F.; de Kleijn, D.P.; Pasterkamp, G. Innate immune signaling in cardiac ischemia. Nat. Rev. Cardiol. 2011, 8, 292–300. [Google Scholar] [CrossRef]
  40. Frangogiannis, N.G.; Smith, C.W.; Entman, M.L. The inflammatory response in myocardial infarction. Cardiovasc. Res. 2002, 53, 31–47. [Google Scholar] [CrossRef]
  41. Werns, S.W.; Lucchesi, B.R. Inflammation and myocardial infarction. Br. Med. Bull. 1987, 43, 460–471. [Google Scholar] [CrossRef]
  42. Timmers, L.; Pasterkamp, G.; de Hoog, V.C.; Arslan, F.; Appelman, Y.; de Kleijn, D.P.V. The innate immune response in reperfused myocardium. Cardiovasc. Res. 2012, 94, 276–283. [Google Scholar] [CrossRef] [PubMed] [Green Version]
  43. Montecucco, F.; Lenglet, S.; Braunersreuther, V.; Pelli, G.; Pellieux, C.; Montessuit, C.; Lerch, R.; Deruaz, M.; Proudfoot, A.E.; Mach, F. Single administration of the CXC chemokine-binding protein Evasin-3 during ischemia prevents myocardial reperfusion injury in mice. Arterioscler. Thromb. Vasc. Biol. 2010, 30, 1371–1377. [Google Scholar] [CrossRef] [PubMed] [Green Version]
  44. Mylonas, K.J.; Turner, N.A.; Bageghni, S.A.; Kenyon, C.J.; White, C.I.; McGregor, K.; Kimmitt, R.A.; Sulston, R.; Kelly, V.; Walker, B.R. 11β-HSD1 suppresses cardiac fibroblast CXCL2, CXCL5 and neutrophil recruitment to the heart post MI. J. Endocrinol. 2017, 233, 315. [Google Scholar] [CrossRef] [PubMed]
  45. Dallacasagrande, V.; Hajjar, K.A. Annexin A2 in Inflammation and Host Defense. Cells 2020, 9, 1499. [Google Scholar] [CrossRef]
  46. Zong, L.; Wang, W. CircANXA2 Promotes Myocardial Apoptosis in Myocardial Ischemia-Reperfusion Injury via Inhibiting miRNA-133 Expression. BioMed Res. Int. 2020, 2020, 8590861. [Google Scholar] [CrossRef]
  47. Tanaka, N.; Masamura, K.; Yoshida, M.; Kato, M.; Kawai, Y.; Miyamori, I. A role of heparin-binding epidermal growth factor-like growth factor in cardiac remodeling after myocardial infarction. Biochem. Biophys. Res. Commun. 2002, 297, 375–381. [Google Scholar] [CrossRef]
  48. Shivshankar, P.; Halade, G.V.; Calhoun, C.; Escobar, G.P.; Mehr, A.J.; Jimenez, F.; Martinez, C.; Bhatnagar, H.; Mjaatvedt, C.H.; Lindsey, M.L.; et al. Caveolin-1 deletion exacerbates cardiac interstitial fibrosis by promoting M2 macrophage activation in mice after myocardial infarction. J. Mol. Cell. Cardiol. 2014, 76, 84–93. [Google Scholar] [CrossRef] [Green Version]
  49. Mani, R.; Onge, R.P.S.; Hartman, J.L.; Giaever, G.; Roth, F.P. Defining genetic interaction. Proc. Natl. Acad. Sci. USA 2008, 105, 3461–3466. [Google Scholar] [CrossRef] [Green Version]
  50. Baryshnikova, A.; Costanzo, M.; Myers, C.L.; Andrews, B.; Boone, C. Genetic interaction networks: Toward an understanding of heritability. Annu. Rev. Genom. Hum. Genet. 2013, 14, 111–133. [Google Scholar] [CrossRef]
  51. Fece de la Cruz, F.; Gapp, B.V.; Nijman, S.M. Synthetic lethal vulnerabilities of cancer. Annu. Rev. Pharmacol. Toxicol. 2015, 55, 513–531. [Google Scholar] [CrossRef]
  52. Ashworth, A.; Lord, C.J.; Reis-Filho, J.S. Genetic interactions in cancer progression and treatment. Cell 2011, 145, 30–38. [Google Scholar] [CrossRef] [PubMed] [Green Version]
  53. Fong, P.C.; Boss, D.S.; Yap, T.A.; Tutt, A.; Wu, P.; Mergui-Roelvink, M.; Mortimer, P.; Swaisland, H.; Lau, A.; O’Connor, M.J.; et al. Inhibition of poly(ADP-ribose) polymerase in tumors from BRCA mutation carriers. N. Engl. J. Med. 2009, 361, 123–134. [Google Scholar] [CrossRef] [PubMed] [Green Version]
  54. Lewis, B.P.; Shih, I.-H.; Jones-Rhoades, M.W.; Bartel, D.P.; Burge, C.B. Prediction of mammalian microRNA targets. Cell 2003, 115, 787–798. [Google Scholar] [CrossRef] [Green Version]
  55. Pu, M.; Chen, J.; Tao, Z.; Miao, L.; Qi, X.; Wang, Y.; Ren, J. Regulatory network of miRNA on its target: Coordination between transcriptional and post-transcriptional regulation of gene expression. Cell. Mol. Life Sci. 2019, 76, 441–451. [Google Scholar] [CrossRef] [PubMed]
  56. Wang, G.-K.; Zhu, J.-Q.; Zhang, J.-T.; Li, Q.; Li, Y.; He, J.; Qin, Y.-W.; Jing, Q. Circulating microRNA: A novel potential biomarker for early diagnosis of acute myocardial infarction in humans. Eur. Heart J. 2010, 31, 659–666. [Google Scholar] [CrossRef]
  57. Meder, B.; Keller, A.; Vogel, B.; Haas, J.; Sedaghat-Hamedani, F.; Kayvanpour, E.; Just, S.; Borries, A.; Rudloff, J.; Leidinger, P. MicroRNA signatures in total peripheral blood as novel biomarkers for acute myocardial infarction. Basic Res. Cardiol. 2011, 106, 13–23. [Google Scholar] [CrossRef]
  58. Benhamed, M.; Herbig, U.; Ye, T.; Dejean, A.; Bischof, O. Senescence is an endogenous trigger for microRNA-directed transcriptional gene silencing in human cells. Nat. Cell Biol. 2012, 14, 266–275. [Google Scholar] [CrossRef]
  59. Roberts, T.C. The MicroRNA Biology of the Mammalian Nucleus. Mol. Ther. Nucleic Acids 2014, 3, e188. [Google Scholar] [CrossRef]
  60. Arthur, D.E.; Uzairu, A. Molecular docking studies on the interaction of NCI anticancer analogues with human Phosphatidylinositol 4,5-bisphosphate 3-kinase catalytic subunit. J. King Saud Univ. Sci. 2019, 31, 1151–1166. [Google Scholar] [CrossRef]
  61. Park, H.J.; Noh, J.H.; Eun, J.W.; Koh, Y.S.; Seo, S.M.; Park, W.S.; Lee, J.Y.; Chang, K.; Seung, K.B.; Kim, P.J.; et al. Assessment and diagnostic relevance of novel serum biomarkers for early decision of ST-elevation myocardial infarction. Oncotarget 2015, 6, 12970–12983. [Google Scholar] [CrossRef] [Green Version]
  62. Kiliszek, M.; Burzynska, B.; Michalak, M.; Gora, M.; Winkler, A.; Maciejak, A.; Leszczynska, A.; Gajda, E.; Kochanowski, J.; Opolski, G. Altered gene expression pattern in peripheral blood mononuclear cells in patients with acute myocardial infarction. PLoS ONE 2012, 7, e50054. [Google Scholar] [CrossRef] [PubMed] [Green Version]
  63. Muse, E.D.; Kramer, E.R.; Wang, H.; Barrett, P.; Parviz, F.; Novotny, M.A.; Lasken, R.S.; Jatkoe, T.A.; Oliveira, G.; Peng, H.; et al. A Whole Blood Molecular Signature for Acute Myocardial Infarction. Sci. Rep. 2017, 7, 12268. [Google Scholar] [CrossRef] [PubMed] [Green Version]
  64. Ritchie, M.E.; Phipson, B.; Wu, D.; Hu, Y.; Law, C.W.; Shi, W.; Smyth, G.K. limma powers differential expression analyses for RNA-sequencing and microarray studies. Nucleic Acids Res. 2015, 43, e47. [Google Scholar] [CrossRef] [PubMed]
  65. Heberle, H.; Meirelles, G.V.; da Silva, F.R.; Telles, G.P.; Minghim, R. InteractiVenn: A web-based tool for the analysis of sets through Venn diagrams. BMC Bioinform. 2015, 16, 169. [Google Scholar] [CrossRef]
  66. Toro-Domínguez, D.; Martorell-Marugán, J.; López-Domínguez, R.; García-Moreno, A.; González-Rumayor, V.; Alarcón-Riquelme, M.E.; Carmona-Sáez, P. ImaGEO: Integrative gene expression meta-analysis from GEO database. Bioinformatics 2019, 35, 880–882. [Google Scholar] [CrossRef] [PubMed]
  67. Marot, G.; Foulley, J.-L.; Mayer, C.-D.; Jaffrézic, F. Moderated effect size and P-value combinations for microarray meta-analyses. Bioinformatics 2009, 25, 2692–2699. [Google Scholar] [CrossRef] [PubMed] [Green Version]
  68. Sullivan, G.M.; Feinn, R. Using Effect Size-or Why the P Value Is Not Enough. J. Grad. Med. Educ. 2012, 4, 279–282. [Google Scholar] [CrossRef] [Green Version]
  69. Uhlén, M.; Fagerberg, L.; Hallström, B.M.; Lindskog, C.; Oksvold, P.; Mardinoglu, A.; Sivertsson, Å.; Kampf, C.; Sjöstedt, E.; Asplund, A.; et al. Proteomics. Tissue-based map of the human proteome. Science 2015, 347, 1260419. [Google Scholar] [CrossRef]
  70. Wang, L.; Yu, P.; Zhou, B.; Song, J.; Li, Z.; Zhang, M.; Guo, G.; Wang, Y.; Chen, X.; Han, L.; et al. Single-cell reconstruction of the adult human heart during heart failure and recovery reveals the cellular landscape underlying cardiac function. Nat. Cell Biol. 2020, 22, 108–119. [Google Scholar] [CrossRef]
  71. Chen, E.Y.; Tan, C.M.; Kou, Y.; Duan, Q.; Wang, Z.; Meirelles, G.V.; Clark, N.R.; Ma’ayan, A. Enrichr: Interactive and collaborative HTML5 gene list enrichment analysis tool. BMC Bioinform. 2013, 14, 128. [Google Scholar] [CrossRef] [Green Version]
  72. Kuleshov, M.V.; Jones, M.R.; Rouillard, A.D.; Fernandez, N.F.; Duan, Q.; Wang, Z.; Koplev, S.; Jenkins, S.L.; Jagodnik, K.M.; Lachmann, A.; et al. Enrichr: A comprehensive gene set enrichment analysis web server 2016 update. Nucleic Acids Res. 2016, 44, W90–W97. [Google Scholar] [CrossRef] [PubMed] [Green Version]
  73. Szklarczyk, D.; Gable, A.L.; Lyon, D.; Junge, A.; Wyder, S.; Huerta-Cepas, J.; Simonovic, M.; Doncheva, N.T.; Morris, J.H.; Bork, P.; et al. STRING v11: Protein–protein association networks with increased coverage, supporting functional discovery in genome-wide experimental datasets. Nucleic Acids Res. 2019, 47, D607–D613. [Google Scholar] [CrossRef] [PubMed] [Green Version]
  74. Mostafavi, S.; Ray, D.; Warde-Farley, D.; Grouios, C.; Morris, Q. GeneMANIA: A real-time multiple association network integration algorithm for predicting gene function. Genome Biol. 2008, 9, S4. [Google Scholar] [CrossRef] [PubMed] [Green Version]
  75. Ochoa, D.; Hercules, A.; Carmona, M.; Suveges, D.; Gonzalez-Uriarte, A.; Malangone, C.; Miranda, A.; Fumis, L.; Carvalho-Silva, D.; Spitzer, M.; et al. Open Targets Platform: Supporting systematic drug–target identification and prioritisation. Nucleic Acids Res. 2020, 49, D1302–D1310. [Google Scholar] [CrossRef]
  76. Liu, C.-J.; Hu, F.-F.; Xia, M.-X.; Han, L.; Zhang, Q.; Guo, A.-Y. GSCALite: A web server for gene set cancer analysis. Bioinformatics 2018, 34, 3771–3772. [Google Scholar] [CrossRef]
  77. Kern, F.; Fehlmann, T.; Solomon, J.; Schwed, L.; Grammes, N.; Backes, C.; Van Keuren-Jensen, K.; Craig, D.W.; Meese, E.; Keller, A. miEAA 2.0: Integrating multi-species microRNA enrichment analysis and workflow management systems. Nucleic Acids Res. 2020, 48, W521–W528. [Google Scholar] [CrossRef]
  78. Cotto, K.C.; Wagner, A.H.; Feng, Y.Y.; Kiwala, S.; Coffman, A.C.; Spies, G.; Wollam, A.; Spies, N.C.; Griffith, O.L.; Griffith, M. DGIdb 3.0: A redesign and expansion of the drug–gene interaction database. Nucleic Acids Res. 2018, 46, D1068–D1073. [Google Scholar] [CrossRef] [Green Version]
  79. Subramanian, A.; Narayan, R.; Corsello, S.M.; Peck, D.D.; Natoli, T.E.; Lu, X.; Gould, J.; Davis, J.F.; Tubelli, A.A.; Asiedu, J.K. A next generation connectivity map: L1000 platform and the first 1,000,000 profiles. Cell 2017, 171, 1437–1452.e1417. [Google Scholar] [CrossRef]
  80. Trott, O.; Olson, A.J. AutoDock Vina: Improving the speed and accuracy of docking with a new scoring function, efficient optimization, and multithreading. J. Comput. Chem. 2010, 31, 455–461. [Google Scholar] [CrossRef] [Green Version]
  81. Lee, J.-C.; Wu, A.T.H.; Chen, J.-H.; Huang, W.-Y.; Lawal, B.; Mokgautsi, N.; Huang, H.-S.; Ho, C.-L. HNC0014, a Multi-Targeted Small-Molecule, Inhibits Head and Neck Squamous Cell Carcinoma by Suppressing c-Met/STAT3/CD44/PD-L1 Oncoimmune Signature and Eliciting Antitumor Immune Responses. Cancers 2020, 12, 3759. [Google Scholar] [CrossRef]
  82. Lawal, B.; Lee, C.-Y.; Mokgautsi, N.; Sumitra, M.R.; Khedkar, H.; Wu, A.T.H.; Huang, H.-S. mTOR/EGFR/iNOS/MAP2K1/FGFR/TGFB1 Are Druggable Candidates for N-(2,4-Difluorophenyl)-2′,4′-Difluoro-4-Hydroxybiphenyl-3-Carboxamide (NSC765598), With Consequent Anticancer Implications. Front. Oncol. 2021, 11, 656738. [Google Scholar] [CrossRef] [PubMed]
  83. Hanwell, M.D.; Curtis, D.E.; Lonie, D.C.; Vandermeersch, T.; Zurek, E.; Hutchison, G.R. Avogadro: An advanced semantic chemical editor, visualization, and analysis platform. J. Cheminformatics 2012, 4, 17. [Google Scholar] [CrossRef] [PubMed] [Green Version]
  84. Visualizer, D.S. BIOVIA, Dassault Systèmes, BIOVIA Workbook, Release 2020; BIOVIA Pipeline Pilot, Release 2020; Dassault Systèmes: San Diego, CA, USA, 2020. [Google Scholar]
Figure 1. Schematic representation of the study workflow for the identification of the theranostic signature of metabolic and immune-inflammatory dysregulation with myocardial infarction and the potential therapeutic function of ovatodiolide, a macrocyclic diterpenoid.
Ijms 23 01281 g001
Figure 2. Identification of the potential genes related to myocardial infarction (MI). (A) Volcano plots of differentially expressed genes (DEGs) in the microarray datasets between MI patients and healthy controls. (B) Venn diagram showing the numbers of DEGs in each dataset and intersections of the DEGs from all MI datasets. (C) Heat maps of the intersected upregulated DEGs from the six datasets. Seven upregulated DEGs (MAN2A2, TNFRSF12A, SPP1, CSNK1D, PLAUR, PFKFB3, and CXCL16) the MTSCPPC signature associated with MI were identified.
Ijms 23 01281 g002
Figure 3. Subcellular localization of proteins and single-cell transcriptomic data of differentially expressed genes (DEGs) in the adult human heart during myocardial infarction. (A) Bar plots of single-cell transcriptomic data of the DEGs in different cells during myocardial infarction. (B) Immunofluorescence staining of the subcellular distributions of target proteins within the nucleus and endoplasmic reticulum (ER) of cells. Immunofluorescence staining was adopted from the HPA database.
Ijms 23 01281 g003
Figure 4. Functional enrichment analysis and biological network analysis of the MTSCPPC signature. (A) Visualization of enriched terms in KEGG pathways, and molecular function and cellular component categories in the GO analysis. The color intensity and the size of the round circles indicate, respectively, the odds ratios and p-values of enrichment. All terms were only considered to be significantly enriched at p < 0.05. Visualization of the significant (B) protein–protein interaction (PPI) and (C) gene–gene interaction (GGI) network clusters of the DEGs.
Ijms 23 01281 g004
Figure 5. Gene–disease and drug sensitivity associated with the MTSCPPC signature. (A) Gene–disease network plot of MAN2A2, TNFRSF12A, SPP1, CSNK1D, PLAUR, PFKFB3, and CXCL16. (B) Bubble plot of correlations between gene mRNA expression levels and small-molecule sensitivity. Colors from blue to red represent the correlation between the 50% inhibitory concentration (IC50) value of small molecules and mRNA expression levels of the MTSCPPC signature.
Ijms 23 01281 g005
Figure 6. The micro (mi)RNA regulatory network and enrichment of the MTSCPPC signature (A) The VisNetwork miRNA regulatory network of the MTSCPPC signature. (B) Heart-related disease enrichment plots of the signature.
Ijms 23 01281 g006
Figure 7. Therapeutic target exploration and comparative docking profile between ovatodiolide and standardized drugs. (A) Target protein class, (B) clinical phase, (C) mechanism of action, and (D) chemical structures of validated target inhibitors for the members of the MTSCPPC signature. Three- (3D) and two-dimensional (2D) structures of ligand–receptor complexes, showing interacting amino acid residues and the types of interactions occurring between the ligand (ovatodiolide and standardized drugs) and receptors: (E) MAN2A2, (F) PLAUR, and (G) CSNK1D.
Ijms 23 01281 g007
Figure 8. Three- (3D) and two-dimensional (2D) representations of ligand–receptor complexes, showing interacting amino acid residues and the types of interactions occurring between ovatodiolide and (A) MAN2A2, (B) CXCL16, (C) SPP1, and (D) TNFRSF12A.
Ijms 23 01281 g008
Table 1. Meta-analysis profile of six myocardial infarction (MI) databases.
Gene IDp-Value CombinationEffect Size CombinationGene_Name
fdr_pvalFC_meanfdr_pvalpvalzval
MAN2A20.00050.097.5 × 10−72.9 × 10−85.5mannosidase alpha class 2A member 2
TNFRSF12A0.00810.131.6 × 10−75.1 × 10−95.8TNF receptor superfamily member 12A
SPP10.00640.333.0 × 10−52.0 × 10−64.8secreted phosphoprotein 1
CSNK1D0.00290.131.2 × 10−65.3 × 10−85.4casein kinase 1 delta
PLAUR1.5 × 10−90.220010plasminogen activator, urokinase receptor
PFKFB30.00040.131.4 × 10−92.1 × 10−116.76-phosphofructo-2-kinase/fructose-2,6-biphosphatase3
CXCL163.0 × 10−60.17008.9C-X-C motif chemokine ligand 16
Fdr: false discovery rate; FC: fold change; pval: p-value; zval: Z value.
Table 2. Enriched biological processes associated with the MTSCPPC signature.
IndexNamep-ValueOdds RatioCombined Score
GO:0071394cellular response to testosterone stimulus 0.001749832.885287.72
GO:0006003fructose 2,6-bisphosphate metabolic process 0.001749832.885287.72
GO:0010818T-cell chemotaxis 0.003844333.051852.16
GO:0032370positive regulation of lipid transport 0.004542277.511497.03
GO:0006706steroid catabolic process 0.004890256.151362.86
GO:2000050regulation of non-canonical Wnt signaling pathway 0.005239237.851249.08
GO:0042730fibrinolysis 0.005239237.851249.08
GO:0006491N-glycan processing 0.006632184.95927.70
GO:0045821positive regulation of glycolytic process 0.007328166.44818.24
GO:0008209androgen metabolic process 0.007328166.44818.24
GO:1900544positive regulation of purine nucleotide metabolic process 0.007328166.44818.24
GO:0045913positive regulation of carbohydrate metabolic process 0.008371144.71692.15
GO:0022409positive regulation of cell-cell adhesion 0.0163472.27297.35
GO:0009100glycoprotein metabolic process 0.0190961.54243.60
GO:0031401positive regulation of protein modification process0.00231037.32226.57
GO:0034341response to interferon-gamma 0.0276742.01150.72
GO:0001934positive regulation of protein phosphorylation 0.00677621.27106.24
Table 3. Characteristics of the microarray datasets of myocardial infarction and healthy cohorts.
GEO Accession No. PlatformControlMI
GSE60993GPL6884Illumina HumanWG-6 v3.0 expression beadchip77
GSE62646GPL6244HuGene-1_0-st] Affymetrix Human Gene 1.0 ST Array [transcript (gene) version]21414
GSE19339GPL570[HG-U133_Plus_2] Affymetrix Human Genome U133 Plus 2.0 Array44
GSE61145GPL6884Illumina HumanWG-6 v3.0 expression beadchip77
GSE61144GPL6106Sentrix Human-6 v2 Expression beadchip1014
GSE66360GPL570[HG-U133_Plus_2] Affymetrix Human Genome U133 Plus 2.0 Array5049
Publisher’s Note: MDPI stays neutral with regard to jurisdictional claims in published maps and institutional affiliations.

