
Myo-Inositol Limits Kainic Acid-Induced Epileptogenesis in Rats

 , , , ,
Abstract
:1. Introduction
2. Results
2.1. Behavioural Analysis
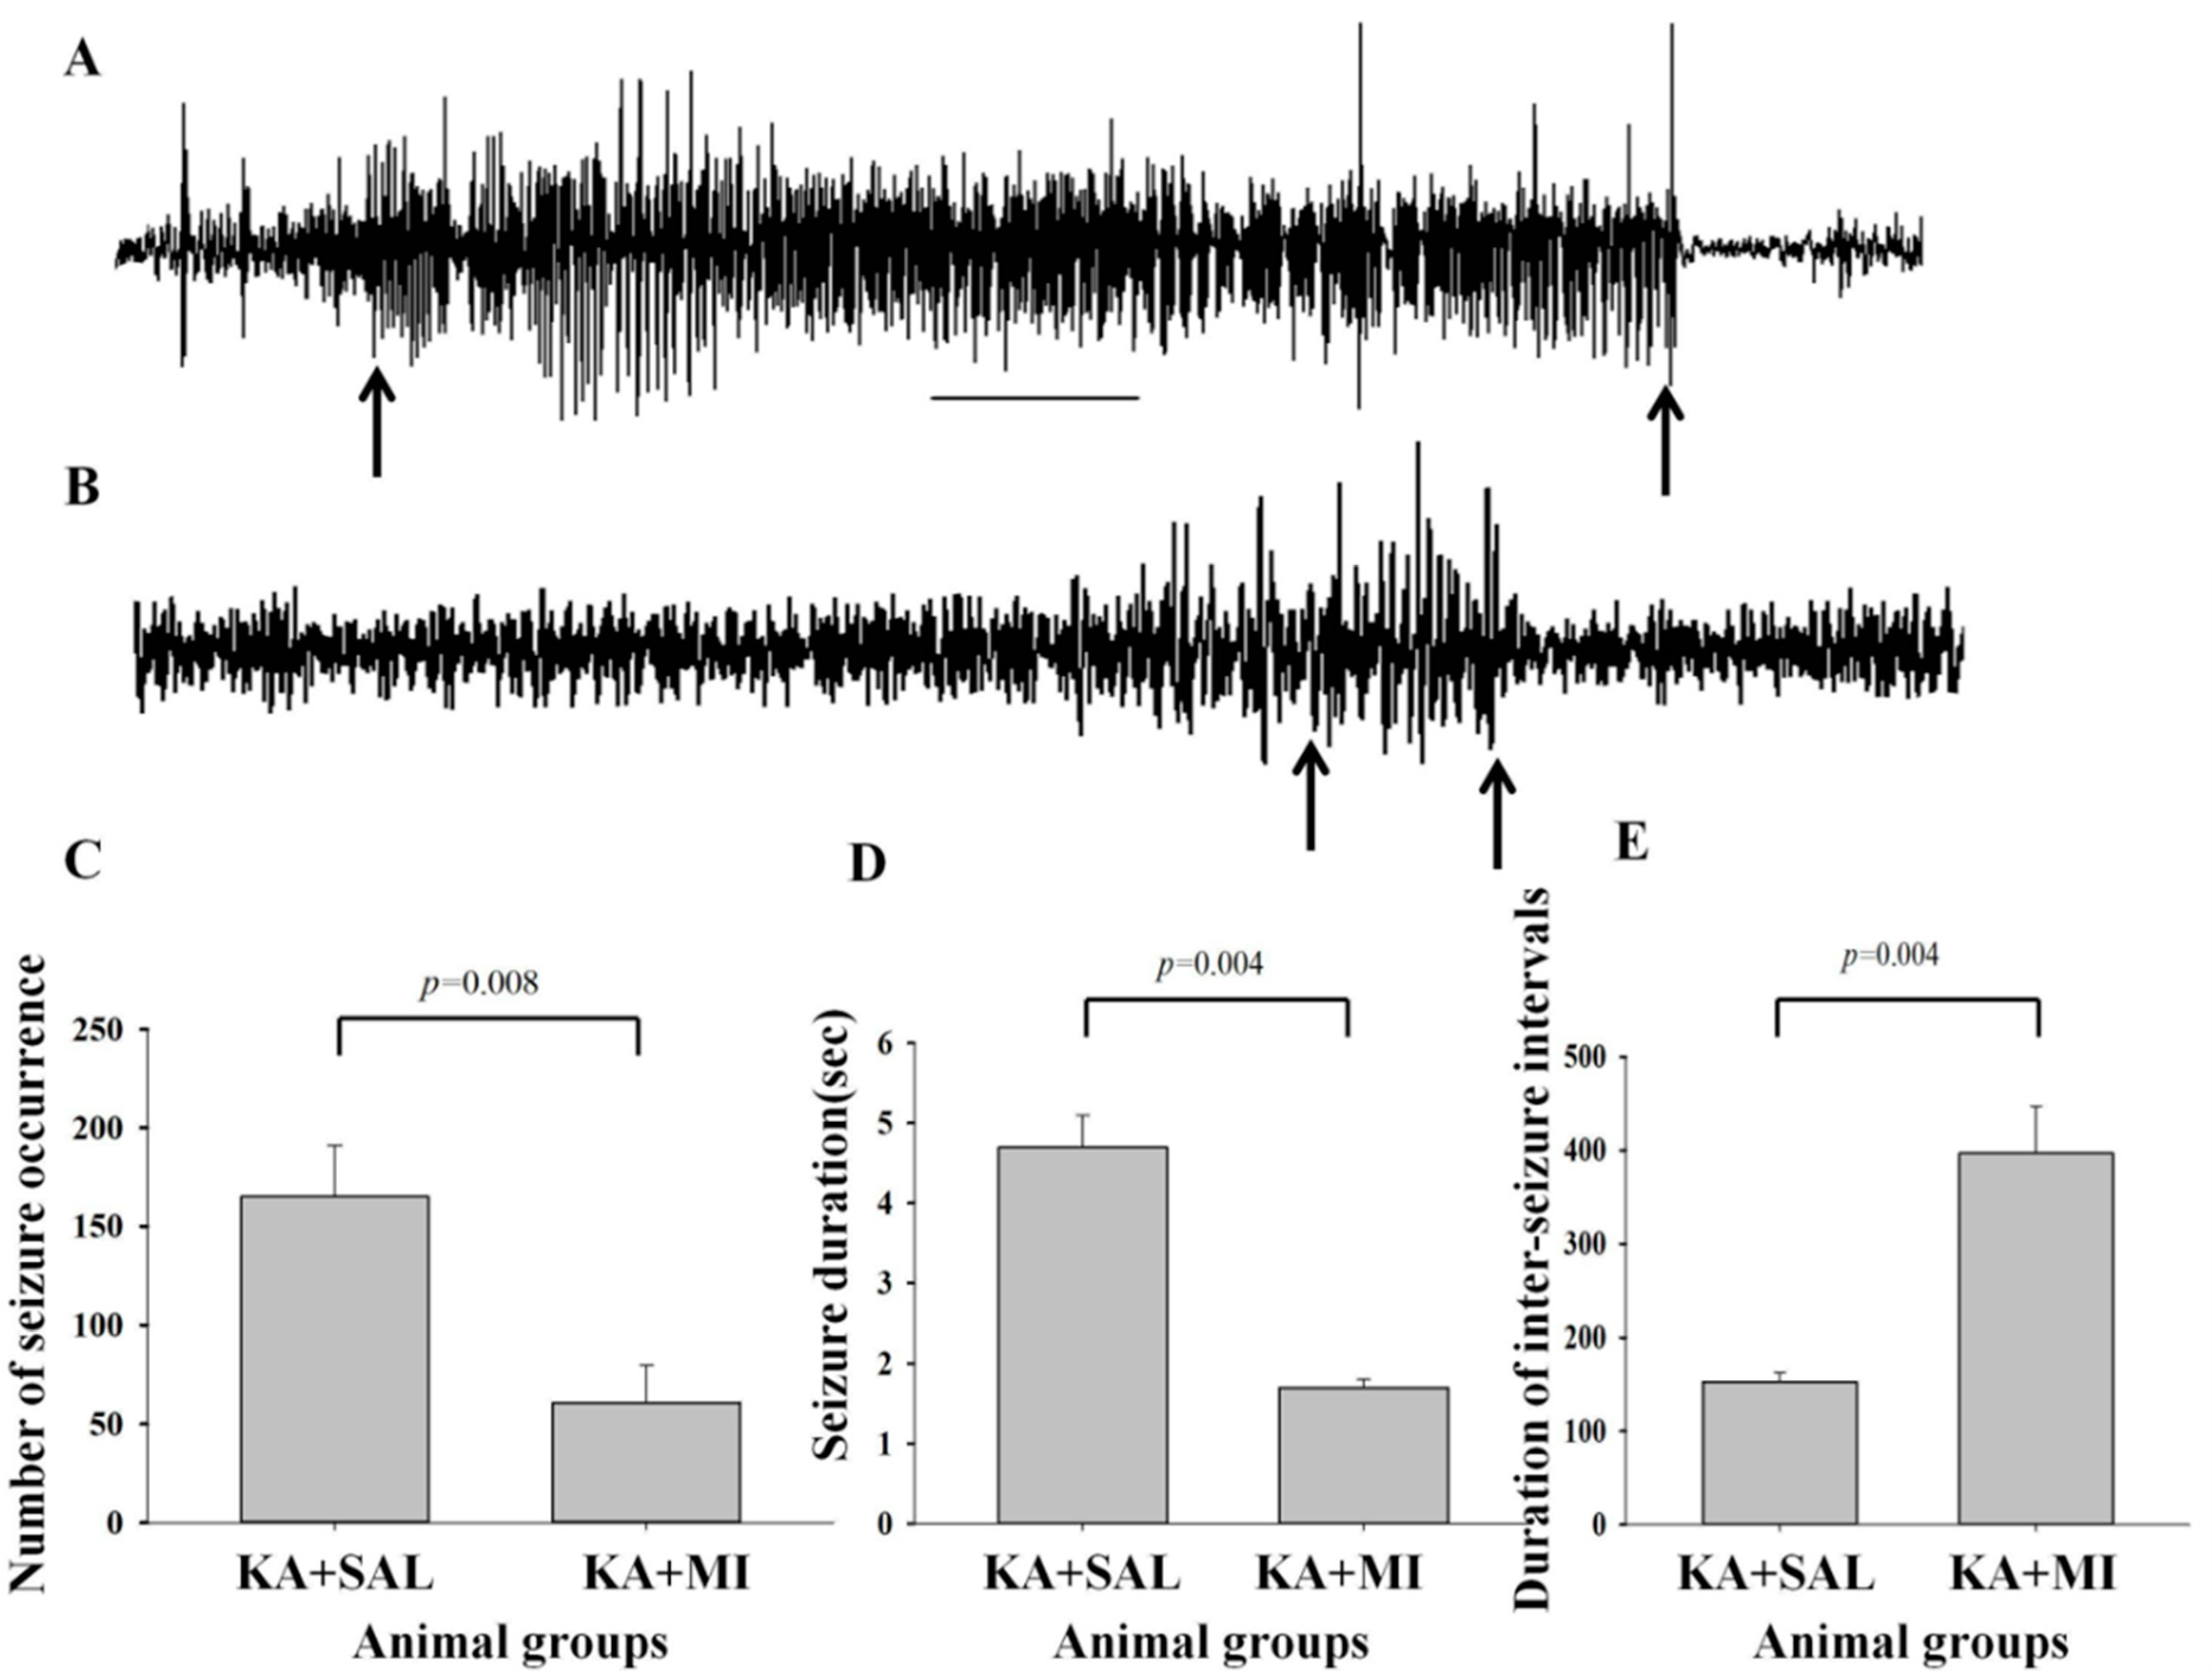
2.2. Electrographic Seizures
2.2.1. Number of Electrographic SRS
2.2.2. Duration of Electrographic SRS
2.2.3. Intervals between Seizure Electrical Activities
2.2.4. Interictal Events
2.3. Spatial Task Learning
Learning Escape Latency Time
2.4. Spatial Memory
Time Spent in Quadrant I and IV
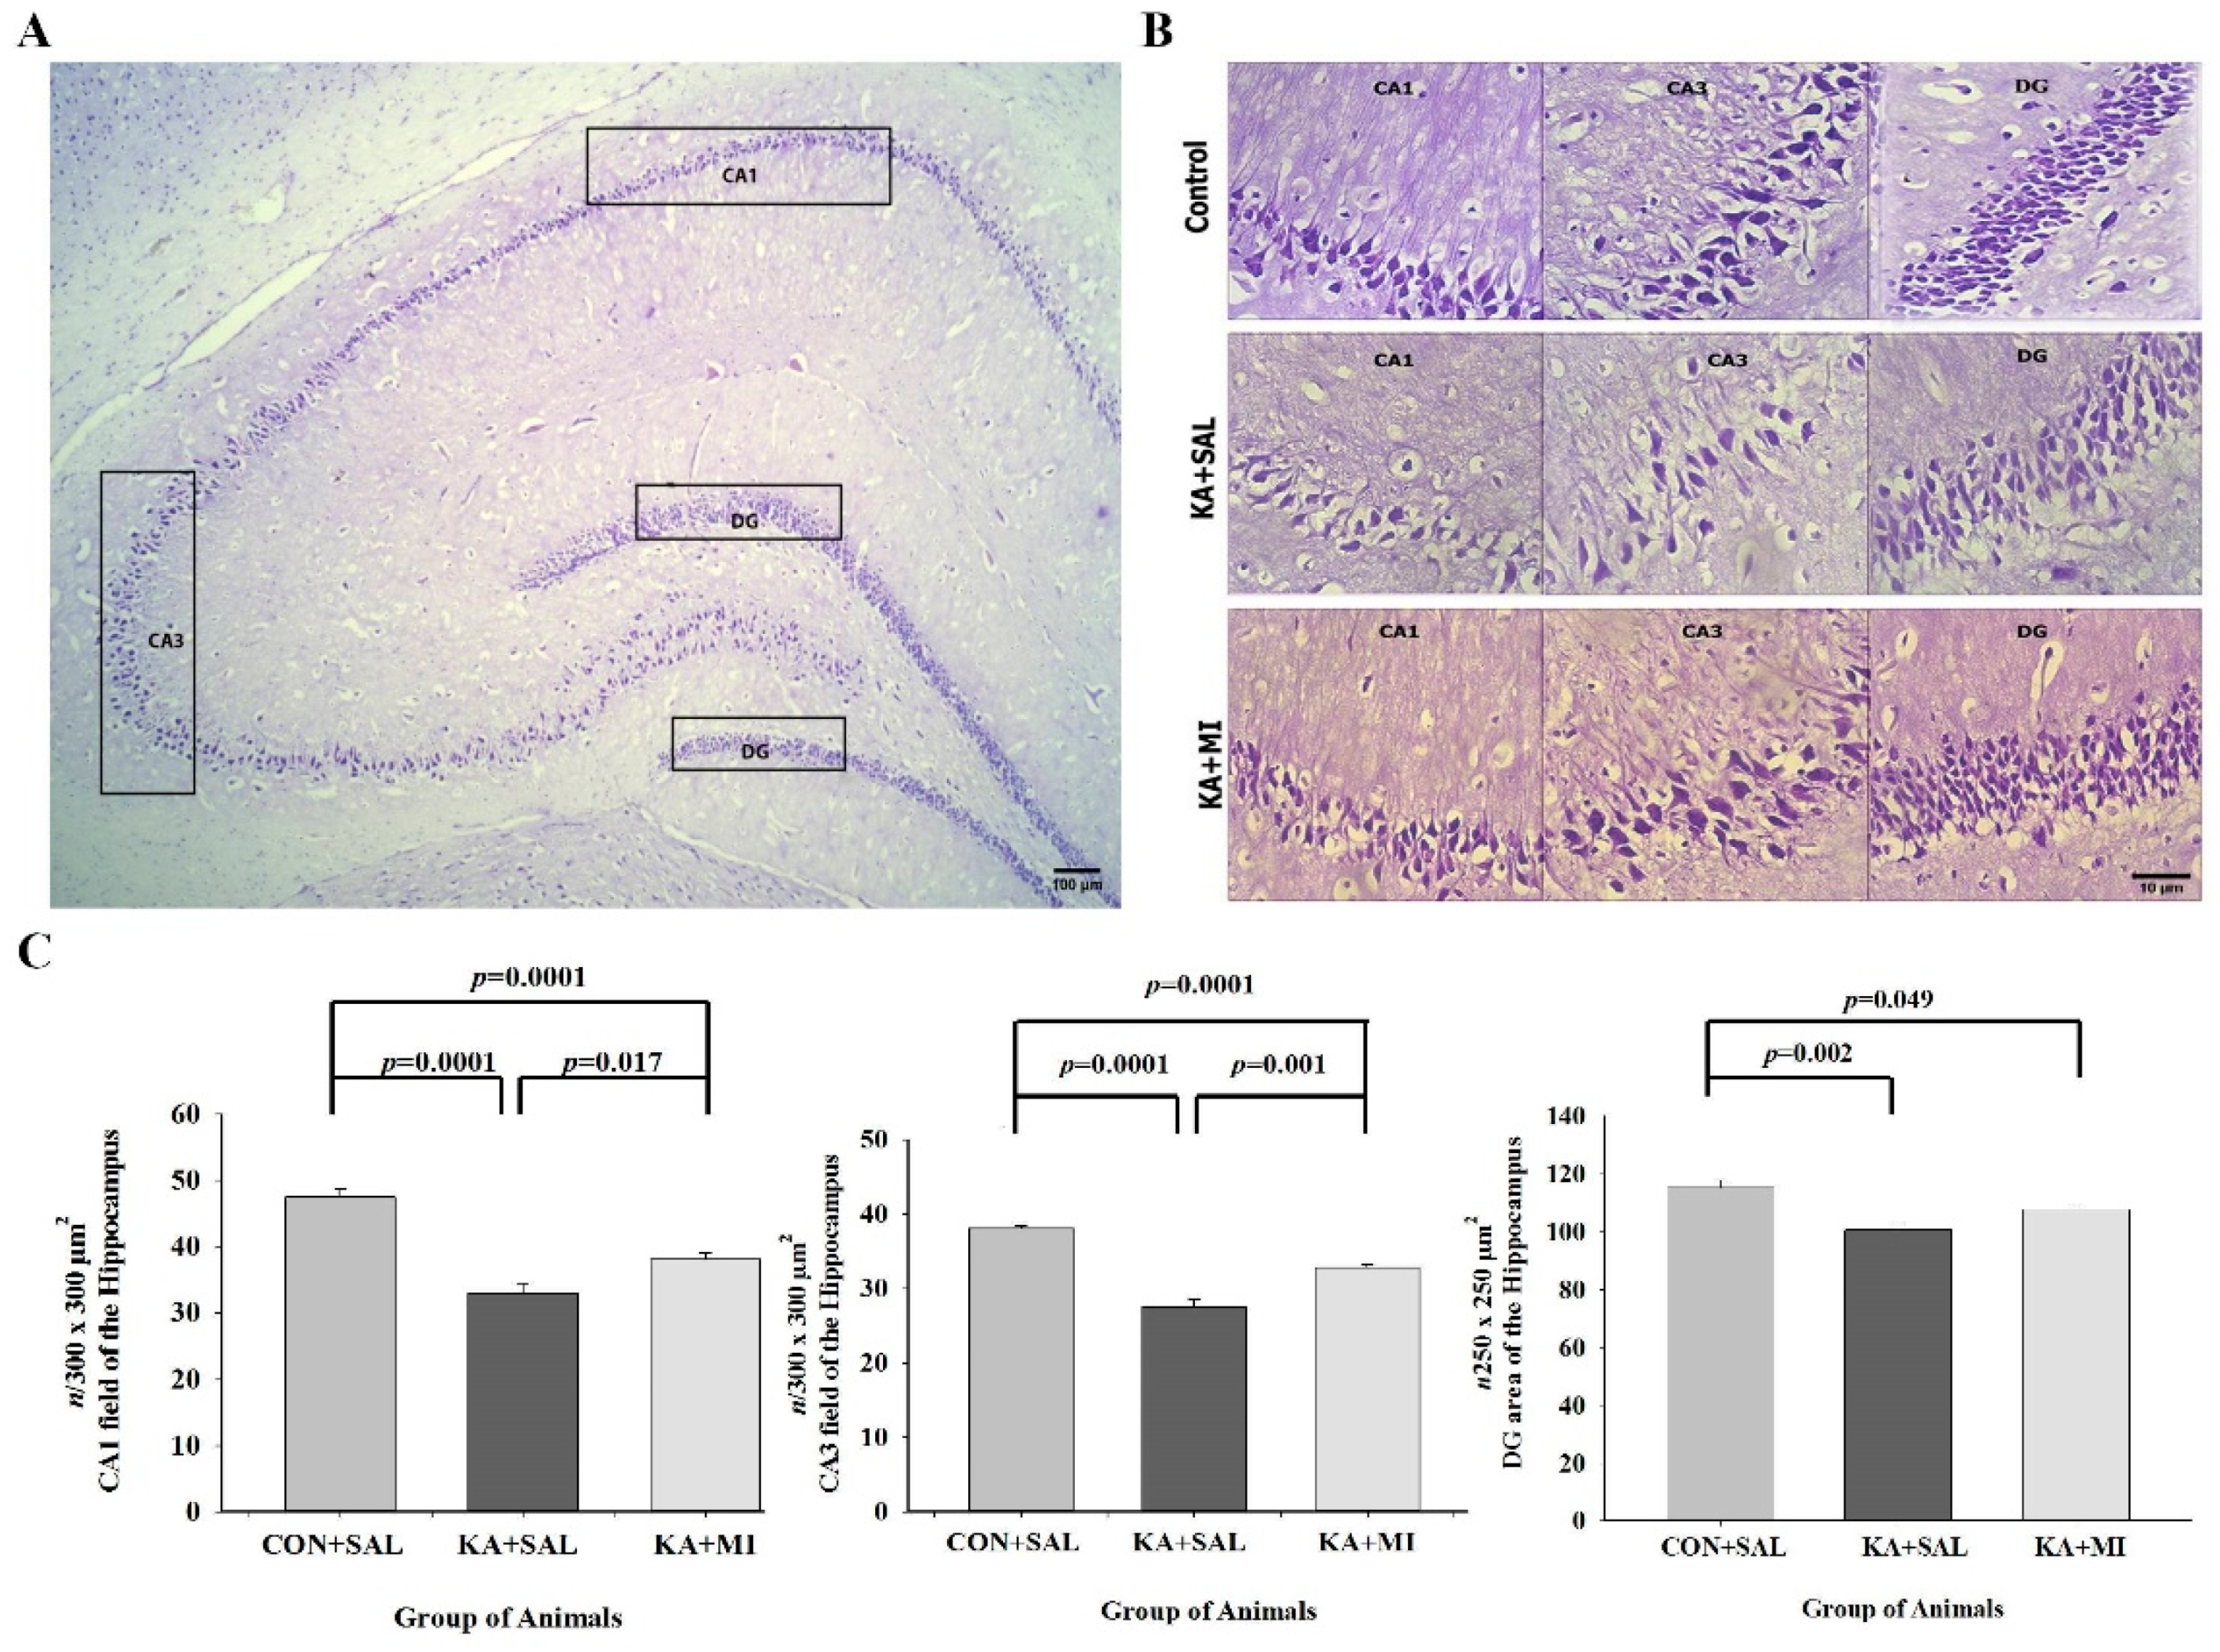
2.5. Cell Counts
2.5.1. CA1
2.5.2. CA3
2.5.3. Dentate Gyrus (DG)
2.6. Biochemical Changes
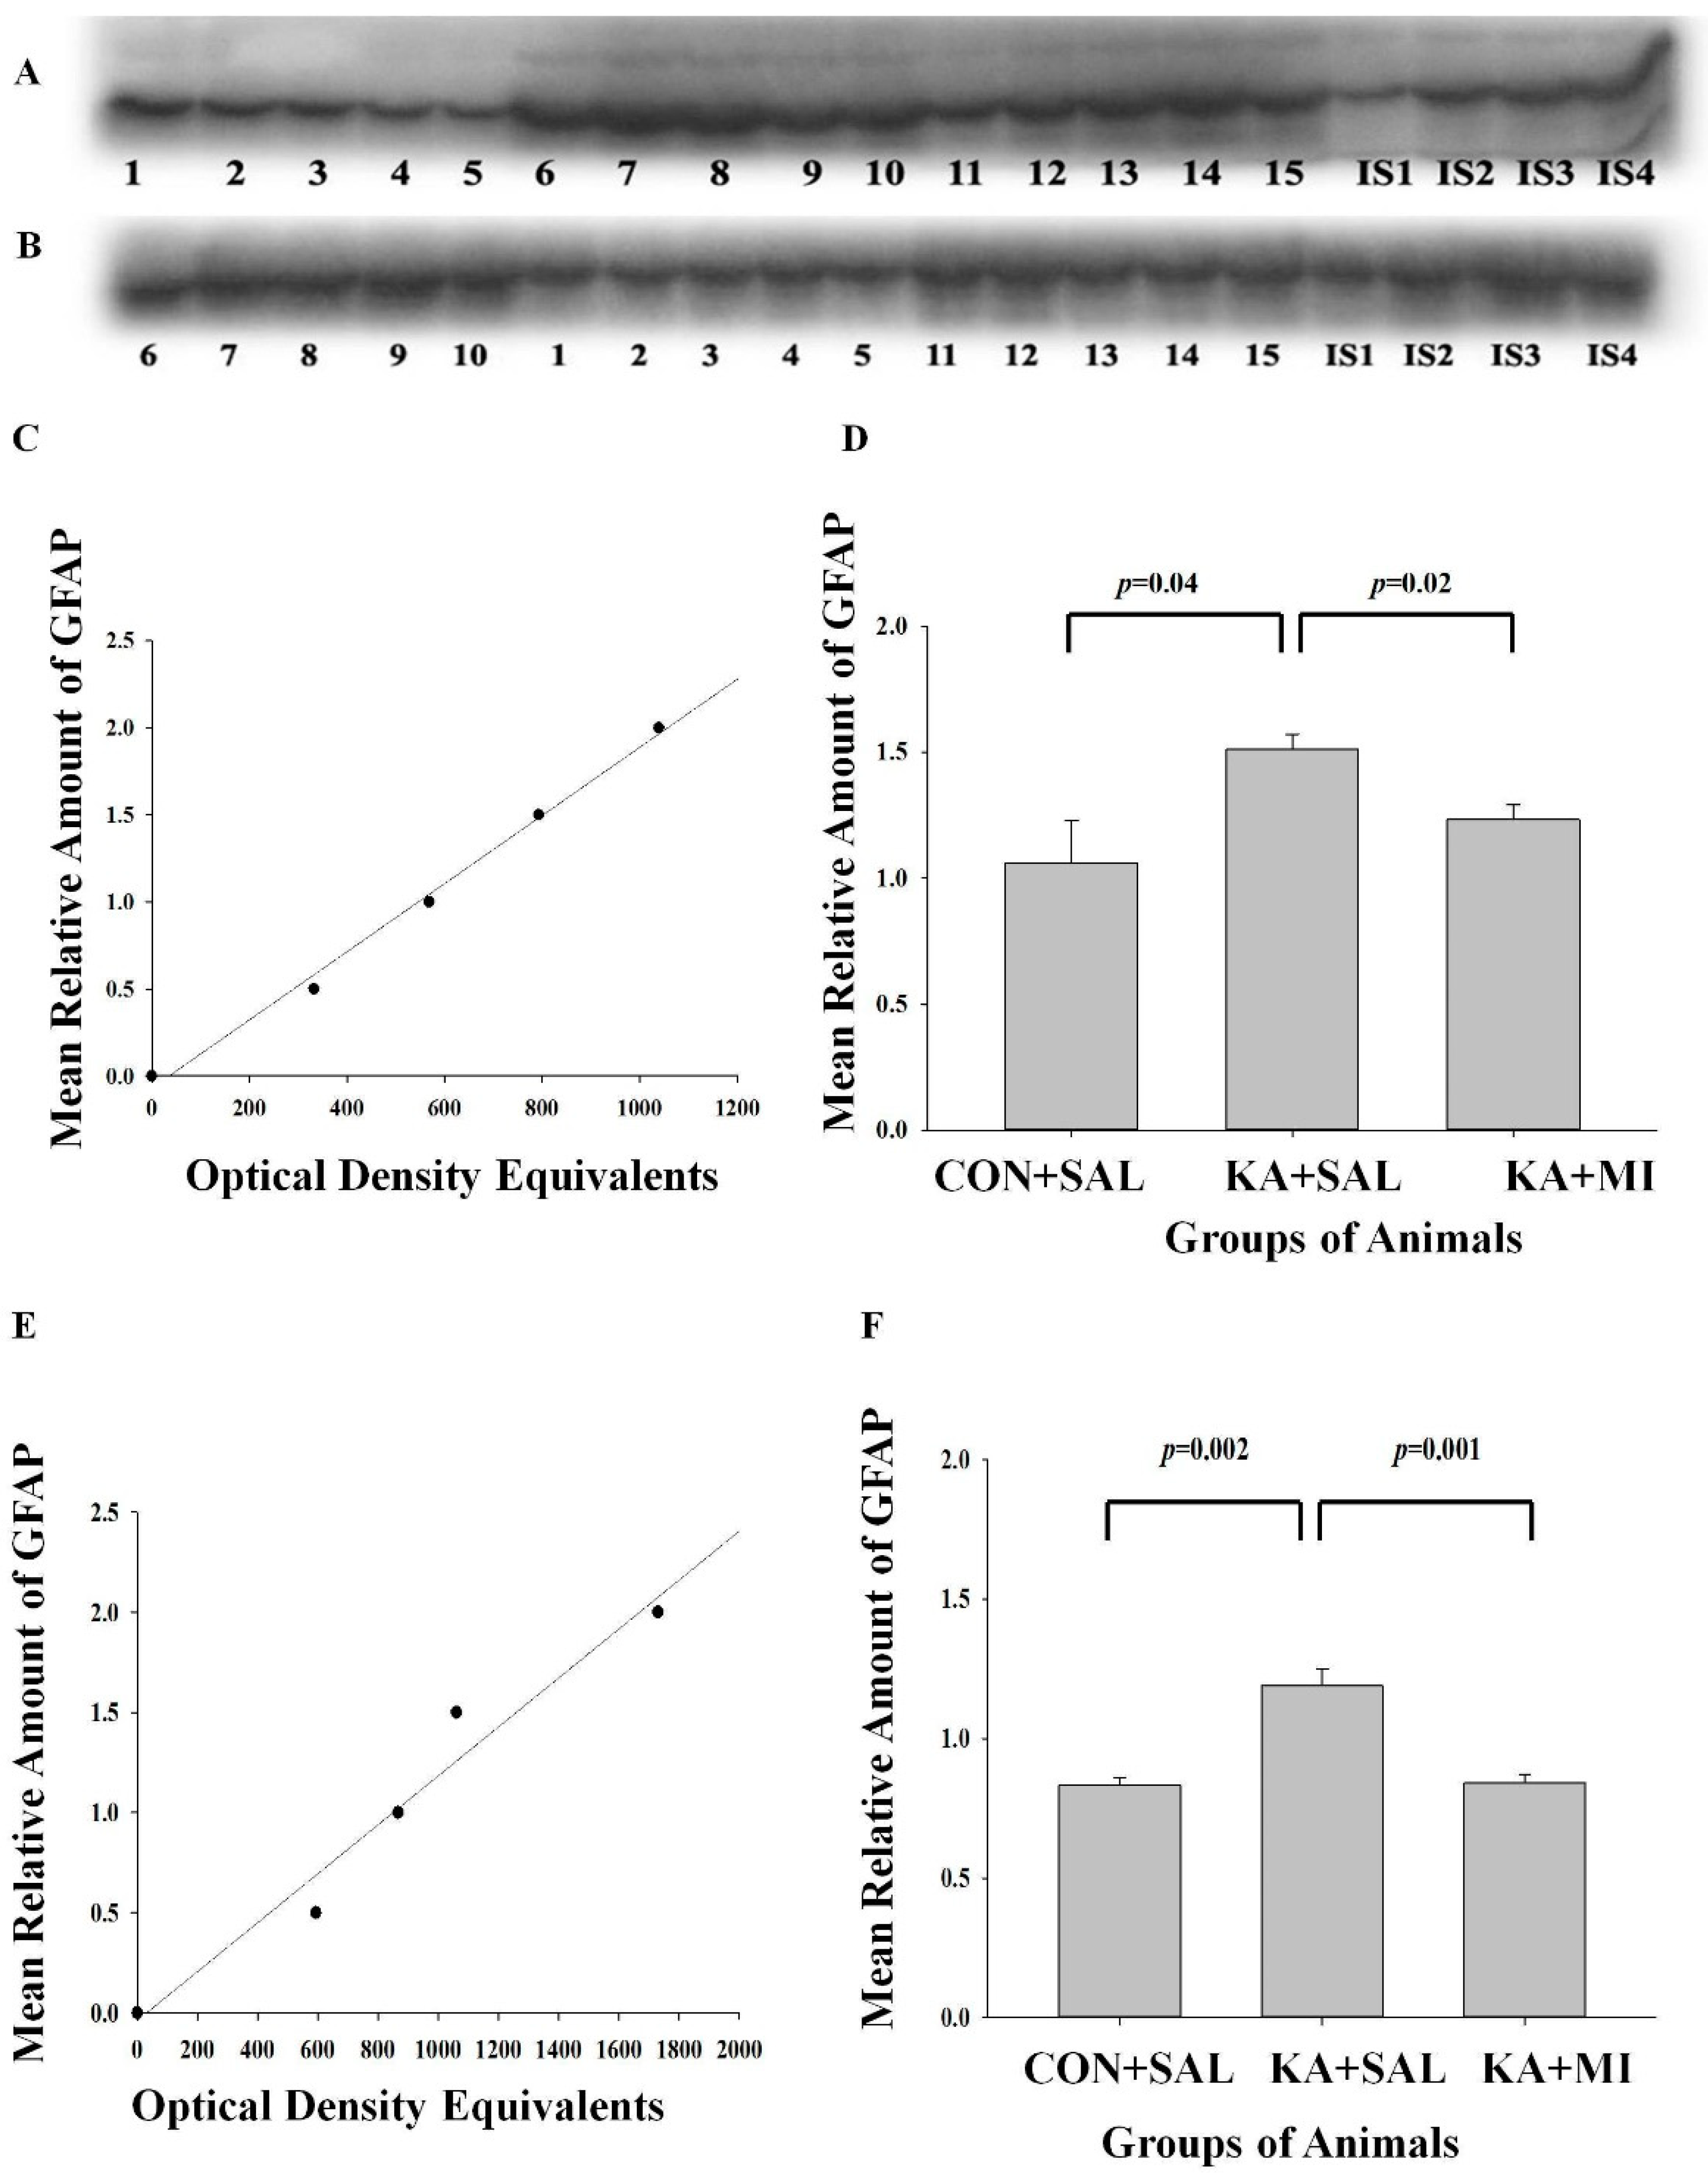
2.6.1. GFAP
Hippocampus
Neocortex
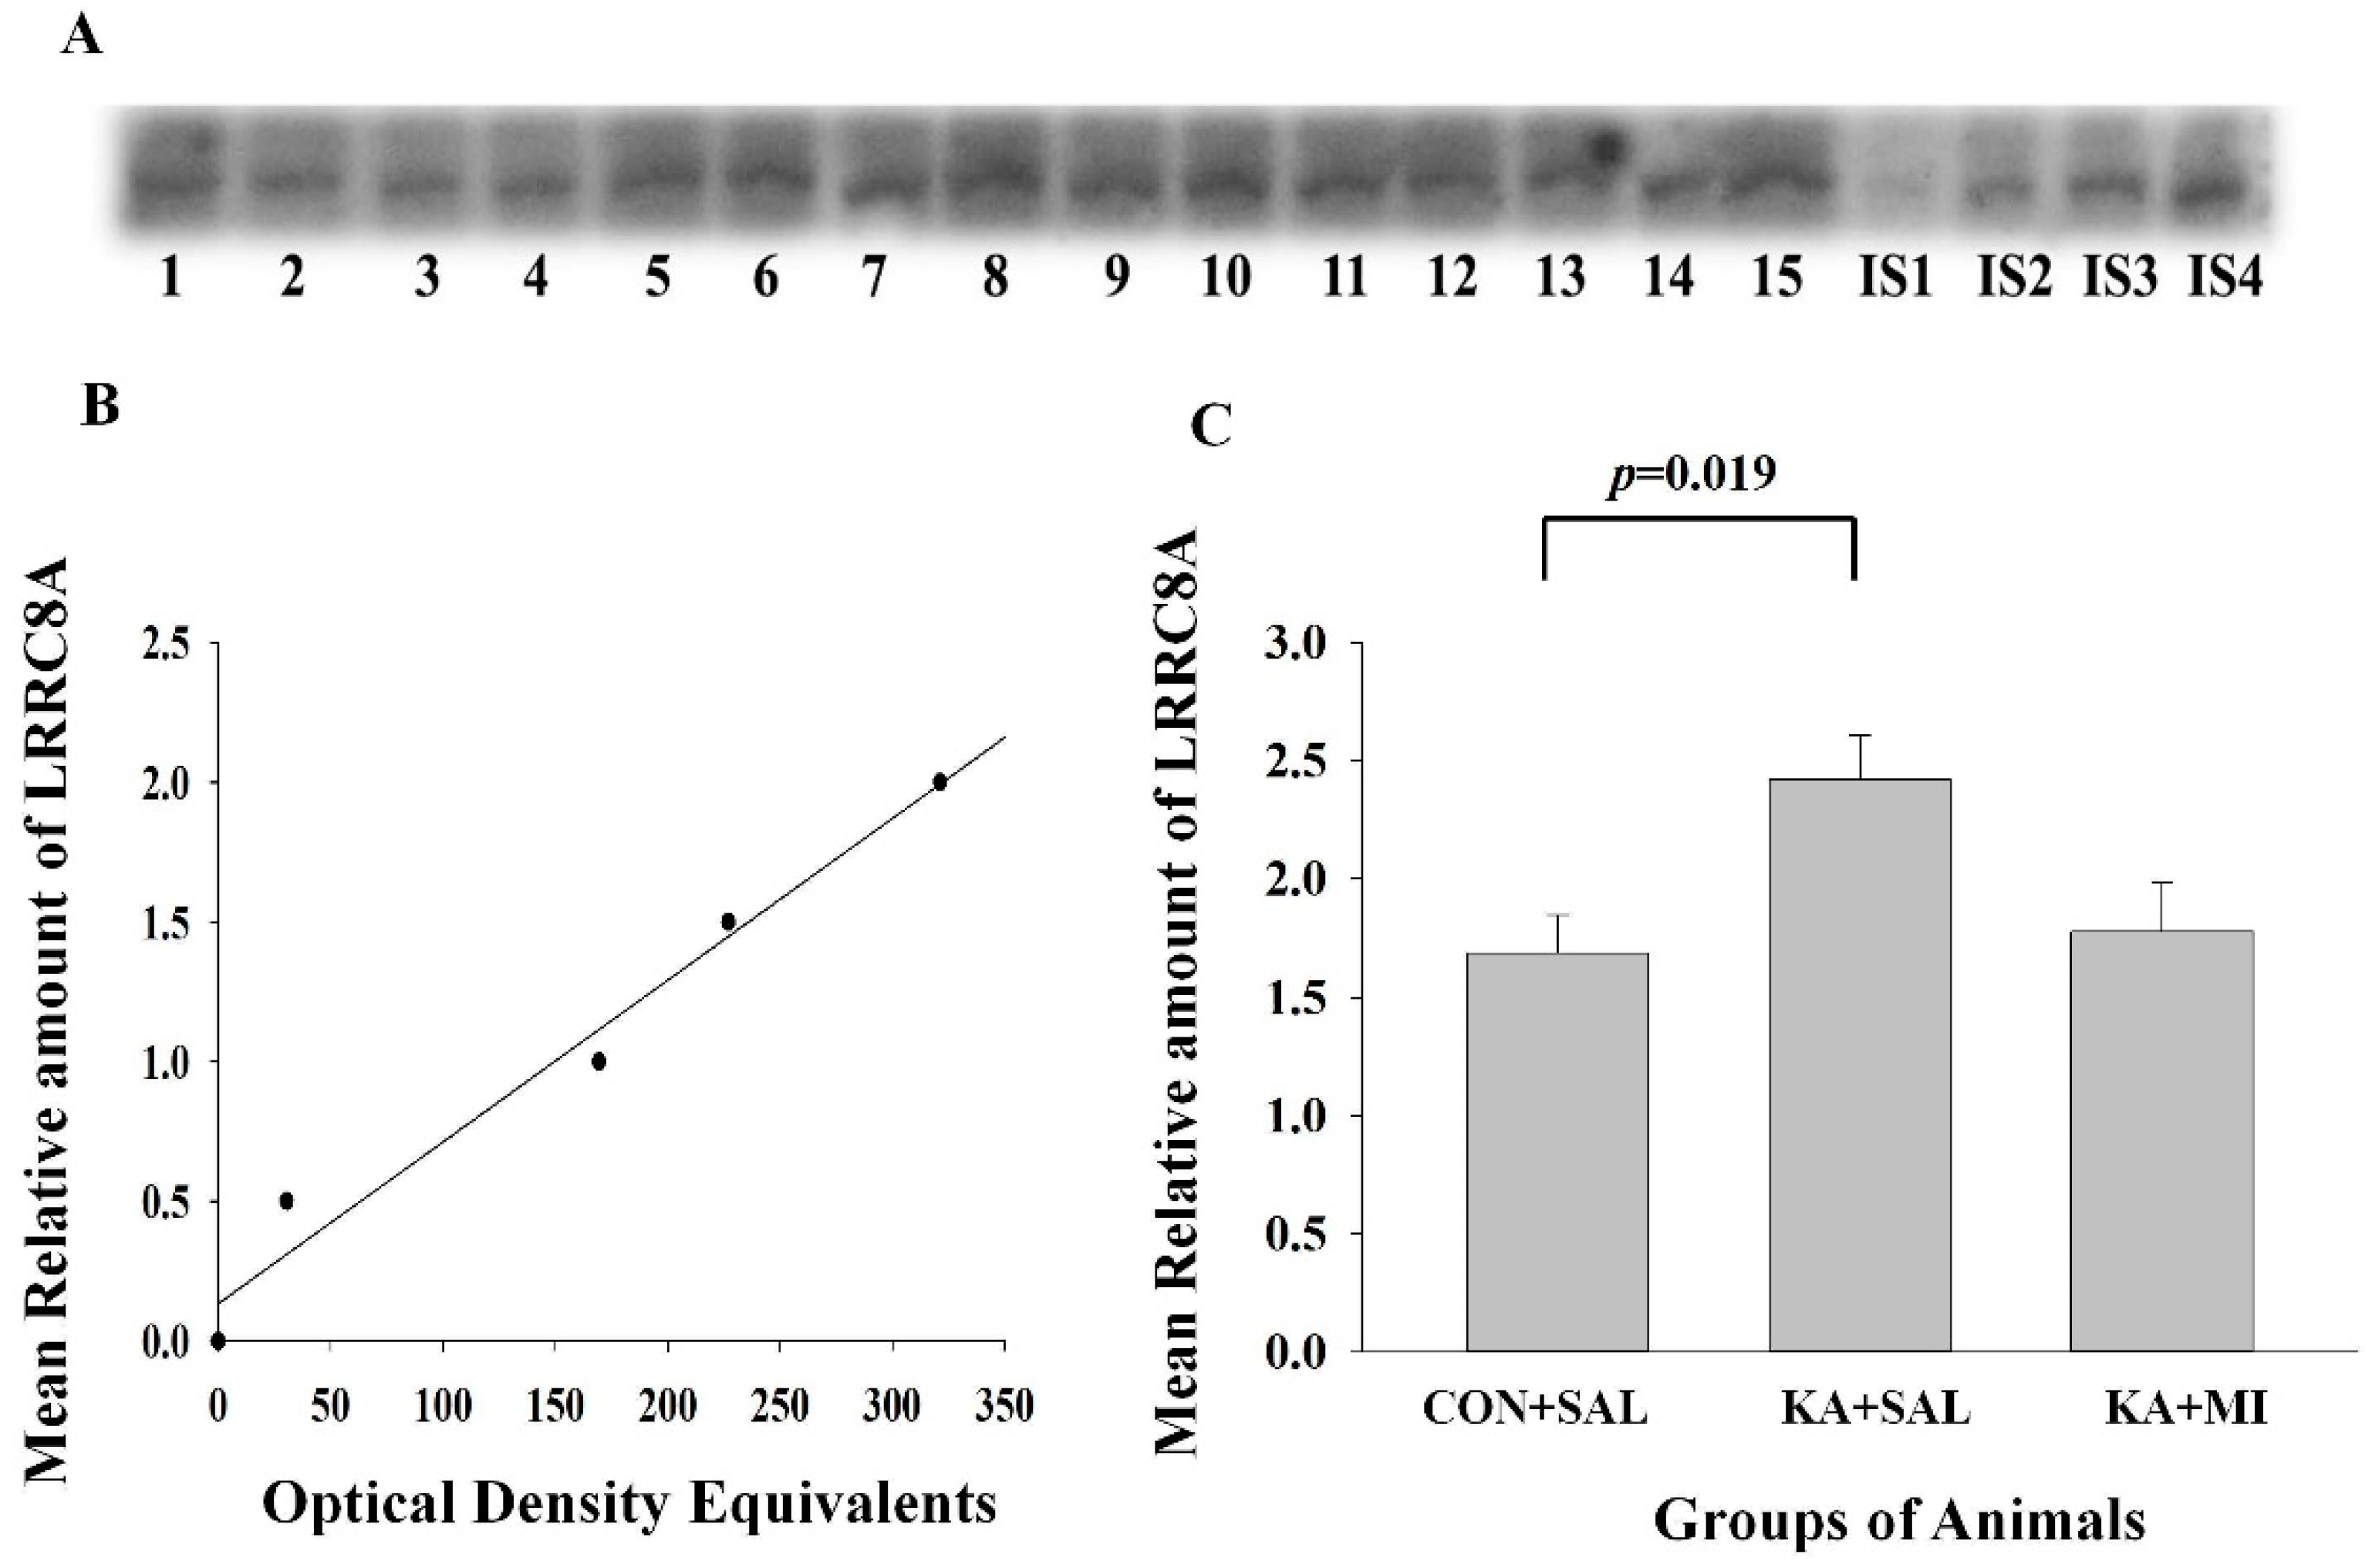
2.6.2. LRRC8A Subunit of VRAC
Hippocampus
Neocortex
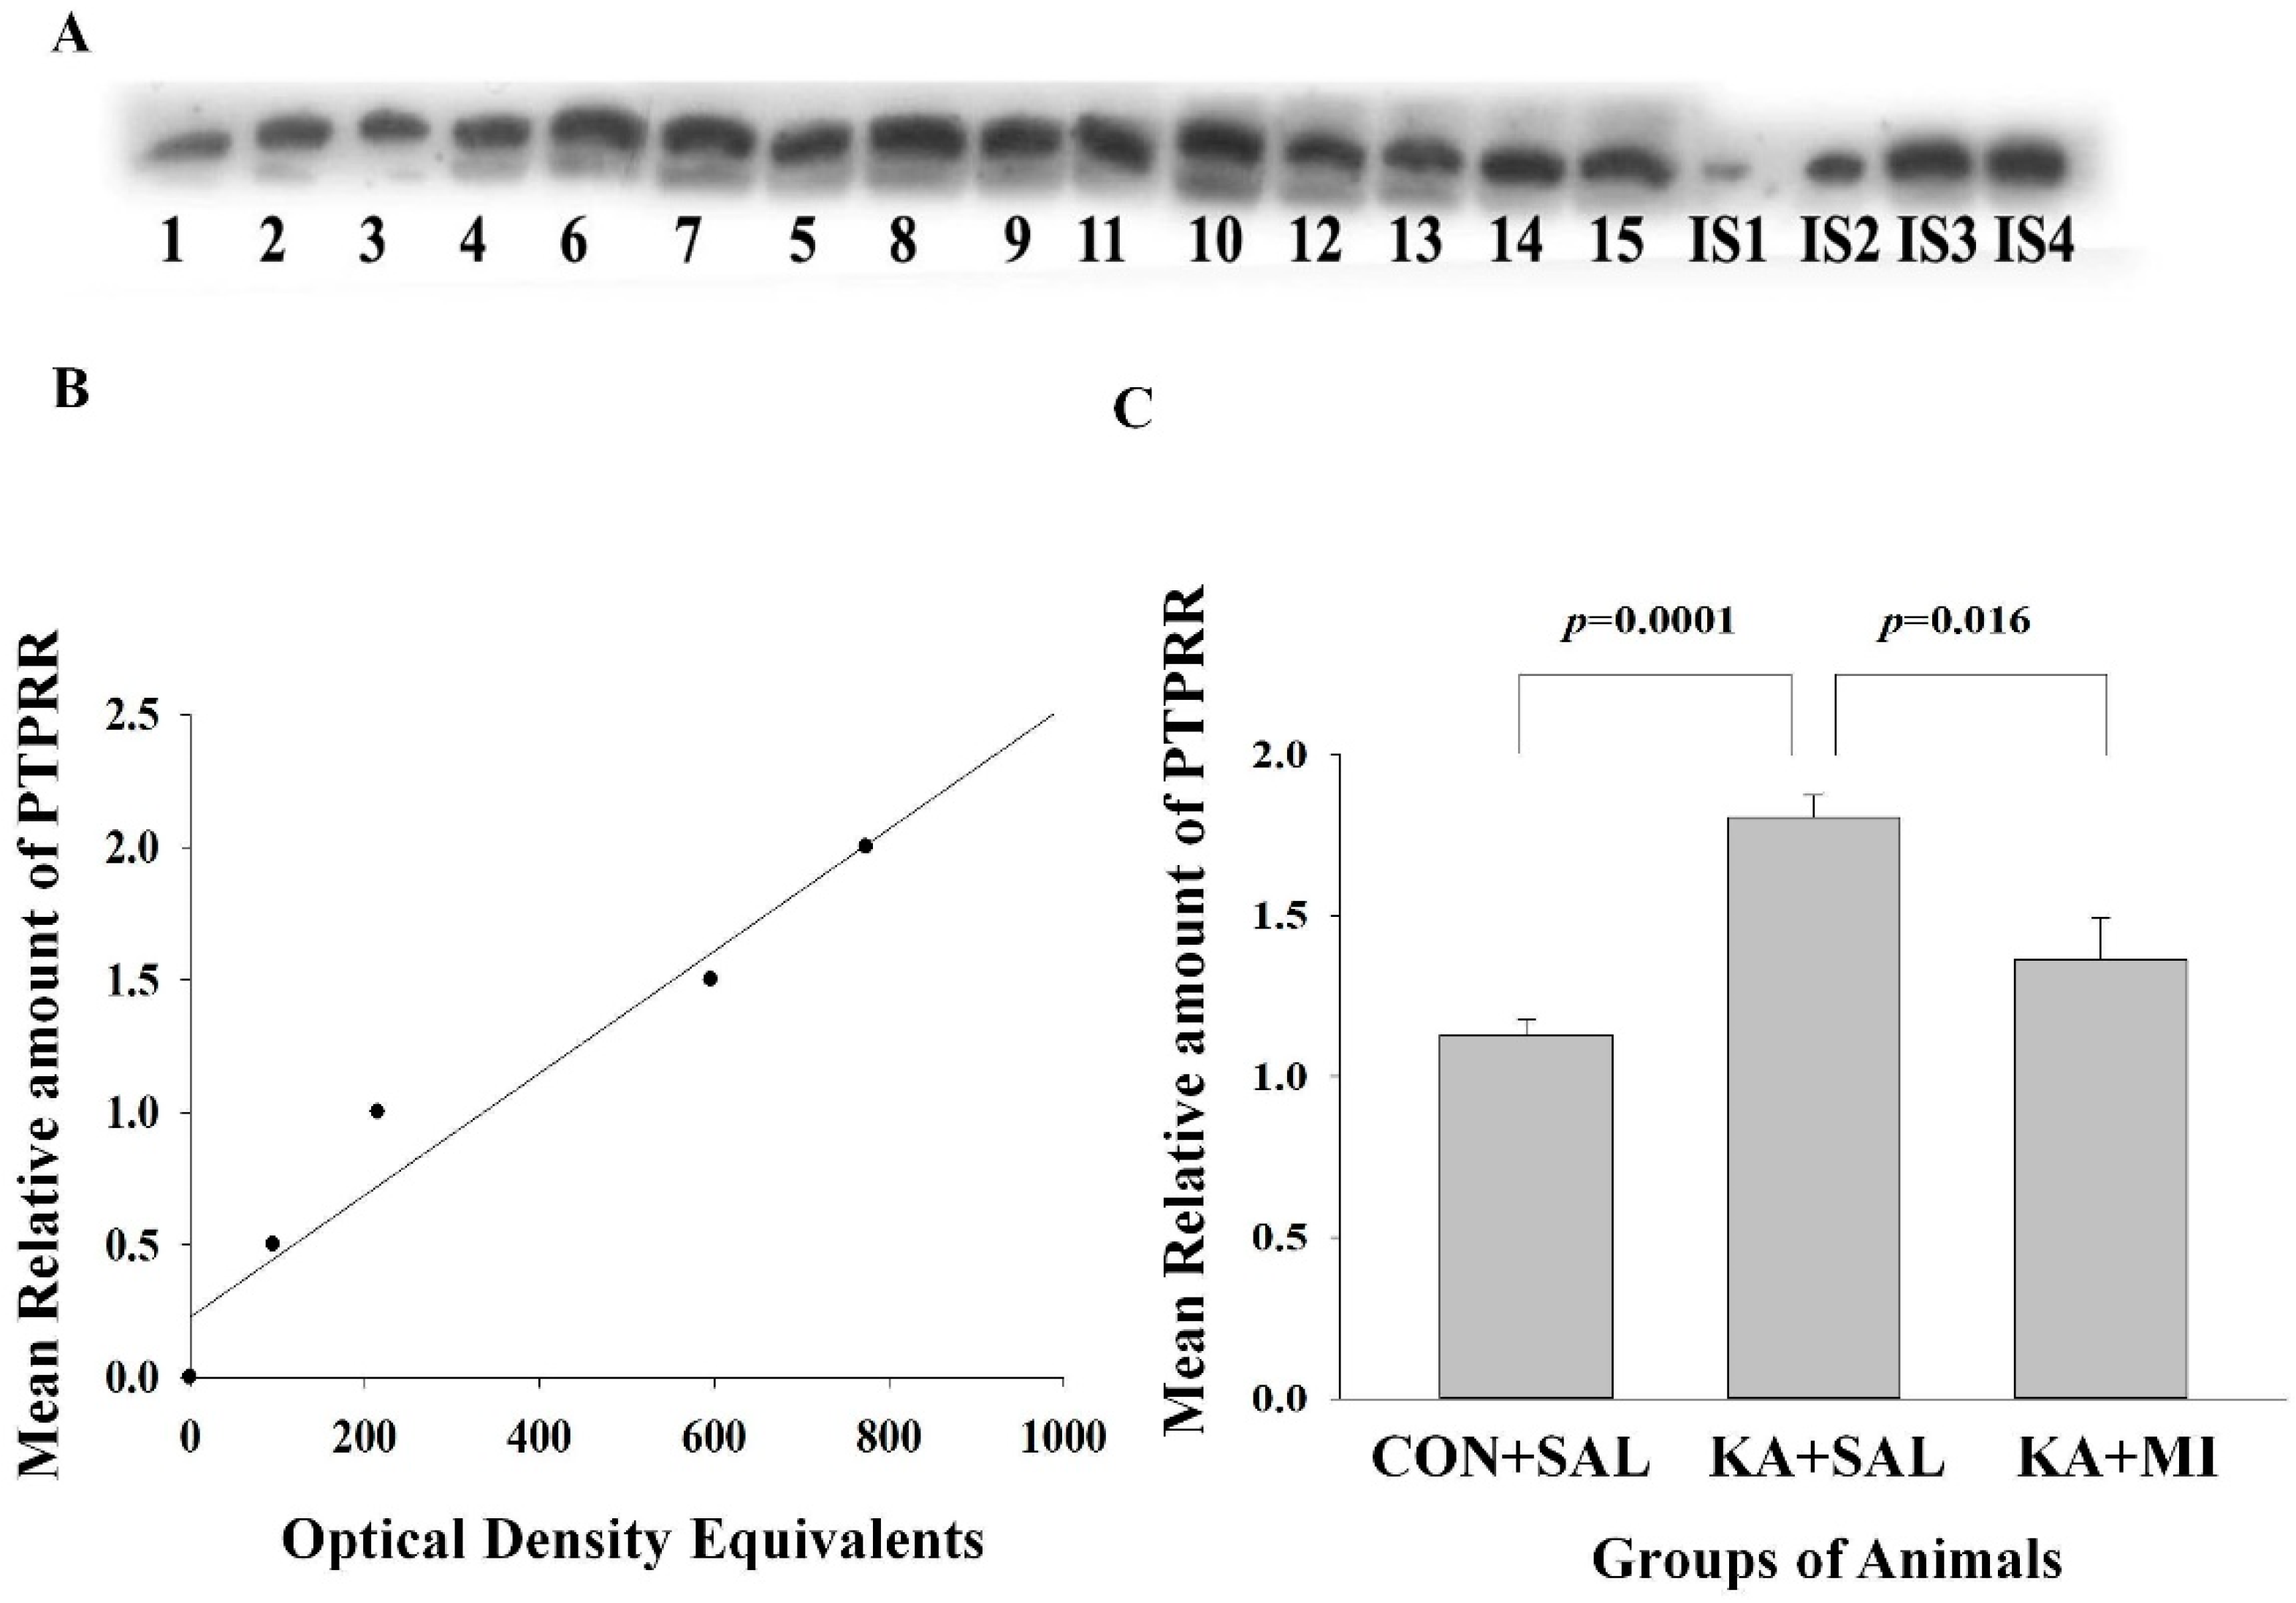
2.6.3. Protein Tyrosine Phosphatase Receptor Type R (PTPRR)
Hippocampus
Neocortex
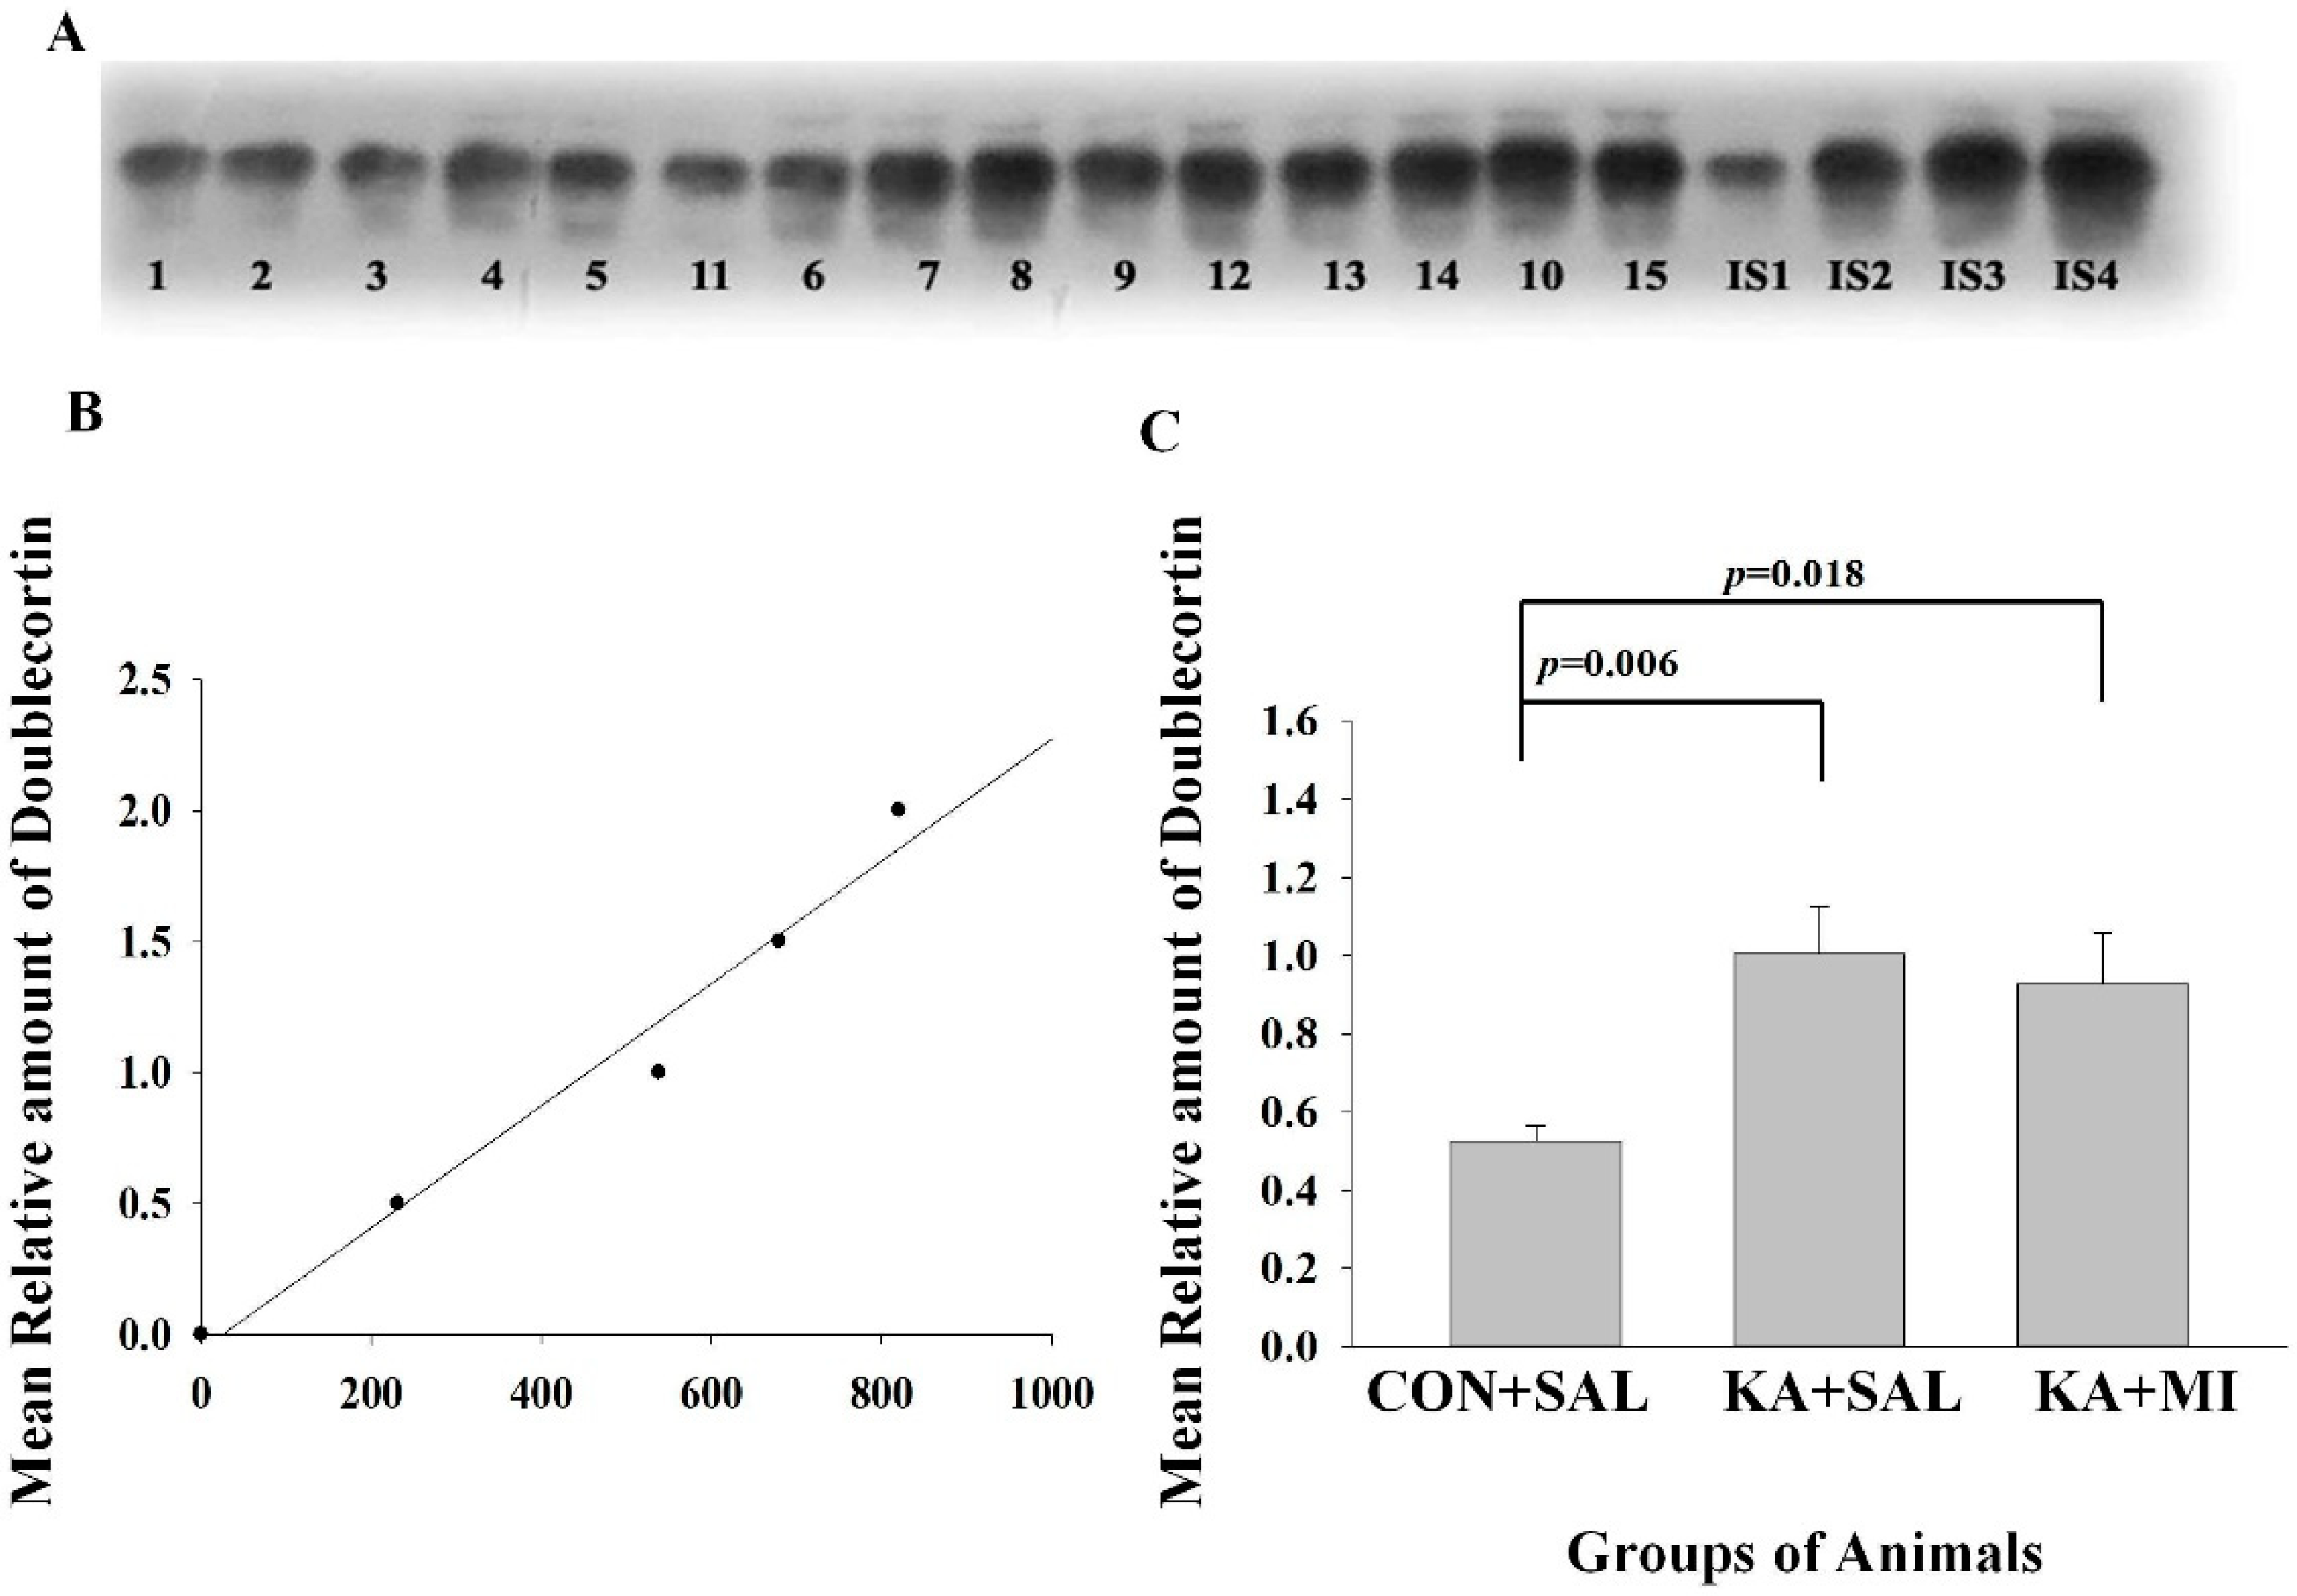
2.6.4. Doublecortin
3. Discussion
3.1. Electrophysiology
3.2. Learning and Memory
3.3. Morphology
3.4. Molecular Changes
3.4.1. GFAP
3.4.2. LRRC8A Subunit of VRAC
3.4.3. PTPRR
3.4.4. Doublecortin
3.5. Other Possible Mechanisms of MI-Induced Modulation of Epileptogenesis
3.5.1. Phosphoinositide Signaling Pathway
3.5.2. MI Action on GABAA Receptors
3.5.3. Limitations of the Study and Future Research Directions
4. Materials and Methods
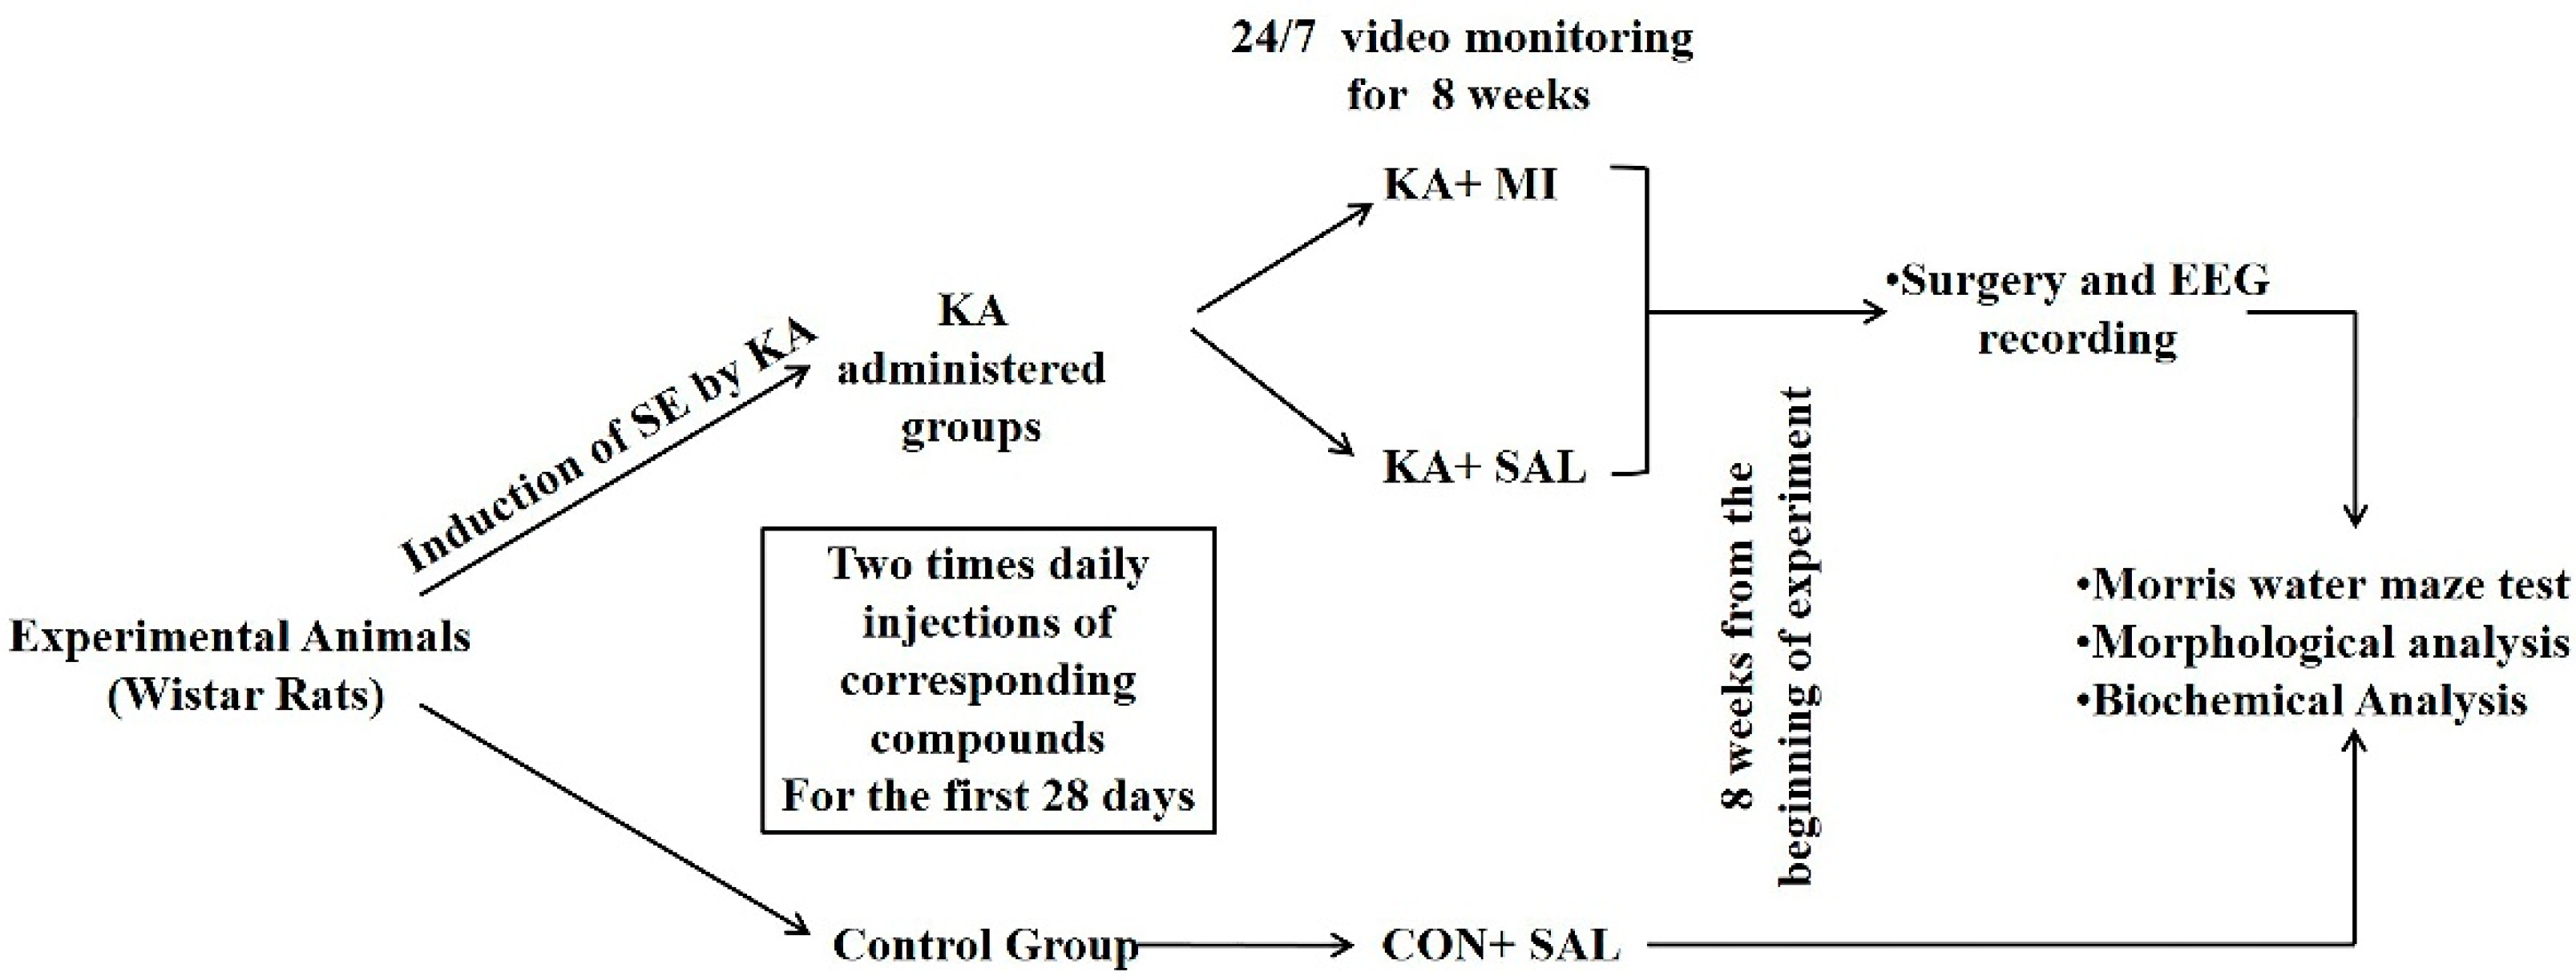
4.1. Animals
4.2. KA-Induced SE
4.3. Video-Monitoring
4.4. Surgery and EEG Recording
4.5. Morris Water Maze (MWM)
4.6. Cell Count
4.7. Electrophoresis and Immunoblotting
4.7.1. Subcellular Fractionation
4.7.2. Protein Determination
4.7.3. Electrophoresis and Western Immunoblotting
4.8. Statistical Methods
4.8.1. EEG Recording
4.8.2. Morris Water Maze
4.8.3. Cell Count
4.8.4. Protein Data
5. Conclusions
Supplementary Materials
Author Contributions
Funding
Institutional Review Board Statement
Informed Consent Statement
Data Availability Statement
Conflicts of Interest
References
- Pitkänen, A.; Lukasiuk, K.; Dudek, F.E.; Staley, K.J. Epileptogenesis. Cold Spring Harb. Perspect. Med. 2015, 5, a022822. [Google Scholar] [CrossRef] [PubMed] [Green Version]
- Fisher, R.S.; Acevedo, C.; Arzimanoglou, A.; Bogacz, A.; Cross, J.H.; Elger, C.E.; Engel, J.J.; Forsgren, L.; French, J.A.; Glynn, M.; et al. ILAE official report: A practical clinical definition of epilepsy. Epilepsia 2014, 55, 475–482. [Google Scholar] [CrossRef] [PubMed] [Green Version]
- Becker, A.J. Review: Animal models of acquired epilepsy: Insights into mechanisms of human epileptogenesis. Neuropathol. Appl. Neurobiol. 2018, 44, 112–129. [Google Scholar] [CrossRef] [PubMed]
- Loscher, W.; Brandt, C. Prevention or modification of epileptogenesis after brain insults: Experimental approaches and translational research. Pharmacol. Rev. 2010, 62, 668–700. [Google Scholar] [CrossRef] [PubMed] [Green Version]
- Sasa, M. A new frontier in epilepsy: Novel antiepileptogenic drugs. J. Pharmacol. Sci. 2006, 100, 487–494. [Google Scholar] [CrossRef] [Green Version]
- Patel, D.C.; Wilcox, K.S.; Metcalf, C.S. Novel Targets for Developing Antiseizure and, Potentially, Antiepileptogenic Drugs. Epilepsy Curr. 2017, 17, 293–298. [Google Scholar] [CrossRef] [Green Version]
- Solomonia, R.; Kuchiashvili, N.; Berulava, A.; Pkhakadze, V.; Trapaidze, N.; Zhvania, M.; Abesadze, I. Purification and identification of components of the Aquilegia vulgaris extract fraction exhibiting anti-epileptic activity. J. Biol. Phys. Chem. 2004, 4, 185–192. [Google Scholar]
- Sills, G.J.; Rogawski, M.A. Mechanisms of action of currently used antiseizure drugs. Neuropharmacology 2020, 168, 107966. [Google Scholar] [CrossRef]
- Fisher, S.K.; Novak, J.E.; Agranoff, B.W. Inositol and higher inositol phosphates in neural tissues: Homeostasis, metabolism and functional significance. J. Neurochem. 2002, 82, 736–754. [Google Scholar] [CrossRef]
- Solomonia, R.; Nozadze, M.; Kuchiashvili, N.; Bolkvadze, T.; Kiladze, M.; Zhvania, M.; Kigyradze, T.; Pkhakadze, V. Effect of myo-inositol on convulsions induced by pentylenetetrazole and kainic acid in rats. Bull. Exp. Biol. Med. 2007, 143, 58–60. [Google Scholar] [CrossRef] [Green Version]
- Kotaria, N.; Kiladze, M.; Zhvania, M.G.; Japaridze, N.J.; Bikashvili, T.; Solomonia, R.O.; Bolkvadze, T. The protective effect of myo-inositol on hippocamal cell loss and structural alterations in neurons and synapses triggered by kainic acid-induced status epilepticus. Cell. Mol. Neurobiol. 2013, 33, 659–671. [Google Scholar] [CrossRef] [PubMed]
- Nozadze, M.; Mikautadze, E.; Lepsveridze, E.; Mikeladze, E.; Kuchiashvili, N.; Kiguradze, T.; Kikvidze, M.; Solomonia, R. Anticonvulsant activities of myo-inositol and scyllo-inositol on pentylenetetrazol induced seizures. Seizure 2011, 20, 173–176. [Google Scholar] [CrossRef] [PubMed] [Green Version]
- Gamkrelidze, G.N.; Nanobashvili, Z.I.; Bilanishvili, I.G.; Lordkipanidze, T.; Kandashvili, M.; Kokaia, M.; Solomonia, R.O. Concentration- and time-dependent effects of myo-inositol on evoked epileptic afterdischarge in the hippocampus in vivo. Neuroreport 2019, 30, 1129–1134. [Google Scholar] [CrossRef]
- Solomonia, R.; Mikautadze, E.; Nozadze, M.; Kuchiashvili, N.; Lepsveridze, E.; Kiguradze, T. Myo-inositol treatment prevents biochemical changes triggered by kainate-induced status epilepticus. Neurosci. Lett. 2010, 468, 277–281. [Google Scholar] [CrossRef]
- Solomonia, R.; Gogichaishvili, N.; Nozadze, M.; Lepsveridze, E.; Dzneladze, D.; Kiguradze, T. Myo-inositol treatment and GABA-A receptor subunit changes after kainate-induced status epilepticus. Cell. Mol. Neurobiol. 2013, 33, 119–127. [Google Scholar] [CrossRef] [PubMed]
- Tsverava, L.; Kandashvili, M.; Margvelani, G.; Lortkipanidze, T.; Gamkrelidze, G.; Lepsveridze, E.; Kokaia, M.; Solomonia, R. Long-Term Effects of Myoinositol on Behavioural Seizures and Biochemical Changes Evoked by Kainic Acid Induced Epileptogenesis. Biomed Res. Int. 2019, 2019, 4518160. [Google Scholar] [CrossRef] [PubMed] [Green Version]
- Frye, C.A.; Walf, A. Progesterone, administered before kainic acid, prevents decrements in cognitive performance in the Morris Water Maze. Dev. Neurobiol. 2011, 71, 142–152. [Google Scholar] [CrossRef] [Green Version]
- Rao, M.S.; Abd-El-Basset, E.M. dBcAMP Rescues the Neurons From Degeneration in Kainic Acid-Injured Hippocampus, Enhances Neurogenesis, Learning, and Memory. Front. Behav. Neurosci. 2020, 14, 18. [Google Scholar] [CrossRef] [Green Version]
- Tsverava, L.; Lordkipanidze, T.; Lepsveridze, E.; Nozadze, M.; Kikvidze, M.; Solomonia, R. Myoinositol Attenuates the Cell Loss and Biochemical Changes Induced by Kainic Acid Status Epilepticus. Biomed Res. Int. 2016, 2016, 2794096. [Google Scholar] [CrossRef] [Green Version]
- Brenner, M. Role of GFAP in CNS injuries. Neurosci. Lett. 2014, 565, 7–13. [Google Scholar] [CrossRef] [Green Version]
- Seifert, G.; Carmignoto, G.; Steinhäuser, C. Astrocyte dysfunction in epilepsy. Brain Res. Rev. 2010, 63, 212–221. [Google Scholar] [CrossRef] [PubMed]
- Buccitelli, C.; Selbach, M. mRNAs, proteins and the emerging principles of gene expression control. Nat. Rev. Genet. 2020, 21, 630–644. [Google Scholar] [CrossRef]
- Erkens, M.; Tanaka-Yamamoto, K.; Cheron, G.; Márquez-Ruiz, J.; Prigogine, C.; Schepens, J.T.; Nadif Kasri, N.; Augustine, G.J.; Hendriks, W.J. Protein tyrosine phosphatase receptor type R is required for Purkinje cell responsiveness in cerebellar long-term depression. Mol. Brain 2015, 8, 1. [Google Scholar] [CrossRef] [PubMed] [Green Version]
- Nateri, A.S.; Raivich, G.; Gebhardt, C.; Da Costa, C.; Naumann, H.; Vreugdenhil, M.; Makwana, M.; Brandner, S.; Adams, R.H.; Jefferys, J.G.R.; et al. ERK activation causes epilepsy by stimulating NMDA receptor activity. EMBO J. 2007, 26, 4891–4901. [Google Scholar] [CrossRef] [PubMed]
- Ma, T.; Wu, Y.; Chen, B.; Zhang, W.; Jin, L.; Shen, C.; Wang, Y.; Liu, Y. D-Serine Contributes to Seizure Development via ERK Signaling. Front. Neurosci. 2019, 13, 254. [Google Scholar] [CrossRef] [PubMed] [Green Version]
- Curia, G.; Gualtieri, F.; Bartolomeo, R.; Vezzali, R.; Biagini, G. Resilience to audiogenic seizures is associated with p-ERK1/2 dephosphorylation in the subiculum of Fmr1 knockout mice. Front. Cell. Neurosci. 2013, 7, 46. [Google Scholar] [CrossRef] [Green Version]
- Jafari, R.M.; Ghahremani, M.H.; Rahimi, N.; Shadboorestan, A.; Rashidian, A.; Esmaeili, J.; Mehr, S.E.; Dehpour, A.R. The anticonvulsant activity and cerebral protection of chronic lithium chloride via NMDA receptor/nitric oxide and phospho-ERK. Brain Res. Bull. 2018, 137, 1–9. [Google Scholar] [CrossRef] [PubMed]
- Jessberger, S.; Römer, B.; Babu, H.; Kempermann, G. Seizures induce proliferation and dispersion of doublecortin-positive hippocampal progenitor cells. Exp. Neurol. 2005, 196, 342–351. [Google Scholar] [CrossRef]
- Levesque, M.; Avoli, M. The kainic acid model of temporal lobe epilepsy. Neurosci. Biobehav. Rev. 2013, 37, 2887–2899. [Google Scholar] [CrossRef] [Green Version]
- Dudek, F.E.; Staley, K.J. The Time Course and Circuit Mechanisms of Acquired Epileptogenesis. In Jasper’s Basic Mechanisms of the Epilepsies, 4th ed.; Noebels, J.L., Avoli, M., Rogawski, M.A., Olsen, R.W., Delgado-Escueta, A.V., Eds.; Oxford University Press: Oxford, UK, 2012. [Google Scholar]
- Salami, P.; Lévesque, M.; Benini, R.; Behr, C.; Gotman, J.; Avoli, M. Dynamics of interictal spikes and high-frequency oscillations during epileptogenesis in temporal lobe epilepsy. Neurobiol. Dis. 2014, 67, 97–106. [Google Scholar] [CrossRef] [Green Version]
- De Curtis, M.; Avanzini, G. Interictal spikes in focal epileptogenesis. Prog. Neurobiol. 2001, 63, 541–567. [Google Scholar] [CrossRef]
- Wang, S.; Jin, B.; Yang, L.; Chen, C.; Ding, Y.; Guo, Y.; Wang, Z.; Ming, W.; Tang, Y.; Wang, S.; et al. Clinical value and predictors of subclinical seizures in patients with temporal lobe epilepsy undergoing scalp video-EEG monitoring. J. Clin. Neurosci. Off. J. Neurosurg. Soc. Australas. 2017, 44, 214–217. [Google Scholar] [CrossRef]
- McCormick, D.A.; Contreras, D. On the cellular and network bases of epileptic seizures. Annu. Rev. Physiol. 2001, 63, 815–846. [Google Scholar] [CrossRef] [PubMed]
- Bertram, E.H.; Zhang, D.; Williamson, J.M. Multiple roles of midline dorsal thalamic nuclei in induction and spread of limbic seizures. Epilepsia 2008, 49, 256–268. [Google Scholar] [CrossRef]
- Moser, E.I.; Moser, M.-B.; McNaughton, B.L. Spatial representation in the hippocampal formation: A history. Nat. Neurosci. 2017, 20, 1448–1464. [Google Scholar] [CrossRef]
- Sofroniew, M.V. Astrogliosis. Cold Spring Harb. Perspect. Biol. 2014, 7, a020420. [Google Scholar] [CrossRef] [PubMed] [Green Version]
- Pernot, F.; Heinrich, C.; Barbier, L.; Peinnequin, A.; Carpentier, P.; Dhote, F.; Baille, V.; Beaup, C.; Depaulis, A.; Dorandeu, F. Inflammatory changes during epileptogenesis and spontaneous seizures in a mouse model of mesiotemporal lobe epilepsy. Epilepsia 2011, 52, 2315–2325. [Google Scholar] [CrossRef] [PubMed]
- Takahashi, D.K.; Vargas, J.R.; Wilcox, K.S. Increased coupling and altered glutamate transport currents in astrocytes following kainic-acid-induced status epilepticus. Neurobiol. Dis. 2010, 40, 573–585. [Google Scholar] [CrossRef] [PubMed] [Green Version]
- Stringer, J.L. Repeated seizures increase GFAP and vimentin in the hippocampus. Brain Res. 1996, 717, 147–153. [Google Scholar] [CrossRef]
- Jentsch, T.J. VRACs and other ion channels and transporters in the regulation of cell volume and beyond. Nat. Rev. Mol. Cell Biol. 2016, 17, 293–307. [Google Scholar] [CrossRef]
- Murphy, T.R.; Binder, D.K.; Fiacco, T.A. Turning down the volume: Astrocyte volume change in the generation and termination of epileptic seizures. Neurobiol. Dis. 2017, 104, 24–32. [Google Scholar] [CrossRef] [PubMed]
- Dietzel, I.; Heinemann, U.; Hofmeier, G.; Lux, H.D. Stimulus-induced changes in extracellular Na+ and Cl- concentration in relation to changes in the size of the extracellular space. Exp. Brain Res. 1982, 46, 73–84. [Google Scholar] [CrossRef] [PubMed]
- Rothman, S.M. The neurotoxicity of excitatory amino acids is produced by passive chloride influx. J. Neurosci. 1985, 5, 1483–1489. [Google Scholar] [CrossRef] [PubMed]
- Dudek, F.E.; Obenaus, A.; Tasker, J.G. Osmolality-induced changes in extracellular volume alter epileptiform bursts independent of chemical synapses in the rat: Importance of non-synaptic mechanisms in hippocampal epileptogenesis. Neurosci. Lett. 1990, 120, 267–270. [Google Scholar] [CrossRef]
- Schwartzkroin, P.A.; Baraban, S.C.; Hochman, D.W. Osmolarity, ionic flux, and changes in brain excitability. Epilepsy Res. 1998, 32, 275–285. [Google Scholar] [CrossRef]
- Arranz, A.M.; Perkins, K.L.; Irie, F.; Lewis, D.P.; Hrabe, J.; Xiao, F.; Itano, N.; Kimata, K.; Hrabetova, S.; Yamaguchi, Y. Hyaluronan deficiency due to Has3 knock-out causes altered neuronal activity and seizures via reduction in brain extracellular space. J. Neurosci. 2014, 34, 6164–6176. [Google Scholar] [CrossRef] [Green Version]
- Davis, S.; Laroche, S. Mitogen-activated protein kinase/extracellular regulated kinase signalling and memory stabilization: A review. Genes. Brain. Behav. 2006, 5 (Suppl. 2), 61–72. [Google Scholar] [CrossRef]
- Jessberger, S.; Parent, J.M. Epilepsy and Adult Neurogenesis. Cold Spring Harb. Perspect. Biol. 2015, 7, a020677. [Google Scholar] [CrossRef] [Green Version]
- Pun, R.Y.K.; Rolle, I.J.; Lasarge, C.L.; Hosford, B.E.; Rosen, J.M.; Uhl, J.D.; Schmeltzer, S.N.; Faulkner, C.; Bronson, S.L.; Murphy, B.L.; et al. Excessive activation of mTOR in postnatally generated granule cells is sufficient to cause epilepsy. Neuron 2012, 75, 1022–1034. [Google Scholar] [CrossRef] [PubMed] [Green Version]
- Jakubs, K.; Nanobashvili, A.; Bonde, S.; Ekdahl, C.T.; Kokaia, Z.; Kokaia, M.; Lindvall, O. Environment matters: Synaptic properties of neurons born in the epileptic adult brain develop to reduce excitability. Neuron 2006, 52, 1047–1059. [Google Scholar] [CrossRef] [Green Version]
- Dai, G.; Yu, H.; Kruse, M.; Traynor-Kaplan, A.; Hille, B. Osmoregulatory inositol transporter SMIT1 modulates electrical activity by adjusting PI(4,5)P2 levels. Proc. Natl. Acad. Sci. USA 2016, 113, E3290–E3299. [Google Scholar] [CrossRef] [PubMed] [Green Version]
- Neverisky, D.L.; Abbott, G.W. KCNQ-SMIT complex formation facilitates ion channel-solute transporter cross talk. FASEB J. Off. Publ. Fed. Am. Soc. Exp. Biol. 2017, 31, 2828–2838. [Google Scholar] [CrossRef] [PubMed] [Green Version]
- Bortolatto, C.F.; Jesse, C.R.; Wilhelm, E.A.; Ribeiro, L.R.; Rambo, L.M.; Royes, L.F.F.; Roman, S.S.; Nogueira, C.W. Protective effect of 2,2′-dithienyl diselenide on kainic acid-induced neurotoxicity in rat hippocampus. Neuroscience 2011, 193, 300–309. [Google Scholar] [CrossRef] [PubMed]
- Racine, R.J. Modification of seizure activity by electrical stimulation. II. Motor seizure. Electroencephalogr. Clin. Neurophysiol. 1972, 32, 281–294. [Google Scholar] [CrossRef]
- Clement, A.B.; Hawkins, E.G.; Lichtman, A.H.; Cravatt, B.F. Increased seizure susceptibility and proconvulsant activity of anandamide in mice lacking fatty acid amide hydrolase. J. Neurosci. 2003, 23, 3916–3923. [Google Scholar] [CrossRef] [PubMed]
- Loscher, W.; Brandt, C. High seizure frequency prior to antiepileptic treatment is a predictor of pharmacoresistant epilepsy in a rat model of temporal lobe epilepsy. Epilepsia 2010, 51, 89–97. [Google Scholar] [CrossRef]
- Paxinos, G.; Watson, C. The Rat Brain in Stereotaxic Coordinates; Academic Press: San Diego, CA, USA, 1998. [Google Scholar]
- Li, R.; Shen, Y. An old method facing a new challenge: Re-visiting housekeeping proteins as internal reference control for neuroscience research. Life Sci. 2013, 92, 747–751. [Google Scholar] [CrossRef] [Green Version]
- Ghosh, R.; Gilda, J.E.; Gomes, A. V The necessity of and strategies for improving confidence in the accuracy of western blots. Expert Rev. Proteom. 2014, 11, 549–560. [Google Scholar] [CrossRef] [Green Version]


Publisher’s Note: MDPI stays neutral with regard to jurisdictional claims in published maps and institutional affiliations. |
© 2022 by the authors. Licensee MDPI, Basel, Switzerland. This article is an open access article distributed under the terms and conditions of the Creative Commons Attribution (CC BY) license (https://creativecommons.org/licenses/by/4.0/).
Share and Cite
Kandashvili, M.; Gamkrelidze, G.; Tsverava, L.; Lordkipanidze, T.; Lepsveridze, E.; Lagani, V.; Burjanadze, M.; Dashniani, M.; Kokaia, M.; Solomonia, R. Myo-Inositol Limits Kainic Acid-Induced Epileptogenesis in Rats. Int. J. Mol. Sci. 2022, 23, 1198. https://doi.org/10.3390/ijms23031198
Kandashvili M, Gamkrelidze G, Tsverava L, Lordkipanidze T, Lepsveridze E, Lagani V, Burjanadze M, Dashniani M, Kokaia M, Solomonia R. Myo-Inositol Limits Kainic Acid-Induced Epileptogenesis in Rats. International Journal of Molecular Sciences. 2022; 23(3):1198. https://doi.org/10.3390/ijms23031198
Chicago/Turabian StyleKandashvili, Manana, Georgi Gamkrelidze, Lia Tsverava, Tamar Lordkipanidze, Eka Lepsveridze, Vincenzo Lagani, Maia Burjanadze, Manana Dashniani, Merab Kokaia, and Revaz Solomonia. 2022. "Myo-Inositol Limits Kainic Acid-Induced Epileptogenesis in Rats" International Journal of Molecular Sciences 23, no. 3: 1198. https://doi.org/10.3390/ijms23031198
APA StyleKandashvili, M., Gamkrelidze, G., Tsverava, L., Lordkipanidze, T., Lepsveridze, E., Lagani, V., Burjanadze, M., Dashniani, M., Kokaia, M., & Solomonia, R. (2022). Myo-Inositol Limits Kainic Acid-Induced Epileptogenesis in Rats. International Journal of Molecular Sciences, 23(3), 1198. https://doi.org/10.3390/ijms23031198