Abstract
A deficiency of vitamin A (VAD) and iron is the most common nutritional problem affecting people worldwide. Given the scale of the problem, the interactions between vitamin A and iron levels are widely studied. However, the exact mechanism of the impact of vitamin A on the regulation of iron metabolism remains unclear. An extremely significant issue becomes a better understanding of the nature of the studied biological phenomenon, which is possible by using a systems approach through developing and analyzing a mathematical model based on a Petri net. To study the considered system, the t-cluster analysis, the significance analysis, and the analysis of the average number of transition firings were performed. The used analyses have allowed distinguishing the most important mechanisms (both subprocesses and elementary processes) positively and negatively regulating an expression of hepcidin and allowed to distinguish elementary processes with a higher frequency of occurrence compared to others. The analysis also allowed to resolve doubts about the discrepancy in literature reports, where VAD leads to positive regulation of hepcidin expression or to negative regulation of hepcidin expression. The more detailed analyses have shown that VAD more frequently positively stimulates hepcidin expression and this mechanism is more significant than the mechanism inhibiting hepcidin expression indirectly by VAD.
1. Introduction
1.1. Research Context
Considerations regarding the role of vitamin A deficiency (VAD) in the regulation of hepcidin expression and, consequently, VAD effect on iron metabolism were (and still are) undertaken by many researchers [1,2,3,4,5,6]. The first literature reports on the relationship between vitamin A deficiency and low iron levels come from studies conducted in the 1920s [7,8,9]. Additionally, vitamin A and iron deficiencies are the most common nutrient deficiencies affecting millions of people around the world [1,3,5,6]. However, the mechanism of vitamin A influence on iron homeostasis was not fully understood [2,6]. Moreover, the study of these relationships raises a lot of controversy among researchers, which can be observed by the discrepancies in the literature reports. With the purpose to understand the rules underlying this phenomenon, a systems approach based on Petri nets [10,11,12] was used and described in this paper. This approach allows the systematization of knowledge and a better understanding of the nature of the biological system through creating a mathematical model being a representation of the complex network of interactions [13].
1.2. Biological Background
Iron is a unique trace element that is biologically essential, but also potentially toxic for humans, hence, maintaining its homeostasis is an extremely important issue. The essence of intracellular iron homeostasis is providing adequate amounts of iron to maintain the continuity of vital biological processes, as well as limiting the toxicity of Fe ions involved in the Fenton reaction [14].
Iron differs from other minerals because, due to the lack of a physiological excretion mechanism, its balance in the body is tightly controlled at the level of absorption. Iron ions in the form of Fe are reduced to Fe by duodenal cytochrome b (Dcytb), and in the next stage, they are transported to the enterocyte by the divalent metal transporter 1 (DMT1). Then, Fe ions can be absorbed by ferritin (Ft), or they can be transported into the circulation via ferroportin (FPN) using hephaestin (Heph). Heph oxidizes Fe ions to Fe, which are then absorbed by mammalian cells [15]. Newly absorbed Fe binds to plasma transferrin (Tf). Iron-loaded Tf binds to transferrin receptor 1 (TfR1) on the surface of most of the cells and forms a complex. The Tf-TfR1 complex is internalized via clathrin-mediated endocytosis [15]. Next, after endocytosis of this complex, iron enters the cytoplasm via DMT1. If iron is needed it may traffic directly to the sites of utilization, like mitochondria. If there is no requirement for iron, it may be sequestered for later use within ferritin—the iron-storage protein. The cell can also get rid of iron by exporting via FPN. This export pathway can act as a safety valve if very large amounts of iron accumulate in the cell. In enterocytes, the efficiency of cellular iron export is enhanced by Heph, but in most cells of the body, this role is played by the circulating Heph homolog, ceruloplasmin [15]. An important element is the cytoplasmic labile iron pool (LIP), indicating a deficiency or excess of iron. LIP in response to abnormal iron levels, activates the pathways regulating iron homeostasis [16]. Iron metabolism is controlled by two regulatory mechanisms: the first one acts at the cellular level, while the other works at the systemic level.
The regulatory mechanisms at the cellular level are based on the iron regulatory protein (IRP)—iron responsive element (IRE) signaling pathway. They involve cytoplasmic regulatory proteins 1 and 2 (IRP1 and IRP2) that bind to specific RNA sequences, iron-reactive sequences (IREs), thus regulating the expression of proteins involved in the maintenance of homeostasis, like TfR1, DMT1, Ft and FPN [15]. Depending on the cellular iron levels the IRP/IRE mechanism controls the synthesis of these proteins and their action. For the detailed IRP/IRE signaling pathway translation modulation mechanisms see [17].
Iron deficiency induces the formation of apo-IRP1, which binds to the IRE sequence in the 5′UTR region of the Ft and Fpn mRNAs, leading to an inhibition of their translation. On the other hand, the binding of apo-IRP1 to the IRE sequence in the 3′UTR mRNA region of TfR1 and DMT1 increases the encoded proteins. Otherwise, excess iron will induce the formation of holo-IRP1, which has an opposite effect. It inhibits the translation of TfR1 and DMT1 and increases the level of Fpn and Ft proteins [18].
The regulatory mechanism functioning at the iron system homeostasis level depends mainly on hepcidin (a hormone produced in the liver), the master regulator of systemic iron homeostasis [19]. The major stimuli regulating hepcidin transcription include iron concentrations in the blood, liver iron stores, inflammation, and erythropoiesis [20]. Hepcidin binds to FPN (in the enterocyte membrane), and as a consequence, the Janus kinase 2 (Jak2) is attached. It leads to the phosphorylation of tyrosine (Tyr) residues in FPN, which signals the protein translocation from the membrane into the cytoplasm. As a consequence, FPN is dephosphorylated, ubiquitinated to be degraded eventually. Because of the FPN degradation, iron becomes blocked in enterocytes, decreasing the amount of iron transported to the blood [18].
Hepcidin production is stimulated by iron loading and inflammation. Iron-mediated hepcidin regulation occurs via the bone morphogenetic protein (BMP) and SMAD (BMP-SMAD) pathway, whereas inflammation-mediated regulation occurs in both the IL-6 and JAK and signal transducer and activator of transcription proteins (STAT) (IL-6/JAK/STAT) signaling axis and via the BMP-SMAD pathway [19].
One of the hepcidin regulation mechanisms involves Tf and hemochromatosis (HFE)—proteins, which compete for the binding of the membrane TfR1 [1]. In normal iron states or excess serum iron, Tf binds with a high affinity to TfR1, thus preventing the binding of HFE to TfR1. Free HFE sends signals to the hepatocyte nucleus increasing hepcidin expression. In turn, in the case of iron deficiency, HFE binds to TfR1, reducing the expression of hepcidin [19].
Hepcidin expression can be also modulated by the inflammatory processes [20,21]. Overproduction of cytokines such as IL1, TNF- and IL-6 by macrophages and IFN- by lymphocytes weakens erytropoietin (EPO) synthesis, reduces the response to erythropoiesis, increases hepcidin levels and may activate erythrophagocytosis, especially in an acute form [19]. IL-6 induces the expression of the Hamp gene through the JAK and the signal transducer and activator of the transcription 3 (STAT3) pathway (JAK-STAT3). IL-6 is bundled up with JAK protein triggering its autophosphorylation and activation, resulting in phosphorylation of the transcription factor STAT3. In turn, STAT3 is translocated to the cell nucleus, where leads to the stimulation of the promoter of the hepcidin gene, increasing the expression of hepcidin [19].
The hemojuvelin—bone morphogenetic protein 6—and signaling protein 4 (HJV-BMP6-SMAD4) pathway is another way to modulate hepcidin expression [22]. HJV is an essential cofactor for the binding of bone morphogenetic protein 6 (BMP6) to the BMP receptor (BMPRs), leading to the phosphorylation of the signaling proteins SMAD 1, 5, and 8 (nuclear signal transducers). Phosphorylated SMAD 1, 5, and 8 proteins form a complex to bind the SMAD4 protein in the next step, which is a signal to move to the nucleus and stimulate transcription of the hepcidin gene [23]. This mechanism is triggered in the event of an excess of iron.
In iron deficiency, the HJV-BMP6-SMAD4 pathway is inhibited by furin, specifically, by the action of the soluble form of hemojuvelin (sHJV). sHJV is released from the cell membrane by furin and then binds to the BMP6 protein, preventing it from binding to the receptor. Consequently, the HJV-BMP6-SMAD4 pathway is inhibited, and thus, the concentration of hepcidin is reduced [16].
Besides, hepcidin expression is modulated by VAD. It turns out that vitamin A may increase or decrease hepcidin expression. VAD is characterized by an increase in the level of the pro-inflammatory cytokine, such as IL-6 and IL-1, responsible for increasing hepcidin expression [1]. VAD also increases the level of the BMP6 protein, which is essential in the HJV-BMP6-SMAD4 pathway that stimulates the transcription of the hepcidin gene [2]. On the other hand, the level of the BMP6 protein is reduced in the iron deficiency state [2], reducing the hepcidin expression by preventing the HJV-BMP6-SMAD4 pathway. An equally important mechanism for modulating hepcidin expression is the impairment of erythropoiesis, both in the case of iron deficiency and vitamin A deficiency [2]. VAD leads to impaired erythropoiesis by lowering erythropoietin expression. It leads to erythrocyte malformations and, consequently, accumulation of the heme group in the spleen [2].
The described biological background is graphically presented in Figure 1 and Figure 2, which relate to two different situations. Figure 1 is focused on the interactions between modeled subprocesses in an iron overload situation, while Figure 2 concerns the interactions between the modeled subprocesses in an iron deficiency situation.
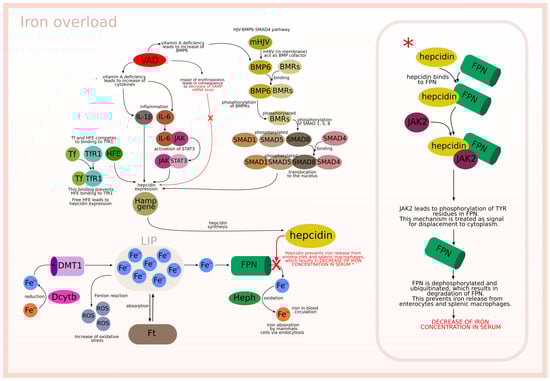
Figure 1.
Iron overload.
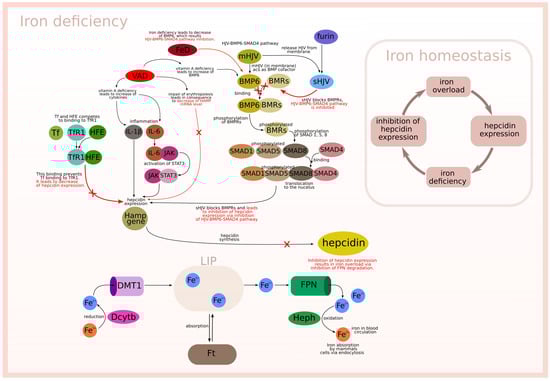
Figure 2.
Iron deficiency.
2. Results
2.1. Petri Net-Based Model
The purpose of creating a model based on Petri nets is to systematize knowledge and better understand the interrelations between vitamin A deficiency and iron deficiency. Although vitamin A deficiency affects the regulation of iron homeostasis, these mechanisms remain unclear. This fact became a motivation to focus on this biological phenomenon. The proposed Petri net-based model was created using Snoopy (open-source software) [24], while the analysis was performed using Holmes (free, stand-alone Java application) [25]. Properties of the proposed model are as follows: 68 passive components (places), 89 active components (transitions), 402 t-invariants (subprocesses). The Petri net-based model was illustrated in Figure 3, which includes only names of places, while names of transitions are included in Table 1 (to increase the readability of the model). The model is available in Supplementary Materials.
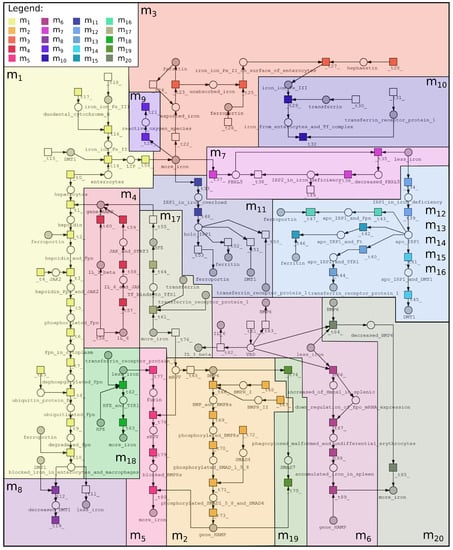
Figure 3.
Petri net-based model of interrelations between vitamin A and iron was divided into 20 subprocesses according to MCT sets: —iron export to enterocyte, —expression of hepcidin by HJV-BMP6-SMAD4 pathway, —iron absorbtion by Ft, —expression of hepcidin by cytokine IL-6 and IL-1, —inhibition of hepcidin expression via soluble HJV, —impairment of erythropoiesis, —decrease of Ft and Fpn (iron deficiency), —degradation and internalization of Fpn, —fenton reaction, —iron absorption by mammalian cells, —holo-IRP1 formation (increase of iron concentration), , , , and —Apo-IRP1 formation (decrease of iron concentration), —increase of hepcidin expression (normal iron status and iron overload), —decrease of hepcidin expression (iron deficiency), —negative regulation of hepcidin by SMAD7, —inhibition of HJV-BMP6-SMAD4 pathway (iron and vitamin A deficiency). More detailed descriptions of these subprocesses are included in Table 2, where information about transitions contained in each MCT set is also included.

Table 1.
List of transitions.
2.2. Analysis
The analysis of the Petri net model is based on a search for similarities between t-invariants (subprocesses), leading to an identification of subprocesses that may interact with each other. Such knowledge allows for a better understanding of the modeled system, and may also allow for a discovery of interesting properties of the investigated biological system. The analysis of the proposed model includes a Maximal Common Transition (MCT) sets analysis, a t-cluster analysis, a significance analysis with the completion by a knockout analysis, and an analysis of an average number of firings of transitions (simulation). These methods are described in Section 4.
In the first stage of the analysis, the MCT sets analysis was performed. The proposed model contains 89 transitions (elementary processes), which were grouped into non-trivial MCT sets (see Section 4). In a biological context, MCT sets correspond to certain functional modules. Therefore, a biological meaning for each MCT set was assigned, what is described in Table 2. All the described modules are also marked in Figure 3 as colored frames.
Table 2.
List of nontrivial Maximal Common Transition (MCT) sets.
In the next stage, clustering of 402 t-invariants was performed. To assess the best clustering Mean Split Silhouette index (MSS) and Calinski–Harabasz (C–H) coefficient were used [22]. The first coefficient, MSS, evaluates the fit of each t-invariant to its cluster and the average quality of a given clustering [26,27]. The second one, C–H, allows indicating the optimal number of clusters by the highest value [28]. The set of t-invariants was divided into 20 t-clusters using Average Linkage method and Pearson distance measure. Each of these clusters consists of certain biological subprocesses, which are described in Table 3. Moreover, occurrences of the particular subprocesses in a given t-cluster are presented in Figure 4 (the more intense the color, the given subprocess appears in the greater number of t-clusters). Subprocesses, which may play a significant role in the modeled system, can be found through their frequency of occurrence in t-clusters.
Table 3.
List of subprocesses included in t-clusters.
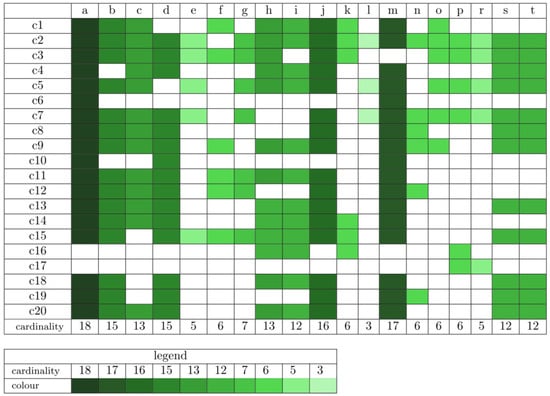
Figure 4.
Occurrence of subprocesses in t-clusters (more intense the color, given subprocess appears in a greater number of t-clusters).
The purpose of the t-cluster analysis is to find subprocesses that may play a significant role in the functioning of the modeled system. It is possible to identify subprocesses that may be more crucial than others. It seems that if a certain subprocess occurs in a larger number of clusters, it may be stimulated by various, independent processes. Due to this fact, it may be concluded whether this subprocess is stimulated more or less frequently. However, the analysis of t-clusters is quite general, and such conclusions need to be confirmed by applying more precise analyzes. For example, an essential mechanism of the investigated system is the regulation of hepcidin expression. The presented model includes several independent pathways involved in hepcidin expression, including HJV-BMP6-SMAD4 pathway (subprocess (n)), free HFE (subprocess (f)), and JAK-STAT3 pathway modulated by cytokines IL-6 and IL-1 (subprocess (h)). Therefore, the frequency of these subprocesses in all t-clusters was considered. As shown in Figure 4, subprocess (n) occurs in 6 t-clusters, subprocess (f) occurs in 6 t-clusters, and subprocess (h) occurs in 13 t-clusters. Therefore, it seems that hepcidin expression is more frequently induced by cytokines (subprocess (h)) than other pathways. However, this type of conclusion requires additional confirmation by conducting more detailed analyzes. The results of the t-cluster analysis are described in more detail in Section 3.
As mentioned before, the analysis of t-clusters may turn out to be quite general and thus may cause some phenomena to be ignored and not noticed. Therefore, it is also worth using more detailed analyzes, such as a significance analysis, a knockout analysis, or an analysis of the average number of transition firings (simulation). Conducting additional analyzes will allow to confirm the results obtained from the cluster analysis.
The significance analysis was performed for elementary processes related to hepcidin expression, both stimulation and inhibition. The results of the significance analysis for selected transitions are presented in Table 4. This table contains subprocesses that stimulate hepcidin expression and subprocesses that inhibit hepcidin expression (all subprocesses are listed in the “Subprocesses” column). Each subprocess consists of at least one elementary process; the transitions’ IDs and the names of elementary processes are included in the columns “ID” and “Name of elementary process”, respectively. The column, “Significance” is divided into “Frequency trans./t-inv.”, which includes information about the occurrence frequency of a given transition in supports of t-invariants, and “Percentage ratio” which includes occurrence frequency expressed as percentage, hereinafter called also significance of given transition. In addition, Table 4 includes also the results for the analysis of an average number of the firing of transitions, which are included in the last column “AvgT”. This analysis allows obtaining information about the frequency of transition activation. For example, transition (corresponding to hepcidin expression via the JAK-STAT3 pathway) is part of the larger subprocess of stimulating hepcidin expression by the cytokines IL-6 and IL-1. This transition occurs in 252 supports of t-invariants which consists 63% of all t-invariants (402 t-invariants). The significance analysis is related to knockout analysis, which means that a knockout of transition excludes 63% of all modeled subprocesses. Additionally, the average number of firings of transition is equal to 46.94. This value is one of two the highest values among all elementary processes positively regulating hepcidin expression.
Table 4.
Results of significance analysis for selected elementary processes associated with stimulation and inhibition of hepcidin expression.
The significance analysis allows determining which elementary process is more significant for the functioning of the whole model. For example, based on Table 4, among the elementary processes that stimulate hepcidin expression, transitions and are the most important (these transitions correspond to elementary processes which positively regulate hepcidin expression by cytokines). In this case, these results confirm the conclusions of the t-cluster analysis, which has shown that hepcidin expression induced by cytokines (subprocess (h)) may be more significant than induction by other subprocesses. Moreover, another more detailed analysis is the analysis of the average number of firings of transitions. Contrary to the significance analysis, this is not a structure-based but a simulation-based analysis. Such simulation analysis allows obtaining information about the frequency of firings of a particular transition. For example, based on Table 4, transition is the most frequently fired among all elementary processes positively regulating hepcidin expression. Therefore, the elementary subprocess which is a positive regulation of hepcidin expression by cytokines occurs more frequently than other elementary processes positively regulating hepcidin. A detailed comparison of the results obtained from the mentioned analyses for the mechanisms stimulating and inhibiting hepcidin expression is described in Section 3.
3. Discussion
The proposed model is focused on the selected aspects of the interaction between vitamin A and iron, where different levels of iron concentration was taken into account (iron deficiency, normal iron status, iron overload). The performed analyses made it possible to study the interactions between particular subprocesses, and in consequence, a better understanding of the modeled phenomenon.
The analysis of t-clusters focused on the role of hepcidin in the regulation of iron homeostasis. There are several independent mechanisms and biological components influencing positively the expression of hepcidin, which are as follows:
- HJV-BMP6-SMAD4 pathway (subprocess (n)) included in 6 t-clusters, see Table Figure 4).
- Cytokines IL-6 (JAK-STAT3 pathway) and IL-1 (subprocess (h)) included in 13 t-clusters, see Table Figure 4).
- Free HFE; in the case of iron overload or normal status Tf binds to TfR1 and prevents HFE binding (subprocess (f)) included in 6 t-clusters, see Table Figure 4).
Moreover, the cluster analysis showed that hepcidin expression induced by IL-6 and IL- may be more significant than induction by other subprocesses. This fact can be associated with vitamin A deficiency, which additionally stimulates inflammation through an increase of the mentioned cytokines. However, other subprocesses, like subprocess (n) corresponding to HJV-BMP6-SMAD4 pathway and subprocess (f) corresponding to the situation in which there exists free HFE, occur in the same number of clusters. Therefore, the role of these subprocesses should be equally important for the functioning of the system. These results were compared to the results obtained from the more detailed analysis, which is the significance analysis (see Table 4). The results of the significance analysis showed that the most significant elementary processes are transitions associated with induction of hepcidin expression by cytokines (, with a significance of 63%). On the other hand, the elementary processes related to the stimulation of hepcidin expression by HJV-BMP6-SMAD4 pathway and by free HFE have a similar significance level (—29%, —26%, respectively). Thus, the results of the significance analysis confirm the results of the t-cluster analysis for subprocesses related to the positive stimulation of hepcidin expression. The t-cluster analysis confirm the above results, because it has shown that subprocess (h) corresponding to induction of hepcidin expression by cytokines may be the most significant compared to the others, and subprocesses n) and f) although less crucial than subprocess (h), may be equally important for the functioning of the system. In addition to estimating the significance of selected transitions, an average number of firings of transitions was also considered (see the column “AvgT ” in Table 4). As can be seen, the most often fired are transitions , and corresponding to stimulation of hepcidin expression through cytokines, next in order is transition corresponding to stimulation by HJV- BMP6-SMAD4 pathway, and finally transitions and corresponding to the presence of free HFE. Despite the fact that the last two elementary processes are equally important in the sense of the structure of the entire model, they may occur with different frequencies.
The next stage of the analysis of the results is focused on the mechanisms leading to inhibition of hepcidin expression, which are as follows:
- Inhibition of HJV-BMP6-SMAD4 pathway (subprocess (o) included in 6 t-clusters and subprocess (s) included in 12 t-clusters, see Table 4).
- Binding HFE to TfR1 (subprocess (g) included in 7 t-clusters, see Table 4).
- Induction of SMAD7 by BMP6 (subprocess (k) included in 6 t-clusters, see Table 4).
- Impairing of erythropoiesis (subprocess (t) included in 12 t-clusters, see Table 4).
The t-clusters analysis revealed that among the subprocesses inhibiting hepcidin expression, inhibition of HJV-BMP6-SMAD4 pathway and impairing of erythropoiesis are more relevant than the other mechanisms. HJV-BMP6-SMAD4 pathway can be inhibited by two different mechanisms. The first one is related to an activation of furin in case of iron deficiency. Furin releases HJV from a membrane as a result of a proteolytic reaction. Soluble sHJV blocks BMPRs receptors resulting in inhibition of HJV-BMP6-SMAD4 pathway. The second one is a reduction of BMP6 (in case of iron deficiency and VAD), which is an essential element in HJV-BMP6-SMAD4 pathway.
Similarly, as for the subprocesses related to the stimulation of hepcidin expression, a more detailed analysis was performed for the inhibitory mechanisms. The significance analysis has shown that the most significant elementary process is the transition associated with inhibition of HJV-BMP6-SMAD4 pathway ( with 19% significance), next in order are elementary processes related to HFE binding to TfR1 ( and , both with 17% significance), followed by elementary processes related to SMAD7 induction by BMP6 ( and with 10% significance), and finally elementary process corresponding to impairing of erythropoiesis ( with 9% significance). These results of the significance analysis are not consistent with the t-cluster analysis. The t-cluster analysis has shown that subprocess (o) corresponding to inhibition of HJV-BMP6-SMAD4 pathway and subprocess (t) corresponding to impairing of erythropoiesis seem to be the most significant, while only the first one is really crucial. Moreover, subprocess (t) has the slightest importance in the significance analysis of the selected elementary processes. As mentioned earlier, the t-cluster analysis may be too general. It turns out that the most significant mechanisms inhibiting hepcidin expression are the inhibition of HJV-BMP6-SMAD4 pathway, as well as the binding of HFE and TfR1. Apart from the significance analysis, the simulation of the average number of firings was also performed. The fact that a given elementary process is significant from the point of view of the system structure does not mean that it is fired most often. In Table 4 in the column “AvgT ” it can be seen that induction of SMAD7 by BMP6 is most often fired (this mechanism indirectly inhibits HJV-BMP6-SMAD4 pathway, which requires the presence of BMP6). However, transitions and corresponding to the mentioned subprocess are not so much significant for the structure of the modeled system. The other mechanisms of inhibition of hepcidin expression (i.e., inhibition of HJV-BMP6-SMAD4 pathway or binding HFE to TfR1), which are structurally important, occur with much lower frequency than induction of SMAD7 by BMP6.
An important aspect of the model analysis is the effect of vitamin A deficiency and its relationship with iron. The cluster analysis identified a few subprocesses directly related to vitamin A deficiency based on the frequency occurrence of subprocesses in t-clusters:
- VAD additionally stimulates hepcidin expression by increase of IL-6 and IL-1 (subprocess (i)) included in 12 t-clusters).
- VAD leads to increase of BMP6 (subprocess (p) included in 6 t-clusters).
- VAD and low iron level leads to decrease of BMP6, which results in inhibition of hepcidin expression (subprocess (s) included in 12 t-clusters).
- VAD and iron deficiency impair of erythropoiesis leading to negative regulation of hepcidin expression (subprocess (t) included in 12 t-clusters).
The results of the t-cluster analysis (the frequency occurrence of the mentioned above subprocesses in t-clusters) revealed unquestionable influence of vitamin A deficiency and iron deficiency on inhibition of hepcidin expression. There exist different literature reports concerning the influence of vitamin A deficiency on hepcidin expression. The results presented in [1] clearly describe that vitamin A maintains iron homeostasis by positively modulating hepcidin expression in the liver. On the other hand, the results reported in [2] indicate that vitamin A deficiency also promotes reduction of hepatic Hamp mRNA levels, rather than the expected up-regulation of Hamp gene expression.
The experimental procedures of these two studies ([1,2]) leading to the various results are briefly summarized below:
- Studies described in [1]:
- -
- Experimental animals: male Wistar rats, 21 days-old with a mean body weight of 52.5 ± 3.1g.
- -
- Durations of treatments: 57 days.
- -
- Three experimental groups of rats with six animals per group:
- *
- The control group received an AIN-93G diet [29], where concentrations of vitamin A (4000 IU/kg) was replaced by an equivalent amount of -carotene (14,400 /kg).
- *
- Vitamin A-deficient group received the AIN-93G without any source of vitamin A.
- *
- Vitamin A and iron-deficient group received the AIN-93G without any source of vitamin A and only 12.2 mg of iron/kg of diet.
- Studies described in [2]:
- -
- Experimental animals: male Wistar rats, 21 days-old with a mean body weight of 65.7 ± 5.5 g.
- -
- Duration of treatments: 59 days.
- -
- 5 experimental groups of rats with six animals per group:
- *
- The control group received the AIN-93G diet, containing 4000 IU of vitamin A/kg.
- *
- Vitamin A-deficient group received the AIN-93G diet without any source of vitamin A.
- *
- Iron-deficient group received the AIN-93G diet without any source of iron.
- *
- Vitamin A and iron-deficient group received the AIN-93G diet without any source of vitamin A or iron.
- *
- All-trans retinoic acid (atRA) group received the AIN-93G diet with 12 mg atRA/kg of diet.
Given these discrepancies (between the results presented in [1,2]), two different subprocesses were considered in the next stage of the analysis. The first one, in which vitamin A deficiency has an influence on the increase of BMP6, leading to hepcidin expression via HJV-BMP6-SMAD4 pathway (see subprocess (p)) in Figure 4). The second one, in which BMP6 induces SMAD7, which negatively regulates hepcidin (see subprocess (k)) in Figure 4). These two opposite mechanisms are included in the same number of t-clusters. Therefore, it seems they may be equally important for the modeled system, which does not solve the problem of existing different literature reports.
The results of the t-cluster analysis may be too general, thus performing clustering as the only analysis may lead to an omission of some meaningful relationships. Nevertheless, clustering may narrow the area of search and suggest a further direction of research. Therefore, the analysis of the average number of transition firings was performed for the mentioned before subprocesses (k) and (p).
The results of the analysis of the average number of firings of selected transitions are presented below:
- Subprocess stimulating hepcidin expression (—VAD leads to increase of BMP6): the average number of firings is equal to 24.30.
- Subprocess inhibiting hepcidin expression (—BMP6 induces SMAD7): the average number of firings is equal to 13.99.
This analysis showed that the elementary process associated with activating HJV-BMP6-SMAD4 pathway (which stimulates hepcidin expression) is more often fired than the subprocess leading to a negative regulation of hepcidin expression by involvement of BMP6 in SMAD7 induction.
4. Methods
Petri nets are mathematical objects that in a natural way can be used for modeling and analysis of systems composed of concurrent processes. Their origins are in the area of theoretical computer science, and for decades they were used mainly for modeling technical systems. However, during the last two decades, it appeared that they are very well suited for modeling and analysis of biological systems [10,11,12,13].
One of the reasons of this suitability is a structure of Petri nets, being a directed weighted bipartite graph. It means that a Petri net is composed of two disjoint sets of vertices. Vertices from one of these sets are called transitions and they usually correspond to some elementary active components of a modeled system (e.g., chemical reactions), while vertices from the other set, called places, are counterparts of elementary passive components of the system (e.g., substrates or products of chemical reactions). The vertices can be joined by an arc but only vertices of various types can be connected in this way. The arcs correspond to some causal relations between passive and active components of the net.
However, a Petri net is not a graph—there is one more, very important kind of components, i.e., tokens. They reside in places and can flow from one place to another through transitions. This flow is a crucial feature of Petri nets since it corresponds to flow of information, substances, signals, etc. through the modeled system. It is governed by a simple principle, called transition firing rule. According to it a transition becomes active if in every of places directly preceding it (such places are called pre-places of this transition) the numbers of tokens are equal to at least the weight of an arc joining a given place with the transition. An active transition can be fired, what means that tokens flow from its preplaces to its postplaces (i.e., places directly succeeding the transition), wherein the numbers of flowing tokens are equal to the weights of respective arcs.
Petri nets, as mathematical objects, can be described and analyzed using mathematical methods but they also have an intuitive and useful graphical representation. In this representation, transitions are depicted as rectangles or bars, places as circles, arcs as arrows, tokens as dots, or positive integer numbers located in places and weights as numbers labeling arcs (when a weight is equal to one, it is usually omitted in this representation for simplicity). The graphical representation is very helpful in understanding a structure of the modeled system and especially useful at the stage of developing the model and simulating it [10,13,22,30].
However, despite that the graphical representation of Petri nets is very useful, it is not well suited for a formal analysis of them. Hence, another representation is also often used, i.e., an incidence matrix. Such a matrix A is composed of n rows corresponding to places and m columns corresponding to transitions. Entry of this matrix is a number equal to a difference between the numbers of tokens present in place before and after firing transition .
An analysis of a Petri net-based model of a biological system can be based on t-invariants. Such an invariant is vector x being a solution of the following equation:
The length of vector x is equal to m, i.e., the number of transitions, and each entry in this vector correspond to a transition. With t-invariant x there is associated a set of transition called its support. The elements of the support are transitions which correspond to positive entries in x. More formally, a support of t-invariant x is set .
t-invariants correspond to subprocesses, which can be especially important for the functioning of the modeled system. If every transition is fired times, then a distribution of tokens over the set of places (such a distribution is called a marking of a Petri net) does not change. The state of the modeled system becomes unchanged. Hence, t-invariants correspond to subprocesses which do not change the state of the modeled biological system [22]. Moreover, the Petri net model should be covered by t-invariants, i.e., each transition should belong to a support of at least one t-invariant. In a biological context, every elementary biological process modeled by a transition contributes to a behavior of the biological system. Therefore, the analysis of t-invariants may lead to a better understanding of interactions between the subprocesses of the modeled biological system. However, there is an assumption that the analyzed biological system is in a steady state.
There is also another type of sets of transitions important in the analysis of Petri net-based models of biological systems, i.e., Maximal Common Transition sets (MCT sets). Elements of such a set are transitions, which exclusively belong to supports of exactly the same t-invariants. From this follows that MCT sets divide the set of all transitions into disjoint subsets (i.e., every transition belongs to exactly one MCT set). It should be noted that some of MCT sets may contain only one transition—they are called trivial MCT sets. In general, MCT sets (except the trivial ones) correspond to some functional modules of the modeled biological system [13,22,31].
Apart from that transitions can be grouped into MCT-sets, also t-invariants can be grouped into sets called t-clusters. They contain those t-invariants which are similar to each other according to some similarity measure. Such clusters can be determined using standard clustering algorithms. However, there are many algorithms of this type and there are also many similarity measures which can be used. So, despite that to determine a collection of t-clusters standard algorithms and measures can be used, the task is not a trivial one, since the algorithm as well as the similarity measure should be properly chosen. Moreover, the number of clusters should also be determined in a proper way [21,32].
In addition to the mentioned analyzes, more detailed analyzes can be also carried out, i.e., a significance analysis with the completion by a knockout analysis and an analysis of an average number of transition firings [33]. The significance analysis allows determining a significance of a given elementary process based on the occurrence frequency of a transition (corresponding to such an elementary process) in all supports of t-invariants. The significance of a given transition is a ratio of the number of t-invariant supports containing this transition to the number of all t-invariants and it is expressed in percents.
The significance analysis is directly associated with the knockout analysis, which evaluates the significance of a given transition (or a set of transitions) based on the quantity of excluded subprocesses as a result of a knockout. A current number of t-invariants can be determined once again after the knockout of a selected transition. On this basis, it may be calculated how many subprocesses were excluded in consequence of the knockout. The more subprocesses were excluded, the more important the given elementary process is.
5. Conclusions
Using a systems approach based on Petri nets allows the analysis of biological phenomena as systems characterized by a complex net of interactions. To study the presented system in detail, the t-cluster analysis, the significance analysis, and the analysis of the average number of transition firings were performed. The above analyzes allowed to distinguish the most important mechanisms positively stimulating the expression of hepcidin and the most important mechanisms negatively regulating the expression of hepcidin. In addition, apart from distinguishing the most significant subprocesses/elementary processes for the functioning of the model, the average number of firings of particular transitions were also determined (it means that the frequency of occurrence of individual elementary processes).
In the case of the studied system focusing on the effect of vitamin A deficiency on the regulation of iron homeostasis, a thorough understanding of the biological problem is difficult due to contradictory literature information. The study of the proposed model aims to understand the analyzed system’s nature better and systematize the knowledge. The final analysis also allows resolving some doubts as to the discrepancy in literature reports, where VAD leads to negative regulation of hepcidin expression [2] (in this paper, the authors emphasize the fact that the achieved results are different than expected) or to positive regulation of hepcidin expression [1]. A graphical representation of this problem is shown in Figure 5, where the mechanism in which VAD negatively regulates hecidin expression is associated with induction of SMAD7 by BMP6, while the mechanism in which VAD positively regulates hecidin expression is associated with stimulation of HJV-BMP6-SMAD4 pathway. The t-cluster analysis showed that these two opposite subprocesses may be equally important for the functioning of the modeled system. However, the more detailed analyses showed differences. Both the significance analysis as well as the analysis of the average number of transition firings indicated that VAD more frequently positively stimulates hepcidin expression, and this mechanism is more significant than mechanism inhibiting hepcidin expression indirectly by VAD.
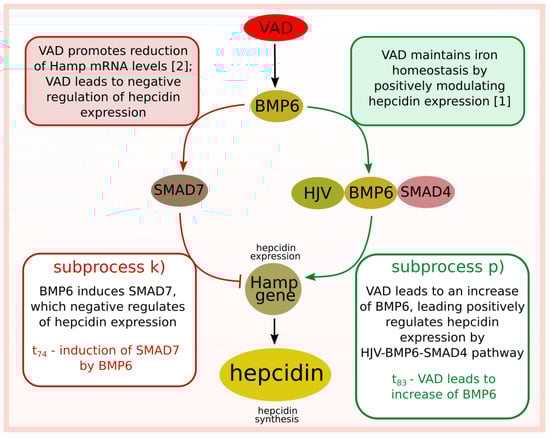
Figure 5.
Diagram of two opposing mechanisms of regulation of hepcidin expression modulated by vitamin A deficiency.
Supplementary Materials
The following are available online at https://www.mdpi.com/article/10.3390/ijms23031189/s1.
Author Contributions
D.F. proposed the concept of the study; K.G. developed the Petri net-based model; K.G., D.F. and P.F. carried out the systems analysis; K.G., D.F. and P.F. wrote the manuscript; D.F. and P.F. supervised the research; P.F. acquired the funds. All authors have read and agreed to the published version of the manuscript.
Funding
This research was partially supported by statutory funds of Poznan University of Technology.
Institutional Review Board Statement
Not applicable.
Informed Consent Statement
Not applicable.
Data Availability Statement
Not applicable.
Conflicts of Interest
The authors declare no conflict of interest.
Abbreviations
The following abbreviations are used in this manuscript:
| atRA | all-trans retinoic acid |
| BMP | bone morphogenetic protein |
| BMP6 | bone morphogenetic protein 6 |
| BMPRs | bone morphogenetic protein receptors |
| C–H | Calinski–Harabasz coefficient |
| Dcytb | duodenal cytochrome b |
| DMT1 | divalent metal transporter 1 |
| EPO | erytropoietin |
| FBXL5 | F-box and leucine rich repeat protein 5 |
| FeD | iron deficiency |
| FPN | ferroportin |
| Ft | ferritin |
| HAMP | hepcidin antimicrobial peptide (gene encoding hepcidin) |
| Heph | hephaestin |
| HFE | homeostatic iron regulator |
| HJV | hemojuvelin |
| IL-6 | interleukin-6 |
| IL-1 | interleukin-1 |
| IRE | iron responsive element |
| IRP | iron regulatory protein |
| JAK2 | janus kinases |
| LIP | labile iron pool |
| MCT sets | Maximal Common Transition sets |
| mHJV | membrane hemojuvelin |
| MSS | Mean Split Silhouette index |
| ROS | reactive oxygen species |
| sHJV | soluble hemojuvelin |
| SMAD | mothers against decapentaplegic |
| STAT | signal transducer and activator of transcription protein |
| Tf | transferrin |
| TfR1 | transferrin receptor protein 1 |
| trans./t-inv. | transition/t-invariant |
| Tyr | tyrosine |
| VAD | vitamin A deficiency |
References
- Arruda, S.F.; de Almeida Siqueira, E.M.; de Valência, F.F. Vitamin A deficiency increases hepcidin expression and oxidative stress in rat. Nutrition 2009, 25, 472–478. [Google Scholar] [CrossRef] [PubMed]
- da Cunha, M.S.; Siqueira, E.M.; Trindade, L.S.; Arruda, S.F. Vitamin A deficiency modulates iron metabolism via ineffective erythropoiesis. J. Nutr. Biochem. 2014, 25, 1035–1044. [Google Scholar] [CrossRef] [PubMed]
- Mendes, J.F.; de Almeida Siqueira, E.M.; Arruda, S.F. Vitamin A deficiency modulates iron metabolism independent of hemojuvelin (Hfe2) and bone morphogenetic protein 6 (Bmp6) transcript levels. Genes Nutr. 2016, 11, 1–7. [Google Scholar] [CrossRef] [PubMed]
- Roodenburg, A.C.; West, C.E.; Hovenierl, R.; Beynen, A.C. Supplemental vitamin A enhances the recovery from iron deficiency in rats with chronic vitamin A deficiency. Br. J. Nutr. 1996, 75, 623–636. [Google Scholar] [CrossRef] [PubMed]
- Strube, Y.N.J.; Beard, J.L.; Ross, A.C. Iron deficiency and marginal vitamin A deficiency affect growth, hematological indices and the regulation of iron metabolism genes in rats. J. Nutr. 2002, 132, 3607–3615. [Google Scholar] [CrossRef] [PubMed]
- Schroeder, S.E.; Reddy, M.B.; Schalinske, K.L. Retinoic acid modulates hepatic iron homeostasis in rats by attenuating the RNA-binding activity of iron regulatory proteins. J. Nutr. 2007, 137, 2686–2690. [Google Scholar] [CrossRef][Green Version]
- Blackfan, K.D.; Wolbach, S.B. Vitamin A deficiency in infants: A clinical and pathological study. J. Pediatr. 1933, 3, 679–706. [Google Scholar] [CrossRef]
- Findlay, G.; Mackenzie, R. The bone marrow in deficiency diseases. J. Pathol. 1922, 25, 402–403. [Google Scholar]
- Koessler, K.K.; Maurer, S.; Loughlin, R. The relation of anemia, primary and secondary, to vitamin A deficiency. J. Am. Med. Assoc. 1926, 87, 476–482. [Google Scholar] [CrossRef]
- Murata, T. Petri nets: Properties, analysis and applications. Proc. IEEE 1989, 77, 541–580. [Google Scholar] [CrossRef]
- Petri, C. Communication with Automata; Schriften des Instituts fur Instrumentelle Mathematik: Bonn, Germany, 1962. [Google Scholar]
- Reisig, W. Understanding Petri Nets: Modeling Techniques, Analysis Methods, Case Studies; Springer: Berlin/Heidelberg, Germany, 2013. [Google Scholar]
- Koch, I.; Reisig, W.; Schreiber, F. Modeling in Systems Biology: The Petri Net Approach; Springer Science & Business Media: London, UK, 2010; Volume 16. [Google Scholar]
- Formanowicz, D.; Radom, M.; Rybarczyk, A.; Formanowicz, P. The role of Fenton reaction in ROS-induced toxicity underlying atherosclerosis—Modeled and analyzed using a Petri net-based approach. Biosystems 2018, 165, 71–87. [Google Scholar] [CrossRef] [PubMed]
- Anderson, G.J.; Frazer, D.M. Current understanding of iron homeostasis. Am. J. Clin. Nutr. 2017, 106, 1559S–1566S. [Google Scholar] [CrossRef] [PubMed]
- Hentze, M.W.; Muckenthaler, M.U.; Galy, B.; Camaschella, C. Two to tango: Regulation of Mammalian iron metabolism. Cell 2010, 142, 24–38. [Google Scholar] [CrossRef] [PubMed]
- Zhou, Z.D.; Tan, E.K. Iron regulatory protein (IRP)-iron responsive element (IRE) signaling pathway in human neurodegenerative diseases. Mol. Neurodegener. 2017, 12, 1–12. [Google Scholar] [CrossRef] [PubMed]
- Zhao, N.; Zhang, A.S.; Enns, C.A. Iron regulation by hepcidin. J. Clin. Investig. 2013, 123, 2337–2343. [Google Scholar] [CrossRef]
- Pagani, A.; Nai, A.; Silvestri, L.; Camaschella, C. Hepcidin and Anemia: A Tight Relationship. Front. Physiol. 2019, 10, 1294. [Google Scholar] [CrossRef]
- Sangkhae, V.; Nemeth, E. Regulation of the Iron Homeostatic Hormone Hepcidin. Adv. Nutr. 2017, 8, 126–136. [Google Scholar] [CrossRef]
- Formanowicz, D.; Sackmann, A.; Kozak, A.; Błażewicz, J.; Formanowicz, P. Some aspects of the anemia of chronic disorders modeled and analyzed by petri net based approach. Bioprocess Biosyst. Eng. 2011, 34, 581–591. [Google Scholar] [CrossRef]
- Formanowicz, D.; Kozak, A.; Głowacki, T.; Radom, M.; Formanowicz, P. Hemojuvelin–hepcidin axis modeled and analyzed using Petri nets. J. Biomed. Inform. 2013, 46, 1030–1043. [Google Scholar] [CrossRef]
- Rishi, G.; Subramaniam, V.N. The liver in regulation of iron homeostasis. Am. J. Physiol.-Gastrointest. Liver Physiol. 2017, 313, G157–G165. [Google Scholar] [CrossRef]
- Heiner, M.; Herajy, M.; Liu, F.; Rohr, C.; Schwarick, M. Snoopy–a unifying Petri net tool. In Proceedings of the International Conference on Application and Theory of Petri Nets and Concurrency, Hamburg, Germany, 27–29 June 2012; pp. 398–407. [Google Scholar]
- Radom, M.; Rybarczyk, A.; Szawulak, B.; Andrzejewski, H.; Chabelski, P.; Kozak, A.; Formanowicz, P. Holmes: A graphical tool for development, simulation and analysis of Petri net based models of complex biological systems. Bioinformatics 2017, 33, 3822–3823. [Google Scholar] [CrossRef] [PubMed]
- Rousseeuw, P.J. Silhouettes: A graphical aid to the interpretation and validation of cluster analysis. J. Comput. Appl. Math. 1987, 20, 53–65. [Google Scholar] [CrossRef]
- Kaufman, L.; Rousseeuw, P.J. Finding Groups in Data: An Introduction to Cluster Analysis; John Wiley & Sons: New York, NY, USA, 1990. [Google Scholar]
- Caliński, T.; Harabasz, J. A dendrite method for cluster analysis. Commun. Stat.-Theory Methods 1974, 3, 1–27. [Google Scholar] [CrossRef]
- Reeves, P.G.; Nielsen, F.H.; Fahey, G.C., Jr. AIN-93 Purified Diets for Laboratory Rodents: Final Report of the American Institute of Nutrition ad hoc Writing Committee on the Reformulation of the AIN-76A Rodent Diet. J Nutr. 1993, 123, 1939–1951. [Google Scholar] [CrossRef] [PubMed]
- David, R.; Alla, H. Discrete, Continuous and Hybrid Petri Nets; Springer: Berlin/Heidelberg, Germany, 2010. [Google Scholar]
- Grafahrend-Belau, E.; Schreiber, F.; Heiner, M.; Sackmann, A.; Junker, B.; Grunwald, S.; Speer, A.; Winder, K.; Koch, I. Modularization of biochemical networks based on classification of Petri net t-invariants. BMC Bioinform. 2008, 9, 90. [Google Scholar] [CrossRef]
- Formanowicz, D.; Radom, M.; Zawierucha, P.; Formanowicz, P. Petri net-based approach to modeling and analysis of selected aspects of the molecular regulation of angiogenesis. PLoS ONE 2017, 12, e0173020. [Google Scholar] [CrossRef]
- Gutowski, Ł.; Gutowska, K.; Pioruńska-Stolzmann, M.; Formanowicz, P.; Formanowicz, D. Systems approach to study associations between OxLDL and abdominal aortic aneurysms. Int. J. Mol. Sci. 2019, 20, 3909. [Google Scholar] [CrossRef]
Publisher’s Note: MDPI stays neutral with regard to jurisdictional claims in published maps and institutional affiliations. |
© 2022 by the authors. Licensee MDPI, Basel, Switzerland. This article is an open access article distributed under the terms and conditions of the Creative Commons Attribution (CC BY) license (https://creativecommons.org/licenses/by/4.0/).