1. Introduction
99-Metastabil Technetium (
99mTc) is a
γ-emitting radionuclide used for a wide range of applications in nuclear medicine [
1,
2].
99mTc can bind to organic molecules, thus making them detectable by radioactive imaging devices such as gamma cameras or dose calibrators [
3]. One of the earliest and most important fields of
99mTc imaging is visualizing bone structures, and metabolic processes. This is known as skeletal scintigraphy [
4,
5]. In 1971, Subramanian and McAfee described the first
99mTc-radiopharmaceutical widely used for bone labeling,
99mTc-polyphosphate [
6]. Indications for the use of skeletal scintigraphy include the surveillance of neoplasia such as sarcomas, detecting insufficiency fractures, and diagnosing metabolic bone disease such as osteomalacia [
7,
8]. Meanwhile, technetium has been bound to a number of phosphate and phosphonate compounds, including methylene diphosphonate (MDP), ethylene diphosphonate (EHDP), and hydroxydiphosphonate (HDP) [
3,
9]. These phosphonate compounds bind to hydroxyapatite via adsorption, thus linking
99mTc to the calcium complex [
10]. Hydroxyapatite (Ca
5[(OH)(PO
4)
3] or Ca
10[(OH)
2(PO
4)
6) is secreted by osteoblasts, forms an extracellular matrix, and can therefore be used to characterize osteogenesis [
11,
12,
13].
In recent years, it has been found that
99mTc can be used to quantify the osteogenic potential of cell cultures in vitro [
14,
15]. This is highly relevant in bone tissue engineering (BTE). Among other things, BTE assesses the ability of cell lines to form bone tissue under different conditions [
16]. In particular, osteogenic differentiation of human mesenchymal stem cells (MSCs) has become a standard procedure in BTE [
11,
17]. Osteogenic potential is usually determined by quantifying the amount of hydroxyapatite secreted, since approximately 65% of bone tissue is made up of inorganic mineral, and hydroxyapatite accounts for up to 85% of this extracellular matrix [
13,
18]. This quantification requires an easily available and highly sensitive method to detect hydroxyapatite. The current gold standard for detecting hydroxyapatite, as defined by the Society of Cellular Therapy, is histological alizarin red staining [
19]. While this method allows the quantification of hydroxyapatite, it is an elaborate process that has the disadvantage of permanently destroying the cell culture. Furthermore, it is not suitable for monitoring the differentiation towards the osteogenic lineage during the ongoing cell culture [
20]. However, labeling with
99mTc-polyphosphonates does not require the termination of the cell culture [
21]. Therefore, it is theoretically possible to conduct further experiments with the same cell culture after labeling, and monitoring the osteogenic differentiation during the running cell culture would also, probably, be possible. This would constitute a huge scientific and economic benefit for researchers. However, some radioactive nuclides are known to have adverse effects on cell cultures [
22], and it is not known whether that is the case for
99mTc. This is vital to know as such harm would preclude the use of
99mTc for monitoring purposes. Therefore, this study was performed to assess the effect of repeated labeling with
99mTc on cell viability, and the ability of cell cultures to retain their differentiation potential to form hydroxyapatite.
This promising method can only be used for labeling living cell cultures if the procedure can be performed quickly, as the labeling method requires the temporary removal of cell culture media, and a prolonged exposure to room temperature [
14,
15,
23]. The incubation time needed to bind the
99mTc-compound to the hydroxyapatite is, therefore, a limiting factor. Unfortunately, this has not yet been determined under experimental conditions. Previous publications used incubation times of 2 h, but the minimal incubation time needed may be substantially lower as the binding process of the tracer probably happens within minutes. Furthermore, an absolute quantification of hydroxyapatite content in a cell culture requires the existing mineral to be completely saturated with
99mTc-HDP. However, little is known about the saturation concentration of
99mTc-HDP when used for assessing hydroxyapatite in vitro, whereas it is important to know how much activity is needed to fully saturate a certain amount of mineral. In previous experiments, semi-quantitative labeling was performed using 5 MBq by default, but the required amount of initial activity may be substantially lower or higher [
14,
15,
23].
Therefore, in the second part of this paper we present another study, which assessed the minimal incubation time and required radioactive activity for full saturation for labeling osteogenic cultures of hMSCs with 99mTc-HDP.
3. Discussion
Labeling with
99mTc-HDP is a highly sensitive method to determine hydroxyapatite formation in vitro. It has already been shown that
99mTc-HDP labeling can reliably quantify osteogenesis when compared to the gold standard of alizarin red staining [
14].
When assessing the osteogenic potential of stem cells, it has always been disputed whether the osteogenically differentiated cells actually form hydroxyapatite, and not a related calcium complex to which
99mTc-HDP can also bind [
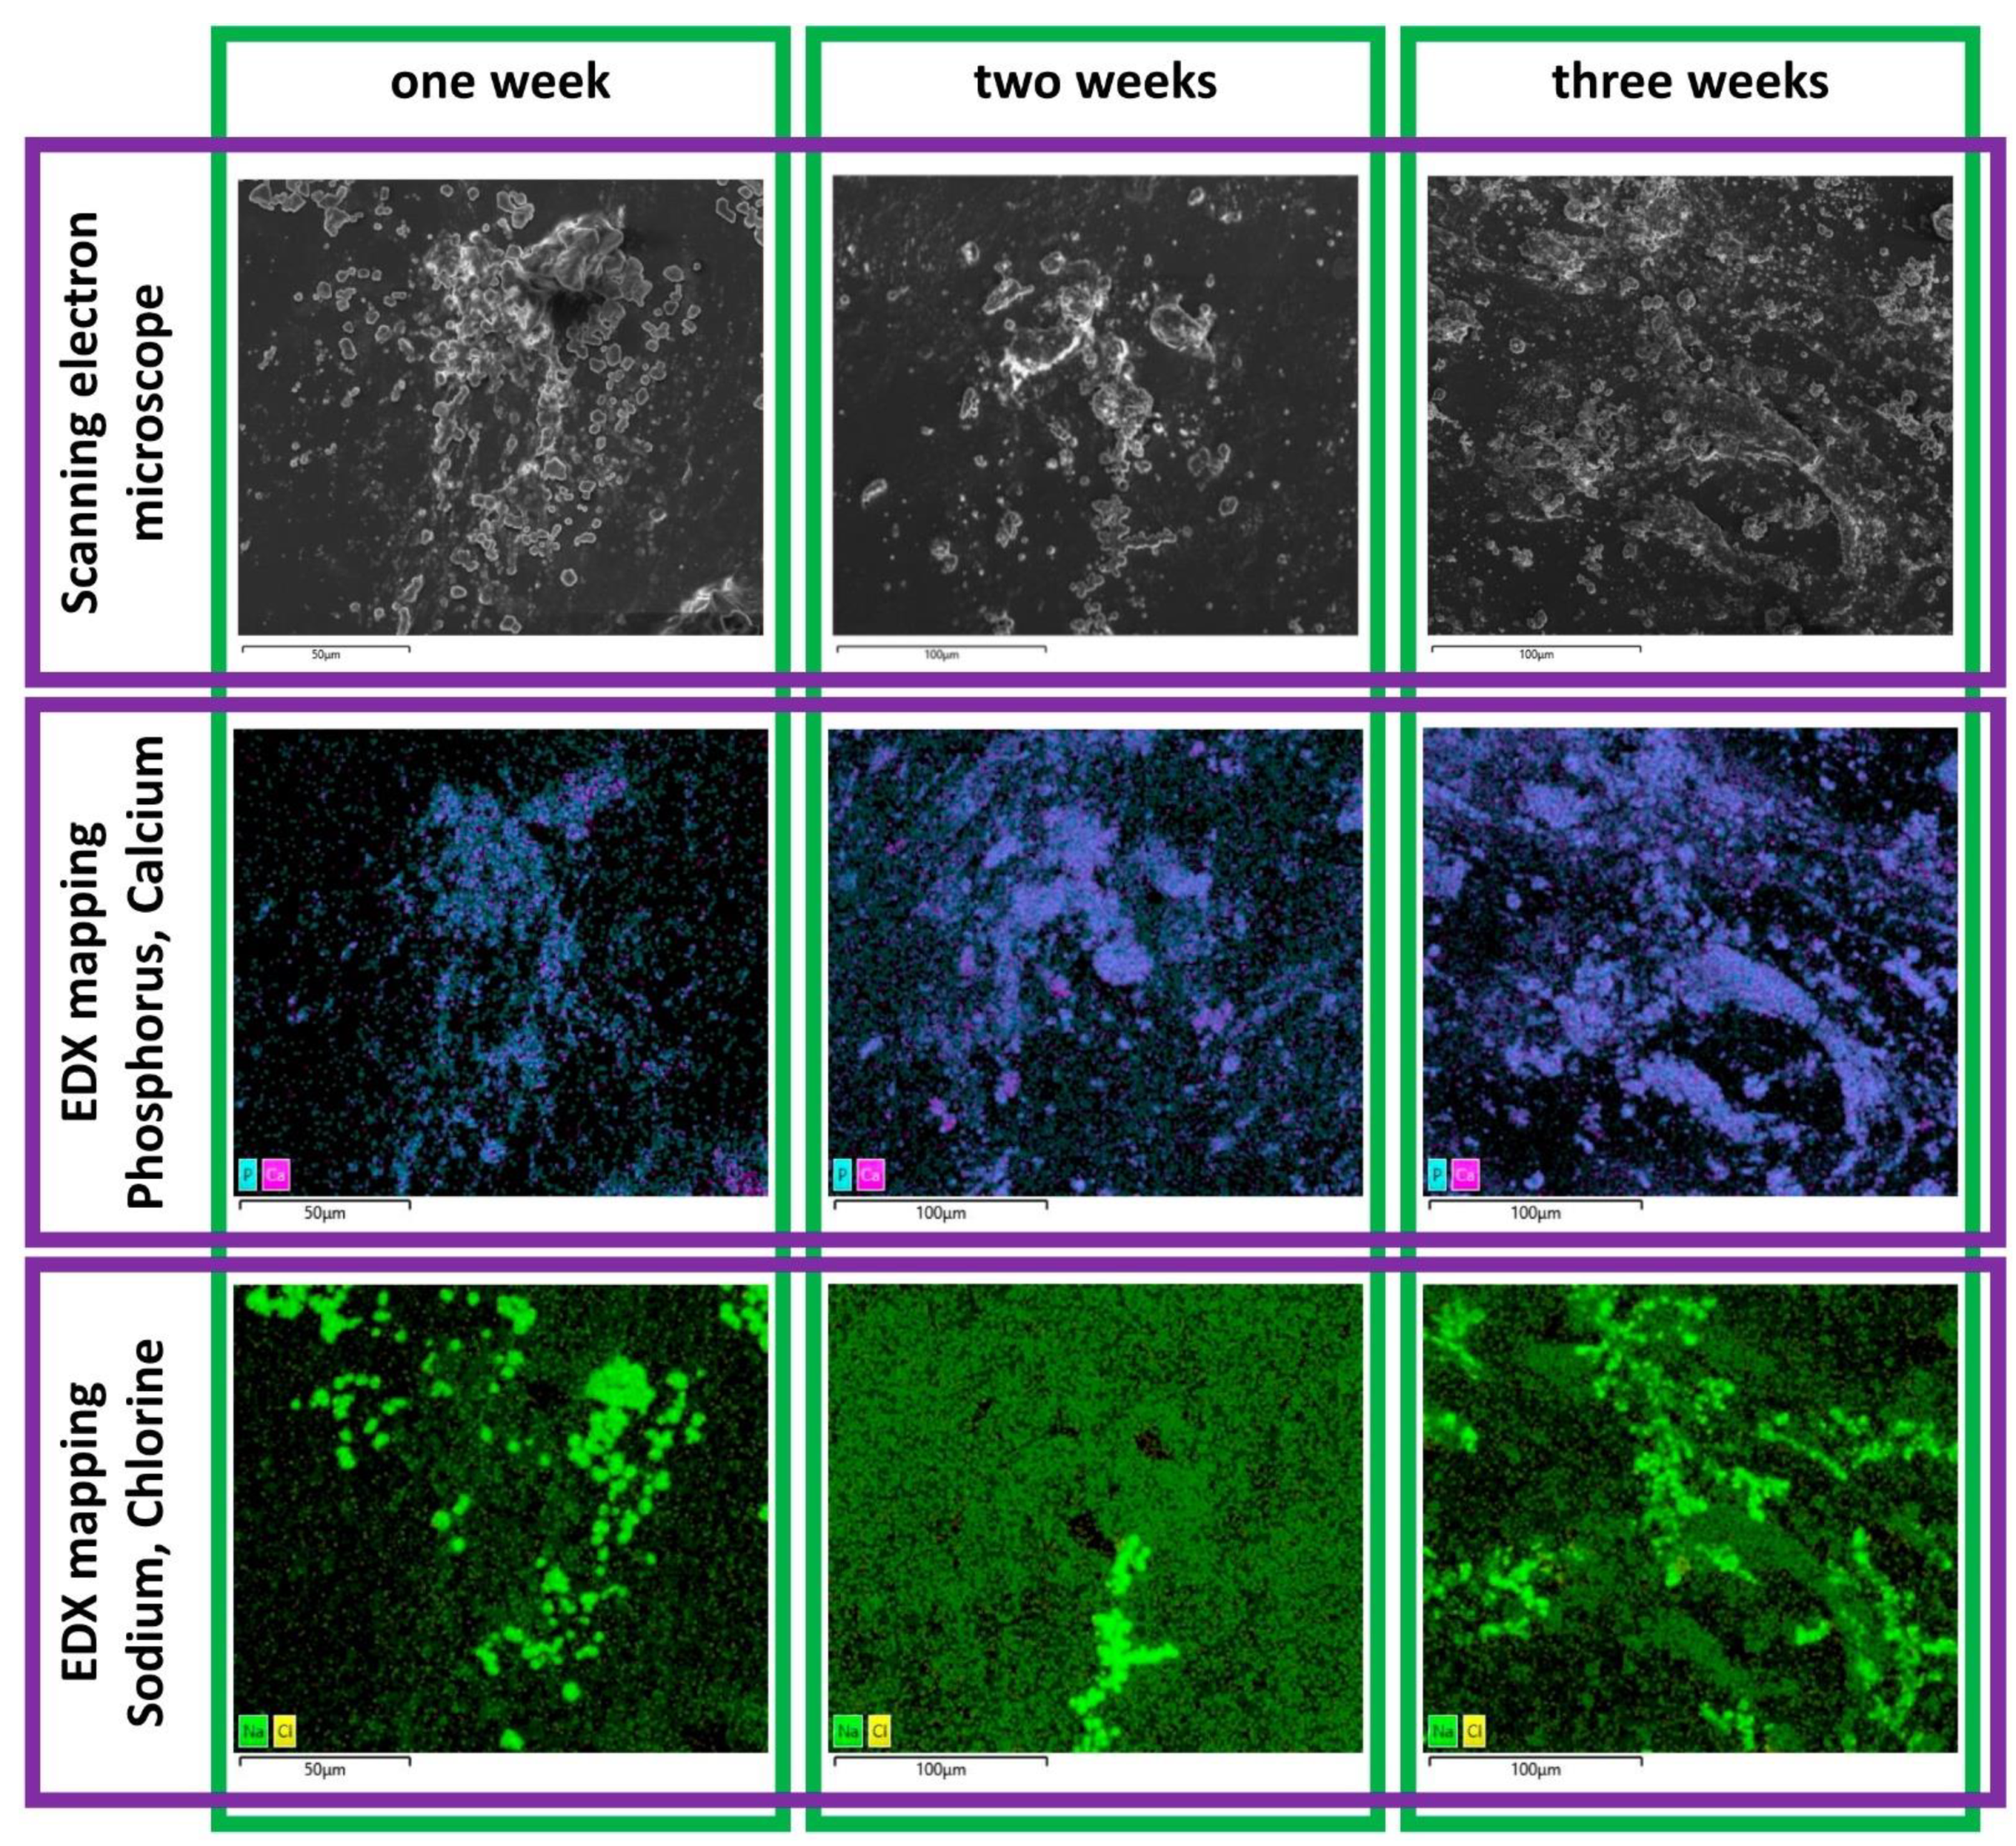
24]. We performed an SEM/EDX test on our samples to address this issue, and establish whether
99mTc-HDP labeling is capable of marking actual hydroxyapatite.
The elemental distribution revealed two categories of structures. The cubic, crystalline-shaped structure with the presence of the elements Na and Cl indicated crystallized sodium chloride. The structure consisting mainly of the elements Ca, P and O indicated the generation of a calcium phosphate. With regards to the setup of the mineralization study, this finding can be interpreted as the presence of hydroxyapatite. The evaluated elemental ratio in this area of Ca/P 1.16–1.53 was in a comparable range for human bone, which was reported to be 1.39–1.62 [
25]. The determined increasing elemental ratio of Ca/P from Week 1 to Week 3 could be related to the different status of mineralization, as reported by Prati et al. [
26]. Overall, these findings can be interpreted as successful osteogenesis.
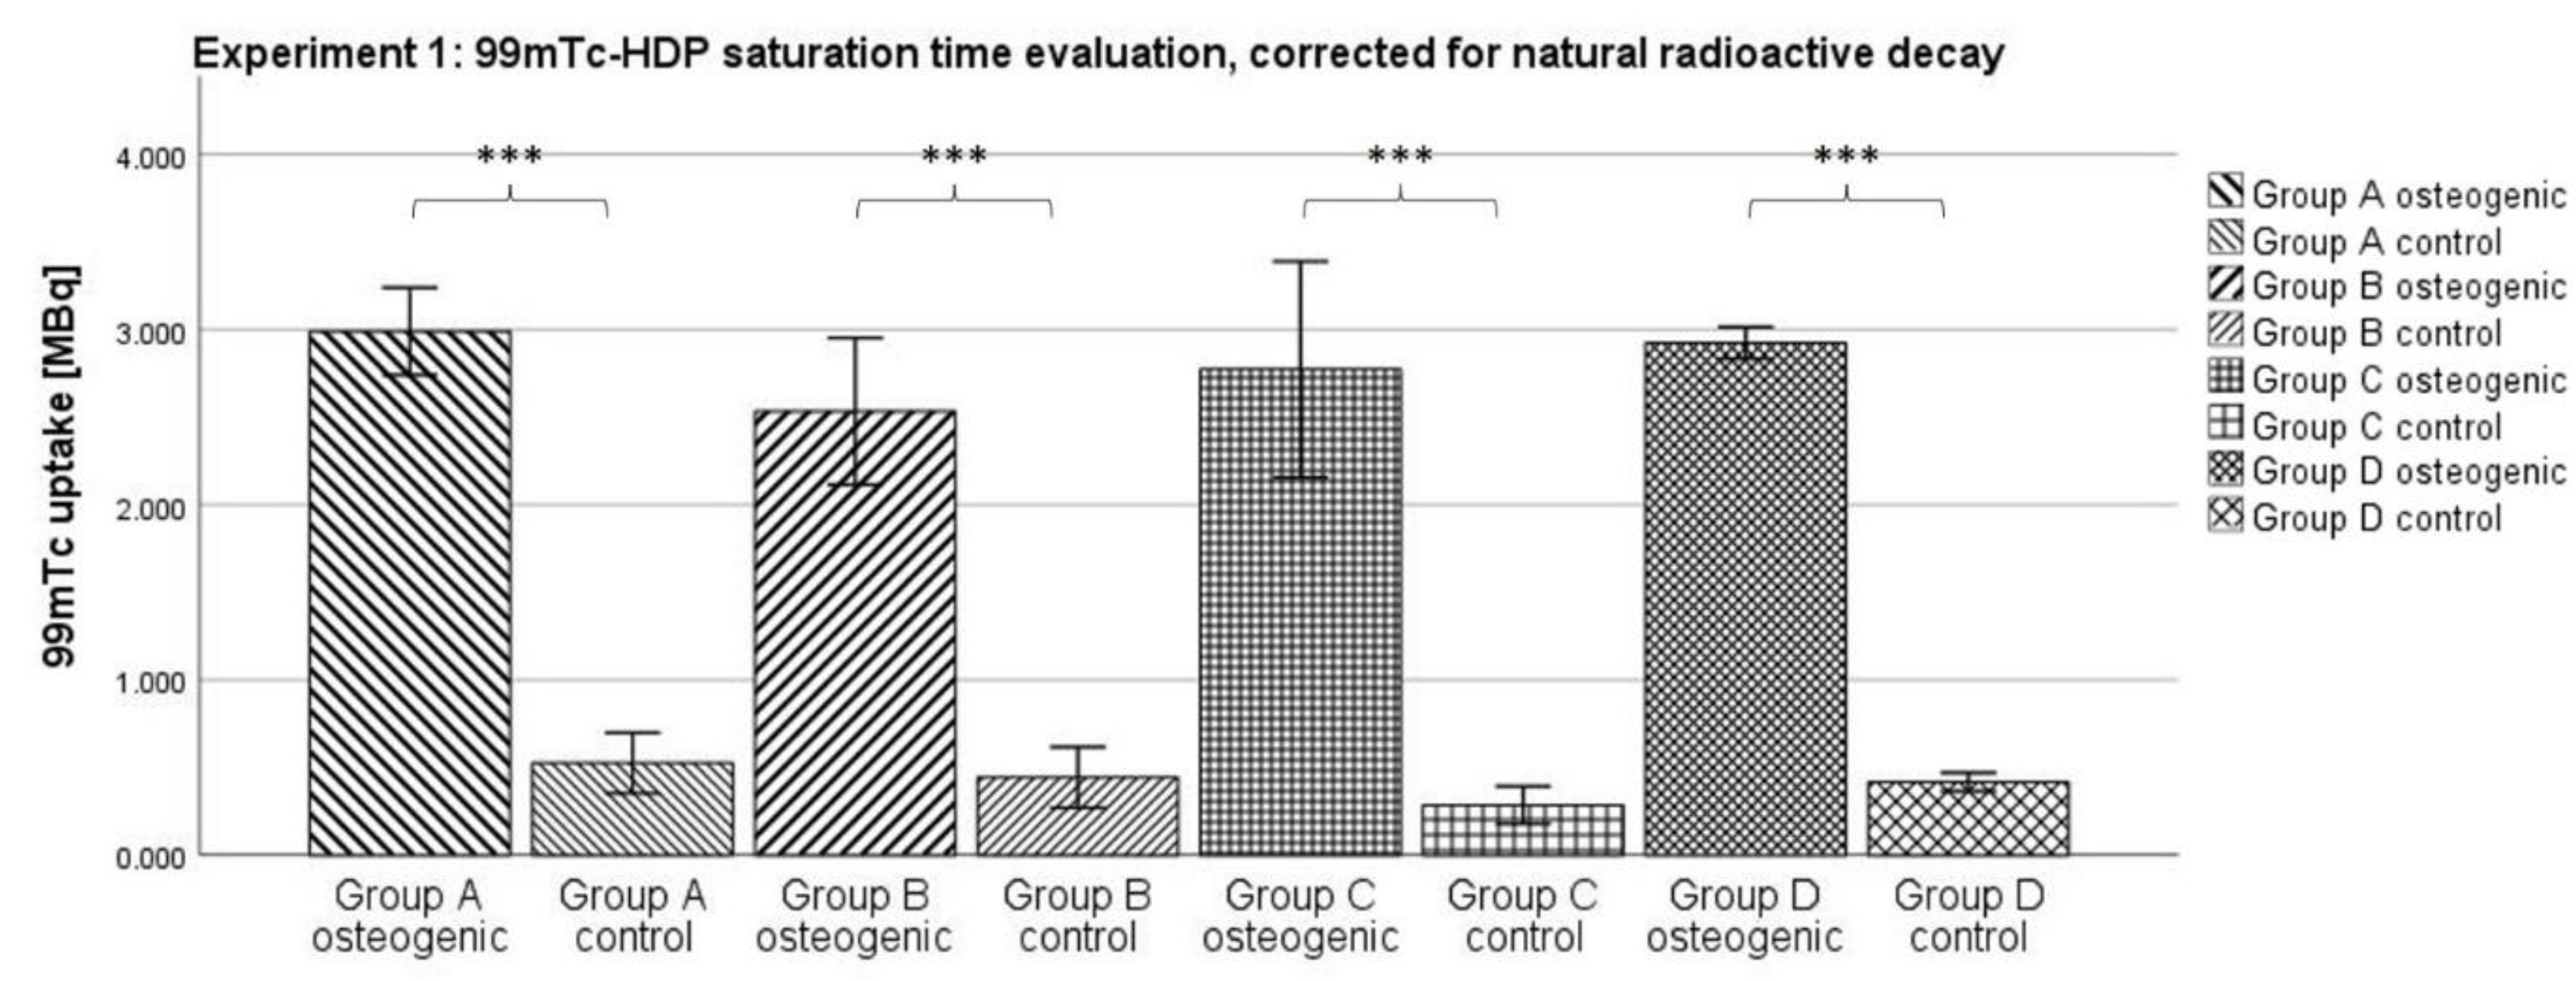
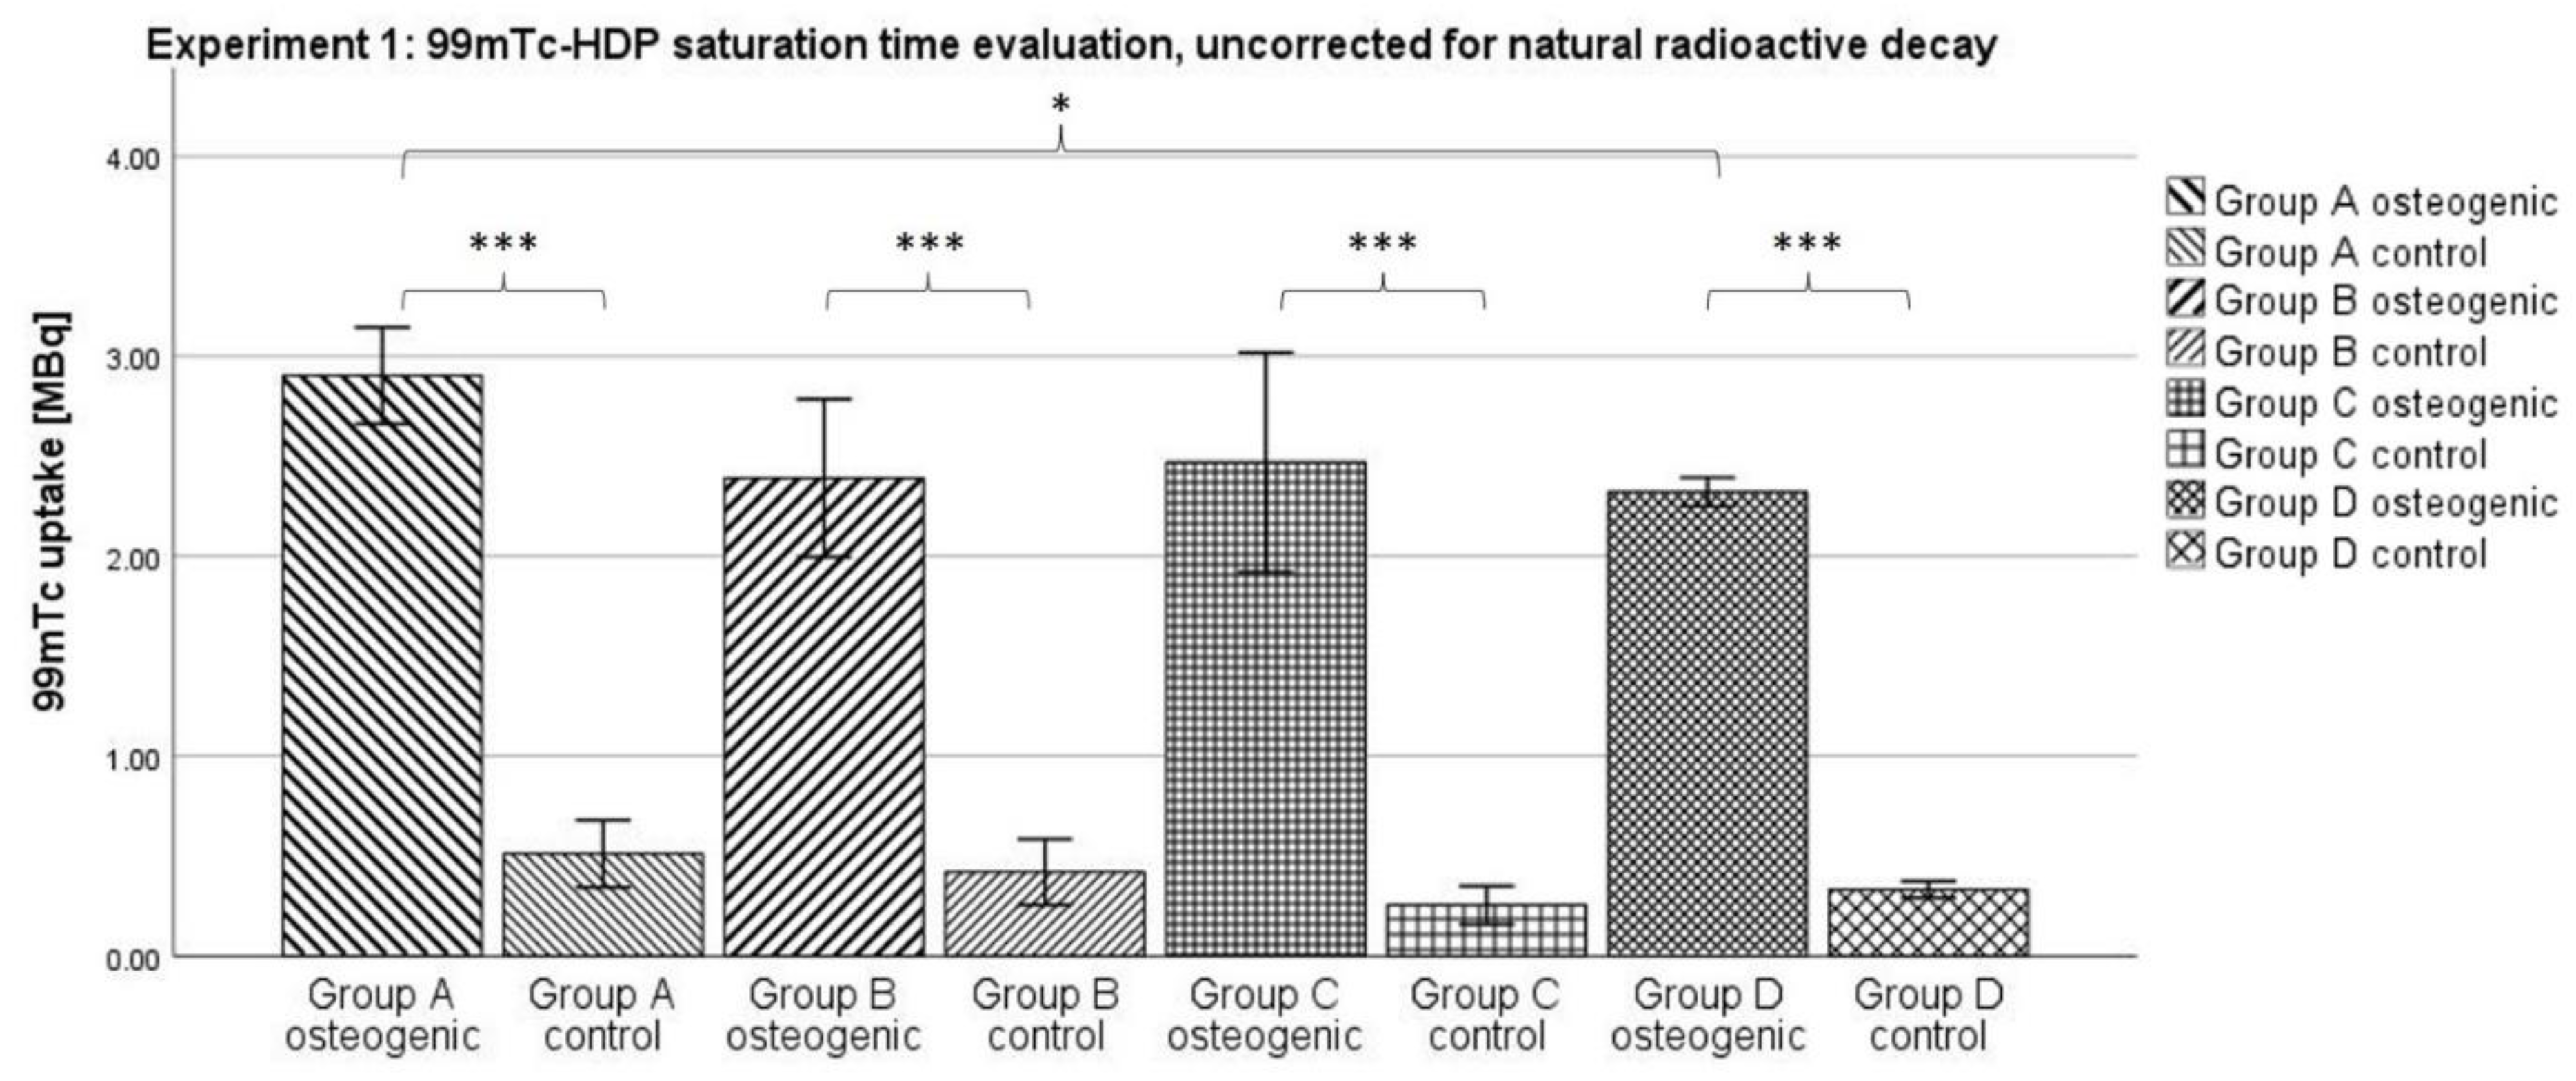
3.1. Experiment 1: 99mTc-HDP Saturation Time Evaluation
When testing for the saturation time, no significant difference between any two of the osteogenic groups could be shown. Naturally, the uptake declined with time; due to the relatively short half-life of
99mTc of 6 h, a substantial amount of radionuclide was lost to natural decay over the longest incubation time of 2 h, compared to the shortest of 0.25 h. However, all osteogenic groups showed similar uptakes after correcting for this effect. It seems that after an incubation time of 0.25 h, any additional time does not result in the binding of any additional radionuclide to the hydroxyapatite. Instead, the reaction takes place within the first 0.25 h. These findings correlate well with a study by Yoichi Okamoto who found that the full adsorption of
99mTc-HDP occurs within the first 0.5 h after exposure [
27].
The incubation time might even be shorter than 0.25 h and further experiments are needed to determine that. In clinical settings, skeletal scintigraphy is performed by taking images at three distinct time points: immediately after injection, after 2–10 min, and then again after 2–4 h. However, this practice is due to the distribution of the tracer in vivo, and is unrelated to the actual binding of the tracer to hydroxyapatite [
28].
Using an incubation time of just 0.25 h makes the method of 99mTc-HDP labeling even more efficient, and allows living cell cultures to be labeled more safely since they only need to be taken out of culture for a short period of time.
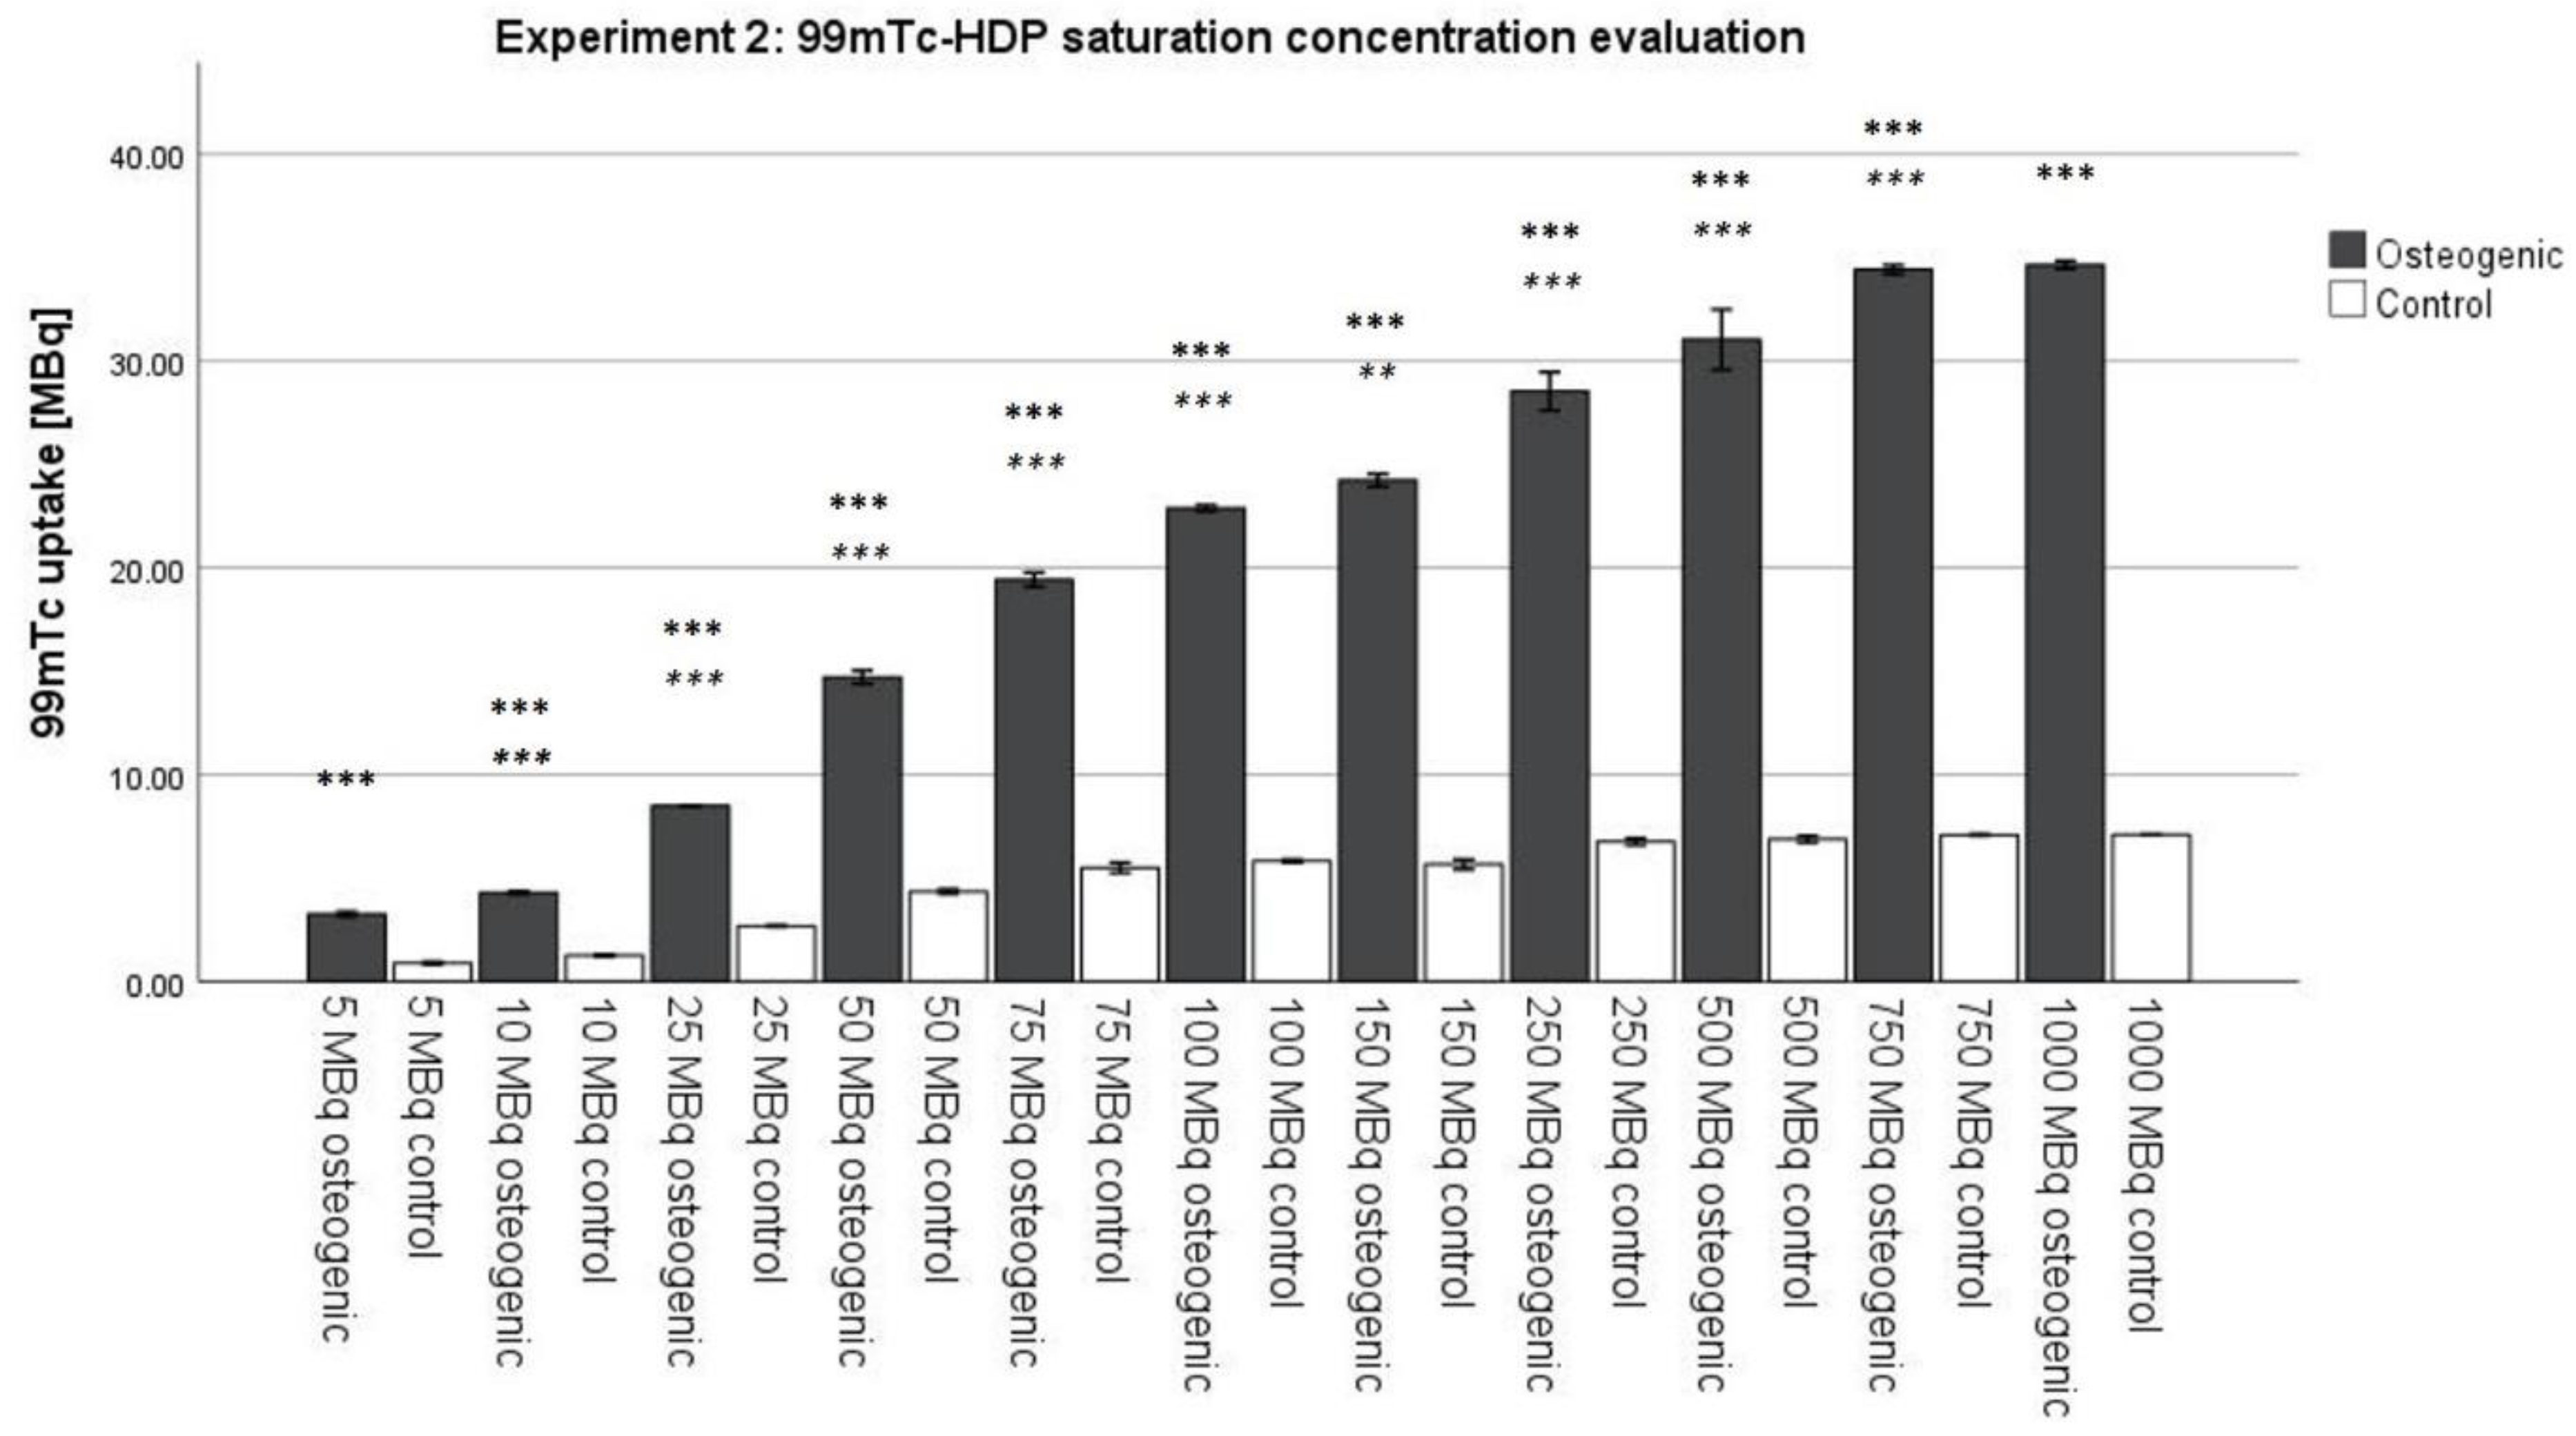
3.2. Experiment 2: 99mTc-HDP Saturation Concentration Evaluation
Similar to the incubation time of 2 h, until now, a standard initial activity of 5 MBq was routine for
99mTc-labeling. Our results showed that this activity is far too low when trying to achieve full saturation of the cell culture. Each osteogenic group was significantly different from the one receiving less activity up to the point of 1000 MBq of initial activity, which showed a significantly different uptake compared to the group receiving 750 MBq. Therefore, full saturation is reached somewhere between 750 MBq and 1000 MBq initial activity. The exact amount needs to be determined in further experiments. For an absolute quantification of hydroxyapatite, much higher activities (around 1000 MBq) need to be used. This is an extremely high amount of activity; almost double the amount the European Association of Nuclear Medicine recommends for skeletal scintigraphy [
29]. Relative quantifications are, however, still possible with lower activities since they only require that all samples receive the same amount of initial activity. For most scientific questions, it is sufficient to establish the relative relationship between two or more groups. Our findings are limited by the fact that the saturation concentration strongly depends on the size of the cell culture. A high number of cells used for the experiment or osteogenically very potent cells may result in high amounts of hydroxyapatite formed, and thus require higher amounts of
99mTc-HDP to achieve saturation [
30]. Whether there is a generalizable correlation between cell culture size, osteogenic potential of the cells, and saturation concentration should be investigated in further experiments.
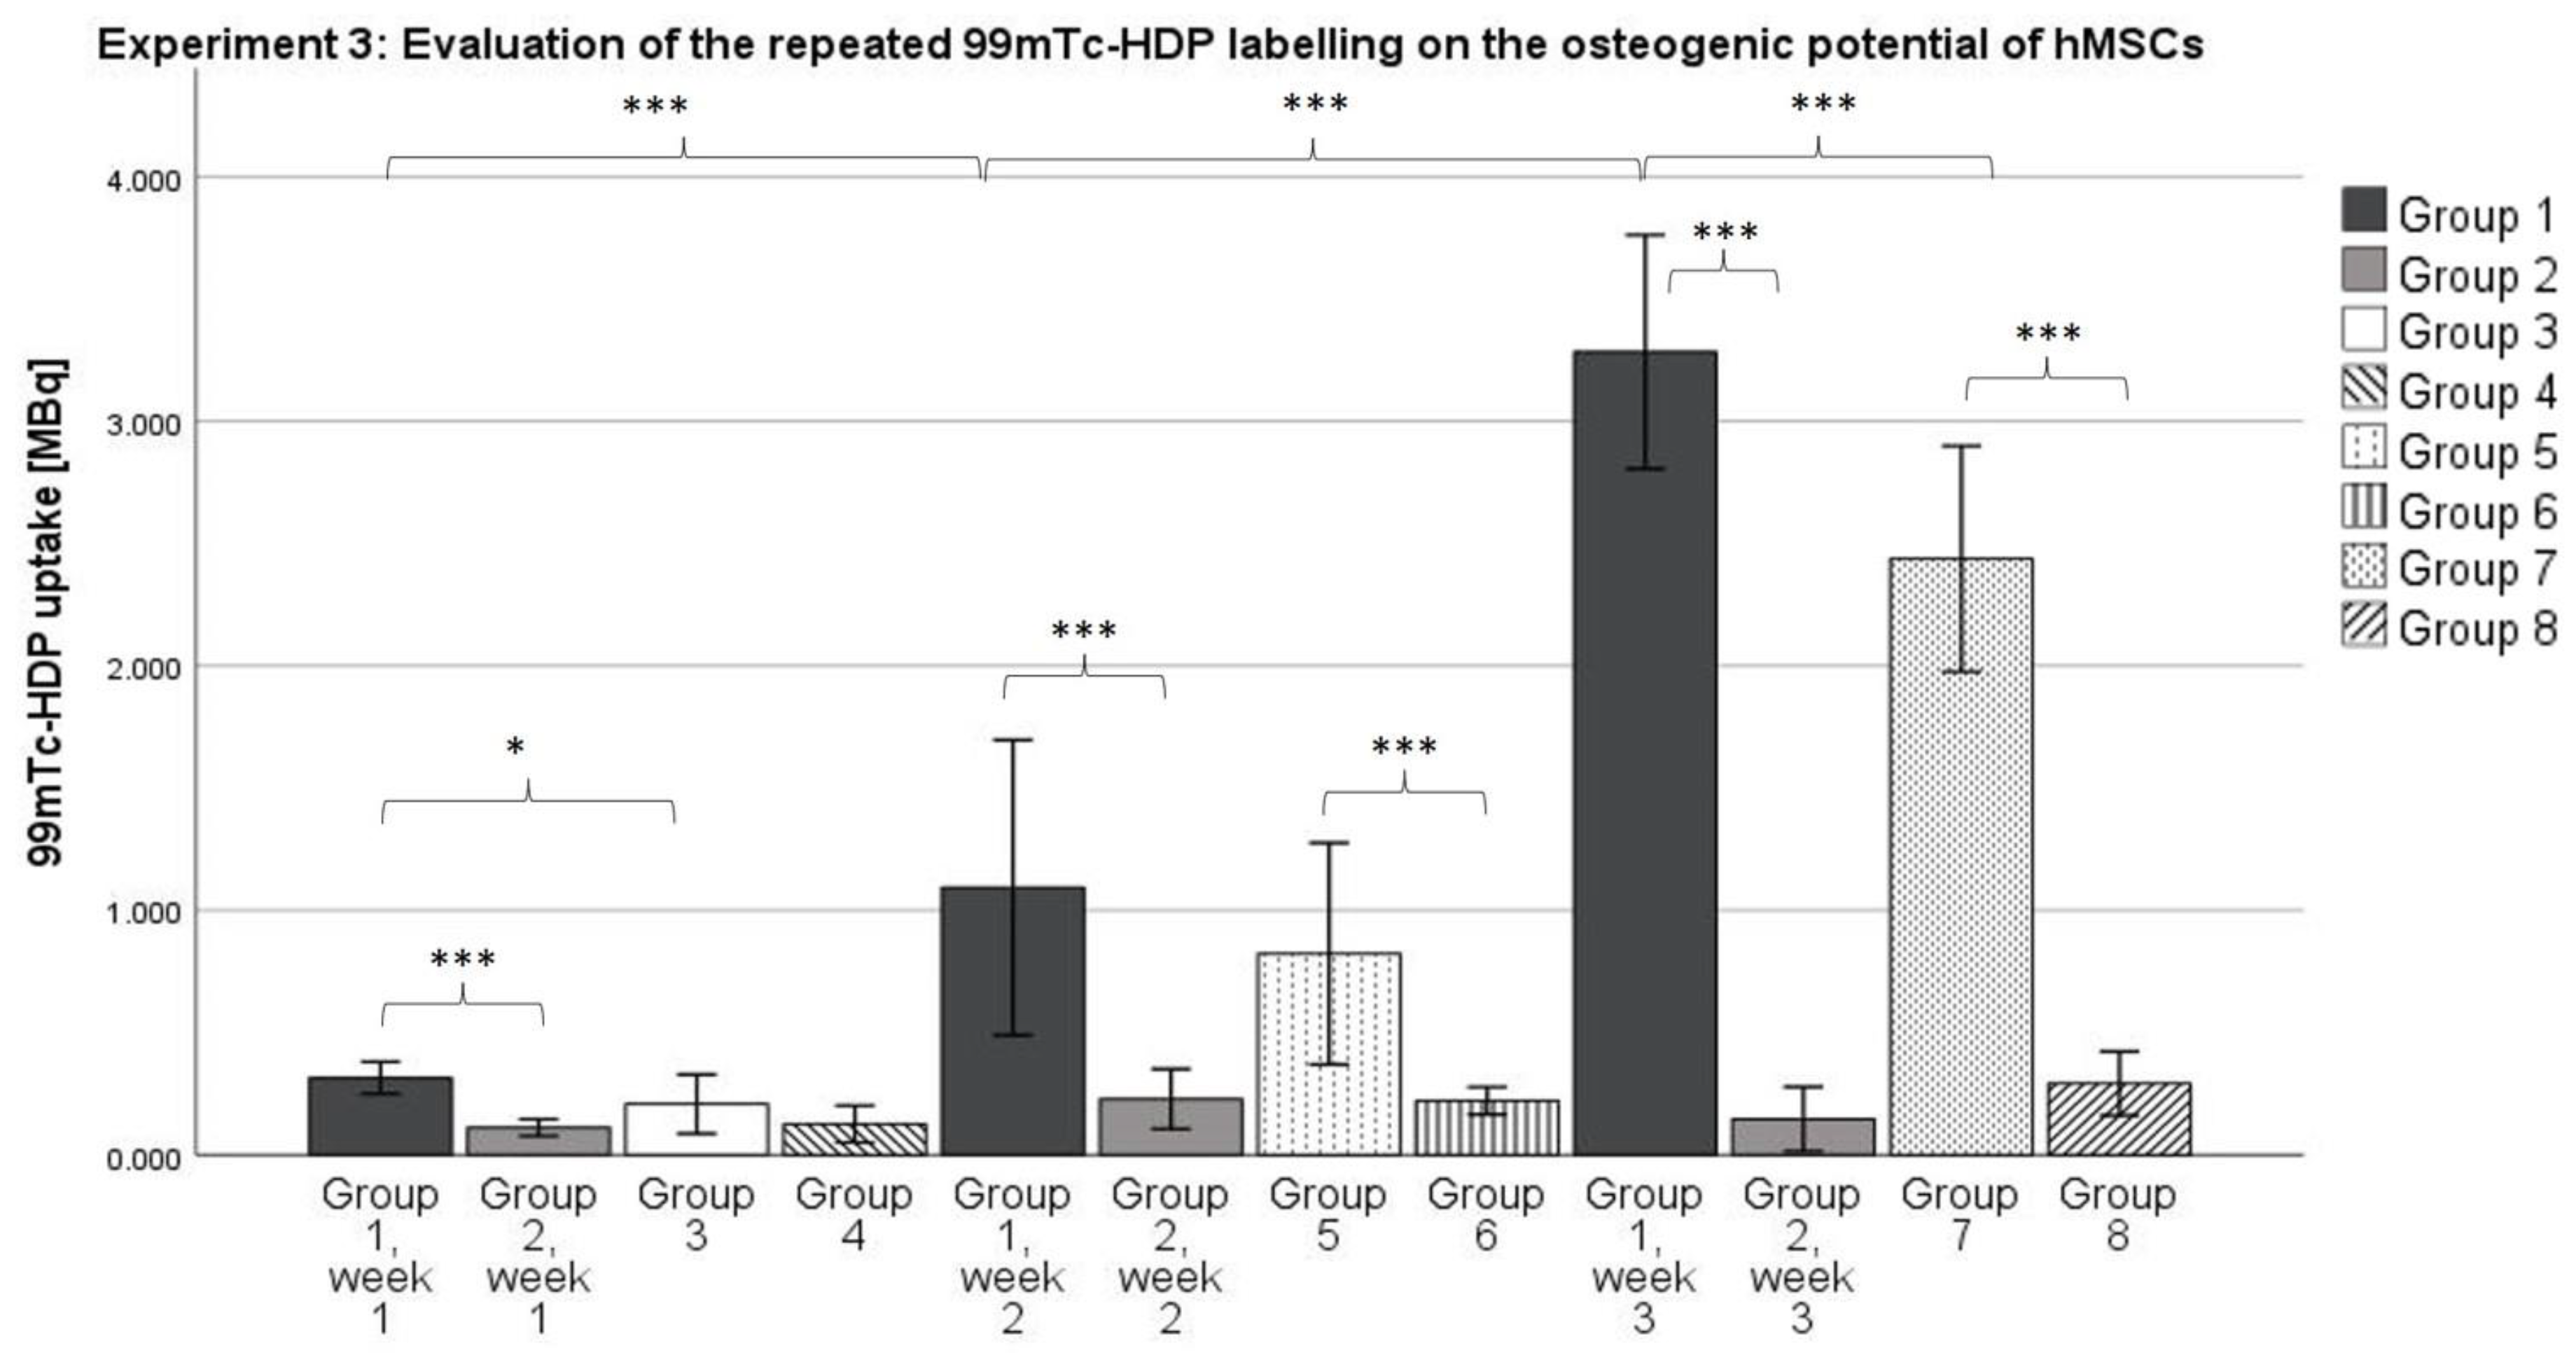
3.3. Experiment 3: Evaluation of the Repeated 99mTc-HDP Labeling on the Osteogenic Potential of hMSCs
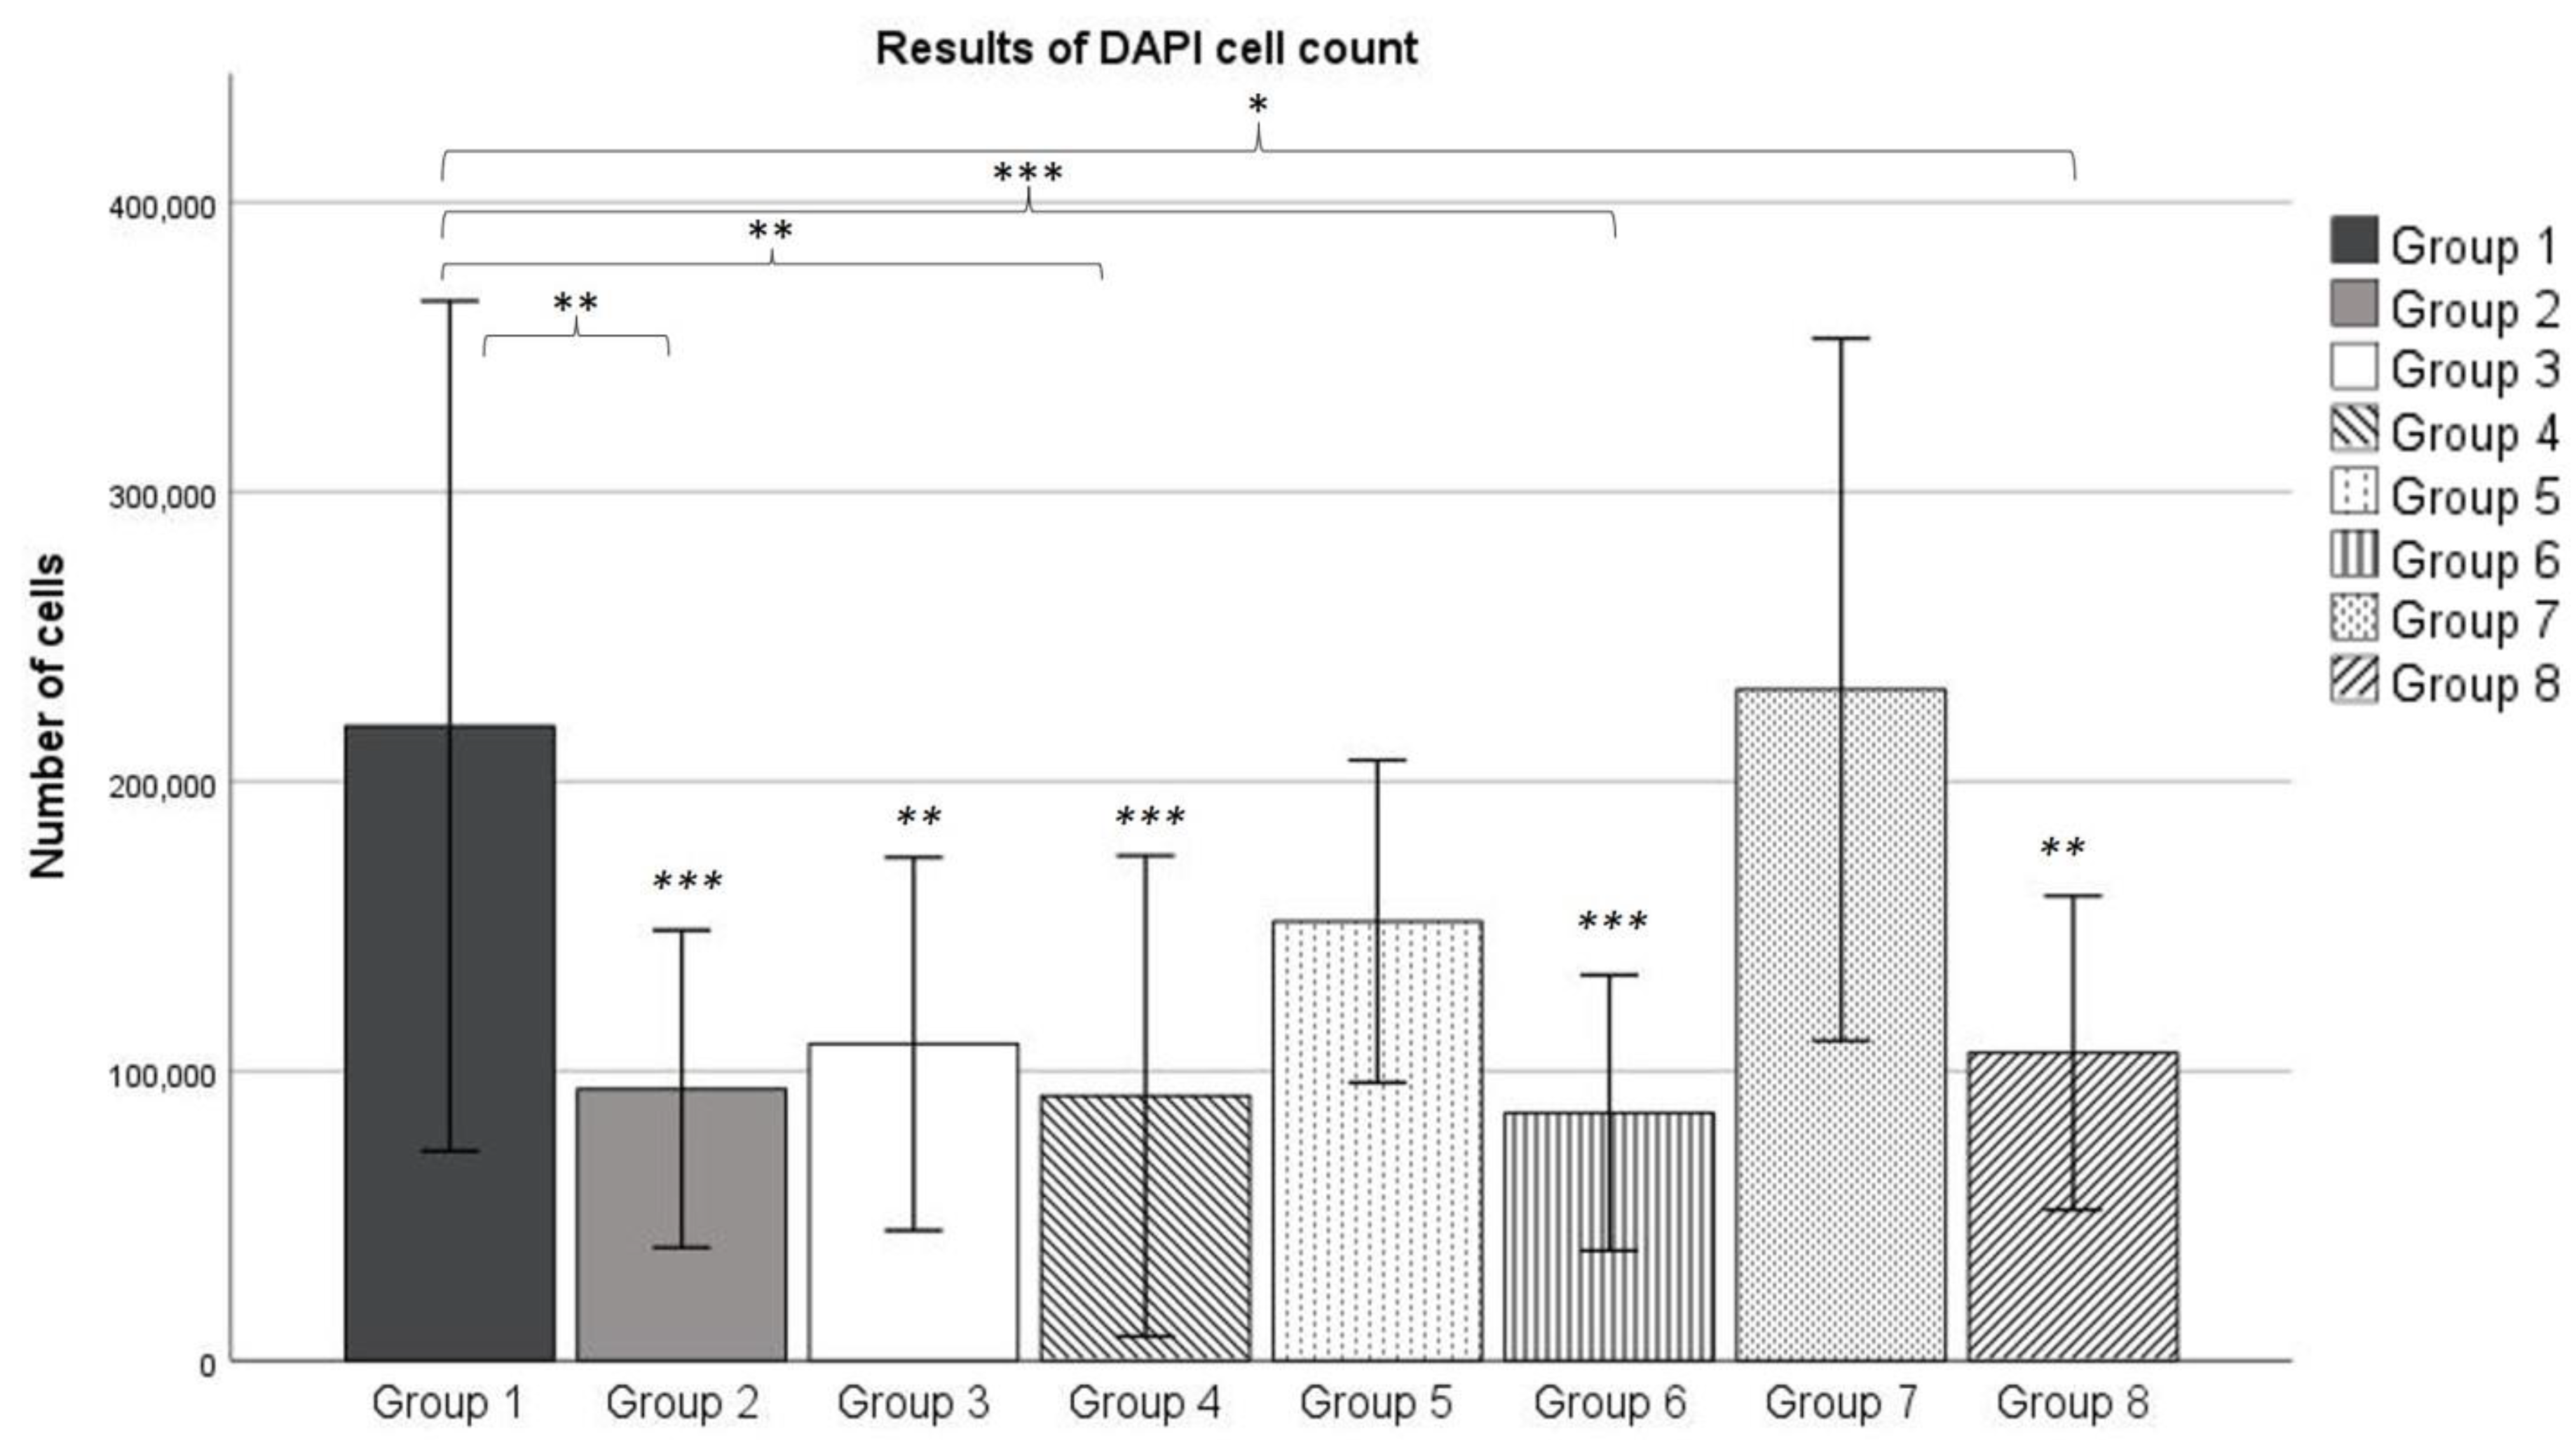
Considering the data we revealed, it can be stated that a significant difference between the osteogenic group and the control group can already be measured after 1 to 2 weeks (see differences between Groups 1 and 2 after 1 week, and 5 and 6 after 2 weeks) using the 99mTc Labeling method. This is highly beneficial for further experiments because it means that a shorter runtime of the experiments of only 1 to 2 weeks would be required to proof the differentiation toward the osteogenic lineage instead of 3 weeks.
Group 1 showed a higher mean uptake compared to Group 2 for all time points, although this difference was only statistically significant in Week 1 (p ≤ 0.05) and Week 3 (p ≤ 0.001). It seems that the repeated labeling with 99mTc-HDP does not result in a diminished osteogenic potential of the cell culture. Rather, Group 1 showed a higher osteogenic potential. This is particularly striking since all groups used cells from the same donors, so inter-donor differences cannot explain differences in osteogenic potential.
After 3 weeks of incubation, the DAPI cell count revealed no significant difference between the number of cells in Group 1 and Group 7. This reveals that the exposure to
γ radiation emitted by technetium does not result in a diminished number of living cells. These results match findings which showed that low-dose ionizing radiation has no significant effect on MSC viability up to doses of 50 mGy [
31].
Over the course of 3 weeks, the number of cells increased each week for the osteogenic Groups 3, 5 and 7. This increase was large enough for Group 7 to show a significantly higher number of cells, compared to Group 3. At the same time, the number of cells within the control groups remained relatively stable over the observed period of time. However, each osteogenic group showed a higher number of cells counted compared to its corresponding control group, although this effect was only statistically significant for Group 1 (compared to Group 2) and Group 7 (compared to Group 8) according to the ANOVA analysis. Both this effect and the continuously increasing number of cells in the osteogenic groups could be explained by the influence of dexamethasone. Dexamethasone is known to have an effect on the proliferation of MSCs. Wang et al. found that small doses of dexamethasone promote proliferation in MSCs isolated from umbilical cords [
32]. This effect occurred for doses in the order of 10–9 mol/L, which is exactly the concentration we used for osteogenic differentiation (100 nM, see
Section 4.4). Therefore, it can be assumed that dexamethasone also promoted differentiation in MSCs isolated from bone marrow.
The limited exposure to
γ radiation does not seem to adversely affect the osteogenic potential of MSCs. The relatively short half-life of
99mTc might play a role in this since the amount of activity is quite quickly reduced to background radiation levels. On the other hand, limited doses of
γ radiation are known to stimulate the proliferation of mesenchymal stem cells from mouse brains, up to a dose of 100 mGy [
33]. However, at the end of the 3-week differentiation period, the cell count revealed no significant difference between Groups 1 and 7. Therefore, the higher osteogenic potential of Group 1 cannot be explained by a higher number at the end of the differentiation period. However, it might be the case that the
γ-radiation accelerated the proliferation in the early stages of differentiation, which would mean more cells earlier on, resulting in a higher osteogenic potential. Still, repeated labeling also means that cell cultures need to survive out of culture conditions for a prolonged time. This is because
99mTc-HDP labeling requires the removal of cell culture media for washing purposes, and is often performed at room temperature since incubators suitable for radioactive samples are not always available in close proximity to
99mTc generators. The fact that MSCs can exist out of culture conditions is supported by other studies which have found that MSCs can survive at room temperature, and without culture media for a limited amount of time [
34].
3.4. Conclusion Summary
In conclusion, our data strongly confirm 99mTc-HDP labeling as a simple, reliable and sensitive method to assess osteogenesis in vitro. We defined a new standard for the incubation time, as we found that 0.25 h or less is sufficient for the tracer to bind to hydroxyapatite. The saturation of the cell culture for an absolute quantification of hydroxyapatite requires very high initial activities of around 1000 MBq, but semi-quantitative measurements using lower activities are usually sufficient for daily laboratory routines. What effect these high activities have on the cell culture is not yet clear, but we found that repeated labeling with 5 MBq at room temperature does not adversely affect the osteogenic potential, or cell number of MSC cell cultures. Consequently, 99mTc-HDP labeling can be used for “milestone evaluations”, i.e., the assessment of osteogenesis during an ongoing cell culture. With that, 99mTc-HDP would be a very valuable method for BTE as it would enable the development of innovative osteo-regenerative therapies.
4. Materials and Methods
4.1. Study Design at a Glance
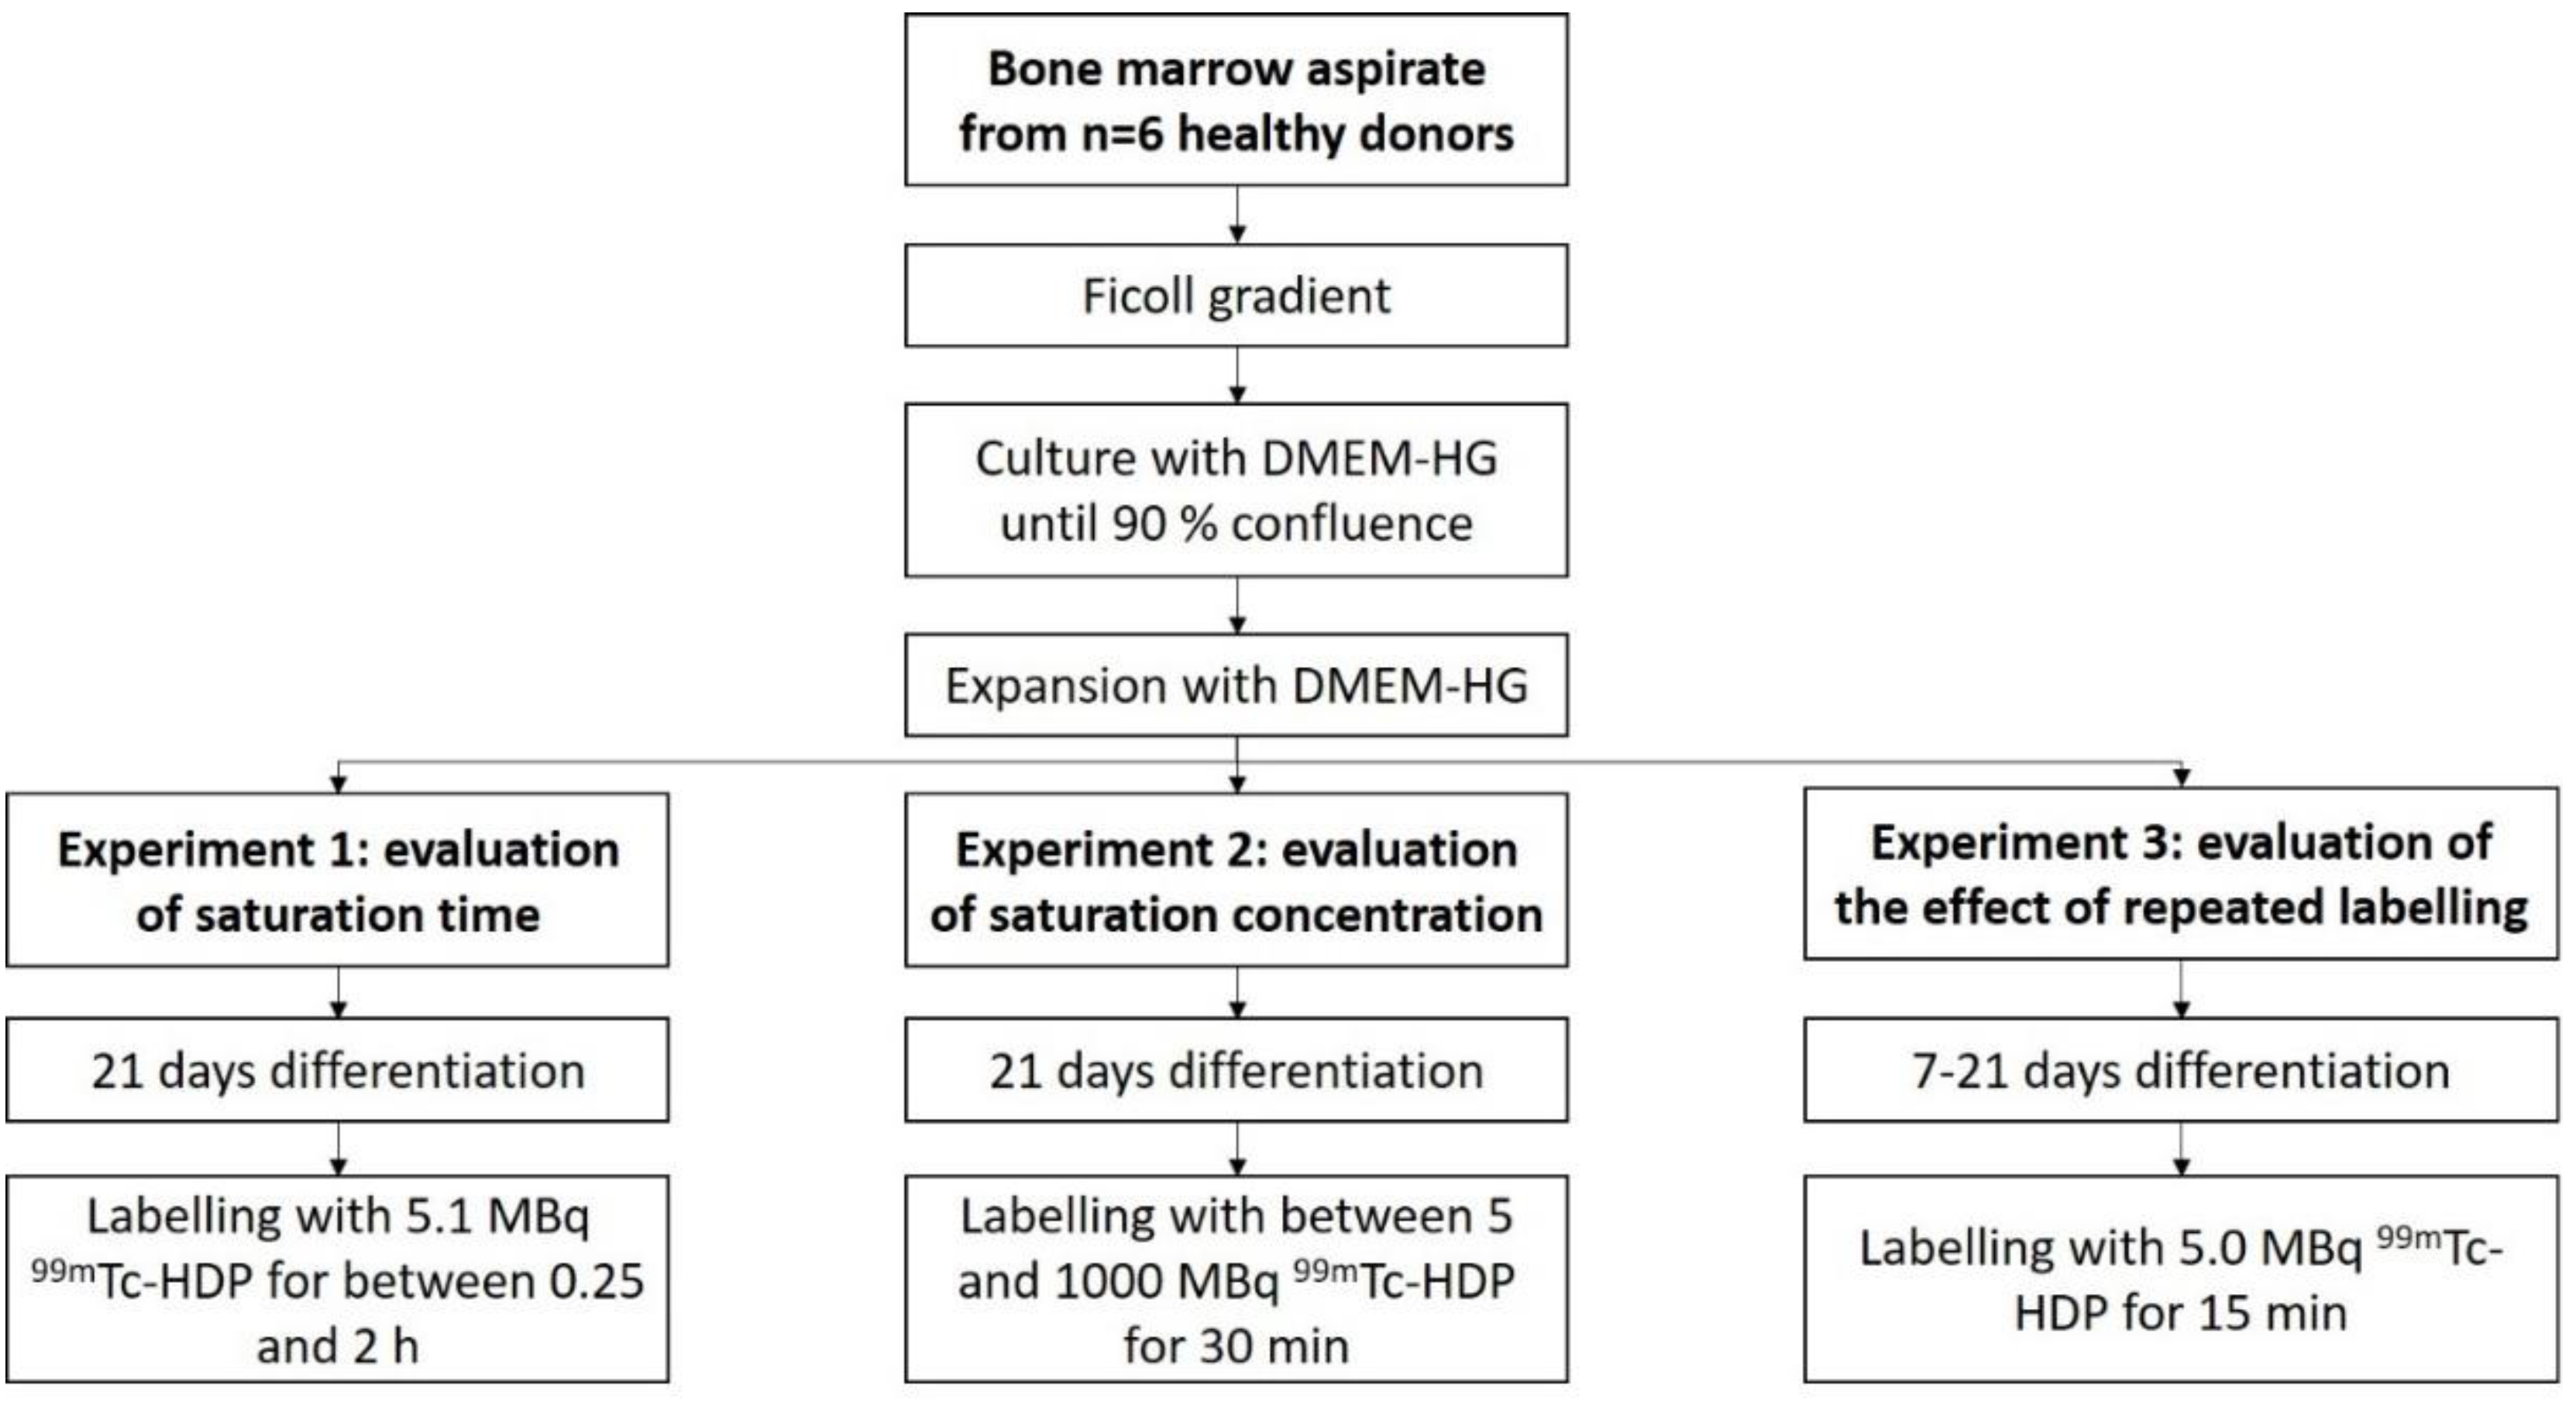
Bone marrow aspirate from n = 6 healthy donors was obtained from the proximal femoral cavity. The mononuclear cell fraction was then isolated by a Ficoll gradient. Next, monoclonal cells were expanded in T-150 polystyrene tissue culture flasks using DMEM-HG until 90% confluence was achieved. Cells were then subsequently expanded until a sufficient number of cells was reached.
For each donor, cells were then seeded with a density of 10,000 cells/cm2 in 38 35-mm flat-bottom Petri dishes, and received DMEM-LG as media. Cells in half of these dishes were differentiated osteogenically using the osteogenic supplements L-ascorbic acid, dexamethasone, and β-glycrol phosphate. The other half served as control and received only DMEM-LG.
The dishes of each donor were then split for the three experiments: 1.
99mTc-HDP saturation time evaluation (8 dishes), 2.
99mTc-HDP saturation concentration evaluation (22 dishes) and 3. evaluation of the effect of repeated
99mTc-HDP labeling on the osteogenic potential of hMSCs (8 dishes) (see
Figure 7).
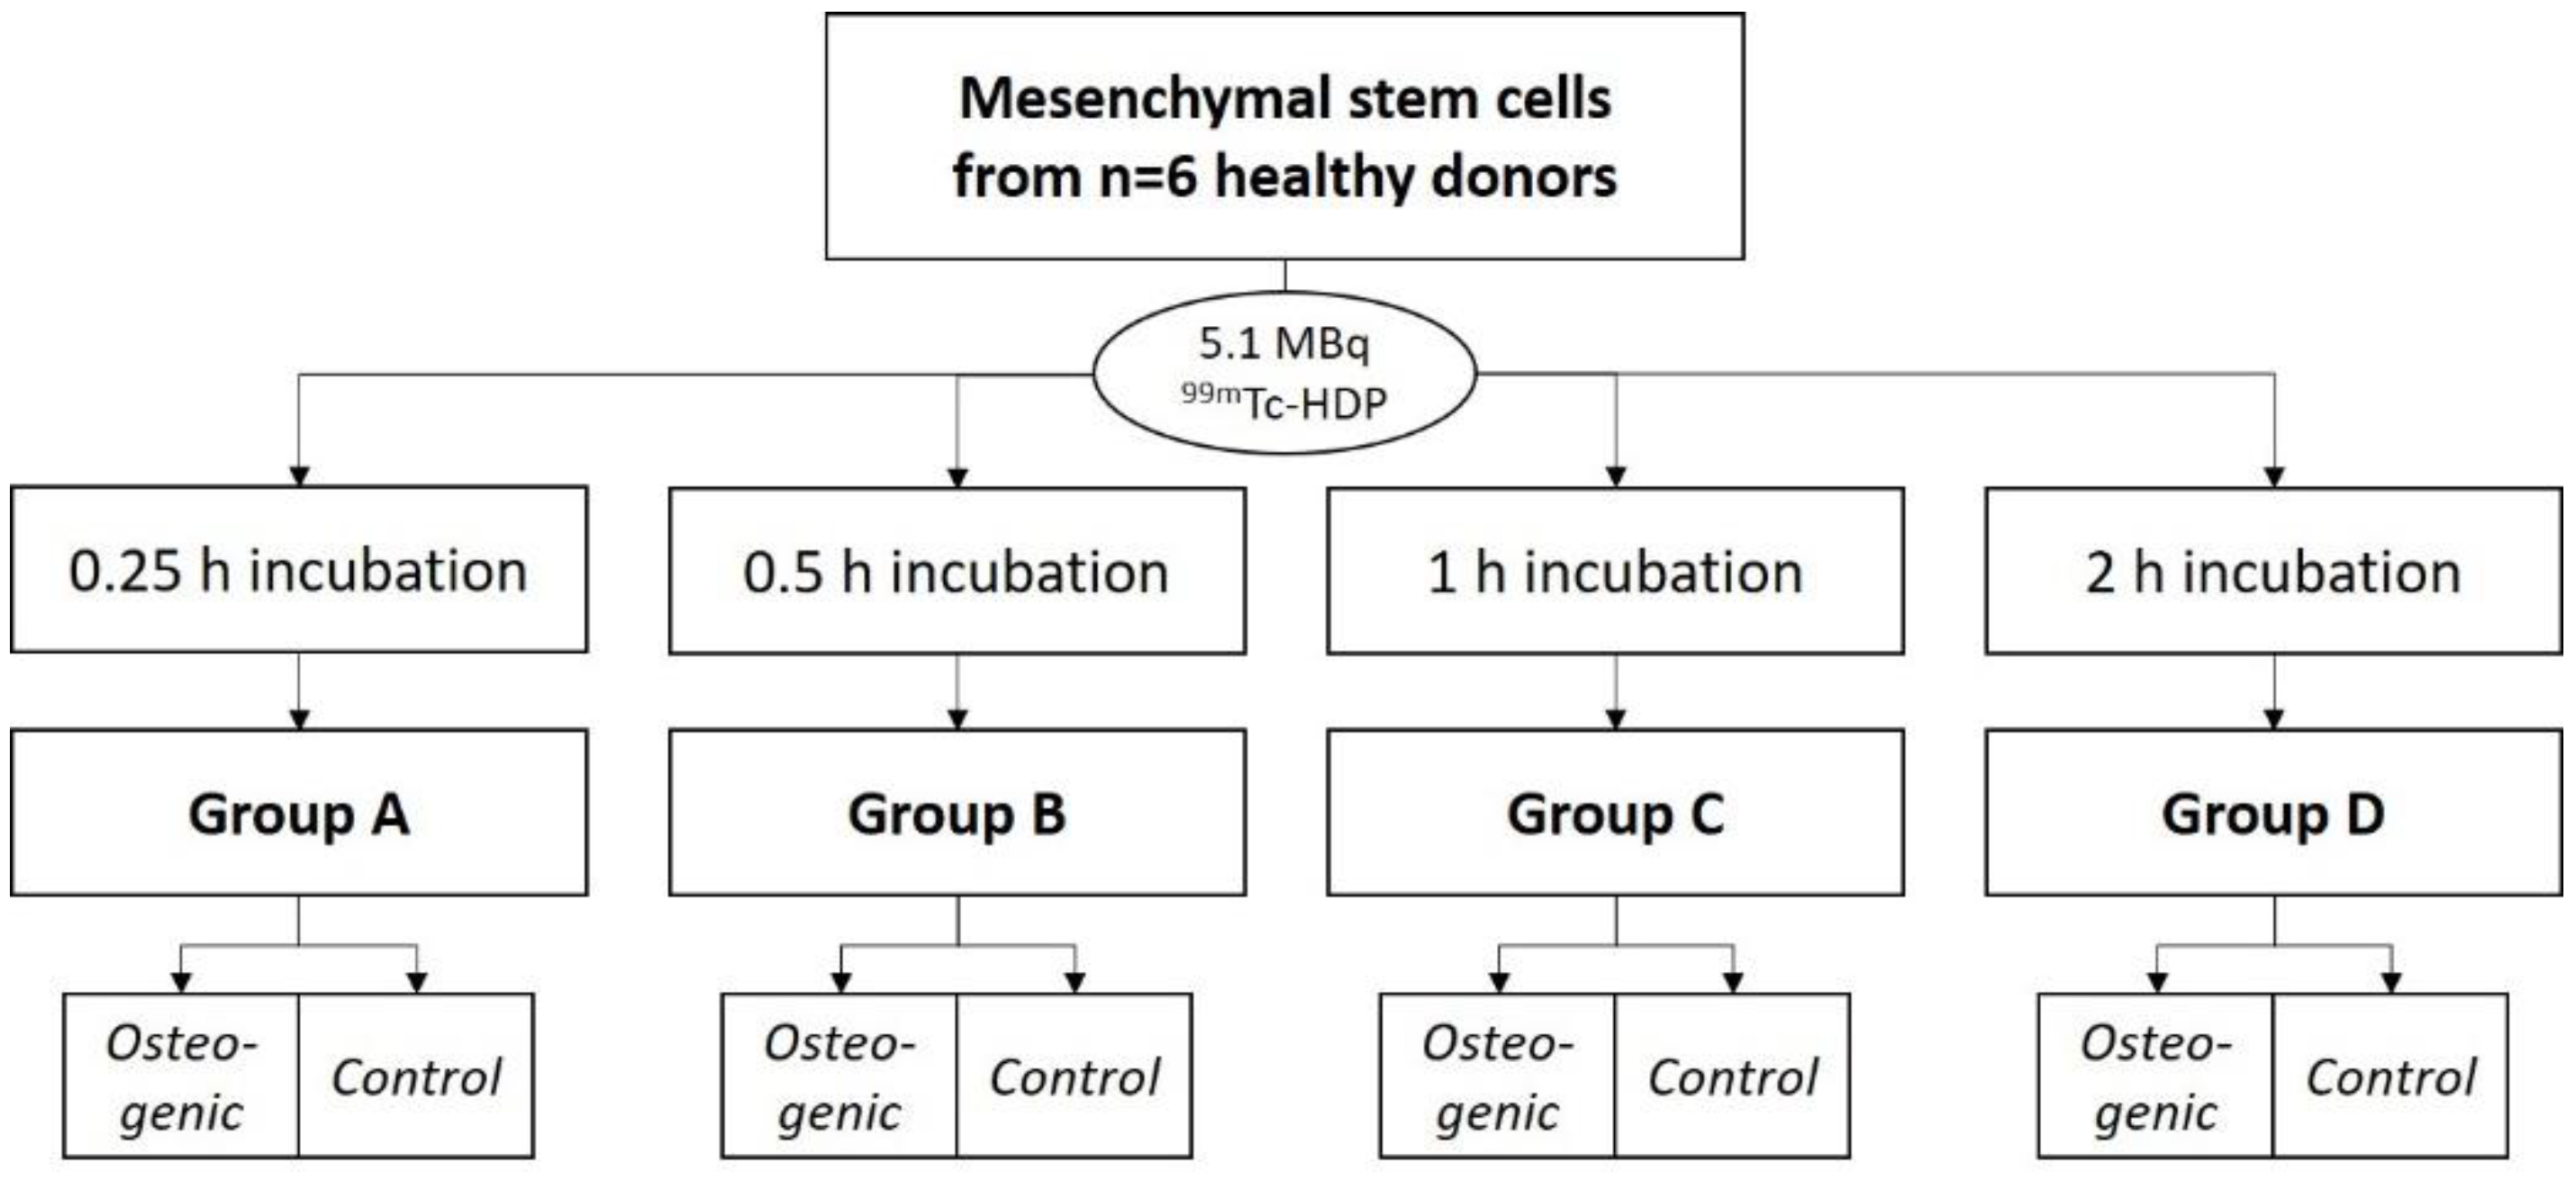
Experiment 1:
To evaluate the saturation time, the cells were differentiated for 3 weeks. They were then labeled with 99mTc-HDP. For that, each dish received 5.1 MBq of activity in 1 mL 0.9% NaCl, and was incubated at room temperature. Group A was incubated for 0.25 h, Group B for 0.5 h, Group C for 1 h, and Group D for 2 h. After incubation, the dishes were washed with PBS, and bound activity was measured.
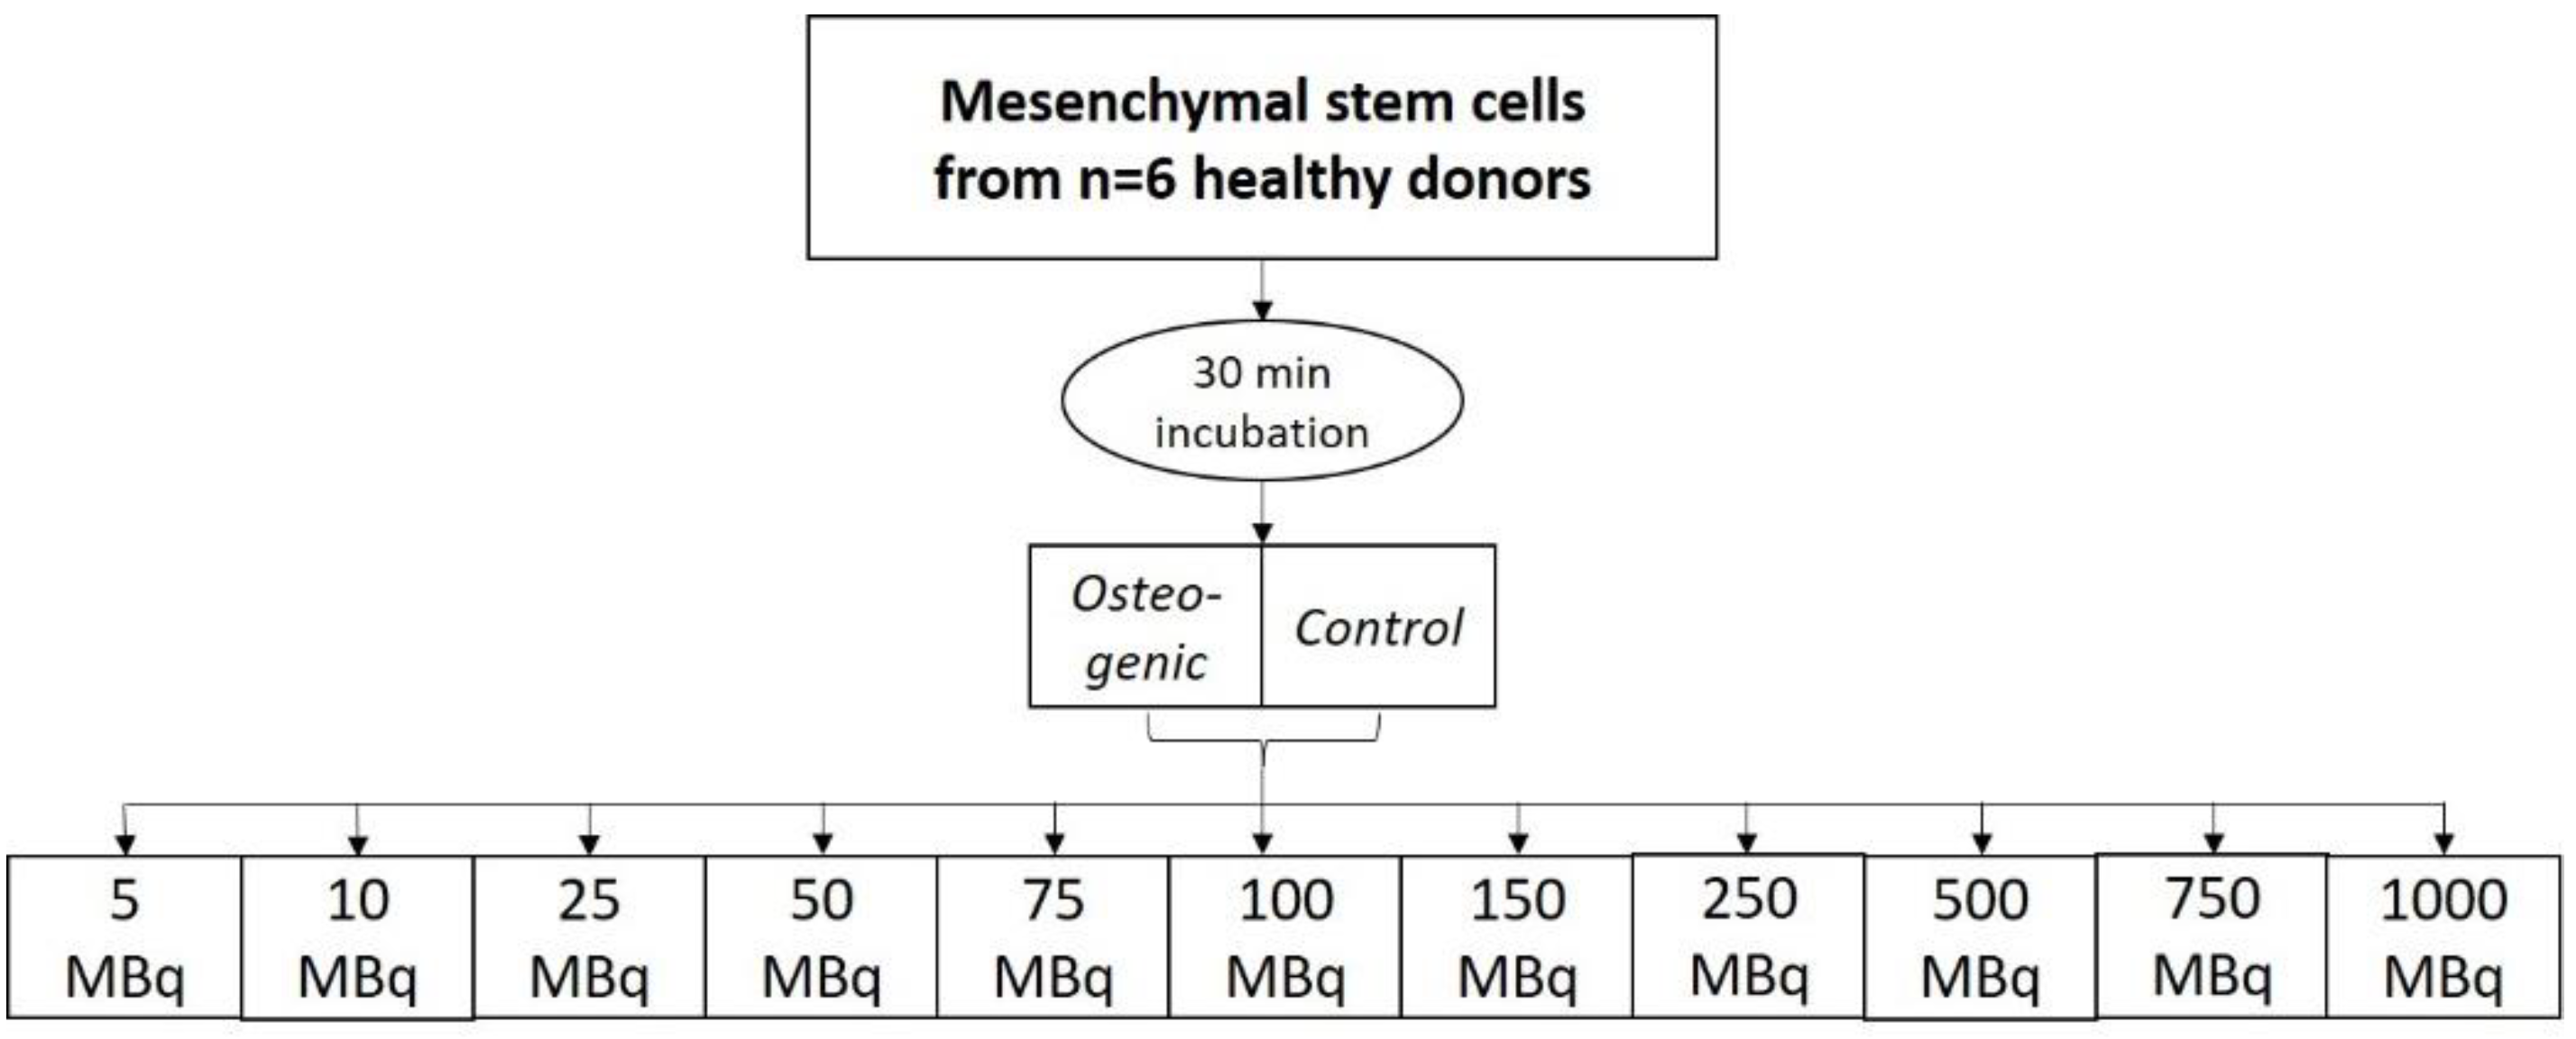
Experiment 2:
To evaluate the saturation concentration, the cells were differentiated for 3 weeks, and then labeled for 30 min at room temperature with different amounts of activity: 5 MBq, 10 MBq, 25 MBq, 50 MBq, 75 MBq, 100 MBq, 150 MBq, 250 MBq, 500 MBq, 750 MBq, and 1000 MBq. Bound activity was measured after incubation.
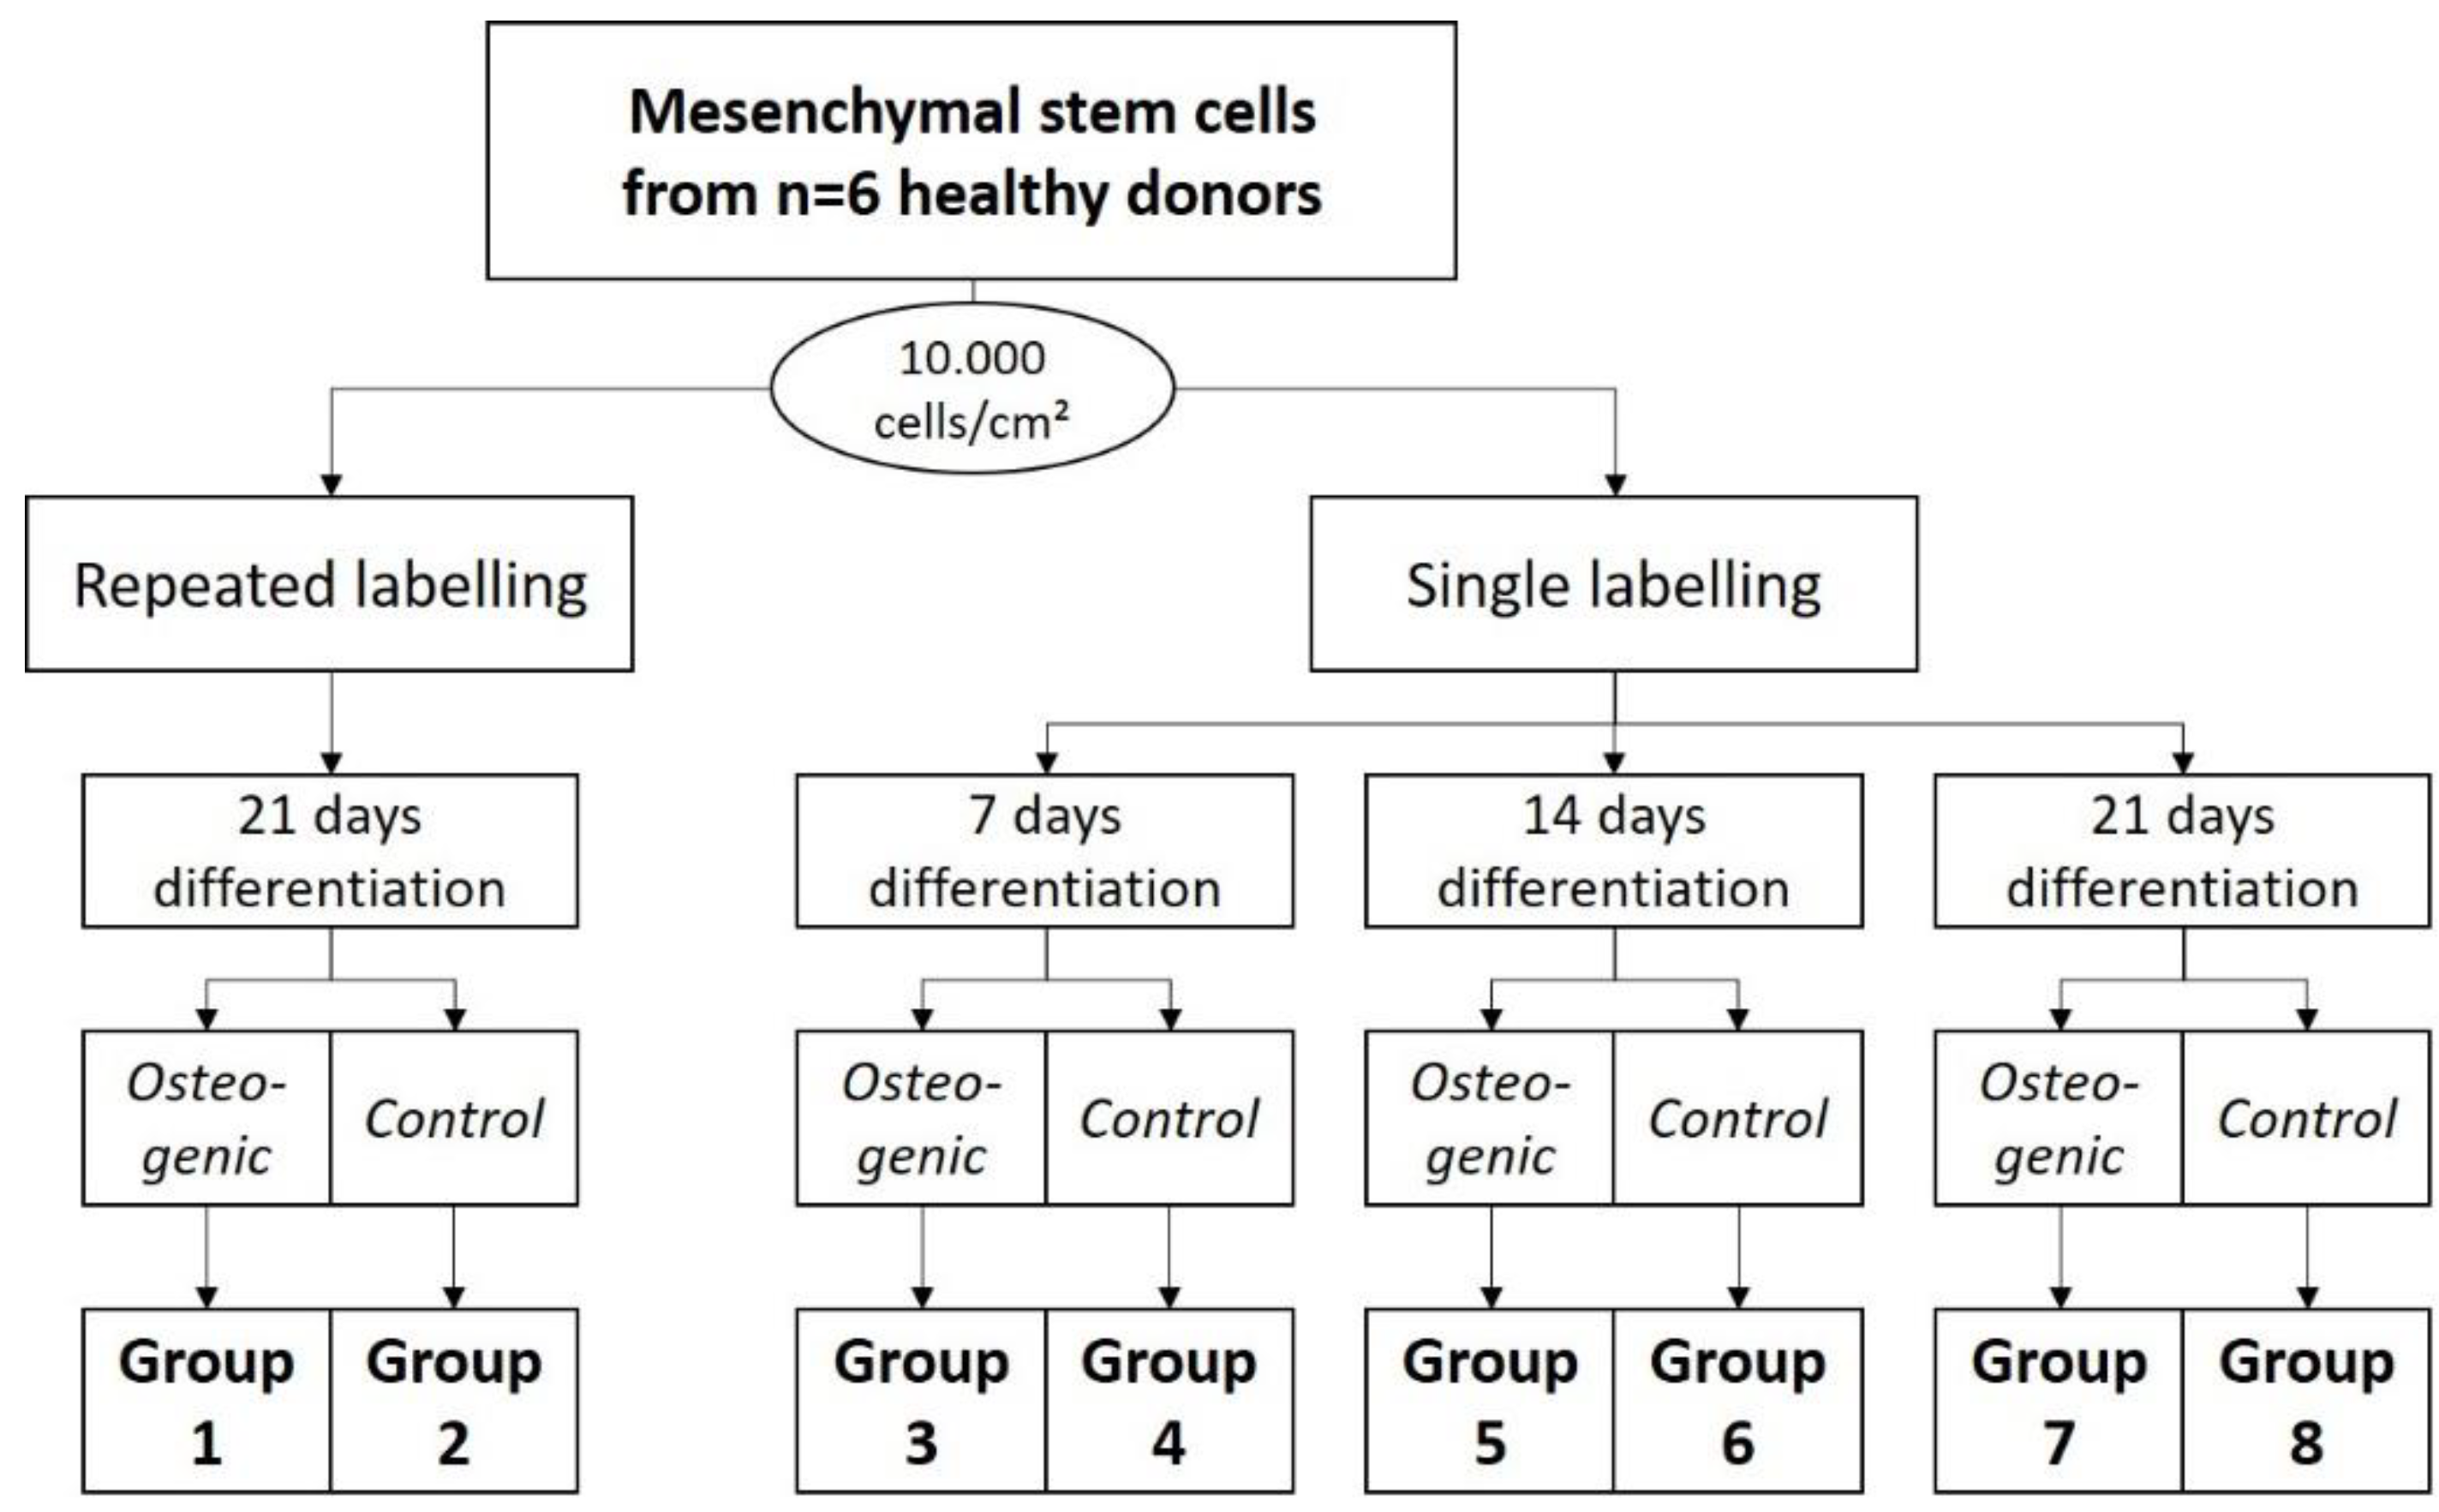
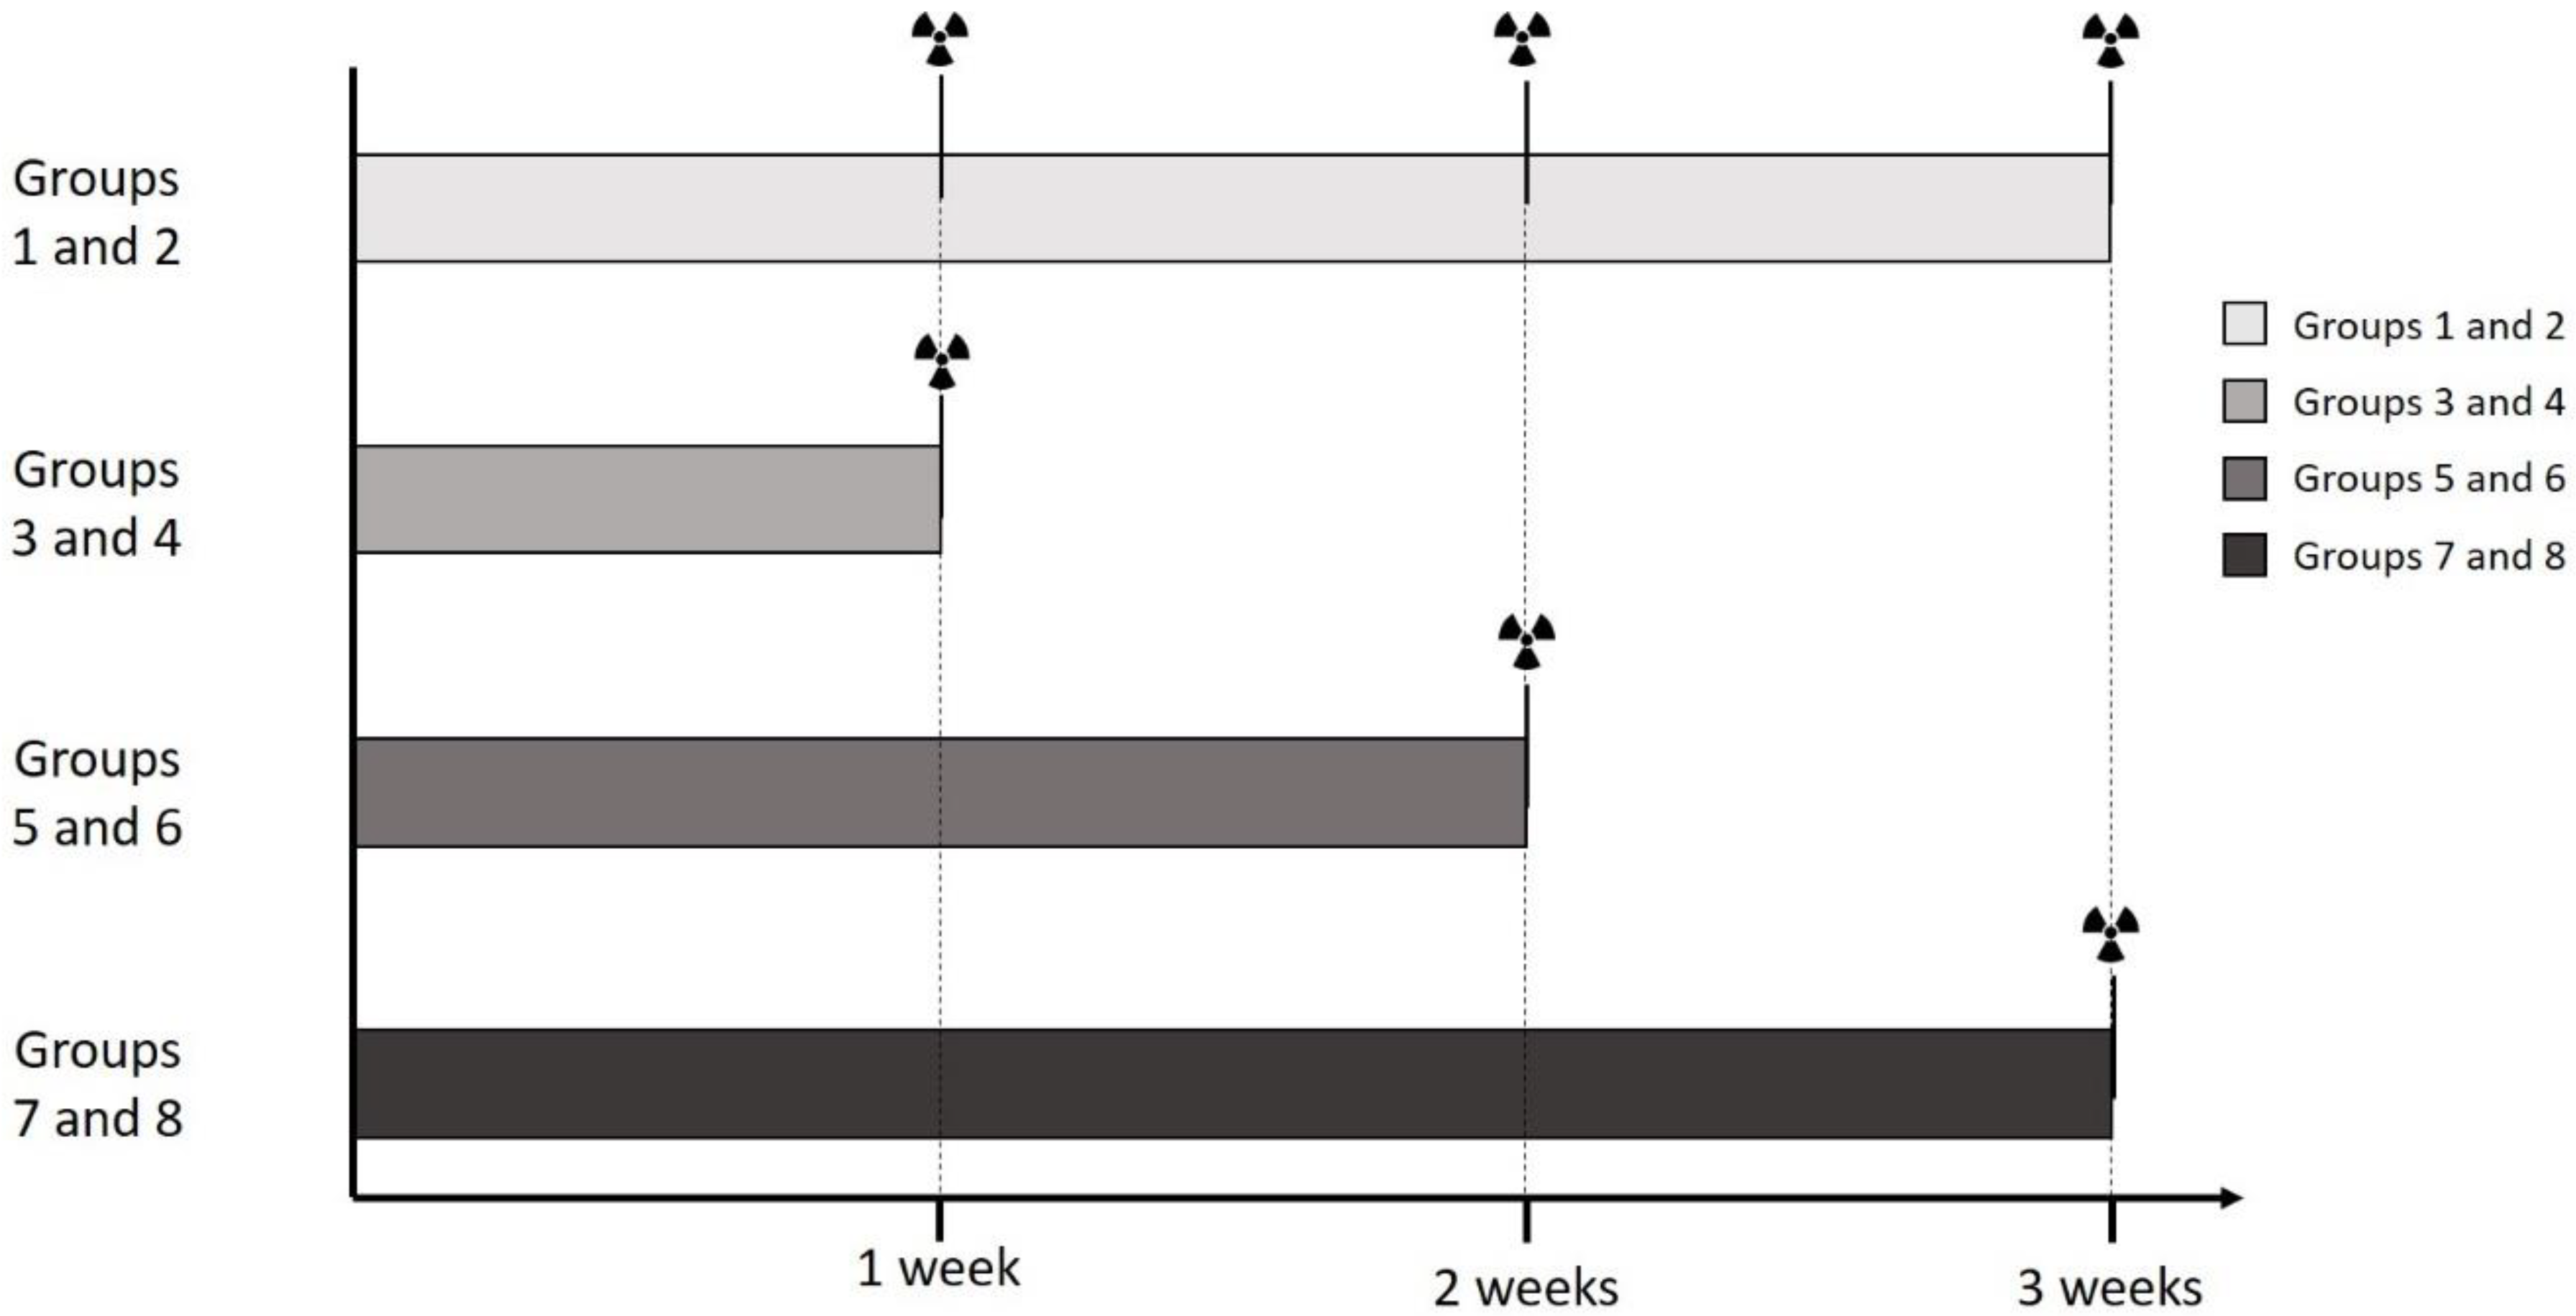
Experiment 3:
To evaluate the effect of repeated labeling, Groups 1 and 2 were differentiated for 3 weeks, and labeled after 1, 2, and 3 weeks (5.0 MBq, 15 min). Groups 3 and 4 were differentiated for 1 week, after which they were labeled (5.0 MBq, 15 min). Groups 5 and 6 were differentiated for 2 weeks, and labeled after that (5.0 MBq, 15 min), and Groups 7 and 8 were differentiated for 3 weeks, and then labeled (5.0 MBq, 15 min).
4.2. Harvest of Human Mesenchymal Stem Cells
Bone marrow aspirate from n = 6 healthy donors was obtained from the proximal femoral cavity under general anesthesia during an elective surgical procedure for total hip arthroplasty after informed consent was given. During the preparation of the proximal bone cavity, 10 mL of bone marrow was collected into a 20 mL syringe (BD, Heidelberg, Germany) containing 1000 IU of heparin (Braun, Melsungen, Germany). Each sample was then diluted 1:1 with PBS (Gibco, Frankfurt, Germany), and washed twice with PBS. The mononuclear cell fraction was isolated using a Ficoll gradient centrifugation (Ficoll-Paque-PLUS, Cytiva, Freiburg, Germany). These mononuclear cells were then plated in T-150 polystyrene tissue culture flasks (Falcon, Kaiserslautern, Germany) at a density of 5·105 cells/cm2 and cultured in a humidified 5% CO2 atmosphere at 37 °C. The cell culture medium used was high-glucose Dulbecco’s modified Eagle’s medium (DMEM-HG, Gibco) containing 10% heat-inactivated (56 °C, 30 min) fetal bovine serum (FCS, Sigma, Schnelldorf, Germany), and 1% penicillin/streptomycin (Sigma). After 48 h, all samples were washed with PBS to remove nonadherent cells. All remaining adherent cells were defined as human bone marrow mesenchymal stem cells. Media were changed three times a week (every 2–3 days). At 90% confluence, cells were trypsinised (Trypsin-EDTA, Sigma) and stored as P0 cells for further experiments in liquid nitrogen. Each 0.5 mL aliquot contained 5·105 cells in 10% DMSO (Sigma) at the time of freezing.
4.3. hMSC Expansion
P0 human MSCs (n = 6) were thawed and seeded into T-150 flasks (Falcon) with 500,000 cells each, and cultured for 10 days in a humidified 5% CO2 atmosphere at 37 °C. Media were changed every 2 days. The media used for expansion were DMEM-HG with 10% FCS and 1% penicillin/streptomycin. After 7 days, 90% confluence was reached in all cells cultured and the cells were trypsinised.
4.4. hMSC Differentiation
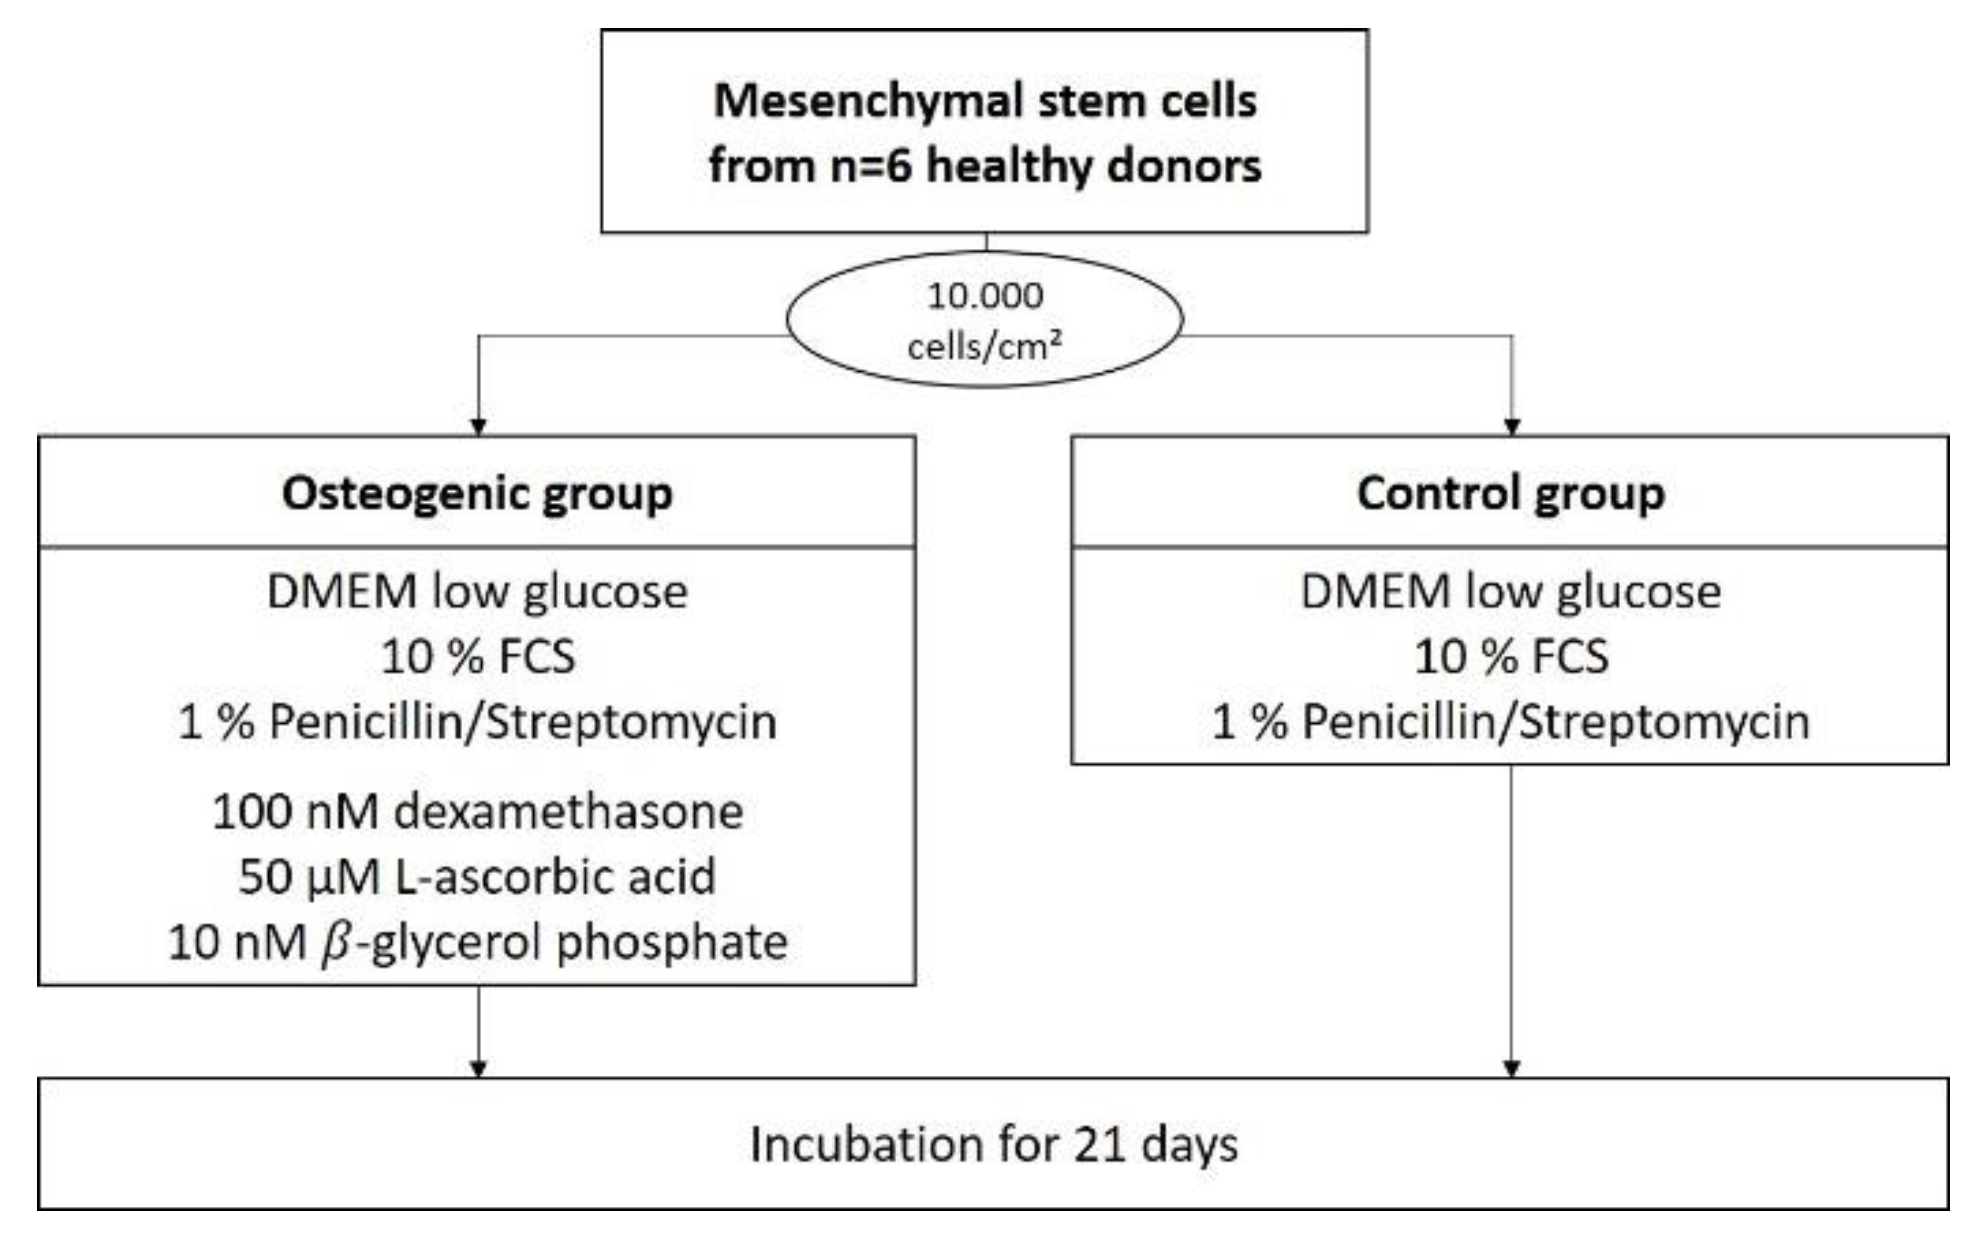
Cells from every donor (n = 6) were seeded and duplicated into 35-mm flat-bottom Petri dishes (Corning, Kaiserslautern) at a density of 10,000 cells/cm2. In total, 38 dishes were seeded per donor: 8 for the 99mTc-HDP saturation time evaluation, 22 for the 99mTc-HDP saturation concentration evaluation, and 8 for the evaluation of the effect of repeated labeling.
Half of these dishes were treated with osteogenic medium, which was made up of DMEM low glucose containing 10% FCS, 1% penicillin/streptomycin and osteogenic supplements (100 nM dexamethasone, 50 µM ascorbic acid, 10 nM
β-glycerol phosphate). The other half of the dishes were treated as a negative control and received media without osteogenic supplements (DMEM low glucose containing only 10% FCS and 1% penicillin/streptomycin) (see
Figure 8).
If not otherwise specified, cells were cultured for 21 days in a humidified 5% CO2 atmosphere at 37 °C with media changed three times a week (every 2–3 days) and then terminated by being washed twice with PBS followed by air drying under a cell culture hood.
4.5. Experiment 1: 99mTc-HDP Saturation Time Evaluation
For this experiment, 4 groups (
n = 6) were formed. For each group and donor, two dishes were used: One with osteogenically differentiated cells and one with undifferentiated cells. A tracer aliquot of 5.1 MBq
99mTc-HDP in 1 mL of 0.9% NaCl was added to each dish. Traced activity was determined with a dose calibrator (Activimeter ISOMED 1010, Nuklear-Medizintechnik Dresden GmbH, Dresden, Germany). Here, the dishes were directly placed into the detection chamber of the dose calibrator and the detection widow was set to Gamma decay/Technetium. The detection time was 5 s for each specimen. The dishes were then incubated at room temperature for different periods. One dish with differentiated and one dish with undifferentiated cells per donor were incubated for different amounts of time: Group A for 0.25 h, Group B for 0.5 h, Group C for 1 h and Group D for 2 h. After incubation, the remaining liquid
99mTc-HDP was then removed, and the dishes were washed twice with PBS to remove any unbound tracer. Subsequently, the dishes were analyzed with the dose calibrator to precisely determine the amount of bound tracer (see
Figure 9).
4.6. Experiment 2: 99mTc-HDP Saturation Concentration Evaluation
For this experiment, 11 groups were formed (
n = 6), with each group being again divided into an osteogenic and a control subgroup. Each group received different amounts of
99mTc-HDP activity, which was determined in advance with a dose calibrator (Activimeter ISOMED 1010): 5 MBq, 10 MBq, 25 MBq, 50 MBq, 75 MBq, 100 MBq, 150 MBq, 250 MBq, 500 MBq, 750 MBq, 1000 MBq. The activity was dissolved in 1.0 mL 0.9% NaCl and then added to each respective dish. All groups were incubated at room temperature for 30 min. The remaining liquid
99mTc-HDP was then removed, and the dishes were washed twice with PBS to remove any unbound tracer. After that, the dishes were analyzed with the dose calibrator to precisely determine the amount of bound tracer (see
Figure 10).
4.7. Experiment 3: Evaluation of the Repeated 99mTc-HDP Labeling on the Osteogenic Potential of hMSCs
For this experiment, for each of the n = 6 donors, 8 groups were formed. Group 1 received DMEM-LG with osteogenic supplements as media. The dishes of each donor were cultured in a humidified 5% CO2 atmosphere at 37 °C for 1 week. Then, they received a tracer aliquot of 5.0 MBq 99mTc-HDP in 1 mL of 0.9% NaCl, and were incubated at room temperature for 15 min. The remaining liquid 99mTc-HDP was then removed, and the dishes were washed twice with PBS to remove any unbound tracer. The dishes were then analyzed with the dose calibrator to precisely determine the amount of bound tracer. Here, the dishes were directly placed into the detection chamber of the dose calibrator (Activimeter ISOMED 1010, Nuklear-Medizintechnik Dresden GmbH, Dresden, Germany) and the detection widow was set to Gamma decay/Technetium. The detection time was 5 s for each specimen. After that, fresh media were added, and the dishes were cultured for another week. Subsequently, the dishes were labeled again (5.0 MBq, 15 min), and then for a third and final time after being cultured for a third week (5.0 MBq, 15 min).
Group 2 served as a control group to Group 1 and received DMEM-LG without osteogenic supplements as media, but was otherwise treated as Group 1.
Groups 3–8 were labeled just once after being cultured for different time spans. The duration of culture was 1 week for Groups 3 and 4, 2 weeks for Groups 5 and 6, and 3 weeks for Groups 7 and 8. Groups 4, 6, and 8 served as control groups to the osteogenic Groups 3, 5, and 7. At the end of their respective time span, the culture was terminated, and the dishes were labeled with
99mTc-HDP (5.0 MBq, 15 min). For the times of labeling, see also
Figure 11 and
Figure 12.
4.8. DAPI Staining and Cell Count
After the cell culture was terminated, dishes of repeated
99mTc-HDP labeling (see
Section 4.7) were incubated with 4% paraformaldehyde (PFA, Sigma) at room temperature for 20 min. They were then fixated with 0.1% PFA. All fixated samples were stained with DAPI (Thermo Fisher Scientific, Karlsruhe, Germany), and counted under a microscope (Leica CMi8, Leica, Wetzlar, Germany). Cells were counted at 100× magnification in 5 vision fields in 5 different areas of each dish (top left, top right, bottom left, bottom right, and center). Based on the specifications of the microscope, each vision field had an area of 952.484 µm
2. As the area of an entire 35 mm dish was known, the absolute number of cells in the dish was calculated and assessed for normal distribution.
Cell counting in fluorescence images was conducted via the “CellProfiler” software (Broad Institute, “URL
https://cellprofiler.org, version 4.2.4 accessed on 15 August 2022). Raw TIFF images were masked for time stamp and size legend, and converted to greyscale images. Cells were identified as primary objects using a global, manually set intensity threshold (t = 0.1), and objects smaller than 8 or larger than 80 pixels in diameter were disregarded. Clumped cells were distinguished based on the shape method.
4.9. Electron Microscopy
Scanning electron microscopy was carried out on dry samples from the mineralization study on a Helios Nanolab 600 machine (Thermo Fisher Scientific, Eindhoven, the Netherlands) with a resolution of about 1 nm. All images were acquired at an acceleration voltage of 5 kV with an Everhardt–Thornley secondary-electron detector. To avoid charging artefacts, 10 nm of carbon was deposited onto the sample surface prior to imaging. Elemental analysis with a focus on C, N, O, Na, Mg, P, S, Cl, K, and Ca was investigated by means of energy-dispersive X-ray analysis with an Oxford X-Max80 silicon-drift detector (Oxford Instruments, Abingdon, UK) attached to the SEM with an energy resolution of 124 eV at Mn-Kα.
4.10. Statistics
The results were first tested for normal distribution using the Kolmogorov–Smirnov test. To determine statistical significance between the groups, an ANOVA was performed followed by the adjustment of the p-value using the post hoc test by Bonferroni. The homogeneity of variances for one-way ANOVA was analyzed using Levene’s test to assess the equality of variances.
Statistical analyses were performed using SPSS Statistics® (IBM, Armonk, NY, USA) Version 28. Statistical significance was set to p ≤ 0.05.
For the determination of the
99mTc-HDP saturation time, measurements were corrected for the different incubation times regarding the decay of
99mTc. For the formula, a half-life time of 6.0 h was used [
35].

 ,
, 


