Abstract
Trehalose and trehalose-6 phosphate played important roles in floral organ development, embryonic development, cell morphogenesis, and signal transduction under abiotic stress. However, little is known about the trehalose-6-phosphate synthase (TPS) gene family in Brassica napus. In this study, in total, 26 TPS genes in B. napus (BnTPS genes) were identified and classified into two groups. In each group, the BnTPS genes showed relatively conserved gene structures. The protein–protein interaction (PPI) network and enrichment analysis indicated that BnTPS genes were involved in the glycolysis/gluconeogenesis, fructose and mannose metabolism, galactose metabolism, pentose phosphate pathway, carbohydrate transmembrane transport, trehalose–phosphatase activity, etc. The expression of BnTPS genes varied greatly across different tissues, while most of the BnTPS genes showed a considerable improvement in expression under different abiotic stresses, indicating that BnTPS genes were significantly responsive to the abiotic treatments. In addition, the association mapping analysis revealed that eight BnTPS genes were potential regulators of particular agronomic traits. Among them, the gene BnTPS23 was significantly associated with the primary flowering time (PFT), full flowering time (FFT1), and final flowering time (FFT2), suggesting that BnTPS genes may play an important role in regulating key agronomic traits in B. napus. In summary, our research provides a better understanding of BnTPS genes, facilitates the breeding of superior B. napus varieties, and paves the way for future functional studies.
1. Introduction
Trehalose (α-D-glucopyranosyl-1, 1-α-D-glucopyranoside) is a structurally stable non-reducing disaccharide that can help biological cells maintain nucleic acid, protein, and biological membrane activity as well as protect cellular structures under adverse conditions. It consists of two glucose molecules linked by α, α, 1, and 1-glycosidic bonds [1]. Trehalose is an important signal transducer and regulator of plant metabolism and developmental processes [2,3]. It contains a large number of hydroxyl groups that can attach to a range of biomolecules and establishes hydrogen bonds, which can preserve biomolecules and lower the danger of inactivation, hence, boosting resilience to biotic or abiotic stress [1]. The trehalose-6-phosphate synthase (TPS) and trehalose-6-phosphate phosphatase (TPP) (TPS-TPP) pathway is the only one found in higher plants. The other four are the trehalose phosphorylase (TreP) pathway, trehalose synthase (TreS) pathway, maltooligosyltrehalose synthase, and maltooligosyltrehalose trehalohydrolase (MTSase–MTHase or TreY-TreZ pathway, and trehalose glycosyltransferring synthase (TreT) pathway [4,5]. TPS and TPP, two essential enzymes, work together to form the TPS-TPP pathway in a two-step reaction. TPS first catalyzes the synthesis of trehalose-6 phosphate (T6P) and UDP from UDP-glucose and glucose-6 phosphate. TPP then dephosphorylates T6P to yield trehalose [6].
TPS is crucial for the production of trehalose and stress resistance in plants [7]. In rice, TPS could improve the resistance to low temperatures, dehydration, and salt [8]. When cotton was subjected to drought, it was discovered that the expression of TPS genes was noticeably higher in the leaves and roots [9]. These studies showed that TPS genes are essential for improving plant stress tolerance and trehalose content, as well as their potential for crop improvement. Moreover, previous studies found that the role of TPS genes in regulating development and flowering has been reported [6]. In A. thaliana, the TPS gene regulated hypocotyl growth [10], carbohydrate utilization, and plant growth [11]. TPS genes can also influence the development of floral organs, such as the number of inflorescence branches and flowering time [12]. In addition, TPS1 can regulate the flowering time by inducing the expression of FLOWERING LOCUST (FT) [13]. Furthermore, TPS genes can also regulate the content of sucrose and glucose in nonstructural carbohydrates (NSCs) to repress the expression of miR156 and then promote flowering [14].
Different species have different numbers of TPS members; for instance, the A. thaliana genome includes a total of 11 TPS genes [15], 9 in rice [16], and 7 in cucumber [17]. B. napus, a major global oil crop, is an allotetraploid species formed by the hybridization of Brassica rapa and Brassica oleracea [18]. However, very little is known about the TPS gene family in B. napus. In this study, the BnTPS gene family was identified and analyzed, including gene structure, chromosomal localization, expression, evolutionary patterns, and their potential effects on important traits. This study deepened our comprehension of BnTPS genes and laid the foundation for future functional studies.
2. Results
2.1. Identification and Analysis of BnTPS Genes
To identify the BnTPS gene family members, an HMM search by using PF00982 and PF02358 domains as queries and domain verification was performed. Finally, in total, 26 TPS genes were found and located in the B. napus genome sequence. The BnTPS genes were numbered according to the chromosome position and showed the putative AtTPS orthologs of each BnTPS gene based on the sequence homology (Table S1). The features of BnTPS genes, including isoelectric point (pI), exon number, protein length, and subcellular localization, are provided in Table S1. The length of BnTPS protein ranged from 774 to 951 amino acids (AAs), with an average length of 817 AA. The MW values ranged from 87,348.35 to 107,078.89 Da and the pI values ranged from 5.50 to 6.74. Exon number varied greatly among the BnTPS genes, ranging from 3 to 18. According to the subcellular location prediction, all of the BnTPS proteins were found to be located in the cytoplasm.
2.2. Phylogenetic Analysis and Classification of BnTPS Genes
Using the NJ method with 1000 bootstrap replicates, a phylogenetic tree was created to assess the phylogenetic relationships among the TPS genes based on 26 BnTPS protein sequences and 11 AtTPS protein sequences (Figure 1). Based on their homologous relationship with AtTPS genes [15], the TPS genes were categorized into two groups. Most of the BnTPS genes were clustered in group II, where there were 16 (61.54%). The left BnTPS genes were clustered in group I, where there were 10 (38.46%).
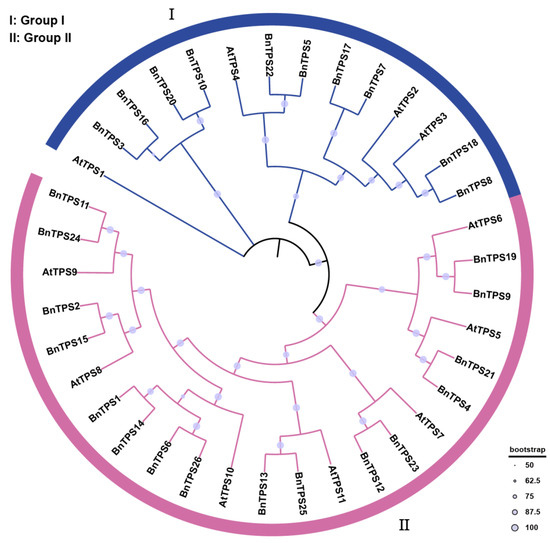
Figure 1.
A phylogenetic tree of BnTPS and AtTPS genes. All TPS genes were classified into two groups and different colors represent two groups.
2.3. Chromosomal Distribution and Gene Duplication of TPS Genes in Brassica napus
In B. napus, 4 out of the 26 BnTPS genes were not anchored in the chromosomes, while the other 22 BnTPS genes were unevenly distributed among 19 chromosomes (Figure 2). In total, each subgenome had 13 BnTPS genes, respectively (Table S1). Paralogous BnTPS gene pairs and the duplication patterns were identified based on the BLASTP [19] and Mcscan X software [20]. The result showed that all 26 BnTPS genes were derived from duplication. Most of these genes were produced from segmental duplication and whole-genome duplication (WGD) (22/26, 84.61%). Moreover, one tandem, one proximal, and two dispersed gene duplication types were also identified (Table S1). There were 20 paralogous BnTPS gene pairs, with 16 paralogous BnTPS gene pairs between the subgenome A and C, 3 in the A subgenome, and only 1 in the C subgenome (Figure 2 and Table S2). The ratios of non-synonymous to synonymous substitutions (Ka/Ks) for paralogous BnTPS gene pairs were analyzed to assess the selection pressure of BnTPS genes. In this study, all of the Ka/Ks ratios for paralogous BnTPS gene pairs were lower than one, showing that BnTPS genes underwent purifying selection (Figure 2 and Table S2).
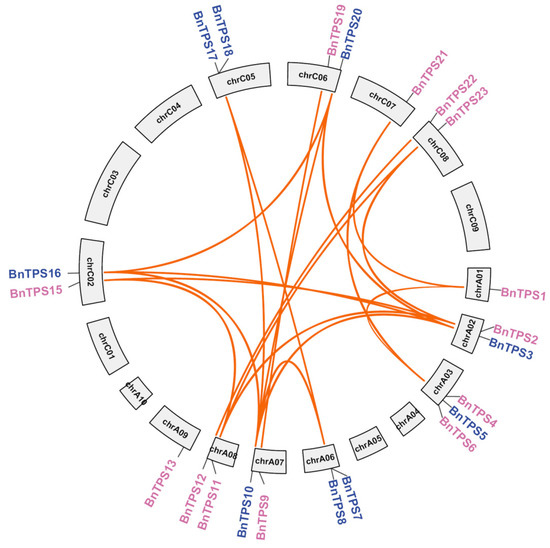
Figure 2.
The duplicated BnTPS gene pairs. The genes from the two groups are indicated in pink and blue colors. The orange lines link the paralogous BnTPS gene pairs.
2.4. Gene Structure, Conserved Motifs, and Cis-Acting Regulatory Element Analysis of BnTPS Genes
The exons, introns, and UTR of the BnTPS genes were examined to study gene structural evolution (Figure 3a,c and Table S1). Each TPS gene had an average of 8 exons, although the number of exons varied greatly, ranging from 3 to 18. The groups included different exons; for instance, group II only had 3 or 4 exons, while group I contained 15 to 18 exons (Figure 3c and Table S1). Furthermore, the BnTPS protein sequences were extracted from the ‘Darmor-bzh’ reference genome to investigate the motif composition. In total, ten conserved motifs in all of the BnTPS genes were found (Figure 3b). The previous study showed that the AtTPS1 gene contained the N-terminal extension [21]. However, there were only three (BnTPS10, BnTPS16, and BnTPS20) of the four homologous BnTPS genes (BnTPS3, BnTPS10, BnTPS16, and BnTPS20) of AtTPS1 that contained the same N-terminal extension (Figure S1 and Table S1).
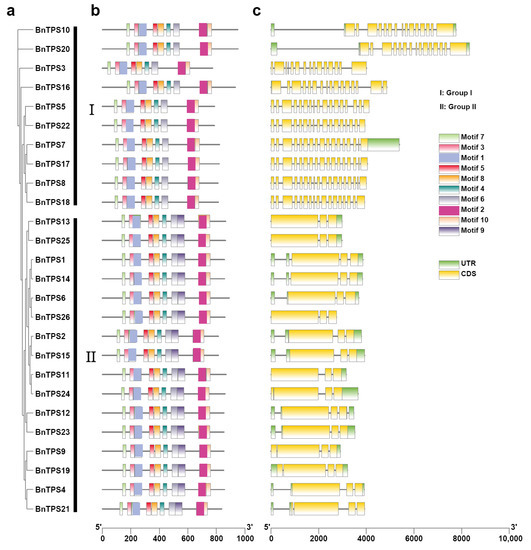
Figure 3.
The phylogenetic tree, gene structure, and conserved motifs of 26 BnTPS genes. (a) The phylogenetic tree of 26 BnTPS genes; (b) The conversed motif composition of BnTPS genes. Different colors represented different motifs; (c) Gene structures of the BnTPS genes. Yellow boxes, green boxes, and grey lines represent UTR, CDS, and introns, respectively.
Promoter regions were proven to play an important role in regulating gene expression [22]. Therefore, we examined the cis-acting regulatory elements in the 2-kb promoter region of these BnTPS genes to ascertain the potential function. The result showed that cis-acting regulatory elements of BnTPS were found to be related to stress, development, and hormones (ranging from 4 to 44) (Figure 4 and Table S3). Most BnTPS genes (24/26, 92.31%) had ARE elements, important for anaerobic induction. In addition, stress-responsive elements, such as TC-rich repeats (involved in defense and stress responsiveness, 15/26, 57.69%), LTR (involved in low-temperature responsiveness, 9/26, 34.62%), and MBS (involved in drought inducibility, 8/26, 30.77%), were also common in the promoters of BnTPS genes. The hormone-responsive elements, such as ABRE (involved in the abscisic acid responsiveness, 17/26, 65.38%), CGTCA motif, and TGACG motif (both involved in the MeJA responsiveness, 15/26, 57.69%), existed in most of the promoters in BnTPS genes. In terms of development-responsive elements, CAT box (related to meristem expression, 17/26, 65.38%), GT1 motif (light responsive element, 16/26, 61.54%), and O2 site (involved in zein metabolism regulation, 12/26, 46.15%) existed in most promoters in BnTPS genes. These findings suggested that several BnTPS genes might be responsible for plant development and stress response.
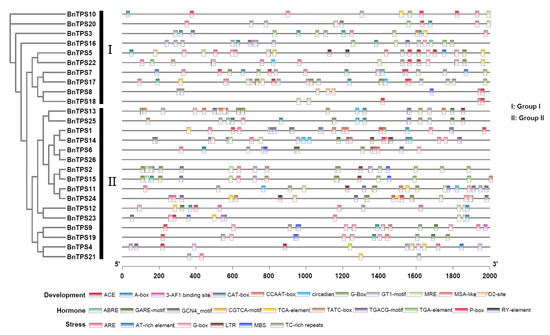
Figure 4.
Cis-acting regulatory elements identified in the BnTPS genes promoter regions. Different colors represent various elements.
2.5. Predicted Protein Interactions of BnTPS Proteins
BnTPS protein networks were modeled based on recognized protein interactions in A. thaliana to clarify the function of BnTPS genes. Using 11 AtTPS proteins as queries, 1384 proteins were found in the interactive protein database of A. thaliana that were homologous to 5425 proteins in B. napus (Figure 5a and Table S4). The result showed that most BnTPS proteins (24/26, 92.31%) were in the central nodes of the network. Most BnTPS proteins interacted with one another and with other proteins and were involved in many biological processes (Figure 5a and Table S4). Moreover, Gene Ontology (GO) and Kyoto Encyclopedia of Genes and Genomes (KEGGs) enrichment studies were performed for these interacting proteins (Figure 5b, Tables S5 and S6). The KEGG enrichment result showed the interacting genes involved in glycolysis/gluconeogenesis, fructose and mannose metabolism, galactose metabolism, pentose phosphate pathway, and so on. The GO enrichment analysis revealed that these interacted proteins were associated with various biological processes, such as carbohydrate transmembrane transport, trehalose biosynthetic process, D-ribose metabolic process, and so on (Table S5). In the cellular component terms, the interacting genes enriched in the cytosolic ribosome, 6-phosphofructokinase complex, cytoplasmic microtubule, and so on (Table S5). Meanwhile, for molecular function, the interacting genes were enriched in trehalose–phosphatase activity, polygalacturonate 4-alpha-galacturonosyltransferase activity, and so on (Table S5).
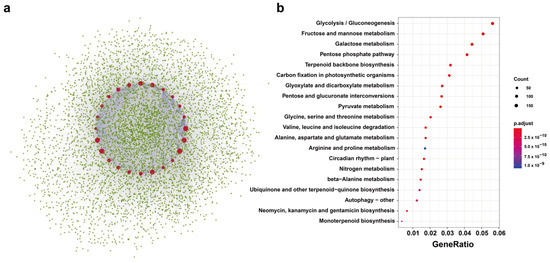
Figure 5.
The TPS-protein interaction network analysis in B. napus. (a) The PPI network of BnTPS proteins. Red circles represent the BnTPS proteins and the green circles represent proteins that interacted with BnTPS proteins. The blue lines indicate the interaction between BnTPS proteins and the grey lines indicate the interaction between BnTPS and other proteins. (b) KEGG pathway analysis of proteins that interacted with BnTPS proteins. The color bar shows the p.adjust value from low (red) to high (purple).
2.6. BnTPS Gene Expression Patterns in Different Tissues and under Different Abiotic Stresses
To investigate the expression pattern of the BnTPS gene in different tissues of B. napus, five tissues (bud, callus, leaf, root, and silique) of B. napus were used to analyze their expression pattern [23]. The result showed that BnTPS genes demonstrated different expression levels in these tissues. A total of 20 BnTPS genes was expressed in all tissues (Figure 6a and Table S7). The expression profiles of BnTPS genes in the bud and callus tissues showed similar patterns (Figure 6b and Table S7). Among five tissues, almost all of the BnTPS genes showed high expression levels in the root, bud, callus, and silique tissues but lowly expressed in leaf tissue (Figure 6b). The BnTPS genes showed preferential expression in the root tissue, and there were nine BnTPS genes that showed the highest expression levels in the root tissue (Figure 6b and Table S7). In addition, the gene BnTPS7 was only expressed in silique tissues (Table S7).
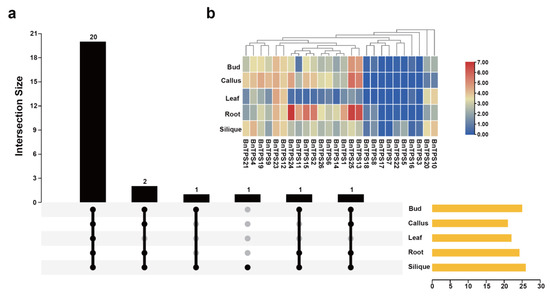
Figure 6.
Expression profiles of BnTPS genes in five tissues. (a) The number of BnTPS genes that were expressed in five tissues; (b) Heatmap representation of 26 BnTPS genes in five tissues. Log2 normalization was used to process the expression data. From low (blue color) to high (red color), the color scale represents relative expression levels.
The expression pattern of BnTPS genes in response to abiotic stimuli, such as dehydration, cold, ABA, and salinity, was investigated. The transcriptome data were downloaded from a previous study [24]. There were 20 BnTPS genes expressed under all the abiotic stresses (Figure 7a and Table S8). The expressions of the majority of BnTPS genes were up-regulated under all the abiotic stresses (Figure 7b and Table S8). BnTPS gene BnTPS11 showed increased expression (>43-fold) under dehydration and salt treatments for 4 h (Figure 7b and Table S8). Remarkably, only one BnTPS gene, BnTPS20, was down-regulated under all the abiotic stresses (Figure 7b and Table S8).
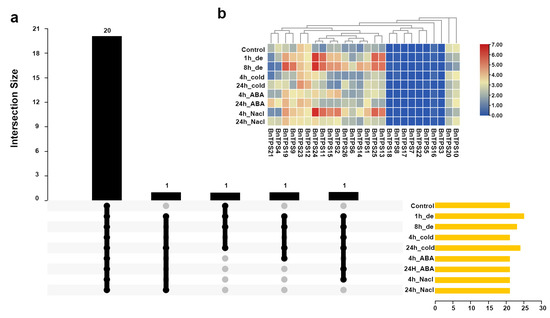
Figure 7.
Expression profiles of BnTPS genes under different abiotic stress conditions. (a) The numbers of BnTPS genes that were expressed under different abiotic stress conditions; (b) Heatmap representation of 26 BnTPS genes under different abiotic stresses. Log2 normalization was used to process the expression data. From low (blue color) to high (red color), the color scale represents relative expression levels. The ‘de’ represents dehydration.
2.7. Genetic Effects of BnTPS Genes on Agronomic Traits
To better understand the genetic effects of BnTPS genes in regulating agronomic traits, a total of 324 all-over-the-world core collections of B. napus germplasm were used to identify the SNPs (Table S9) [25]. In total, 655 SNPs out of 3,320,299 SNPs were found in BnTPS gene regions in the whole genome. All of these SNPs were annotated and showed that 434 SNPs were in the exon regions and 119 SNPs (including 99 missense mutations, 19 splicing junction mutations, and 1 stop gained mutation) resulted in producing different amino acid sequences (Table S10). On average, each BnTPS gene contained 25 SNPs, well above the genome-wide level (12 SNPs in each gene). The BnTPS genes in the A and C subgenomes were investigated separately and found that the average number of SNPs per gene within the A subgenome (41) was much higher than that of the C subgenome (10). Moreover, the average SNP number among the three groups was: group II (28) > group I (21) (Table S9). There was a significant difference between the paralogous BnTPS gene pairs; for example, there were 63 SNPs in BnTPS2, but no SNP in its paralogous gene BnTPS24 (Table S9), suggesting that significant differences in genetic variation existed between paralogous gene pairs. To investigate the effect of BnTPS genes on the agronomic traits, the association mapping analysis was performed for nine agronomic traits. In total, there were 84 SNPs located in 8 BnTPS genes that were significantly associated with at least one important trait (Table S9). The gene (BnTPS23) showed a significant association with primary flowering time (PFT), full flowering time (FFT1), and final flowering time (FFT2) traits. The germplasm accessions were divided into two groups based on the significant associated SNP, and the results showed significant differences in PFT, FFT1, and FFT2 traits were observed between the two groups (Figure 8).
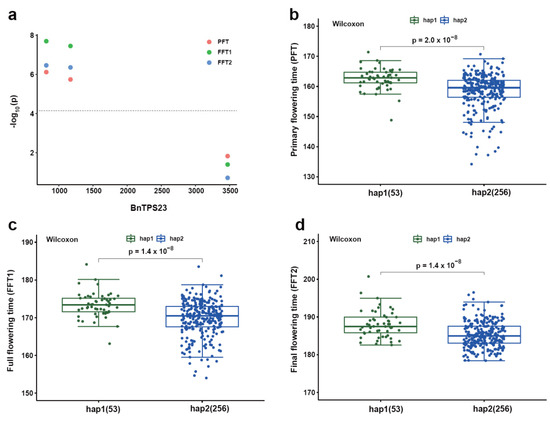
Figure 8.
The association mapping analysis of BnTPS23 in the B. napus population. (a) Manhattan plot of BnTPS23 with primary flowering time (PFT), full flowering time (FFT1), and final flowering time (FFT2); (b–d) The haplotype analysis of BnTPS23 for PFT, FFT1, and FFT2 based on the significant associated SNP.
3. Discussion
It is well known that BnTPS genes are involved in trehalose synthesis and stress resistance in many plants [7,8,9,10]. The TPS gene family has been found in numerous plants [3], such as A. thaliana [7], rice [16], potato [26], apple [27], winter wheat [28], and cotton [29]. However, the TPS gene family in B. napus has not been extensively studied. The Brassica genus underwent a genome triplication after divergence from the Arabidopsis lineage. Subsequently, a natural cross between B. rapa and B. oleracea occurred about ~7000 years ago to form the allotetraploid B. napus [18]. Due to the two whole-genome duplication events, a single A. thaliana gene is projected to discover up to six homolog genes in B. napus. According to our results, B. napus contains only 26 TPS genes, while A. thaliana has 11 TPS genes (Table S1). Therefore, the number of BnTPS genes was only about 2.5-fold greater than that of ancestor A. thaliana, suggesting that the BnTPS genes underwent partial gene loss or sequence alteration during the evolutionary processes. For all paralogous BnTPS gene pairs, Ka/Ks value was less than one, suggesting that purifying selection occurred during BnTPS gene evolution (Table S1).
To investigate the evolution and differentiation of BnTPS genes, the sequence and the structure of BnTPS genes were compared. The BnTPS genes have been classified into two groups [15]. In addition, gene structure and motif analysis within the BnTPS genes provided additional confirmation of this classification. (Figure 3). In group I, the number of exons exceeded 15, while in group II, the number was only 3 or 4 (Figure 3 and Table S1). BnTPS coding sequences in the same group shared similar gene structures., suggesting that the coding sequences were conserved in group I and II.
AtTPS1 protein, which is the only Arabidopsis TPS having an N-terminal extension, contained a nuclear location signal [21,30]. There were four BnTPS genes (BnTPS3, BnTPS10, BnTPS16, and BnTPS20) homologous to AtTPS1 (Table S1), indicating the common ancestry and possibly a specific function of the BnTPS genes. However, only three homologous BnTPS genes (BnTPS10, BnTPS16, and BnTPS20) of AtTPS1 contained the N-terminal extension, indicating that the other one (BnTPS3) may have lost its N-terminal extension during evolution (Figure S1 and Table S1). Cis-acting elements play an important role in regulating gene expression to adapt to different environments [31]. There were some elements involved in stress (ARE, MBS, LTR), hormone (ABRE, ERE, TCA-element), and development (ACE, A-box, cat-box) found in abundance in the promoter regions of the majority of BnTPS genes, implying that BnTPS genes may play a role in stress, hormone, and development. The previous studies also showed that TPS genes are related to stress tolerance in A. thaliana and potato [3,32].
In the different tissues, the highest and the lowest average gene expression of BnTPS genes were observed in the root and leaf tissues separately (Figure 6 and Table S7). The root is a crucial stress-sensing tissue and TPS genes can regulate root development [12]; hence, BnTPS genes are highly expressed in root tissues. The expression divergence between the paralogous BnTPS gene pairs was also observed, suggesting that paralogous genes differ significantly in expression. The expression of most BnTPS genes varied in response to the various treatments (Figure 7 and Table S8). The expression of BnTPS1, BnTPS9, BnTPS11, BnTPS13, BnTPS14, BnTPS24, and BnTPS25 genes increased under all the treatments (Figure 7 and Table S8). The expression of BnTPS genes showed a significant change under the dehydration treatment, which corresponds to previous research [33]. The expression of BnTPS genes in grapes did not show significant changes under cold treatment [34], but in our study, most of the BnTPS gene expression alterations were significant. For example, the expression of BnTPS24 was up-regulated to 4.6-fold treated by cold treatment for 4 h, indicating that the TPS expression has different expression patterns in different species [34]. The AtTPS2 gene in A. thaliana has an important role in regulating ABA signaling [3] and, in this study, the expression of many BnTPS genes changed significantly under ABA treatment for 4 h and 24 h. For example, the gene BnTPS4 showed the largest decrease in expression under ABA treatment for 4 h, reaching 2.4-fold. In addition, under ABA treatment for 4 h, BnTPS2 was up-regulated to 4.4-fold. Under salt treatment, BnTPS gene BnTPS24 expression increased most dramatically, reaching 40.3-fold under salt treatment for 4 h, indicating the BnTPS genes were most sensitive to the salinity environment.
To investigate the genetic variation within the BnTPS gene, a worldwide core collection B. napus germplasm population was used to perform association mapping [24]. The result showed that SNP density in BnTPS genes was higher than that of the whole genome, implying that BnTPS genes are more dynamic. In addition, the SNP density was higher in BnTPS genes from the A subgenome, suggesting the asymmetric evolution of BnTPS genes between the A and C subgenomes. In previous studies, TPS genes played an important regulatory role in flower development [12,13,14,35]. The association mapping analysis was performed, and it was found that BnTPS23 was highly significantly associated with PFT, FFT1, and FFT2. These results provided a large number of variant resources for gene function research and further breeding of elite B. napus varieties.
4. Materials and Methods
4.1. Identification of TPS Genes in Brassica napus
Reference genome sequence and gene annotation files were obtained from the BRAD Database (Available online: http://brassicadb.cn/, accessed on 28 September 2022) for the cultivar ‘Darmor-bzh’ of B. napus [18]. To identify the BnTPS genes, the TPS (Glyco-transf-20, PF00982) and TPP (Trehalose_PPase, PF02358) domains of Hidden Markov Models (HMMs) were downloaded from the Pfam database (Available online: http://pfam.xfam.org, accessed on 28 September 2022) [36]. The HMMER3.0 software was used to search for all possible BnTPS candidate genes, including typical TPS and TPP domains, in B. napus with the setting e-value of 1 × 10⁻⁵. Then, all candidate BnTPS genes were subjected to the NCBI-CDD (Conversed Domain Database) (Available online: https://www.ncbi.nlm.nih.gov/Structure/cdd/wrpsb.cgi, accessed on 28 September 2022) [37] and the SMART databases (Available online: http://smart.embl.de/, accessed on 28 September 2022) [38] to verify the presence of the TPS and TPP domains. Moreover, the remaining BnTPS genes were subjected to the online software ProtParam (Available online: https://web.expasy.org/protparam/, accessed on 28 September 2022) [39] to predict their molecular weights (MWs) and isoelectric point (pI), as well as instability indexes. The prediction for the subcellular location of these BnTPS proteins was conducted by CELLO v2.5 (Available online: http://cello.life.nctu.edu.tw/, accessed on 28 September 2022) [40].
4.2. Identification of Paralogous BnTPS Gene Pairs and Calculation of Ka/Ks Ratios
Based on the annotation of the ‘Darmor-bzh’ reference genome, the chromosomal locations of TPS genes were determined. BLASTP [19] was used to align the sequence with the setting e-value of 1 × 10⁻¹⁰, and MCScan X [20] was used to detect paralogous BnTPS gene pairs and the duplication patterns. Chromosomal locations and paralogous BnTPS gene pairs were visualized by the Circos software [41]. To determine the evolutionary pressure on paralogous genes in the BnTPS gene family, the ratio of non-synonymous substitution to synonymous substitution (Ka/Ks) of paralogous BnTPS gene pairs was calculated by Tbtools [42].
4.3. BnTPS Gene Structure, Conserved Motifs, and Cis-Acting Regulatory Elements Analysis
The online software MEME (Multiple Expectation Maximization for Motif Elicitation, v5.4.1) (Available online: https://meme-suite.org/meme/, accessed on 10 October 2022) was used to identify the conserved motifs in the BnTPS proteins sequence [43] with ten motif numbers. The gene structure information was shown in the genome annotation files. The Tbtools software was used to display the gene and motif structures [42]. Promoter (2 kb upstream sequences from initiation codon) sequences were extracted from genome sequence to predict the cis-acting regulatory elements via online software PlantCARE5 (Available online: https://bioinformatics.psb.ugent.be/webtools/plantcare/html/, accessed on 10 October 2022) [44]. The chromosomal locations of BnTPS genes were also displayed by Tbtools software [42].
4.4. Phylogenetic Analysis of TPS Genes
To reveal the evolutionary relationships of TPS genes, multiple sequence alignments of BnTPS and AtTPS protein sequences were performed by ClustalW software [45]. We then used the software MEGA to construct an evolutionary tree based on the result of multiple sequence alignments with the NJ method [46]. Furthermore, online software iTOL v6.5.2 (Available online: https://itol.embl.de/, accessed on 10 October 2022) [47] was used to visualize the phylogenetic tree.
4.5. Prediction of Protein–Protein Interactions
Based on the homologous genes in A. thaliana, the protein–protein interaction networks of the BnTPS proteins were predicted. The software Cytoscape [48] was used to display the PPIs that were retrieved from STRING (Available online: https://www.string-db.org/, accessed on 11 October 2022) [49]. All of these genes within the interaction underwent Gene Ontology and KEGG enrichment analysis using the R package clusterProfiler to investigate the biological functions [50].
4.6. Expression Pattern Analysis of BnTPS Genes
There were five tissues (leaf, callus, bud, root, and silique) and four stress conditions’ (dehydration, salt, cold, and abscisic acid) transcriptome data from previous studies [23,24]. The expression levels of BnTPS genes were calculated with the software Stringtie [51] after alignment with software Hisat2 [52] and then displayed by Pheatmap and UpSet in R.
4.7. Association Mapping of TPS Genes in a Germplasm Accession Population of B. napus
A worldwide 324 diverse B. napus core collection germplasm was used to investigate the potential effects of BnTPS genes on regulating important traits. All the SNPs in BnTPS gene region were annotated by the software SnpEff [53]. PFT, FFT1, FFT2, early flowering stage (EFS), late flowering stage (LFS), flowering period (FP), plant height (PH), thousand-seed weight (TSW), glucosinolate (GLU), and erucic acid were selected as studied traits [25]. The rMVP software was used for association mapping analysis between genetic variants and agronomic traits with the general linear model (GLM) method [54]. The p value (0.05/N) was set as the significant threshold.
5. Conclusions
In this study, 26 BnTPS genes were identified and investigated. These BnTPS genes were grouped into two groups. BnTPS genes from the same groups have similar structures and motifs. Many important cis-acting regulatory elements responsible for plant growth and stress response were detected in the promoters of BnTPS genes. The protein interaction analysis showed that BnTPS genes played an important role in development and stress resistance. The various expression patterns of BnTPS genes were revealed in different tissues and under abiotic stresses. Additionally, the association mapping results also showed that the BnTPS genes potentially influence agronomic traits in B. napus. In summary, these results offered comprehensive knowledge about BnTPS genes, which provided a basis for further functional research and genetic improvement for the breeding of superior B. napus varieties.
Supplementary Materials
The following supporting information can be downloaded at: https://www.mdpi.com/article/10.3390/ijms232415714/s1.
Author Contributions
M.H., C.T., M.X. and S.L., designed the research; formal analysis, M.H. and M.X.; funding acquisition, S.L. and C.T.; investigation, M.H., X.C. (Xiaobo Cui) and M.X.; data curation, X.C. (Xiaohui Cheng), J.H. and L.L.; project administration, C.T.; resources, M.H. and M.X.; M.H. wrote the manuscript; review and editing, S.L., C.T. and M.H. All authors have read and agreed to the published version of the manuscript.
Funding
This research was funded by the Young Top-notch Talent Cultivation Program of Hubei Province for Chaobo Tong, the National Natural Science Foundation of China (31770250), the National Key Research and Development Program of China (2018YFE0108000), Central Public-interest Scientific Institution Basal Research Fund, grant number 2021-2060302-061-027 No: 2021-2060302-061-029, the Agricultural Science and Technology Innovation Program of Chinese Academy of Agricultural Sciences (CAAS-ASTIP-2013-OCRI), China Agriculture Research System of MOF and MARA (CARS-12).
Institutional Review Board Statement
Not applicable.
Informed Consent Statement
Not applicable.
Data Availability Statement
The corresponding data are shown in Supplementary Materials.
Acknowledgments
We would like to thank Zhixian Qiao at The Analysis and Testing Center of Institute of Hydrobiology, Chinese Academy of Sciences, for her assistance with data analysis.
Conflicts of Interest
The authors declare no conflict of interest.
References
- Elbein, A.D.; Pan, Y.T.; Pastuszak, I.; Carroll, D. New insights on trehalose: A multifunctional molecule. Glycobiology 2003, 13, 17r–27r. [Google Scholar] [CrossRef] [PubMed]
- Paul, M.; Pellny, T.; Goddijn, O. Enhancing photosynthesis with sugar signals. Trends Plant Sci. 2001, 6, 197–200. [Google Scholar] [CrossRef] [PubMed]
- Avonce, N.; Leyman, B.; Mascorro-Gallardo, J.O.; Van Dijck, P.; Thevelein, J.M.; Iturriaga, G. The Arabidopsis trehalose-6-P synthase AtTPS1 gene is a regulator of glucose, abscisic acid, and stress signaling. Plant Physiol. 2004, 136, 3649–3659. [Google Scholar] [CrossRef] [PubMed]
- Fernandez, O.; Béthencourt, L.; Quero, A.; Sangwan, R.S.; Clément, C. Trehalose and plant stress responses: Friend or foe? Trends Plant Sci. 2010, 15, 409–417. [Google Scholar] [CrossRef] [PubMed]
- Avonce, N.; Mendoza-Vargas, A.; Morett, E.; Iturriaga, G. Insights on the evolution of trehalose biosynthesis. BMC Ecol. Evol. 2006, 6, 109. [Google Scholar] [CrossRef]
- Lunn, J.E.; Delorge, I.; Figueroa, C.M.; Van Dijck, P.; Stitt, M. Trehalose metabolism in plants. Plant J. 2014, 79, 544–567. [Google Scholar] [CrossRef]
- Yang, H.L.; Liu, Y.J.; Wang, C.L.; Zeng, Q.Y. Molecular evolution of trehalose-6-phosphate synthase (TPS) gene family in Populus, Arabidopsis and rice. PLoS ONE 2012, 7, e42438. [Google Scholar] [CrossRef]
- Li, H.W.; Zang, B.S.; Deng, X.W.; Wang, X.P. Overexpression of the trehalose-6-phosphate synthase gene OsTPS1 enhances abiotic stress tolerance in rice. Planta 2011, 234, 1007–1018. [Google Scholar] [CrossRef]
- Kosmas, S.A.; Argyrokastritis, A.; Loukas, M.G.; Eliopoulos, E.; Tsakas, S.; Kaltsikes, P.J. Isolation and characterization of drought-related trehalose 6-phosphate-synthase gene from cultivated cotton (Gossypium hirsutum L.). Planta 2006, 223, 329–339. [Google Scholar] [CrossRef]
- Hwang, G.; Kim, S.; Cho, J.Y.; Paik, I.; Kim, J.I.; Oh, E. Trehalose-6-phosphate signaling regulates thermoresponsive hypocotyl growth in Arabidopsis thaliana. EMBO Rep. 2019, 20, e47828. [Google Scholar] [CrossRef]
- Schluepmann, H.; Pellny, T.; van Dijken, A.; Smeekens, S.; Paul, M. Trehalose 6-phosphate is indispensable for carbohydrate utilization and growth in Arabidopsis thaliana. Proc. Natl. Acad. Sci. USA 2003, 100, 6849–6854. [Google Scholar] [CrossRef]
- Gómez, L.D.; Baud, S.; Gilday, A.; Li, Y.; Graham, I.A. Delayed embryo development in the ARABIDOPSIS TREHALOSE-6-PHOSPHATE SYNTHASE 1 mutant is associated with altered cell wall structure, decreased cell division and starch accumulation. Plant J. 2006, 46, 69–84. [Google Scholar] [CrossRef]
- Wahl, V.; Ponnu, J.; Schlereth, A.; Arrivault, S.; Langenecker, T.; Franke, A.; Feil, R.; Lunn, J.E.; Stitt, M.; Schmid, M. Regulation of flowering by trehalose-6-phosphate signaling in Arabidopsis thaliana. Science 2013, 339, 704–707. [Google Scholar] [CrossRef]
- Yu, S.; Cao, L.; Zhou, C.M.; Zhang, T.Q.; Lian, H.; Sun, Y.; Wu, J.; Huang, J.; Wang, G.; Wang, J.W. Sugar is an endogenous cue for juvenile-to-adult phase transition in plants. eLife 2013, 2, e00269. [Google Scholar] [CrossRef]
- Vandesteene, L.; Ramon, M.; Le Roy, K.; Van Dijck, P.; Rolland, F. A single active trehalose-6-P synthase (TPS) and a family of putative regulatory TPS-like proteins in Arabidopsis. Mol. Plant 2010, 3, 406–419. [Google Scholar] [CrossRef]
- Zang, B.; Li, H.; Li, W.; Deng, X.W.; Wang, X. Analysis of trehalose-6-phosphate synthase (TPS) gene family suggests the formation of TPS complexes in rice. Plant Mol. Biol. 2011, 76, 507–522. [Google Scholar] [CrossRef]
- Dan, Y.; Niu, Y.; Wang, C.; Yan, M.; Liao, W. Genome-wide identification and expression analysis of the trehalose-6-phosphate synthase (TPS) gene family in cucumber (Cucumis sativus L.). PeerJ 2021, 9, e11398. [Google Scholar] [CrossRef]
- Chalhoub, B.; Denoeud, F.; Liu, S.; Parkin, I.A.; Tang, H.; Wang, X.; Chiquet, J.; Belcram, H.; Tong, C.; Samans, B.; et al. Plant genetics. Early allopolyploid evolution in the post-Neolithic Brassica napus oilseed genome. Science 2014, 345, 950–953. [Google Scholar] [CrossRef]
- Camacho, C.; Coulouris, G.; Avagyan, V.; Ma, N.; Papadopoulos, J.; Bealer, K.; Madden, T.L. BLAST+: Architecture and applications. BMC Bioinf. 2009, 10, 421. [Google Scholar] [CrossRef]
- Wang, Y.; Tang, H.; Debarry, J.D.; Tan, X.; Li, J.; Wang, X.; Lee, T.H.; Jin, H.; Marler, B.; Guo, H.; et al. MCScanX: A toolkit for detection and evolutionary analysis of gene synteny and collinearity. Nucleic Acids Res. 2012, 40, e49. [Google Scholar] [CrossRef]
- Fichtner, F.; Olas, J.J.; Feil, R.; Watanabe, M.; Krause, U.; Hoefgen, R.; Stitt, M.; Lunn, J.E. Functional Features of TREHALOSE-6-PHOSPHATE SYNTHASE1, an Essential Enzyme in Arabidopsis. Plant Cell 2020, 32, 1949–1972. [Google Scholar] [CrossRef] [PubMed]
- Oudelaar, A.M.; Higgs, D.R. The relationship between genome structure and function. Nat. Rev. Genet. 2021, 22, 154–168. [Google Scholar] [CrossRef] [PubMed]
- Yao, S.; Liang, F.; Gill, R.A.; Huang, J.; Cheng, X.; Liu, Y.; Tong, C.; Liu, S. A global survey of the transcriptome of allopolyploid Brassica napus based on single-molecule long-read isoform sequencing and Illumina-based RNA sequencing data. Plant J. 2020, 103, 843–857. [Google Scholar] [CrossRef] [PubMed]
- Zhang, Y.; Ali, U.; Zhang, G.; Yu, L.; Fang, S.; Iqbal, S.; Li, H.; Lu, S.; Guo, L. Transcriptome analysis reveals genes commonly responding to multiple abiotic stresses in rapeseed. Mol. Breed. 2019, 39, 158. [Google Scholar] [CrossRef]
- Tang, M. Population Genome Variations and Subgenome Asymmetry in Brassica napus L. Ph.D. Thesis, Huazhong Agricultural University, Wuhan, China, 2019. [Google Scholar]
- Xu, Y.; Wang, Y.; Mattson, N.; Yang, L.; Jin, Q. Genome-wide analysis of the Solanum tuberosum (potato) trehalose-6-phosphate synthase (TPS) gene family: Evolution and differential expression during development and stress. BMC Genom. 2017, 18, 926. [Google Scholar] [CrossRef] [PubMed]
- Du, L.; Qi, S.; Ma, J.; Xing, L.; Fan, S.; Zhang, S.; Li, Y.; Shen, Y.; Zhang, D.; Han, M. Identification of TPS family members in apple (Malus x domestica Borkh.) and the effect of sucrose sprays on TPS expression and floral induction. Plant Physiol. Biochem. 2017, 120, 10–23. [Google Scholar] [CrossRef]
- Xie, D.W.; Wang, X.N.; Fu, L.S.; Sun, J.; Zheng, W.; Li, Z.F. Identification of the trehalose-6-phosphate synthase gene family in winter wheat and expression analysis under conditions of freezing stress. J. Genet. 2015, 94, 55–65. [Google Scholar] [CrossRef]
- Mu, M.; Lu, X.K.; Wang, J.J.; Wang, D.L.; Yin, Z.J.; Wang, S.; Fan, W.L.; Ye, W.W. Genome-wide Identification and analysis of the stress-resistance function of the TPS (Trehalose-6-Phosphate Synthase) gene family in cotton. BMC Genet. 2016, 17, 54. [Google Scholar]
- Van Dijck, P.; Mascorro-Gallardo, J.O.; De Bus, M.; Royackers, K.; Iturriaga, G.; Thevelein, J.M. Truncation of Arabidopsis thaliana and Selaginella lepidophylla trehalose-6-phosphate synthase unlocks high catalytic activity and supports high trehalose levels on expression in yeast. Biochem. J. 2002, 366, 63–71. [Google Scholar] [CrossRef]
- Hadiarto, T.; Tran, L.S. Progress studies of drought-responsive genes in rice. Plant Cell Rep. 2011, 30, 297–310. [Google Scholar] [CrossRef]
- Kondrák, M.; Marincs, F.; Kalapos, B.; Juhász, Z.; Bánfalvi, Z. Transcriptome analysis of potato leaves expressing the trehalose-6-phosphate synthase 1 gene of yeast. PLoS ONE 2011, 6, e23466. [Google Scholar] [CrossRef]
- Muller, B.; Pantin, F.; Génard, M.; Turc, O.; Freixes, S.; Piques, M.; Gibon, Y. Water deficits uncouple growth from photosynthesis, increase C content, and modify the relationships between C and growth in sink organs. J. Exp. Bot. 2011, 62, 1715–1729. [Google Scholar] [CrossRef]
- Fernandez, O.; Vandesteene, L.; Feil, R.; Baillieul, F.; Lunn, J.E.; Clément, C. Trehalose metabolism is activated upon chilling in grapevine and might participate in Burkholderia phytofirmans induced chilling tolerance. Planta 2012, 236, 355–369. [Google Scholar] [CrossRef]
- Van Dijken, A.J.; Schluepmann, H.; Smeekens, S.C. Arabidopsis trehalose-6-phosphate synthase 1 is essential for normal vegetative growth and transition to flowering. Plant Physiol. 2004, 135, 969–977. [Google Scholar] [CrossRef]
- Mistry, J.; Chuguransky, S.; Williams, L.; Qureshi, M.; Salazar, G.A.; Sonnhammer, E.L.L.; Tosatto, S.C.E.; Paladin, L.; Raj, S.; Richardson, L.J.; et al. Pfam: The protein families database in 2021. Nucleic Acids Res. 2021, 49, D412–D419. [Google Scholar] [CrossRef]
- Lu, S.; Wang, J.; Chitsaz, F.; Derbyshire, M.K.; Geer, R.C.; Gonzales, N.R.; Gwadz, M.; Hurwitz, D.I.; Marchler, G.H.; Song, J.S.; et al. CDD/SPARCLE: The conserved domain database in 2020. Nucleic Acids Res. 2020, 48, D265–D268. [Google Scholar] [CrossRef]
- Letunic, I.; Khedkar, S.; Bork, P. SMART: Recent updates, new developments and status in 2020. Nucleic Acids Res. 2021, 49, D458–D460. [Google Scholar] [CrossRef]
- Wilkins, M.R.; Gasteiger, E.; Bairoch, A.; Sanchez, J.C.; Williams, K.L.; Appel, R.D.; Hochstrasser, D.F. Protein identification and analysis tools in the ExPASy server. Methods Mol. Biol. 1999, 112, 531–552. [Google Scholar]
- Yu, C.S.; Chen, Y.C.; Lu, C.H.; Hwang, J.K. Prediction of protein subcellular localization. Proteins 2006, 64, 643–651. [Google Scholar] [CrossRef]
- Krzywinski, M.; Schein, J.; Birol, I.; Connors, J.; Gascoyne, R.; Horsman, D.; Jones, S.J.; Marra, M.A. Circos: An information aesthetic for comparative genomics. Genome Res. 2009, 19, 1639–1645. [Google Scholar] [CrossRef]
- Chen, C.; Chen, H.; Zhang, Y.; Thomas, H.R.; Frank, M.H.; He, Y.; Xia, R. TBtools: An Integrative Toolkit Developed for Interactive Analyses of Big Biological Data. Mol. Plant 2020, 13, 1194–1202. [Google Scholar] [CrossRef] [PubMed]
- Bailey, T.L.; Boden, M.; Buske, F.A.; Frith, M.; Grant, C.E.; Clementi, L.; Ren, J.; Li, W.W.; Noble, W.S. MEME SUITE: Tools for motif discovery and searching. Nucleic Acids Res. 2009, 37, W202–W208. [Google Scholar] [CrossRef] [PubMed]
- Lescot, M.; Déhais, P.; Thijs, G.; Marchal, K.; Moreau, Y.; Van de Peer, Y.; Rouzé, P.; Rombauts, S. PlantCARE, a database of plant cis-acting regulatory elements and a portal to tools for in silico analysis of promoter sequences. Nucleic Acids Res. 2002, 30, 325–327. [Google Scholar] [CrossRef] [PubMed]
- Larkin, M.A.; Blackshields, G.; Brown, N.P.; Chenna, R.; McGettigan, P.A.; McWilliam, H.; Valentin, F.; Wallace, I.M.; Wilm, A.; Lopez, R.; et al. Clustal W and Clustal X version 2.0. Bioinformatics 2007, 23, 2947–2948. [Google Scholar] [CrossRef] [PubMed]
- Tamura, K.; Stecher, G.; Kumar, S. MEGA11: Molecular Evolutionary Genetics Analysis Version 11. Mol. Biol. Evol. 2021, 38, 3022–3027. [Google Scholar] [CrossRef]
- Letunic, I.; Bork, P. Interactive Tree Of Life (iTOL) v5: An online tool for phylogenetic tree display and annotation. Nucleic Acids Res. 2021, 49, W293–W296. [Google Scholar] [CrossRef]
- Shannon, P.; Markiel, A.; Ozier, O.; Baliga, N.S.; Wang, J.T.; Ramage, D.; Amin, N.; Schwikowski, B.; Ideker, T. Cytoscape: A software environment for integrated models of biomolecular interaction networks. Genome Res. 2003, 13, 2498–2504. [Google Scholar] [CrossRef]
- Szklarczyk, D.; Gable, A.L.; Nastou, K.C.; Lyon, D.; Kirsch, R.; Pyysalo, S.; Doncheva, N.T.; Legeay, M.; Fang, T.; Bork, P.; et al. The STRING database in 2021: Customizable protein-protein networks, and functional characterization of user-uploaded gene/measurement sets. Nucleic Acids Res. 2021, 49, D605–D612. [Google Scholar] [CrossRef]
- Yu, G.; Wang, L.G.; Han, Y.; He, Q.Y. Clusterprofiler: An R package for comparing biological themes among gene clusters. OMICS J. Integr. Biol. 2012, 16, 284–287. [Google Scholar] [CrossRef]
- Pertea, M.; Pertea, G.M.; Antonescu, C.M.; Chang, T.C.; Mendell, J.T.; Salzberg, S.L. StringTie enables improved reconstruction of a transcriptome from RNA-seq reads. Nat. Biotechnol. 2015, 33, 290–295. [Google Scholar] [CrossRef]
- Kim, D.; Langmead, B.; Salzberg, S.L. HISAT: A fast spliced aligner with low memory requirements. Nat. Methods 2015, 12, 357–360. [Google Scholar] [CrossRef]
- Cingolani, P.; Platts, A.; Wang, L.L.; Coon, M.; Nguyen, T.; Wang, L.; Land, S.J.; Lu, X.; Ruden, D.M. A program for annotating and predicting the effects of single nucleotide polymorphisms, SnpEff: SNPs in the genome of Drosophila melanogaster strain w1118; iso-2; iso-3. Fly 2012, 6, 80–92. [Google Scholar] [CrossRef]
- Yin, L.; Zhang, H.; Tang, Z.; Xu, J.; Yin, D.; Zhang, Z.; Yuan, X.; Zhu, M.; Zhao, S.; Li, X.; et al. rMVP: A Memory-efficient, Visualization-enhanced, and Parallel-accelerated Tool for Genome-wide Association Study. Genom. Proteom. Bioinf. 2021, 19, 619–628. [Google Scholar] [CrossRef]
Publisher’s Note: MDPI stays neutral with regard to jurisdictional claims in published maps and institutional affiliations. |
© 2022 by the authors. Licensee MDPI, Basel, Switzerland. This article is an open access article distributed under the terms and conditions of the Creative Commons Attribution (CC BY) license (https://creativecommons.org/licenses/by/4.0/).