Article

The Integration of Genome-Wide Association Study and Homology Analysis to Explore the Genomic Regions and Candidate Genes for Panicle-Related Traits in Foxtail Millet

Shanxi Key Laboratory of Minor Crop Germplasm Innovation and Molecular Breeding, College of Agriculture, Shanxi Agricultural University, Taiyuan 030031, China
*
Author to whom correspondence should be addressed.
Int. J. Mol. Sci. 2022, 23(23), 14735; https://doi.org/10.3390/ijms232314735
Submission received: 5 October 2022 / Revised: 26 October 2022 / Accepted: 22 November 2022 / Published: 25 November 2022
(This article belongs to the Section Molecular Genetics and Genomics)

Abstract

:
Panicle traits are important factors affecting yield, and their improvement has long been a critical goal in foxtail millet breeding. In order to understand the genetic basis of panicle formation, a large-scale genome-wide association study (GWAS) was performed in this study for six panicle-related traits based on 706,646 high-polymorphism SNP loci in 407 accessions. As a result, 87 quantitative trait loci (QTL) regions with a physical distance of less than 100 kb were detected to be associated with these traits in three environments. Among them, 27 core regions were stably detected in at least two environments. Based on rice–foxtail millet homologous comparison, expression, and haplotype analysis, 27 high-confidence candidate genes in the QTL regions, such as Si3g11200 (OsDER1), Si1g27910 (OsMADS6), Si7g27560 (GS5), etc., affected panicle-related traits by involving multiple plant growth regulator pathways, a photoperiod response, as well as panicle and grain development. Most of these genes showed multiple effects on different panicle-related traits, such as Si3g11200 affecting all six traits. In summary, this study clarified a strategy based on the integration of GWAS, a homologous comparison, and haplotype analysis to discover the genomic regions and candidate genes for important traits in foxtail millet. The detected QTL regions and candidate genes could be further used for gene clone and marker-assisted selection in foxtail millet breeding.

1. Introduction

Foxtail millet (Setaria italica L.) is one of the oldest cereal crops and has been domesticated from green foxtail (Setaria viridis L.) about 11,000 years ago in northern China [1]. Throughout the history of human farming civilization, foxtail millet has long been cultivated as a staple food in arid and semi-arid regions, particularly in China and India [2]. As a traditional C4 crop, foxtail millet has the characteristics of high water use efficiency, drought resistance, and wide adaptability, which makes it a reserve crop for future extreme climate conditions. Millet, the dehusked grain of foxtail millet, is rich in essential amino acids, flavonoids, and a variety of minerals, which have important dietary therapeutic effects in improving human immunity [3]. After more than 10,000 years of planting and cultivation, due to different growth regions, climate, water, soil, and other environmental factors, the foxtail millet germplasm displays immense diversity with rich genetic diversity [4]. In addition, the rapid development of foxtail millet as a C4 model crop of Gramineae and the further exploitation of foxtail millet genetic resources and cutting-edge molecular breeding are inevitable due to rising consumer demand for healthy food [5].
In foxtail millet breeding, the improvements in yield and yield-related traits have long been a critical goal, and a key breeding approach for boosting grain output per unit growing area is producing varieties with huge panicles, long branches, high grain numbers, and enlarged grains. Panicle is the important source of foxtail millet yield, and its related traits, such as panicle length (PL), main panicle diameter (MPD), panicle weight per panicle (PWP), grain weight per panicle (GWP), and thousand-grain weight (TGW), directly affect the yield formation of foxtail millet. Therefore, improving panicle-related traits is always an important research area in foxtail millet breeding, especially in yield breeding. In addition to being directly related to yield, panicle-related traits, such as panicle length, affect the lodging resistance of foxtail millet. Although the foxtail millet industry in China has made great progress after 40 years of scientific breeding, the genetic basis for the formation of important agronomic traits in millet, especially the panicle architecture, is not clear.
Gramineae panicle architecture is influenced by a number of factors, including plant growth regulators, photoperiod, flower organs, grain development, etc. The most direct determinant is the fate of meristems and the transformation of branching meristems into spikelet meristems [6]. As a classical pathway for maintaining the growth and differentiation of plant inflorescence meristems, a large number of functional genes in the CLAVATA-WUSCHEL feedback loop pathway have been cloned and functionally analyzed in Rice, such as FON1, FON4 and OsWUS [7,8,9], and many MADS-box gene family members, including OsMADS14, OsMADS15, OsMADS18, and OsMADS34(PAP2), were shown to affect panicle architecture by regulating the meristem size and specification of meristem identities [10,11]. Unlike the CLAVATA-WUSCHEL pathway, which directly regulates the growth and differentiation of meristems, plant growth regulators such as cytokinin, auxin, and gibberellin affect the panicle structure, mainly by regulating the identity, initiation, and enlargement of inflorescence meristems. A loss of function in the OSCKX2 gene, which encodes the cytokinin oxidase dehydrogenase, causes cytokinin to accumulate in the inflorescence meristems, resulting in more branching and spikelets [12]. In contrast, the OSH1 gene in rice regulates the relative content of GA and cytokinin to promote meristem identities [13].
The majority of gene-based panicle architecture research studies have been conducted on rice and maize, with only a few examining foxtail millet. Doust et al. (2005) detected 14 QTLs associated with a primary branch number, primary branch density, spikelet number, and bristle length by QTL analysis in a bi-parental population derived from foxtail millet and green foxtail [14]. In other two QTL mapping studies, 12 and 32 QTL were also identified with some panicle-related traits, such as PWP, GWP, TGW, etc. [15,16]. Most of these studies were based on a small number of polymorphic loci, and fewer QTL were identified. A recent QTL mapping study based on 12 environments identified 159 QTLs associated with panicle-related traits, which improved our understanding of the genetic basis for panicle and yield formation in foxtail millet [17]. However, QTL results based on bi-parental populations are heavily dependent on the genetic background of the population and environment, which greatly limits the wide adaptability and stability of these QTLs in foxtail millet breeding programs [18].
While these preliminary studies have strengthened our understanding of the genetic basis for foxtail millet panicle-related traits, it is not necessary to use these observations to mine important genes regulating panicle-related traits and to improve yield in foxtail millet. Recently, with the rapid developments in DNA sequencing technology, a genome-wide association study (GWAS) has become a powerful tool for analyzing the genetic basis of important traits, especially for complex traits controlled by multiple genes. It has been widely used in QTL and in the genetic discovery of different traits in many crops, and achieved good results. The genetic basis of some complex traits, such as leaf and stripe rust resistance in break wheat, morphological traits exposed to drought in barley, agronomic traits in rice, and major biofuel traits in sorghum, has been analyzed by GWASs to some extent [19,20,21,22]. There are relatively few GWASs on foxtail millet, and only three large-scale GWASs have been reported to mine QTL and genes related to agronomic traits and metabolites in foxtail millet [5,23,24]. In addition, a large number of studies have confirmed the existence of convergent selection in the domestication and modern breeding of gramineous crops, and a series of genes, including TaKAO-4A, have been found in wheat by large-scale homology analysis, which are key candidate genes for the rice-like selection and regulation of agronomic traits [18]. Therefore, the homology analysis of genes regulating important agronomic traits in model species such as rice is also a way to find important functional genes in other species, especially for minor crops such as foxtail millet.
In this study, to understand the genetic basis of panicle formation in foxtail millet, a large-scale GWAS of 407 accessions was constructed using six panicle-related traits and genome resequencing data. The objectives of this study were to (1) evaluate the variation of six panicle-related traits under different environments and analyze their correlation; (2) genotype 407 foxtail millet accessions using genome resequencing data; (3) mine important genome regions affecting the panicle-related traits of foxtail millet based on GWAS; and (4) mine key candidate genes for panicle-related traits in foxtail millet based on homology alignment and haplotype analysis. This study will provide comprehensive and accurate information which will improve our understanding of the genetic basis of foxtail millet spike formation, and will help to mine important functional genes of millet.

2. Results

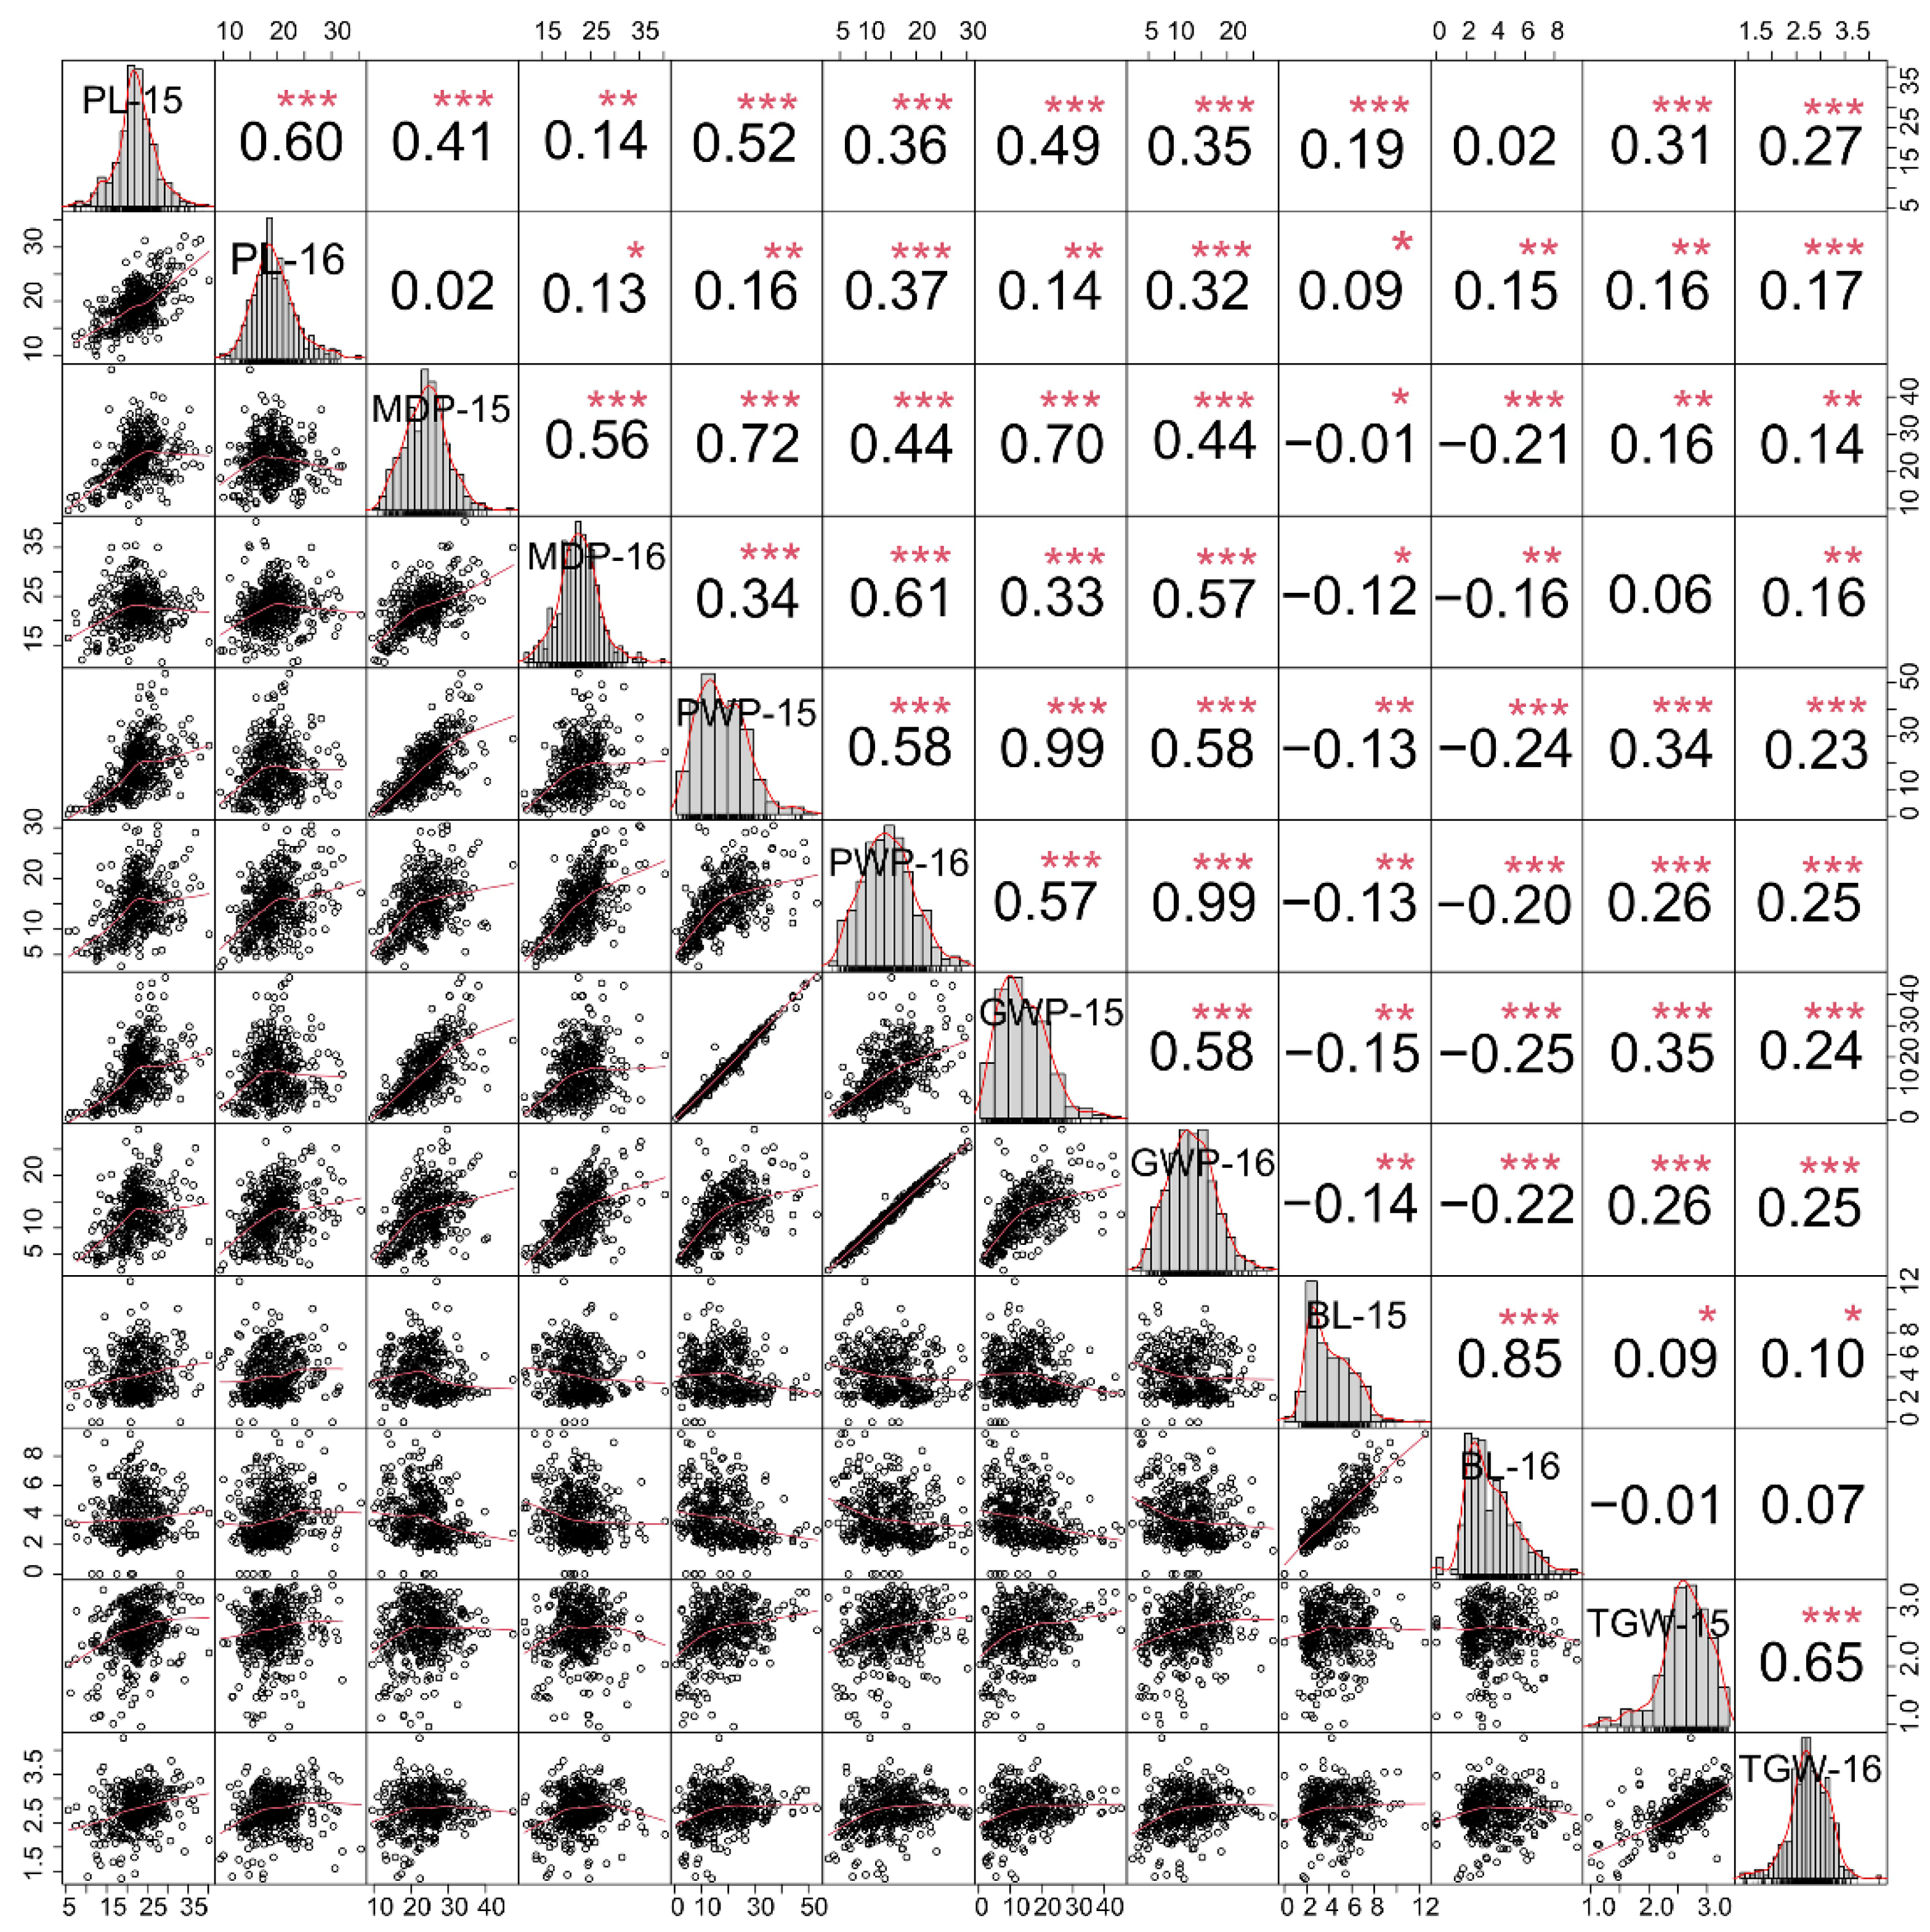
2.1. Phenotypic Characteristics of Six Panicle-Related Traits in Foxtail Millet

A total of 407 foxtail millet accessions from different original producing areas were investigated for spike-related traits for two consecutive years (Table S1). Six panicle-related traits all showed approximate normal distributions under two summer cropping seasons in 2015 and 2016 (Figure 1). Of which, the panicle length (PL), main panicle diameter (MPD), panicle weight per panicle (PWP), grain weight per panicle (GWP), and thousand-grain weight (TGW) were more consistent, while the bristle length (BL) showed a weak skewed distribution, which confirmed that these traits are all complex traits controlled by multiple genes. The six panicle-related traits had high broad-sense heritability (all above 0.7) in two environments, with a minimum of PWP (0.73) and a maximum of BL (0.91), which indicated that these traits are mainly affected by genotypes (Table 1). The coefficient of variation (CV) of different traits showed great differences among different genotypes. Among them, the CVs of TGW (19% and 16%) and PL (20% and 20%) were low, while the CVs of the remaining four traits were high, and the CV of GWP in 2015 reached 57%. In general, these accessions and their six panicle-related traits all showed significant differences in genotype and environment, indicating that the natural population of foxtail millet constructed with these 407 accessions was suitable for an genome-wide association study of these six panicle-related traits.
To clarify the relationships between these panicle-related traits, the Spearman approach was used to examine the basic correlations of six panicle-related traits in two environments (Figure 1). Other panicle-related traits, such as the PL, MPD, PWP, GWP, and TGW, were all significantly positively correlated, with the exception of the BL, which exhibited a weak correlation with other traits. In particular, the correlation coefficient between the PWP and the GWP was more than 0.95 under the same environment (p < 0.001), and the correlation coefficient between the MDP, the PWP, and the GWP was more than 0.7 (p < 0.001). The high correlation coefficients of these traits suggested that they might be regulated by the same multiple quantitative trait loci (QTL) or genes.

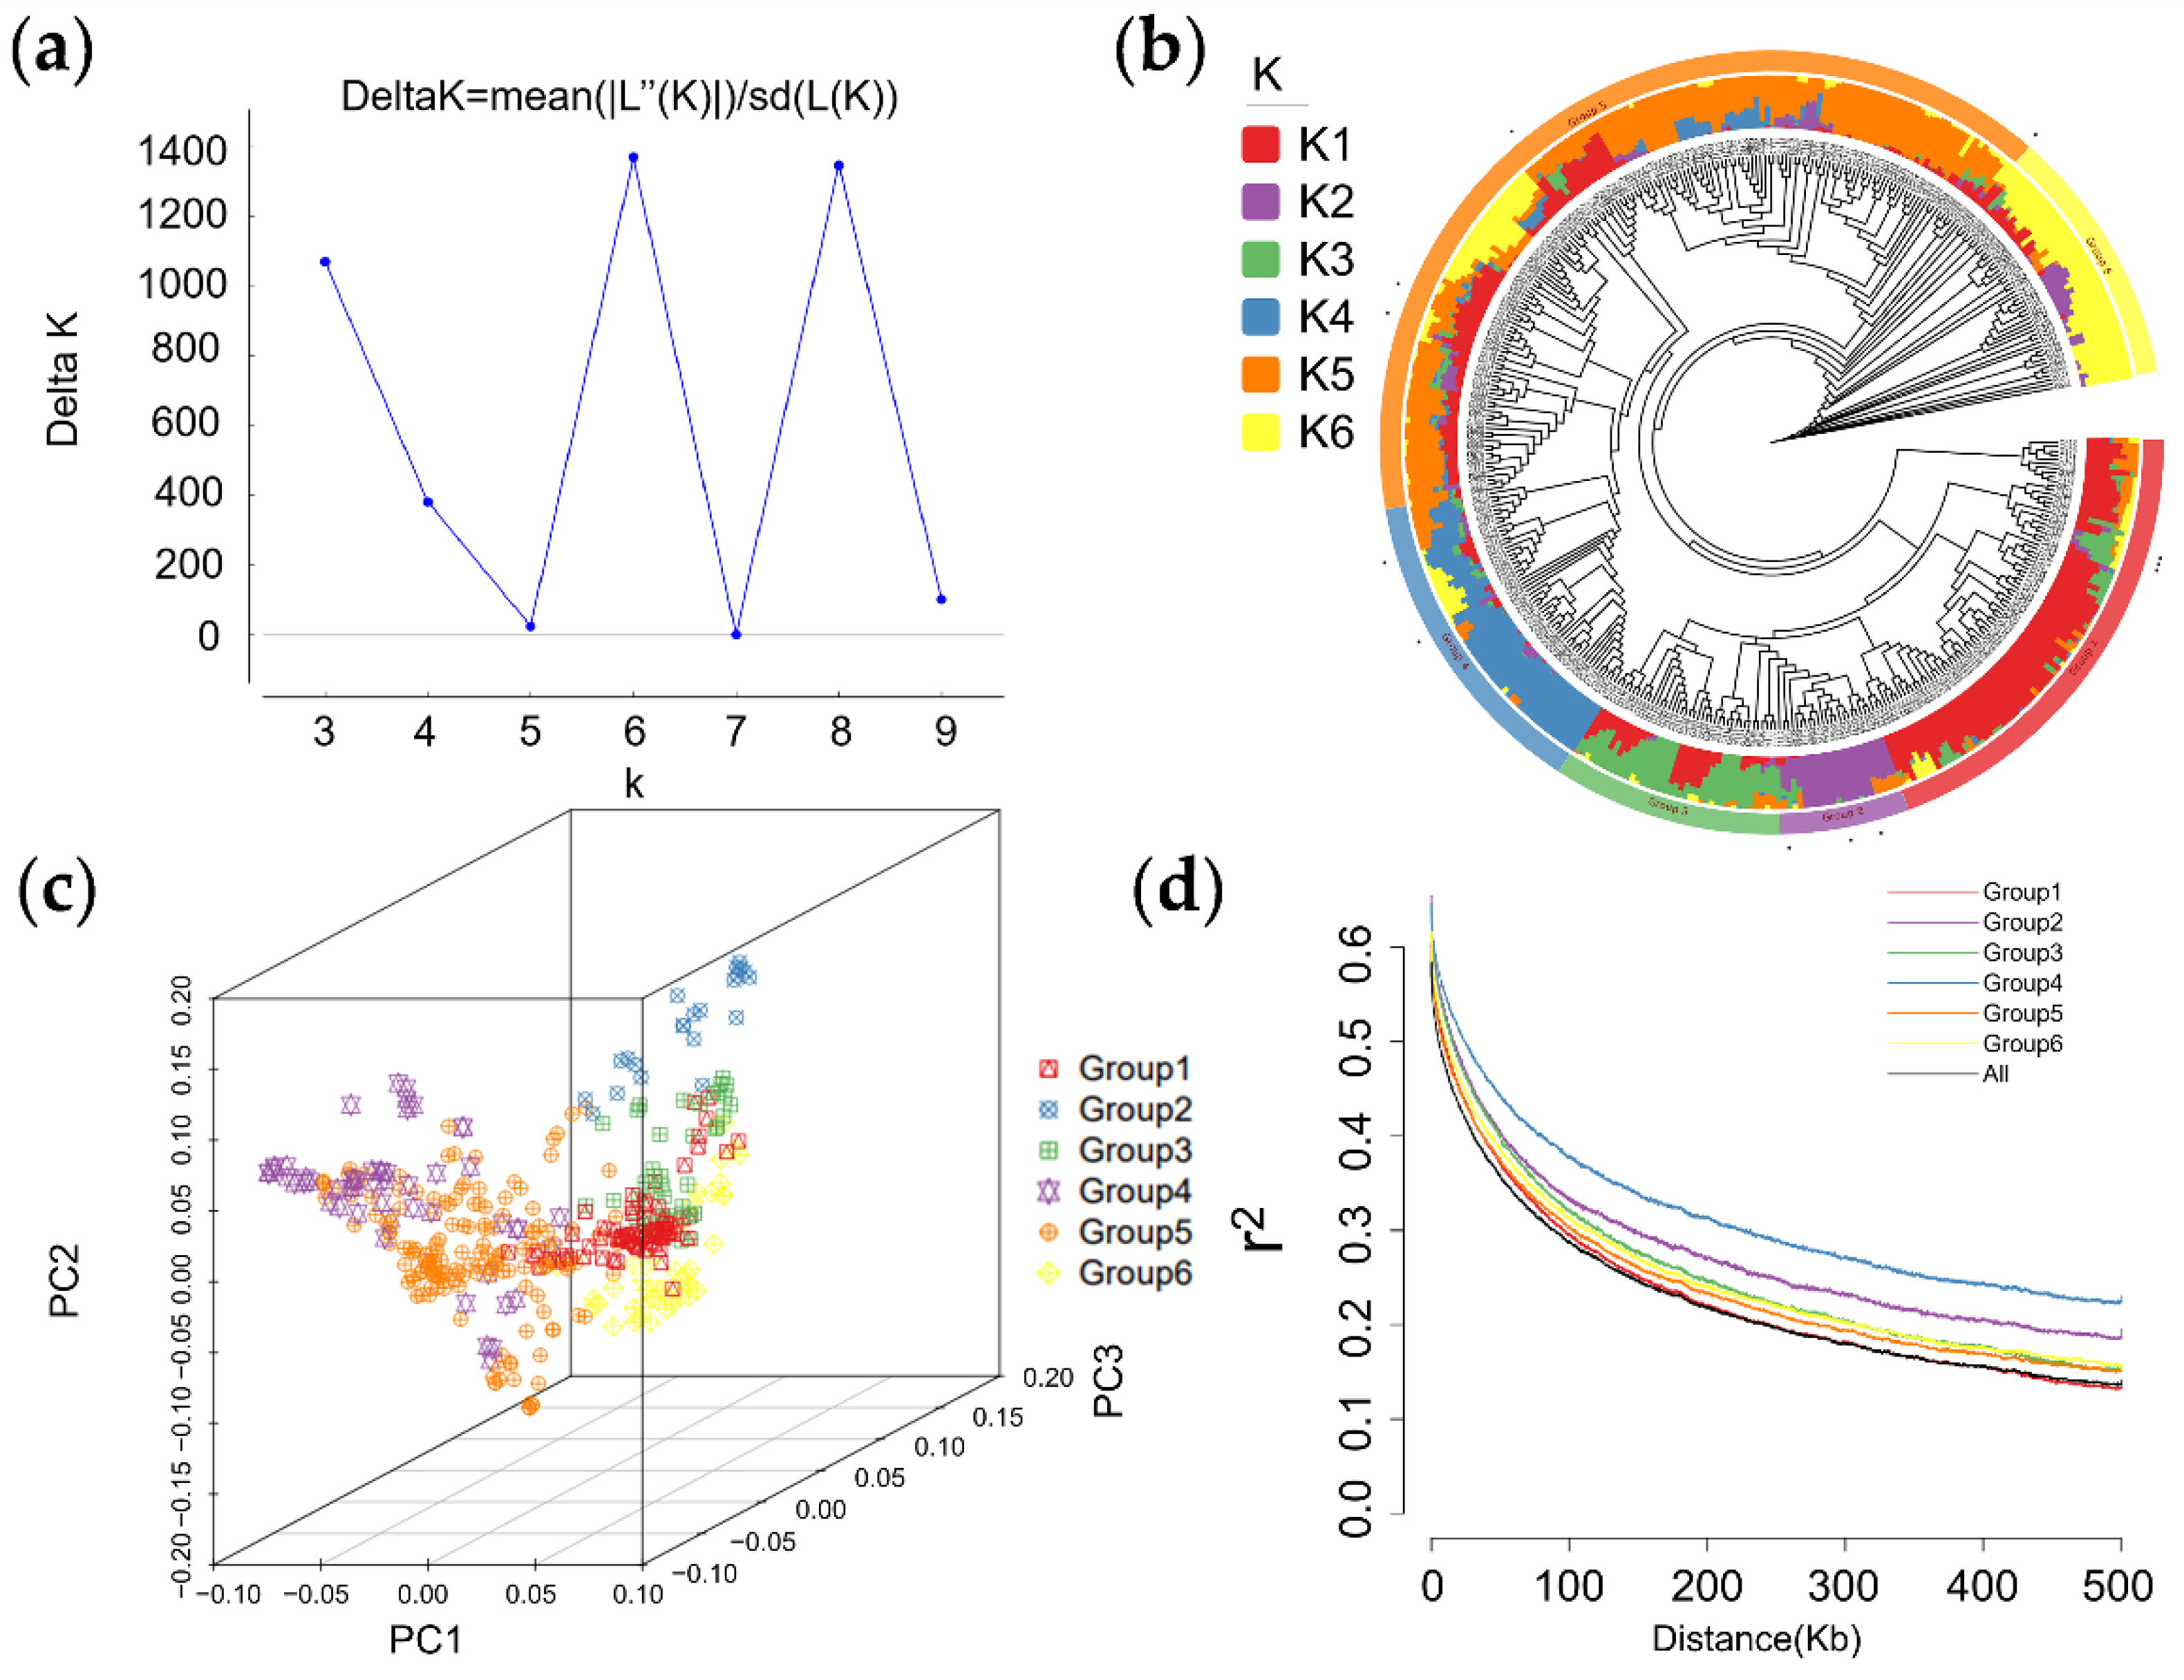
2.2. Genotyping, Population Structure, Principal Component, and Linkage Disequilibrium Analysis

After filtering out the SNP loci with a minor allele frequency (MAF) of <0.05 and missing data >20%, a total of 706,646 high-polymorphism SNP loci were obtained to genotype 407 foxtail millet accessions. The population structure was analyzed by FastStructure and k = 6 was chosen as the best fraction of the population structure after the Δk value was analyzed by Structure Harvester software (Figure 2a). Phylogenetic analysis showed that the 407 foxtail millet accessions were classified six 6 subgroups (Groups 1–6), which included 80, 22, 39, 54, 161, and 44 accessions, respectively. Twelve wild resources were distributed in Groups 1, 2, 4, and 5, with the exception of Groups 3 and 6 which were rich in modern cultivars. (Figure 2b). Similarly, six subgroups could be well classified by principal component analysis (Figure 2c). The linkage disequilibrium (LD) analysis showed that the LD attenuation distance of foxtail millet materials in different subgroups was inconsistent (Figure 2d). The LD of accessions in Group 4 attenuated slowly, while the LD of accessions in Group 1 attenuated most quickly. Genomic regions within 100 kb were regarded as a QTL region based on prior studies and the LD attenuation of all accessions [5,24]. Additionally, foxtail millet accessions of different subgroups also showed significant differences in six panicle-related traits (Figure 3). For example, accessions of Group 3 showed lower PWPs and GWPs in two environments, while those of Group 4 showed higher PWPs and GWPs. There is an interesting polarity between these two classes of materials with regards to the BL, suggesting that the domestication processes of some panicle-related features may have simultaneously occurred. These results indicate that there were significant differences among the six subgroups with phenotypic traits and genetic background.

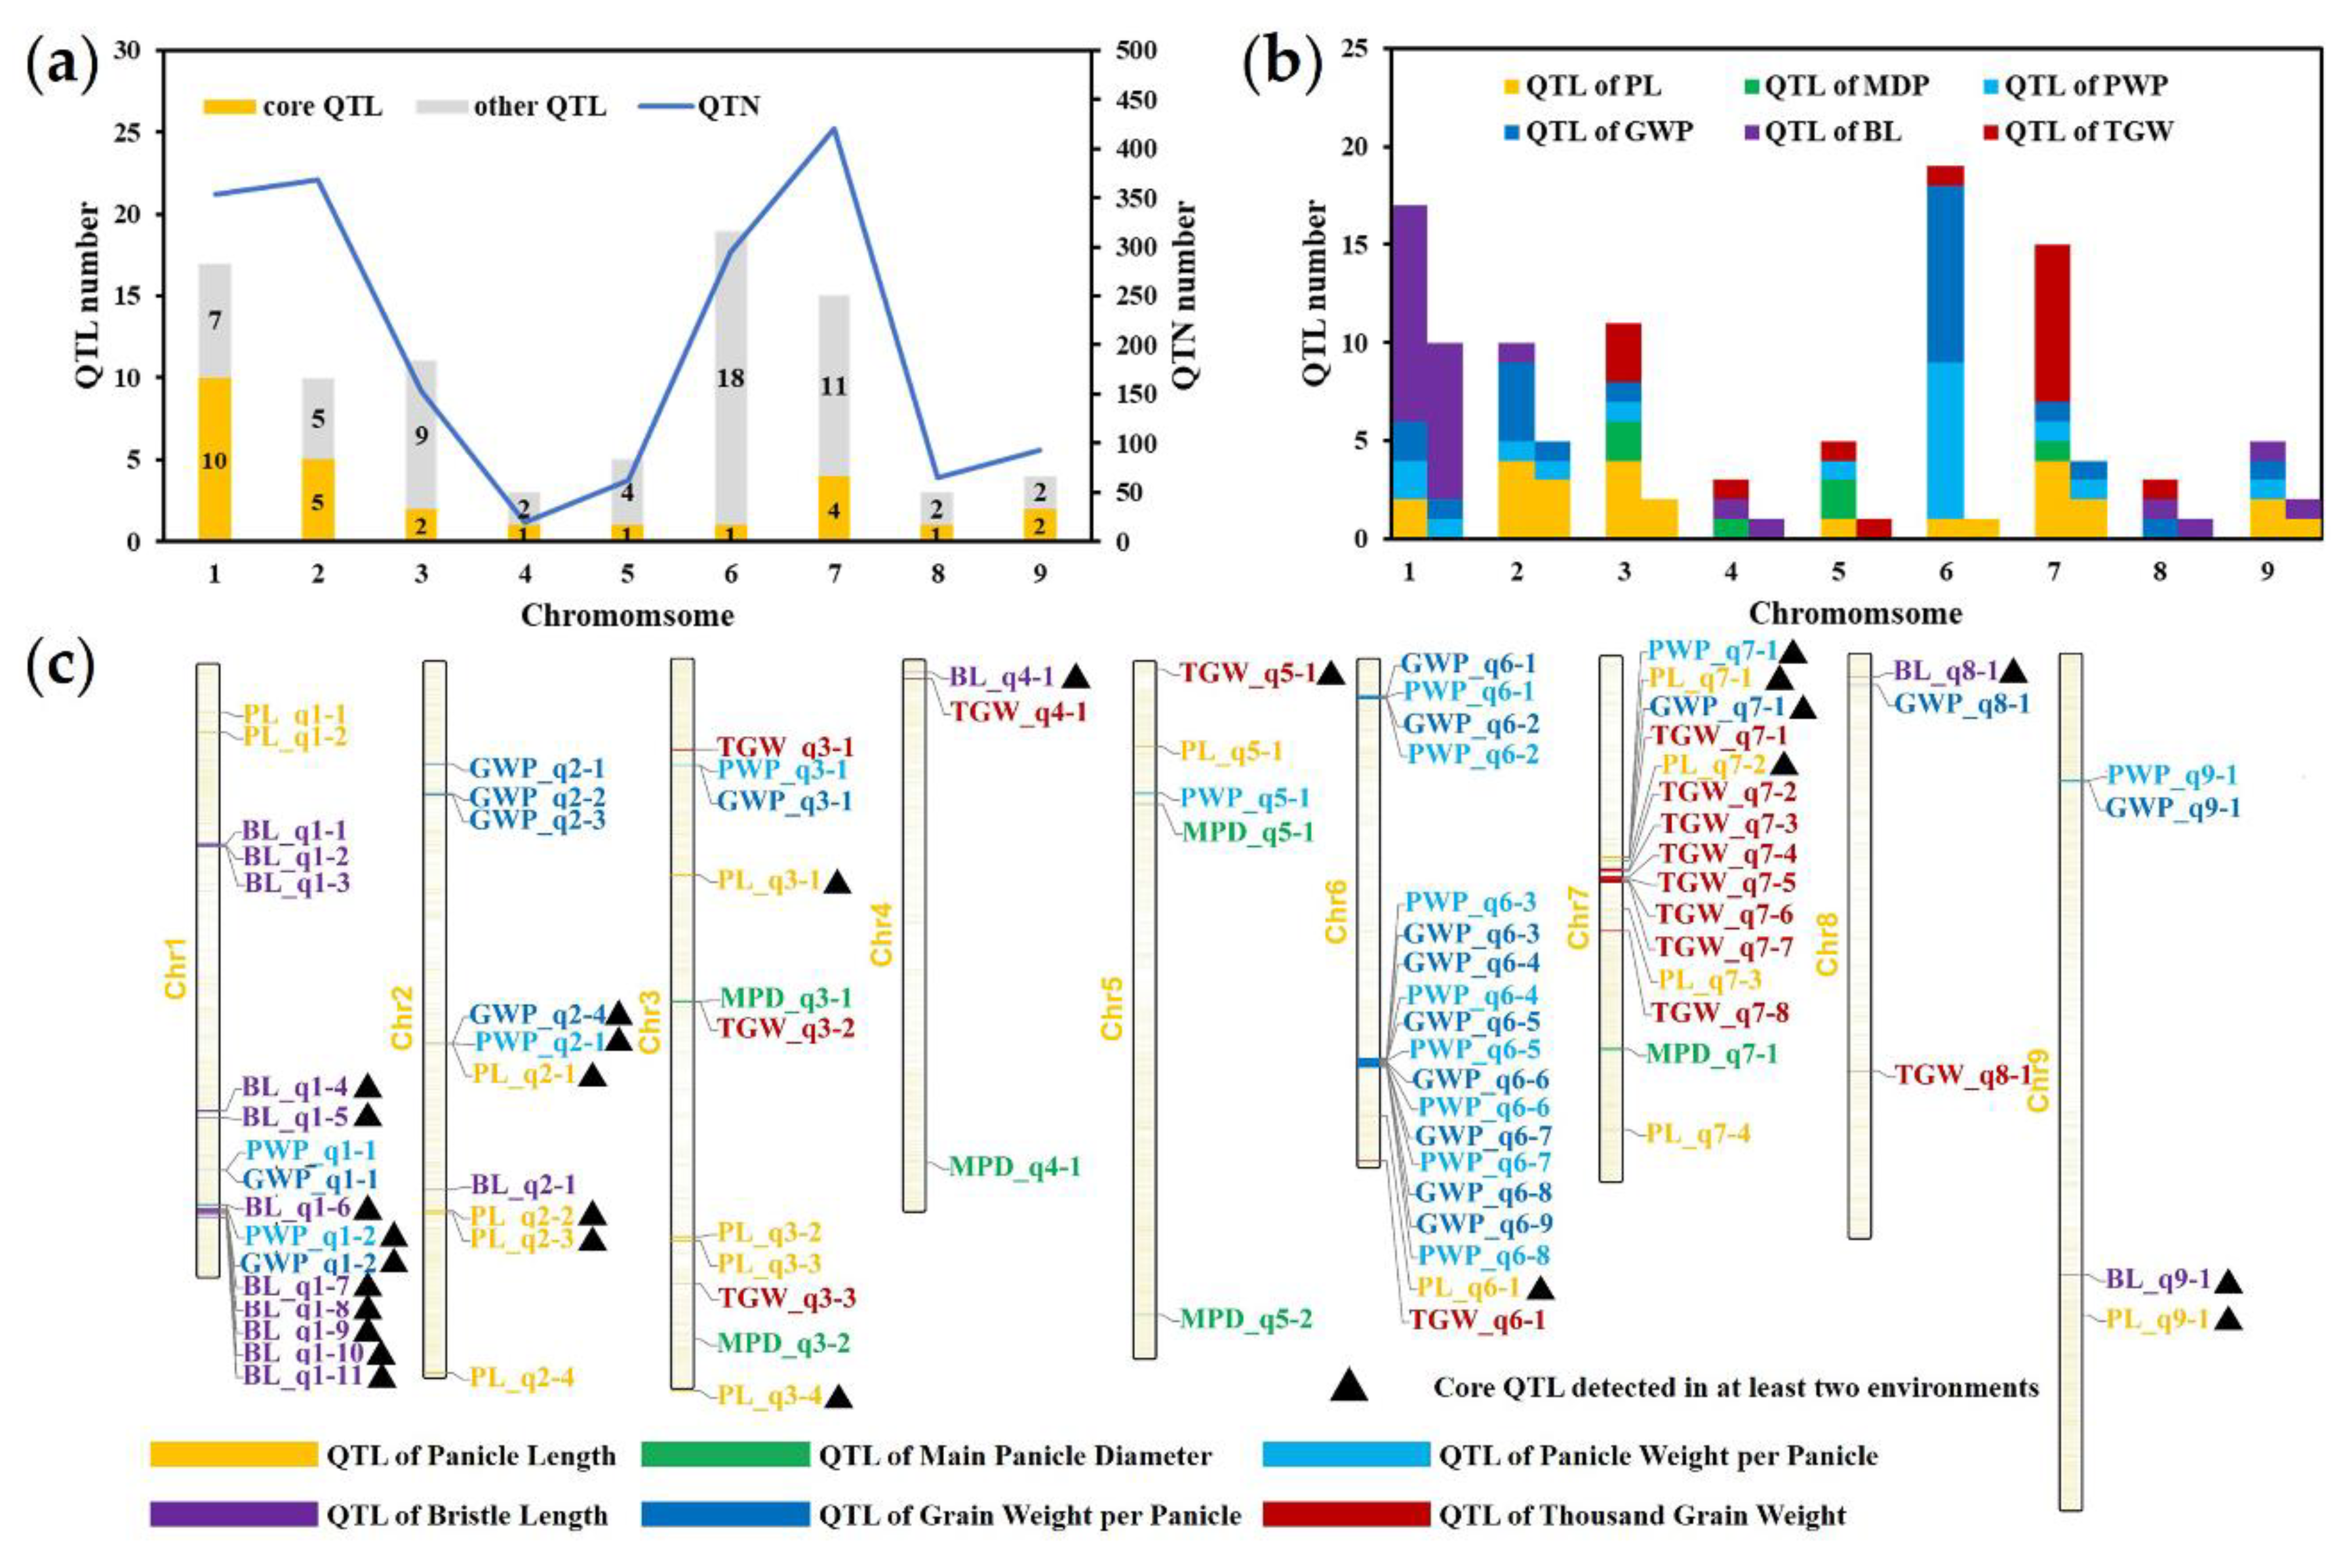
2.3. Quantitative Trait Nucleotides (QTNs) and QTL Regions for Six Panicle-Related Traits

The results of GWAS using the MLM model of Q (population structure) + K (kinship) strategy showed that the MLM model had good adaptability, and did not show obvious insufficient correction (Figure 4). The best linear unbiased prediction (BLUP) is one of statistical methods used by linear mixed models to predict random effects. The BLUP of random effects is similar to the best linear unbiased estimates (BLUEs) of fixed effects. The BLUP method can integrate multiple environmental data to remove environmental effects and obtain stable genetic phenotypes of individuals; therefore, it is often used as a set of phenotypic values for multi-environment QTL mapping and GWAS analysis. A total of 1830 QTNs were detected to be significantly associated with six panicle-related traits in multiple environments (2015, 2016, and BLUP) (Table 2). The number of QTNs related to different traits varied under different environments, explaining 0.01–26.78% of phenotypic variation. Among them, more QTNs were detected with BLUP values as phenotypic data than in the two natural environments, which was related to the fact that BLUP integrated the phenotypic values of two natural environments. In terms of two natural environments, the maximum number of QTNs significantly related to fact that the GWP in 2015 was 270, while the minimum number of QTNs significantly related to the BL in 2016 was 24. Large differences in the number of these QTNs were associated with phenotypic data for these traits, with the GWP likely being controlled by more genes and the BL likely being affected by relatively few genes. Phenotypic evidence revealed that the GWP showed a standard normal distribution in both environments, while the BL showed a weak partial distribution.
Based on the LD decay distance in this study and previous studies, genomic regions within 100 kb that contained at least four significant QTNs were considered to be QTL regions [5,24]. After detailed artificial screening, 87 QTL regions were composed of these significantly associated QTNs (Figure 5a,b). These QTL regions were named according to their location on the chromosome and their associated traits. For example, PL_q1-1 represented the first QTL region on the chromosome 1 that was significantly associated with the PL, while MPD_q5-2 represented the second QTL region on chromosome 5 that was significantly associated with the MPD (Figure 5c). Of these 87 QTL regions, 17, 6, 15, 19, 15 and 15 QTL regions were significantly associated with the PL, MPD, PWP, GWP, BL, and TGW, respectively (Figure 5c, Table S2). On average, these QTL regions explained 8.03% of the phenotypic variation, with TGW_q6-1 explaining only 0.36% of the TGW variation and PWP_q1-2 explaining 25.45% of the PWP variation. The distribution of these QTL regions on chromosomes was uneven, with 17, 19, and 15 regions identified on chromosomes 1, 6, and 7, respectively, while only 3 QTL regions were identified on chromosome 4. These results suggest that these three chromosomes may contribute more to panicle formation in foxtail millet. Moreover, the number of QTNs in different QTL regions ranged from 4 to 190, which confirmed that the current QTL regions contained hot spots with high confidence that affected the panicle-related traits in foxtail millet.
To identify these high-confidence hot spots, the QTL regions detected in at least two environments were considered as stable core QTL. A total of 26 core QTL regions were obtained, of which, 9, 3, 3, 11, and 1, were related to the PL, PWP, GWP, BL, and TGW respectively (Table 3). Similar to the distribution of QTL regions on chromosomes, the number of core QTL on chromosomes 6 and 7 was 18 and 11, respectively. Moreover, most of the QTL regions on chromosome 6 were related to the PWP and the GWP, with most of the QTLs on chromosome 7 being significantly associated with the TGW (Figure 4b,c). These core QTL regions explained a minimum of 4.55% of the phenotypic variation and an average of 12.74% of the phenotypic variation. In addition, a large number of QTL regions significantly associated with different traits, such as PWP_q1-2, BL_q1-6, GWP_q2-4, and PWP_q2-1, were co-located on the genome, which was consistent with the extremely significant correlations among these traits. Moreover, it was confirmed that these QTL regions may affect several ear traits at the same time (Figure 4c). Although other QTL regions were temporarily excluded due to their low stability between environments, they were considered secondary candidate loci for subsequent analysis. To verify the accuracy of the QTL regions identified in this study, we compared QTL regions detected in this study with the reliable QTLs in previous GWAS and QTL mapping studies based on their physical locations (Table 4). Thirty-nine QTL regions were overlapped with, or close to, previously reported QTLs associated with panicle-related traits. For example, PWP_q6-1, GWP_q6-1, PWP_q6-2, and GWP_q6-2 (2.535–2.794 Mb) were overlapped with qPWP6.2 (2.631–3.434 Mb), PWP_q7-1, and GWP_q7-1 (13.851–13.961 Mb), but were closed to qGWP7.1 and qPWP7.2 (13.405–13.643 Mb).

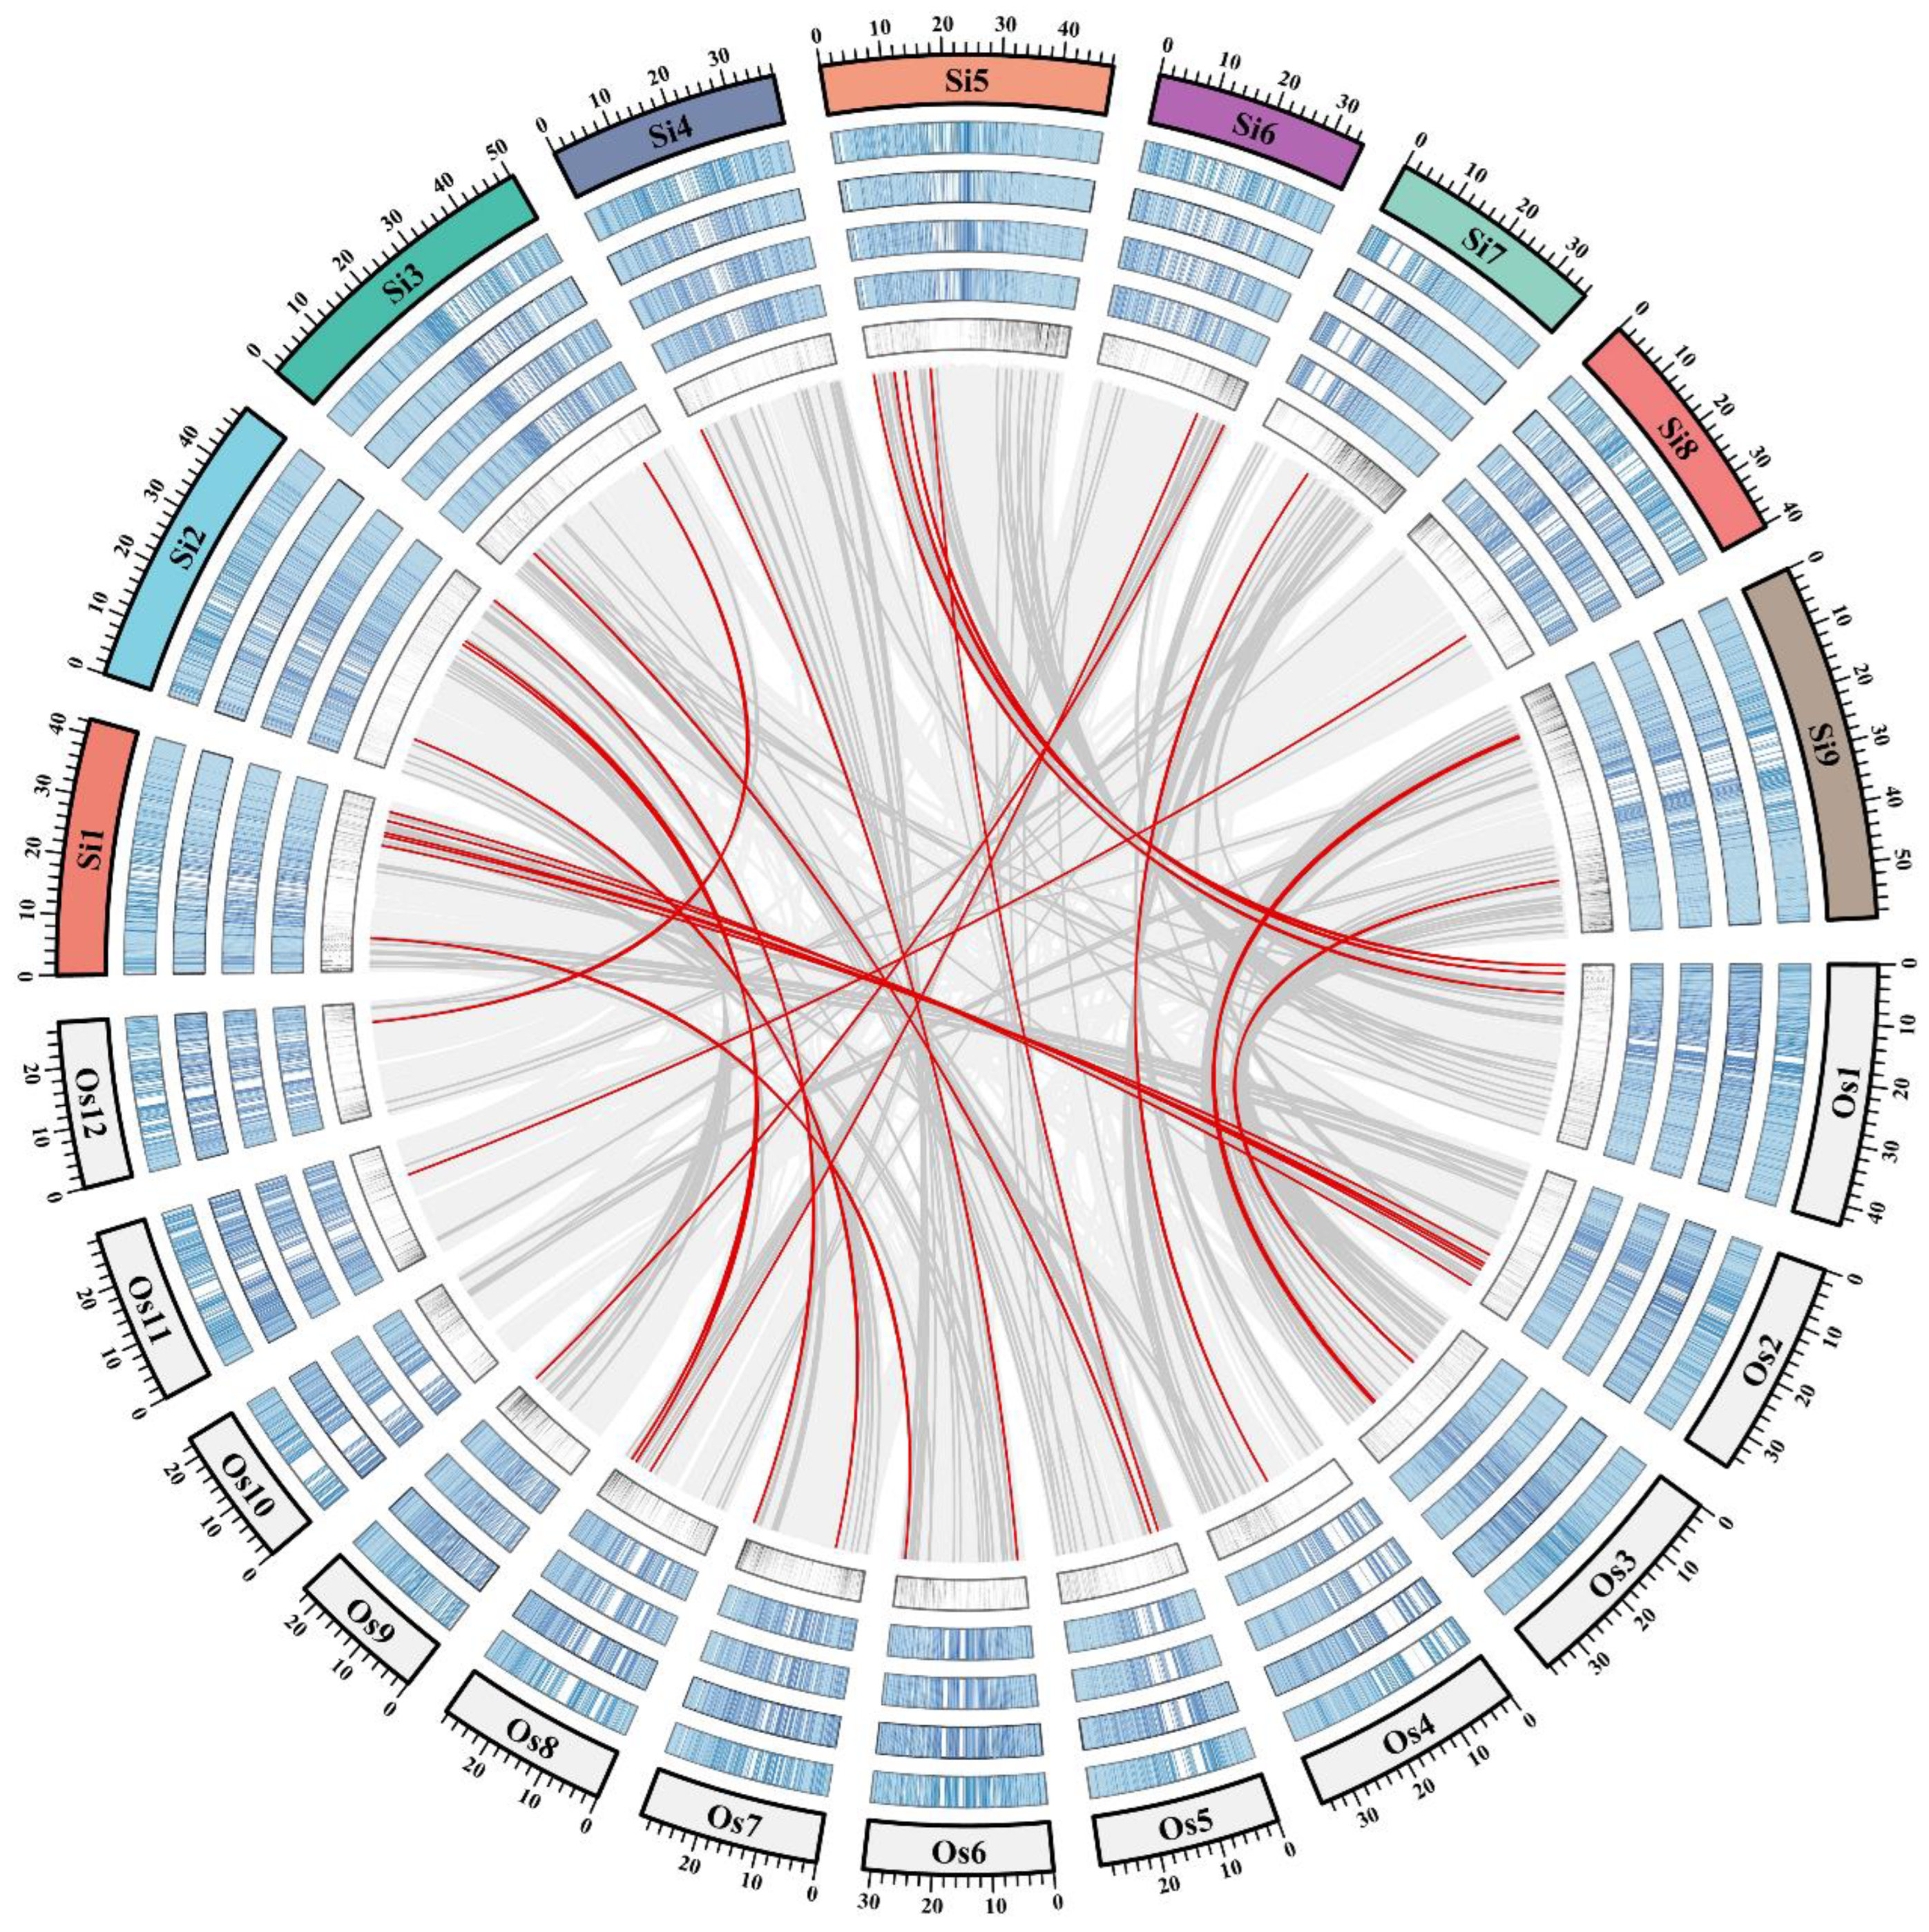
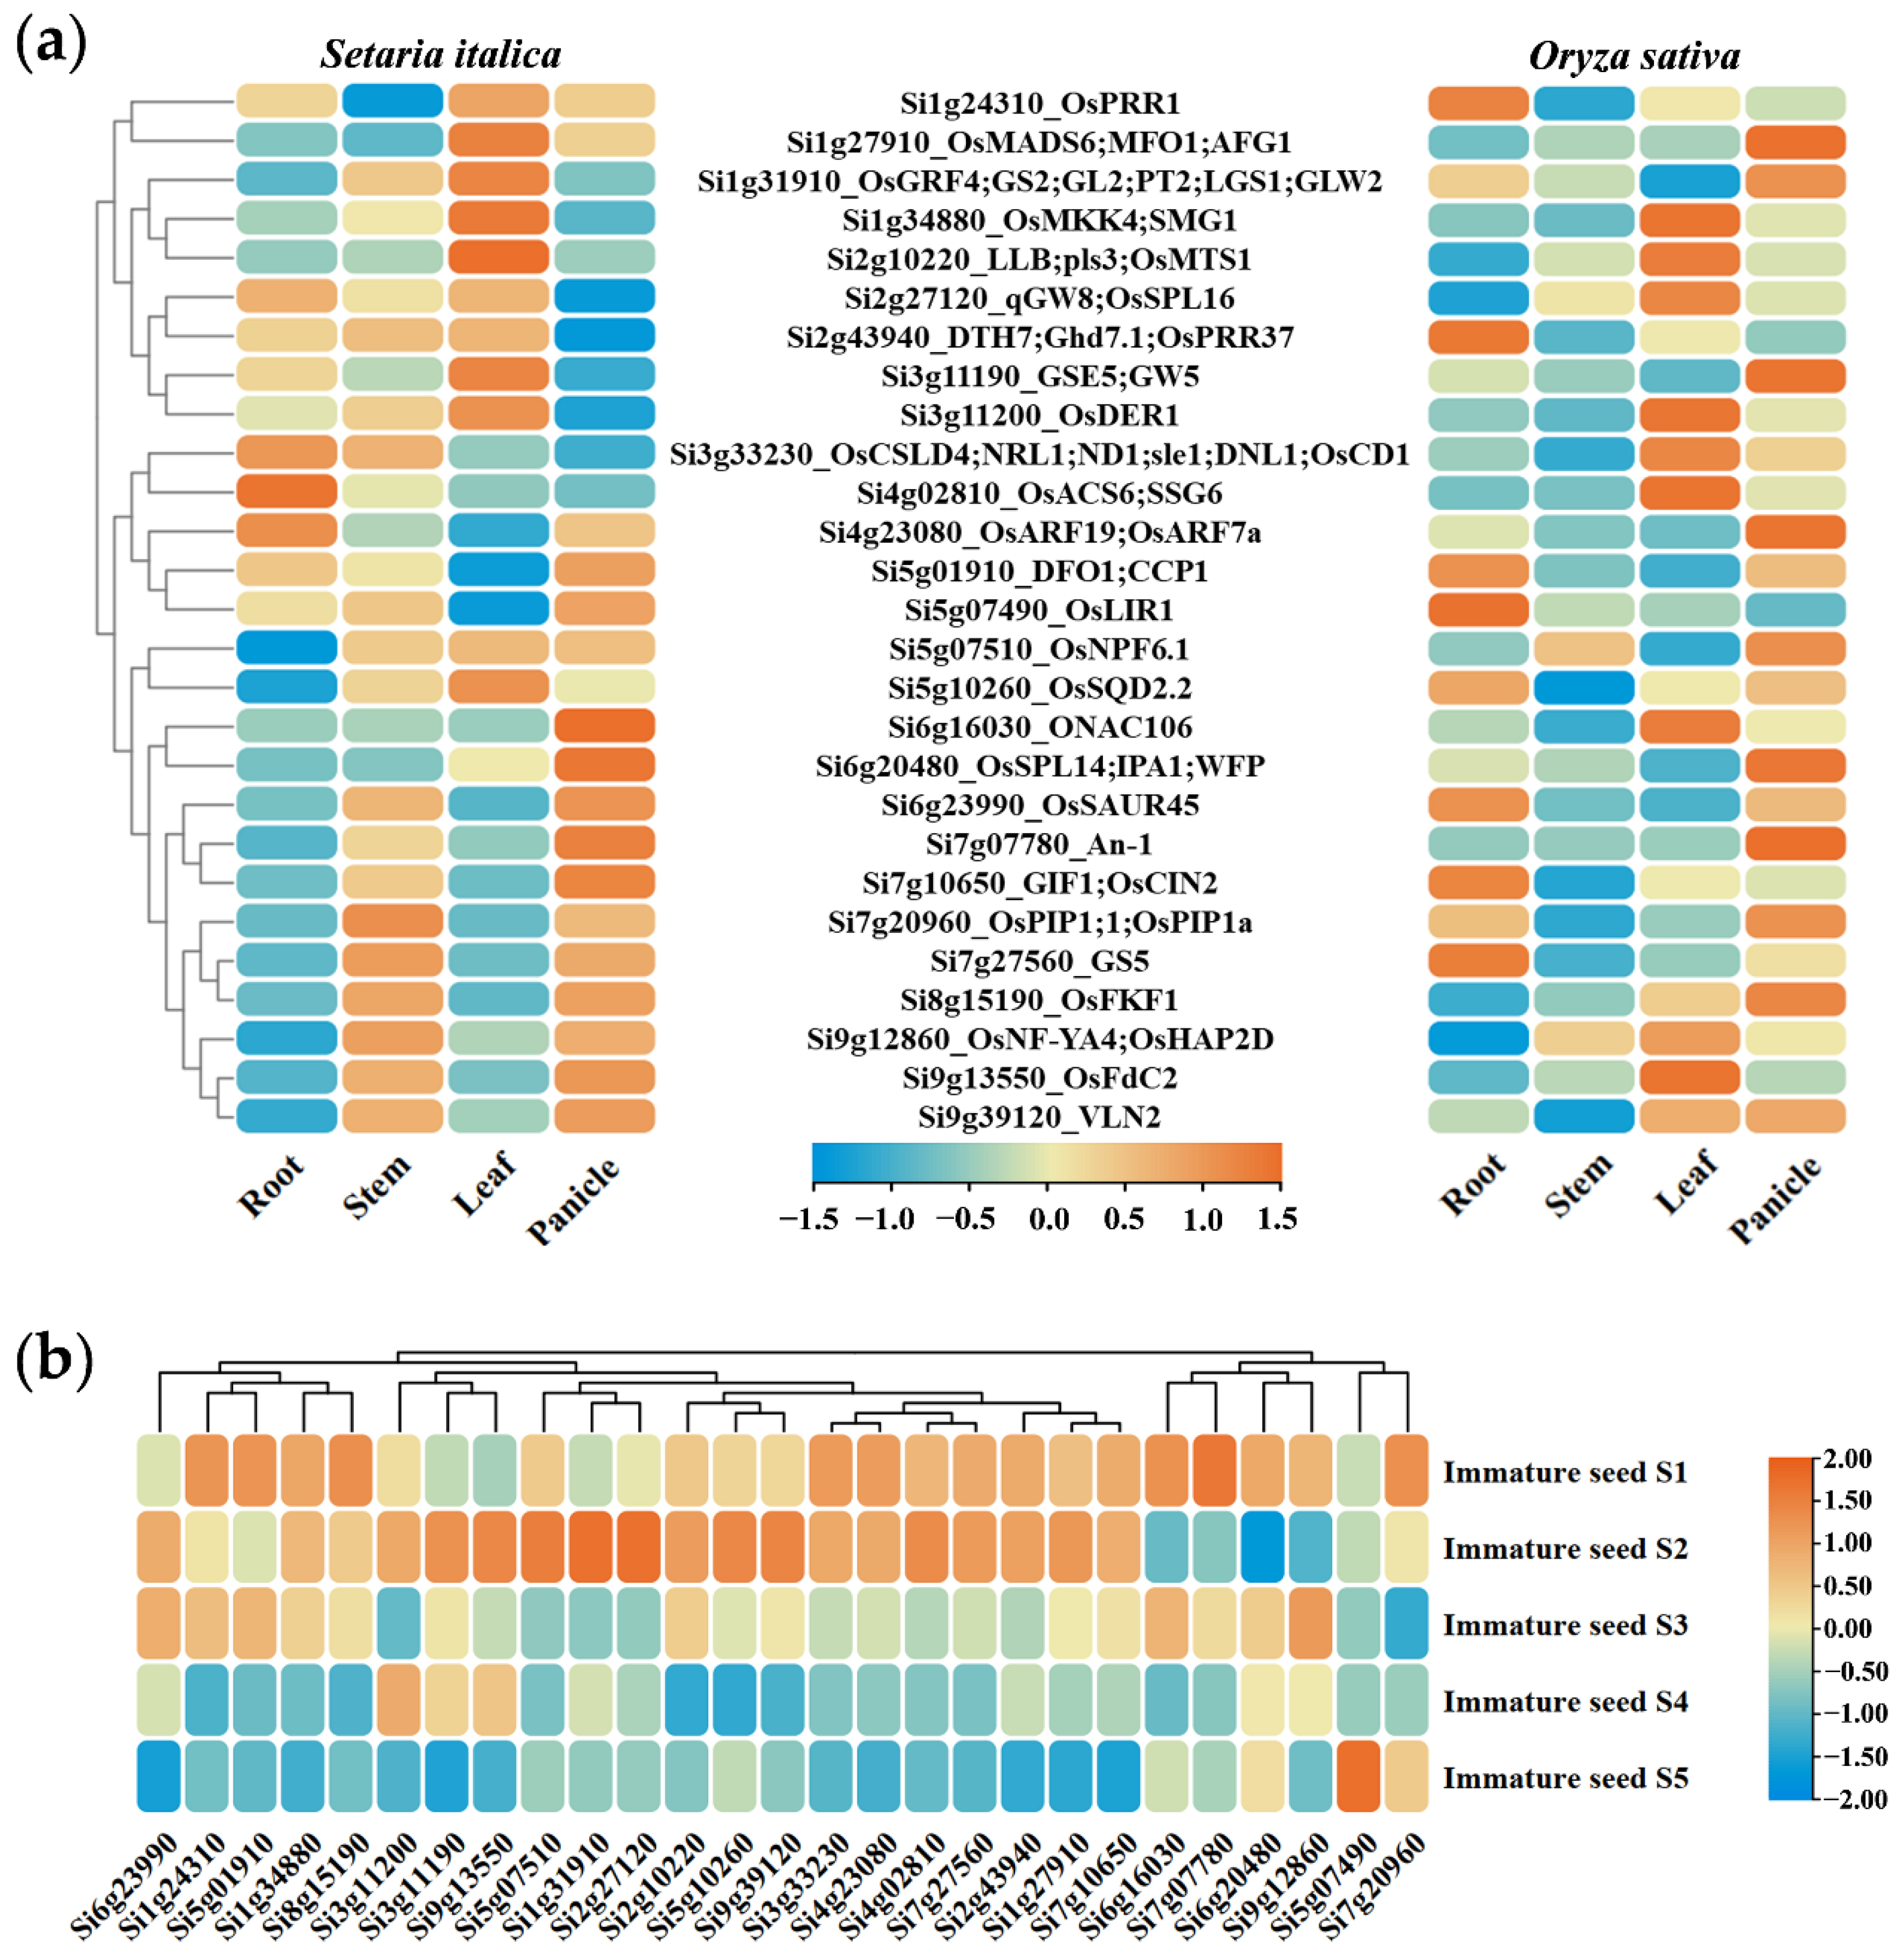
2.4. Candidate Gene Mining and Haplotype Analysis Based on Homology Comparison Strategy

Few studies have been carried out on the genetics of panicle-related traits in foxtail millet, but rice has been used as a model crop for the functional studies of cereal crops, and many genes that control the yield and panicle-related traits have been cloned from rice (Table S3). After a detailed literature investigation, more than 300 important functional genes related to yield-related traits were obtained in rice and 264 orthologs were also identified in foxtail millet, which were located in collinear regions in rice and foxtail millet (Table S4 and Figure 6). Among them, 27 genes were located in the QTL regions, which might affect the panicle-related traits in foxtail millet.
Based on the public expression data of foxtail millet and rice, the expression patterns of these candidate genes and their rice orthologs in four major tissues were compared. The correlation coefficient on the expression patterns between the 27 candidate genes and their rice orthologs was 0.617 at the p < 0.01 level, which indicates that these genes might have conserved functions to some extent. These orthologs showed similar expression patterns in foxtail millet and rice, especially in the panicle (Figure 7a). Further analysis showed that these candidate genes were mainly expressed at a high level in the early grain development (S1 and S2) of foxtail millet, suggesting that these genes may be involved in grain development to regulate the formation of panicle-related traits (Figure 7b).
In addition, haplotype analysis showed that, except for three genes, different haplotypes of the other 24 genes affected at least one panicle-related trait in at least two environments (including BLUP) (Figure 8a). Among the 24 genes, 13 genes affected at least two panicle-related traits in at least two environments. Notably, different haplotypes of Si3g11200 affected all six panicle-related traits in at least two environments, and the MPD, PWP, GWP, BL, and TGW were also affected in at least two environments by Si2g27120, Si2g43940, and Si6g20480. The effects of these candidate genes in foxtail millet were quite similar to their effects in rice. For example, Si3g11200 was located in the QTL region of the PWP and the GWP, and haplotype analysis showed that it affected all panicle-related traits. Its orthologue OsDER1 in rice affected grain size and 1000-grain weight by regulating grain development. Although Si7g10650 was found to effect millet’s 1000-grain weight in all three environments, its rice homologous gene OsCIN2 influenced grain size and yield via controlling endosperm and starch content (Table 5). In addition, the stable contribution of these candidate genes to panicle-related traits in multiple environments could be used as the optimal loci for marker-assisted selection in order to improve the yield in foxtail millet.

3. Discussion

Foxtail millet is one of the earliest domesticated cereal crops and is widely cultivated in arid and semi-arid regions such as China and India [2]. Its shell-breaking product, millet, is rich in essential nutrients, such as amino acids, flavonoids, and minerals, and has important dietary therapeutic effects in improving human immunity [3]. However, unlike major crops such as wheat, rice, and maize, foxtail millet is not intensively bred. The development of foxtail millet as a C4 photosynthetic model crop and the demand of consumers for healthy food make the deep excavation of foxtail millet genetic resources and modern molecular breeding especially urgent [5].
Panicle, as an important source of foxtail millet yield formation, including panicle weight, panicle length, panicle diameter, thousand-grain weight, and other related traits, directly affects the grain yield of foxtail millet. Here, we evaluated the broad-sense heritability of these six panicle-related traits and found that the heritability rates of the BL (0.91) and PL (0.78) were higher than those of the PWP (0.73) and the GWP (0.74), which was consistent with a previous study of panicle-related traits [17]. Furthermore, six panicle-related traits all showed significant correlations under both environments (Figure 1). Specifically, the PL and the MPD were significantly and positively correlated with the PWP and the GWP, which confirmed the contribution of panicle architecture to yield. Therefore, improving the panicle architecture, especially those traits with high heritability such as the PL and MPD, is an important way to increase the yield of foxtail millet.
Although some genome-wide association studies have reported on the agronomic traits and metabolomes of foxtail millet, there are few studies on the genetic basis of panicle-related traits in foxtail millet based on large-scale variation information [5,24]. In this study, we performed a genome-wide association study on six panicle-related traits of 407 foxtail millet based on genome resequencing data. The phenotypic characteristics of six panicle-related traits in two environments and BLUP were analyzed in detail. These traits were all affected by the environment based on genotype regulation, which was consistent with previous studies on foxtail millet or other crops [17,24]. Several panicle-related traits, including PWP, GWP, and TGW, showed very high correlations in multiple environments, which indicated that these traits might be regulated by some of the same genes. This was also confirmed by the co-localized QTL regions affecting different traits and the co-effects of the different haplotypes of candidate genes on multiple traits.
After filtering out the SNP loci with relatively poor polymorphism and data quality, we still retained more than 700,000 SNP loci (with a density of about 1.5/1 kb) for genotyping and GWASs. LD analysis revealed a linkage disequilibrium attenuation distance of about 100 kb in foxtail millet, which was consistent with two previous GWAS studies [5,24]. Previous studies have confirmed that GWASs based on high-density SNP variation information had a huge advantage in mining major QTL, but for those complex traits controlled by multiple genes, the detection rate and accuracy of those inefficient QTL would be greatly reduced, while the large number of SNPs significantly associated with traits also increased the difficulty of candidate gene mining [20]. To avoid this problem, the significant QTNs located in the linkage blocks were merged to improve the detection rate of QTL regions and facilitate the mining of candidate genes. As a result, 87 QTL regions were found to be associated with six panicle-related traits, and 39 of them were overlapped with, or close to, previous reported QTLs. Although these QTLs were identified by different traits, they could be considered reliable according to the highly significant correlation of panicle-related traits. Overall, co-location with previous QTLs confirmed the reliability of this study, and these new QTLs were also important loci for improving panicle traits in foxtail millet. Among the 87 QTL regions, 27 QTL regions with stable multiple environments were considered core QTL regions. These core QTL regions were mainly concentrated on chromosomes 1, 2, and 7, which was consistent with previous studies, indicating that there were important candidate genes regulating panicle-related traits on these chromosomes [24]. These core QTL regions can be used as important genomic resources for further breeding improvement of panicle- and yield-related traits and functional gene mining in foxtail millet. In addition, our team is comparing polymorphisms within important QTL regions in modern cultivars, and based on the excellent haplotype information obtained in this study, we are developing some convenient and fast KASP markers for other millet natural population validation and molecular marker-assisted selection.
As a minor crop, the research on functional genes in foxtail millet is limited, which makes functional gene mining in foxtail millet more difficult. A recent genome-wide comparative analysis detected 490 homologous gene pairs subjected to convergent selection in rice and maize, confirming the existence of large-scale convergent selection on the rice and maize genomes [54]. Another large-scale meta-QTL analysis in wheat also unearthed the key gene TAKAO-4A, which controls grain morphology, by comparing orthologous genes between rice and wheat [18]. Although only a few functional genes have been reported in foxtail millet, several genes cloned in foxtail millet have been reported to have similar functions to their rice orthologs. SiMADS34, encoding an E-class MADS-box transcription factor, was proved to influence grain yield in foxtail millet by regulating the inflorescence architecture, which was similar to the function of its homologous gene OSMADS34 in rice [10,55]. The SiCCD1 and OsCCD1 genes encoding carotenoid cleavage dioxygenase 1 affect grain color and carotenoid content by regulating lutein degradation in millet and rice, respectively [56,57]. Furthermore, the orthologs of some well-known rice genes such as OsSD1, OsPSY1, and OsAUX1 were also found to exhibit similar expression patterns and functions in foxtail millet [5,58,59,60]. All these indicate that there might be a large number of important functional genes with conserved functions among different crops of Gramineae. Here, more than 300 rice genes related to yield- and panicle-related traits and 200 foxtail millet orthologs were identified in rice and foxtail millet, respectively. They were all located in the collinearity regions between rice and foxtail millet. Of these, twenty-seven foxtail millet genes were located in QTL regions associated with panicle-related traits. Haplotype analysis showed that 24 genes were significantly associated with at least one panicle-related trait in at least two environments and 15 genes were associated with at least one panicle-related trait in all environments. In addition, 10 genes were significantly associated with more than three panicle-related traits in at least two environments, of which one, three, and three genes were associated with six, five, and four traits, respectively. In general, the effect of 89% (42/27) of candidate genes on panicle-related traits of foxtail millet was verified by haplotype analysis, which confirmed the reliability of the strategy of rapidly mining candidate genes based on homology alignment combined with haplotype analysis [18].
These candidate genes regulate panicle- and yield-related traits in rice through multiple pathways including plant growth regulators (GAs, e.g., brassinolide and auxin), photoperiod, flower and panicle development, photosynthesis, etc. For example, OsGRF4 (Si1g31910) [29], OsARF19 (Si4g23080) [38], OsSAUR45 (Si6g23990) [45], GSE5(Si3g11190) [34,60], and VLN2 (Si9g39120) [53] were all involved in the synthesis or transduction of GA, brassinolide, and auxin to regulate flower, panicle, and grain development. In addition, DTH7 (Si2g43940) [33], OsMADS6 (Si1g27910) [28], OsNF-YA4 (Si9g12860) [51], OsFKF1 (Si8g15190) [50], and DFO1 (Si5g01910) [39] affected grain morphology and grain weight by participating in photoperiod or directly regulating flower development and panicle formation in rice. OsACS6 (Si4g02810) [37], GIF1(Si7g10650) [47], and OsSQD2.2 (Si5g10260) [42] directly regulated grain size by regulating grain filling and sugar metabolism; OsLIR1 [40] (Si5g07490) and OsFdC2 (Si9g13550) [52] indirectly affected panicle- and yield-related traits by affecting photosynthetic capacity. In addition, the 27 genes contained several homologous genes of rice grain morphology were widely reported, such as qGW8 (Si2g27120) [32], OsDER1 (Si3g11200) [35], GS5 (Si7g27560) [49], etc. Although Si7g07780, the foxtail millet orthologous gene of rice awning length gene An-1, was found in the QTL region of TGW, it did not show significant association with the foxtail millet BL, which indicates that BLs might be controlled by other genes. Overall, we identified multiple high-confidence candidate genes associated with panicle-related traits in foxtail millet by comparison of orthologous genes between rice and foxtail millet and haplotype analysis, thus confirming the reliability of this strategy. The breeding of staple crops such as rice and maize has gradually entered the stage of molecular design breeding or intelligent breeding. Through the construction and coupling of several molecular modules by regulating the yield, plant architecture, and other important traits in rice, a number of breakthrough varieties and hybrids have been developed, which greatly increased rice yield. However, for foxtail millet, the mining of its functional genes and excellent haplotypes could not meet the requirements of molecular design breeding. This study proposed and verified a strategy based on the integration of GWASs, homologous comparison, and haplotype analysis to discover the genomic regions and candidate genes for important traits in foxtail millet. Furthermore, this strategy can be further expanded to accelerate the important functional gene mining and molecular breeding of foxtail millet on the principle basis of the convergent selection of gramineous crops. Both large-scale targeted association analysis based on the minor crop species model orthologs and analysis based on key metabolic pathway genes are effective methods that can be tried. Overall, this study provides an initial demonstration of how the results of model crop studies can be used to facilitate the mining of functional genes in minor crops. These important candidate genes and their excellent haplotypes will be further used in the functional gene mining and molecular breeding of foxtail millet.

4. Materials and Methods

4.1. Plant Materials

To ensure the broad diversity of foxtail millet materials, a total of 407 genotypes, including landrace, wild species, modern cultivar, and foreign germplasm, were used for GWASs on panicle-related traits (Table S1). All materials were obtained from the Institute of Crop Sciences, the Chinese Academy of Agricultural Sciences, and grown during two summer cropping seasons (May to October of 2015 and 2016) on the experimental farm of Shanxi Agricultural University, Taigu, Shanxi, China (37°25′ N, 112°35′ E). The field experiment was carried out in a randomized complete block design with three replicates. Each material was planted in three rows, each 5 m in length with a 25 cm space between rows. Field management followed the local standard foxtail millet agronomic management practice. Before the compound fertilizer of nitrogen, phosphorus, and potassium was planted, weeds were controlled and fungicide and pesticide were sprayed in a timely fashion.

4.2. Measurement and Statistical Analysis of Panicle-Related Traits

After harvest, 10 panicles of each foxtail millet genotype were separated for the measurement of five panicle-related traits, including panicle length (PL, cm), main panicle diameter (MPD, cm), panicle weight per panicle (PWP, g), grain weight per panicle (GWP, g), and bristle length (BL, mm). Thousand-grain weight (TGW, g) was measured after seed threshing and drying. All measurement of these traits followed the Descriptors and Data Standard for Foxtail Millet [Setaria italica (L.) Beauv.].
The best linear unbiased prediction (BLUP) values of six panicle-related traits in two environments (2015 and 2016) were calculated by R package Lme4, and ANOVA analysis was performed by SAS 8.0 (SAS Institute Inc., Cary, NC, USA) [61]. The different significance levels of these traits among different environments and genotypes were evaluated, and the statistical significance values * and ** were determined at p < 0.05 and p < 0.01, respectively. The coefficient of variation (CV) of these traits among different accessions was obtained by dividing the standard deviation by the mean value. The broad-sense heritability (h2) of these traits in different environments was calculated by the following formula:
h 2 = V g V g + V g e l + V ε r l
where V g , V g e , and V ε represent the genotype variance, the genotype–environment interaction variance and residual, and l and r represent the single environment repetition and environment number, respectively. Moreover, the basic correlation coefficients among these traits in two environments were calculated with Pearson approaches using the software of SPSS 19.0 (SPSS, Inc., Chicago, IL, USA), and visualization was completed by the performance analytics R package.

4.3. Genotyping, Population Structure, Principal Component, and Linkage Disequilibrium Analysis

The high-quality SNP variation datasets from deep resequencing were used to genotype 407 foxtail millet accessions, which were provided by Xianmin Diao, a researcher from the Institute of Crop Science, the Chinese Academy of Agricultural Sciences. After removing the low-polymorphism SNP loci with minor allele frequency (MAF) < 0.05 and missing data > 20%, high-polymorphism SNP loci were retained from 3.8 million polymorphic SNP loci for genotyping, and downstream GWAS analysis. All high-quality SNP loci were re-mapped onto the recent foxtail millet genome (Xiaomi Refseq) and annotated by Annovar software (v1.1) to obtain the location and relationship with gene models.
The population structure of 407 foxtail millet accessions was analyzed based on the SNP variation information using Faststructure and Structure Harvester software. The principal component analysis, phylogenetic tree, and visualization of genotype data were performed using Plink, phylip-3.697, and Evolview, respectively. The linkage relationship between the SNP loci of these genotypes was analyzed by PopLDdecay, and the linkage disequilibrium (LD) attenuation distance of thr foxtail millet was determined.

4.4. Genome-Wide Association Study

The high-polymorphism SNP loci filtered by the above step were used as genotypic data. The measured values of six panicle-related traits in three environments (2015, 2016, and BLUP) were used as phenotypic data and the GWAS analysis was performed using Tassel 5.0 with a mixed linear model (MLM). The Q-matrix obtained from the population structure and the Kinship matrix (K-matrix) calculated by Tassel 5.0 were used as covariates to correct the association analysis. The significance threshold level of each phenotype was determined by the replacement test (the number of replacement tests was 1000).

4.5. Candidate Gene Mining and Haplotype Analysis Based on Homologous Alignment

Rice (Oryza sativa L.) is an important model crop for the study of gene function in cereal crops. A large number of genes affecting yield and yield-related traits have been cloned in rice [21]. Following the parallel domestication of cereal crops [1], we used the strategy of rice–foxtail millet orthologous comparison to mine the genomic regions and important candidate genes affecting the panicle-related traits of foxtail millet. Through an in-depth investigation of the China Rice Research Center (https://www.ricedata.cn/ (accessed on 15 June 2022)) and previous studies, the functions of rice genes related to yield and panicle were identified and these protein sequences were extracted from the rice protein database by TBtools. The orthologous genes of foxtail millet that are homologous to rice functional genes were identified using BLASTP and MCscanX. The orthologous genes of foxtail millet, which had similar expression patterns to orthologs in rice and located in the QTL regions of the GWAS, were considered important candidate genes for regulating panicle-related traits in foxtail millet. The expression levels of genes in foxtail millet (root, stem, leaf, panicle, and developing grains from S1 to S5) and rice (root, stem, leaf, and panicle) were downloaded from the multi-omics database for Setaria italica (MDSi, http://foxtail-millet.biocloud.net/home (accessed on 10 May 2022)) and the rice expression database (RED, http://expression.ic4r.org/index (accessed on 10 May 2022)). The transcripts per million (TPM) values were used to assess the expression profiles of these genes, and heatmaps were drawn by log2-normalized (TPM + 1) expression levels.

5. Conclusions

In this study, GWAS analysis was performed for six panicle-related traits based on 706,646 high-polymorphism SNP loci in 407 foxtail millet accessions. Eighty-seven QTL regions were identified to be significantly associated with these panicle-related traits in three environments. Among these, 27 core QTL regions were detected in at least two environments. Based on homologous analysis, twenty-seven orthologous foxtail millet genes of rice genes that affected yield-related traits were identified in the QTL regions of panicle-related traits in foxtail millet. In light of this, haplotype analysis showed that 24 genes were significantly associated with panicle-related traits in foxtail millet under at least two environments. These genes regulated panicle-related traits through photoperiod response, grain development, multiple plant growth regulatory pathways, and panicle and floral organ development. In summary, this study clarified a method based on the integration of GWASs, homologous comparison, and haplotype analysis to discover the genomic regions and candidate genes for panicle-related traits in foxtail millet. This work will speed up the functional gene mining and molecular breeding efficiency of foxtail millet and other important minor cereal crops.

Supplementary Materials

The following supporting information can be downloaded at: https://www.mdpi.com/article/10.3390/ijms232314735/s1.

Author Contributions

Conceptualization, Y.H.; methodology, Y.H.; software, X.L. and Y.Y.; validation, X.L., Y.Y., and S.H.; formal analysis, Y.M.; investigation, X.L.; resources, X.L. and Y.H.; data curation, X.L.; writing—original draft preparation, X.L. and Y.Y.; writing—review and editing, Y.H.; visualization, Y.M.; supervision, Y.H.; project administration, Y.H.; funding acquisition, Y.H. All authors have read and agreed to the published version of the manuscript.

Funding

This research was funded by the National Natural Science Foundation of China (U21A20216), the Joint Research Program on Foxtail Millet Breeding of Shanxi Province (2022XCZX04-10), the Fundamental Research Program of Shanxi Province (202103021223157), the Research Program of Agricultural Science and Technology Innovation of the Shanxi Academy of Agricultural Sciences (YCX2020YQ30), and the Research Program Sponsored by Ministerial and Provincial Co-Innovation Centre for Endemic Crops Production with High Quality and Efficiency in Loess Plateau, Taigu 030801, China (SBGJXTZX-18).

Institutional Review Board Statement

Not applicable.

Informed Consent Statement

Not applicable.

Data Availability Statement

Not applicable.

Acknowledgments

Special thanks to Xianmin Diao (the Institute of Crop Sciences, the Chinese Academy of Agricultural Sciences) for providing the foxtail millet accessions and DNA resequencing data used for this study. Special thanks also goes to Zhihao Liu (School of Life Science, Hubei Normal University, Hubei, China) for the help with genotyping analysis using whole-genome resequencing data. Finally, we would like to thank the editors and reviewers for their constructive scientific review of this manuscript.

Conflicts of Interest

The authors declare no conflict of interest.

References

  1. Mamidi, S.; Healey, A.; Huang, P.; Grimwood, J.; Jenkins, J.; Barry, K.; Sreedasyam, A.; Shu, S.; Lovell, J.T.; Feldman, M.; et al. A genome resource for green millet Setaria viridis enables discovery of agronomically valuable loci. Nat. Biotechnol. 2020, 38, 1203–1210. [Google Scholar] [CrossRef]
  2. Bettinger, R.L.; Barton, L.; Morgan, C. The origins of food production in north China: A different kind of agricultural revolution. Evol. Anthropol. Issues News Rev. 2010, 19, 9–21. [Google Scholar] [CrossRef]
  3. Sachdev, N.; Goomer, S.; Singh, L.R. Foxtail millet: A potential crop to meet future demand scenario for alternative sustainable protein. J. Sci. Food Agric. 2021, 101, 831–842. [Google Scholar] [CrossRef] [PubMed]
  4. Lata, C.; Gupta, S.; Prasad, M. Foxtail millet: A model crop for genetic and genomic studies in bioenergy grasses. Crit. Rev. Biotechnol. 2013, 33, 328–343. [Google Scholar] [CrossRef]
  5. Li, X.; Gao, J.; Song, J.; Guo, K.; Hou, S.; Wang, X.; He, Q.; Zhang, Y.; Zhang, Y.; Yang, Y.; et al. Multi-omics analyses of 398 foxtail millet accessions reveal genomic regions associated with domestication, metabolite traits, and anti-inflammatory effects. Mol. Plant 2022, 15, 1367–1383. [Google Scholar] [CrossRef]
  6. Kyozuka, J.; Tokunaga, H.; Yoshida, A. Control of grass inflorescence form by the fine-tuning of meristem phase change. Curr. Opin. Plant Biol. 2014, 17, 110–115. [Google Scholar] [CrossRef] [PubMed]
  7. Suzaki, T.; Sato, M.; Ashikari, M.; Miyoshi, M.; Nagato, Y.; Hirano, H.Y. The gene FLORAL ORGAN NUMBER1 regulates floral meristem size in rice and encodes a leucine-rich repeat receptor kinase orthologous to Arabidopsis CLAVATA1. Development 2004, 131, 5649–5657. [Google Scholar] [CrossRef] [PubMed] [Green Version]
  8. Nardmann, J.; Werr, W. The shoot stem cell niche in angiosperms: Expression patterns of WUS orthologues in rice and maize imply major modifications in the course of mono- and dicot evolution. Mol. Biol. Evol. 2006, 23, 2492–2504. [Google Scholar] [CrossRef] [PubMed] [Green Version]
  9. Mjomba, F.M.; Zheng, Y.; Liu, H.; Tang, W.; Hong, Z.; Wang, F.; Wu, W. Homeobox Is Pivotal for OsWUS Controlling Tiller Development and Female Fertility in Rice. G3 2016, 6, 2013–2021. [Google Scholar] [CrossRef] [Green Version]
  10. Kobayashi, K.; Yasuno, N.; Sato, Y.; Yoda, M.; Yamazaki, R.; Kimizu, M.; Yoshida, H.; Nagamura, Y.; Kyozuka, J. Inflorescence meristem identity in rice is specified by overlapping functions of three AP1/FUL-like MADS box genes and PAP2, a SEPALLATA MADS box gene. Plant Cell 2012, 24, 1848–1859. [Google Scholar] [CrossRef] [PubMed]
  11. Tamaki, S.; Tsuji, H.; Matsumoto, A.; Fujita, A.; Shimatani, Z.; Terada, R.; Sakamoto, T.; Kurata, T.; Shimamoto, K. FT-like proteins induce transposon silencing in the shoot apex during floral induction in rice. Proc. Natl. Acad. Sci. USA 2015, 112, E901–E910. [Google Scholar] [CrossRef] [Green Version]
  12. Ashikari, M.; Sakakibara, H.; Lin, S.; Yamamoto, T.; Takashi, T.; Nishimura, A.; Angeles, E.R.; Qian, Q.; Kitano, H.; Matsuoka, M. Cytokinin oxidase regulates rice grain production. Science 2005, 309, 741–745. [Google Scholar] [CrossRef] [PubMed]
  13. Tsuda, K.; Ito, Y.; Sato, Y.; Kurata, N. Positive autoregulation of a KNOX gene is essential for shoot apical meristem maintenance in rice. Plant Cell 2011, 23, 4368–4381. [Google Scholar] [CrossRef] [Green Version]
  14. Doust, A.N.; Devos, K.M.; Gadberry, M.D.; Gale, M.D.; Kellogg, E.A. The genetic basis for inflorescence variation between foxtail and green millet (poaceae). Genetics 2005, 169, 1659–1672. [Google Scholar] [CrossRef] [PubMed] [Green Version]
  15. Fang, X.; Dong, K.; Wang, X.; Liu, T.; He, J.; Ren, R.; Zhang, L.; Liu, R.; Liu, X.; Li, M.; et al. A high density genetic map and QTL for agronomic and yield traits in Foxtail millet [Setaria italica (L.) P. Beauv]. BMC Genom. 2016, 17, 336. [Google Scholar] [CrossRef] [Green Version]
  16. Wang, Z.; Wang, J.; Peng, J.; Du, X.; Jiang, M.; Li, Y.; Han, F.; Du, G.; Yang, H.; Lian, S.; et al. QTL mapping for 11 agronomic traits based on a genome-wide Bin-map in a large F2 population of foxtail millet (Setaria italica (L.) P. Beauv). Mol. Breed. 2019, 39, 18. [Google Scholar] [CrossRef]
  17. Zhi, H.; He, Q.; Tang, S.; Yang, J.; Zhang, W.; Liu, H.; Jia, Y.; Jia, G.; Zhang, A.; Li, Y.; et al. Genetic control and phenotypic characterization of panicle architecture and grain yield-related traits in foxtail millet (Setaria italica). Theor. Appl. Genet. 2021, 134, 3023–3036. [Google Scholar] [CrossRef] [PubMed]
  18. Yang, Y.; Amo, A.; Wei, D.; Chai, Y.; Zheng, J.; Qiao, P.; Cui, C.; Lu, S.; Chen, L.; Hu, Y.G. Large-scale integration of meta-QTL and genome-wide association study discovers the genomic regions and candidate genes for yield and yield-related traits in bread wheat. Theor. Appl. Genet. 2021, 134, 3083–3109. [Google Scholar] [CrossRef]
  19. Saleem, K.; Shokat, S.; Waheed, M.Q.; Arshad, H.M.I.; Arif, M.A.R. A GBS-Based GWAS Analysis of Leaf and Stripe Rust Resistance in Diverse Pre-Breeding Germplasm of Bread Wheat (Triticum aestivum L.). Plants 2022, 11, 2363. [Google Scholar] [CrossRef]
  20. Jabbari, M.; Fakheri, B.A.; Aghnoum, R.; Mahdi Nezhad, N.; Ataei, R. GWAS analysis in spring barley (Hordeum vulgare L.) for morphological traits exposed to drought. PLoS ONE 2018, 13, e0204952. [Google Scholar] [CrossRef]
  21. Yano, K.; Yamamoto, E.; Aya, K.; Takeuchi, H.; Lo, P.C.; Hu, L.; Yamasaki, M.; Yoshida, S.; Kitano, H.; Hirano, K.; et al. Genome-wide association study using whole-genome sequencing rapidly identifies new genes influencing agronomic traits in rice. Nat. Genet. 2016, 48, 927–934. [Google Scholar] [CrossRef] [PubMed]
  22. Rayaprolu, L.; Selvanayagam, S.; Rao, D.M.; Gupta, R.; Das, R.R.; Rathore, A.; Gandham, P.; Kiranmayee, K.N.S.U.; Deshpande, S.P.; Are, A.K. Genome-Wide Association Study for Major Biofuel Traits in Sorghum Using Minicore Collection. Protein Pept. Lett. 2021, 28, 909–928. [Google Scholar] [CrossRef] [PubMed]
  23. Jaiswal, V.; Gupta, S.; Gahlaut, V.; Muthamilarasan, M.; Bandyopadhyay, T.; Ramchiary, N.; Prasad, M. Genome-Wide Association Study of Major Agronomic Traits in Foxtail Millet (Setaria italica L.) Using ddRAD Sequencing. Sci. Rep. 2019, 9, 5020. [Google Scholar] [CrossRef] [Green Version]
  24. Jia, G.; Huang, X.; Zhi, H.; Zhao, Y.; Zhao, Q.; Li, W.; Chai, Y.; Yang, L.; Liu, K.; Lu, H.; et al. A haplotype map of genomic variations and genome-wide association studies of agronomic traits in foxtail millet (Setaria italica). Nat. Genet. 2013, 45, 957–961. [Google Scholar] [CrossRef]
  25. Zhang, K.; Fan, G.; Zhang, X.; Zhao, F.; Wei, W.; Du, G.; Feng, X.; Wang, X.; Wang, F.; Song, G.; et al. Identification of QTLs for 14 Agronomically Important Traits in Setaria italica Based on SNPs Generated from High-Throughput Sequencing. G3 2017, 7, 1587–1594. [Google Scholar] [CrossRef] [PubMed] [Green Version]
  26. Liu, T.; He, J.; Dong, K.; Wang, X.; Wang, W.; Yang, P.; Ren, R.; Zhang, L.; Zhang, Z.; Yang, T. QTL mapping of yield component traits on bin map generated from resequencing a RIL population of foxtail millet (Setaria italica). BMC Genom. 2020, 21, 141. [Google Scholar] [CrossRef] [PubMed] [Green Version]
  27. Nakamura, Y.; Kato, T.; Yamashino, T.; Murakami, M.; Mizuno, T. Characterization of a set of phytochrome-interacting factor-like bHLH proteins in Oryza sativa. Biosci. Biotechnol. Biochem. 2007, 71, 1183–1191. [Google Scholar] [CrossRef] [PubMed] [Green Version]
  28. Yadav, S.R.; Khanday, I.; Majhi, B.B.; Veluthambi, K.; Vijayraghavan, U. Auxin-responsive OsMGH3, a common downstream target of OsMADS1 and OsMADS6, controls rice floret fertility. Plant Cell Physiol. 2011, 52, 2123–2135. [Google Scholar] [CrossRef] [Green Version]
  29. Choi, D.; Kim, J.H.; Kende, H. Whole genome analysis of the OsGRF gene family encoding plant-specific putative transcription activators in rice (Oryza sativa L.). Plant Cell Physiol. 2004, 45, 897–904. [Google Scholar] [CrossRef] [Green Version]
  30. Kishi-Kaboshi, M.; Okada, K.; Kurimoto, L.; Murakami, S.; Umezawa, T.; Shibuya, N.; Yamane, H.; Miyao, A.; Takatsuji, H.; Takahashi, A.; et al. A rice fungal MAMP-responsive MAPK cascade regulates metabolic flow to antimicrobial metabolite synthesis. Plant J. 2010, 63, 599–612. [Google Scholar] [CrossRef]
  31. Tamiru, M.; Takagi, H.; Abe, A.; Yokota, T.; Kanzaki, H.; Okamoto, H.; Saitoh, H.; Takahashi, H.; Fujisaki, K.; Oikawa, K.; et al. A chloroplast-localized protein LESION AND LAMINA BENDING affects defence and growth responses in rice. New Phytol. 2016, 210, 1282–1297. [Google Scholar] [CrossRef] [PubMed] [Green Version]
  32. Hou, Y.L.; Hong, C.Y.; Chen, K.Y. Functional characterization of the stunt lemma palea 1 mutant allele in rice. Plant Growth Regul. 2014, 73, 257–265. [Google Scholar] [CrossRef]
  33. Koo, B.H.; Yoo, S.C.; Park, J.W.; Kwon, C.T.; Lee, B.D.; An, G.; Zhang, Z.; Li, J.; Li, Z.; Paek, N.C. Natural variation in OsPRR37 regulates heading date and contributes to rice cultivation at a wide range of latitudes. Mol. Plant 2013, 6, 1877–1888. [Google Scholar] [CrossRef] [Green Version]
  34. Shomura, A.; Izawa, T.; Ebana, K.; Ebitani, T.; Kanegae, H.; Konishi, S.; Yano, M. Deletion in a gene associated with grain size increased yields during rice domestication. Nat. Genet. 2008, 40, 1023–1028. [Google Scholar] [CrossRef] [PubMed]
  35. Qian, D.; Chen, G.; Tian, L.; Qu, L.Q. OsDER1 Is an ER-Associated Protein Degradation Factor That Responds to ER Stress. Plant Physiol. 2018, 178, 402–412. [Google Scholar] [CrossRef] [Green Version]
  36. Yoshikawa, T.; Eiguchi, M.; Hibara, K.; Ito, J.; Nagato, Y. Rice slender leaf 1 gene encodes cellulose synthase-like D4 and is specifically expressed in M-phase cells to regulate cell proliferation. J. Exp. Bot. 2013, 64, 2049–2061. [Google Scholar] [CrossRef] [Green Version]
  37. Matsushima, R.; Maekawa, M.; Kusano, M.; Tomita, K.; Kondo, H.; Nishimura, H.; Crofts, N.; Fujita, N.; Sakamoto, W. Amyloplast Membrane Protein SUBSTANDARD STARCH GRAIN6 Controls Starch Grain Size in Rice Endosperm. Plant Physiol. 2016, 170, 1445–1459. [Google Scholar] [CrossRef] [PubMed] [Green Version]
  38. Sato, Y.; Nishimura, A.; Ito, M.; Ashikari, M.; Hirano, H.Y.; Matsuoka, M. Auxin response factor family in rice. Genes Genet. Syst. 2001, 76, 373–380. [Google Scholar] [CrossRef] [PubMed] [Green Version]
  39. Zheng, M.; Wang, Y.; Wang, Y.; Wang, C.; Ren, Y.; Lv, J.; Peng, C.; Wu, T.; Liu, K.; Zhao, S.; et al. DEFORMED FLORAL ORGAN1 (DFO1) regulates floral organ identity by epigenetically repressing the expression of OsMADS58 in rice (Oryza sativa). New Phytol. 2015, 206, 1476–1490. [Google Scholar] [CrossRef]
  40. Yang, C.; Hu, H.; Ren, H.; Kong, Y.; Lin, H.; Guo, J.; Wang, L.; He, Y.; Ding, X.; Grabsztunowicz, M.; et al. LIGHT-INDUCED RICE1 Regulates Light-Dependent Attachment of LEAF-TYPE FERREDOXIN-NADP+ OXIDOREDUCTASE to the Thylakoid Membrane in Rice and Arabidopsis. Plant Cell 2016, 28, 712–728. [Google Scholar] [CrossRef]
  41. Tang, W.; Ye, J.; Yao, X.; Zhao, P.; Xuan, W.; Tian, Y.; Zhang, Y.; Xu, S.; An, H.; Chen, G.; et al. Genome-wide associated study identifies NAC42-activated nitrate transporter conferring high nitrogen use efficiency in rice. Nat. Commun. 2019, 10, 5279. [Google Scholar] [CrossRef] [PubMed] [Green Version]
  42. Zhan, X.; Shen, Q.; Wang, X.; Hong, Y. The Sulfoquinovosyltransferase-like Enzyme SQD2.2 is Involved in Flavonoid Glycosylation, Regulating Sugar Metabolism and Seed Setting in Rice. Sci. Rep. 2017, 7, 4685. [Google Scholar] [CrossRef]
  43. Sakuraba, Y.; Piao, W.; Lim, J.H.; Han, S.H.; Kim, Y.S.; An, G.; Paek, N.C. Rice ONAC106 Inhibits Leaf Senescence and Increases Salt Tolerance and Tiller Angle. Plant Cell. Physiol. 2015, 56, 2325–2339. [Google Scholar] [CrossRef]
  44. Miura, K.; Ikeda, M.; Matsubara, A.; Song, X.J.; Ito, M.; Asano, K.; Matsuoka, M.; Kitano, H.; Ashikari, M. OsSPL14 promotes panicle branching and higher grain productivity in rice. Nat. Genet. 2010, 42, 545–549. [Google Scholar] [CrossRef] [PubMed]
  45. Xu, Y.X.; Xiao, M.Z.; Liu, Y.; Fu, J.L.; He, Y.; Jiang, D.A. The small auxin-up RNA OsSAUR45 affects auxin synthesis and transport in rice. Plant Mol. Biol. 2017, 94, 97–107. [Google Scholar] [CrossRef]
  46. Luo, J.; Liu, H.; Zhou, T.; Gu, B.; Huang, X.; Shangguan, Y.; Zhu, J.; Li, Y.; Zhao, Y.; Wang, Y.; et al. An-1 encodes a basic helix-loop-helix protein that regulates awn development, grain size, and grain number in rice. Plant Cell 2013, 25, 3360–3376. [Google Scholar] [CrossRef] [PubMed] [Green Version]
  47. French, S.R.; Abu-Zaitoon, Y.; Uddin, M.M.; Bennett, K.; Nonhebel, H.M. Auxin and Cell Wall Invertase Related Signaling during Rice Grain Development. Plants 2014, 3, 95–112. [Google Scholar] [CrossRef] [Green Version]
  48. Sakurai, J.; Ishikawa, F.; Yamaguchi, T.; Uemura, M.; Maeshima, M. Identification of 33 rice aquaporin genes and analysis of their expression and function. Plant Cell. Physiol. 2005, 46, 1568–1577. [Google Scholar] [CrossRef] [Green Version]
  49. Xu, C.; Liu, Y.; Li, Y.; Xu, X.; Xu, C.; Li, X.; Xiao, J.; Zhang, Q. Differential expression of GS5 regulates grain size in rice. J. Exp. Bot. 2015, 66, 2611–2623. [Google Scholar] [CrossRef] [Green Version]
  50. Han, S.H.; Yoo, S.C.; Lee, B.D.; An, G.; Paek, N.C. Rice FLAVIN-BINDING, KELCH REPEAT, F-BOX 1 (OsFKF1) promotes flowering independent of photoperiod. Plant Cell. Environ. 2015, 38, 2527–2540. [Google Scholar] [CrossRef]
  51. Lee, D.K.; Kim, H.I.; Jang, G.; Chung, P.J.; Jeong, J.S.; Kim, Y.S.; Bang, S.W.; Jung, H.; Choi, Y.D.; Kim, J.K. The NF-YA transcription factor OsNF-YA7 confers drought stress tolerance of rice in an abscisic acid independent manner. Plant Sci. 2015, 241, 199–210. [Google Scholar] [CrossRef]
  52. He, L.; Li, M.; Qiu, Z.; Chen, D.; Zhang, G.; Wang, X.; Chen, G.; Hu, J.; Gao, Z.; Dong, G.; et al. Primary leaf-type ferredoxin 1 participates in photosynthetic electron transport and carbon assimilation in rice. Plant J. 2020, 104, 44–58. [Google Scholar] [CrossRef] [PubMed]
  53. Wu, S.; Xie, Y.; Zhang, J.; Ren, Y.; Zhang, X.; Wang, J.; Guo, X.; Wu, F.; Sheng, P.; Wang, J.; et al. VLN2 Regulates Plant Architecture by Affecting Microfilament Dynamics and Polar Auxin Transport in Rice. Plant Cell 2015, 27, 2829–2845. [Google Scholar]
  54. Chen, W.; Chen, L.; Zhang, X.; Yang, N.; Guo, J.; Wang, M.; Ji, S.; Zhao, X.; Yin, P.; Cai, L.; et al. Convergent selection of a WD40 protein that enhances grain yield in maize and rice. Science 2022, 375, eabg7985. [Google Scholar] [CrossRef]
  55. Hussin, S.H.; Wang, H.; Tang, S.; Zhi, H.; Tang, C.; Zhang, W.; Jia, G.; Diao, X. SiMADS34, an E-class MADS-box transcription factor, regulates inflorescence architecture and grain yield in Setaria italica. Plant Mol. Biol. 2021, 105, 419–434. [Google Scholar] [CrossRef] [PubMed]
  56. Ilg, A.; Yu, Q.; Schaub, P.; Beyer, P.; Al-Babili, S. Overexpression of the rice carotenoid cleavage dioxygenase 1 gene in Golden Rice endosperm suggests apocarotenoids as substrates in planta. Planta 2010, 232, 691–699. [Google Scholar] [CrossRef]
  57. He, L.; Cheng, L.; Wang, J.; Liu, J.; Cheng, J.; Yang, Z.; Cao, R.; Han, Y.; Li, H.; Zhang, B. Carotenoid Cleavage Dioxygenase 1 Catalyzes Lutein Degradation to Influence Carotenoid Accumulation and Color Development in Foxtail Millet Grains. J. Agric. Food Chem. 2022, 70, 9283–9294. [Google Scholar] [CrossRef]
  58. Giri, J.; Bhosale, R.; Huang, G.; Pandey, B.K.; Parker, H.; Zappala, S.; Yang, J.; Dievart, A.; Bureau, C.; Ljung, K.; et al. Rice auxin influx carrier OsAUX1 facilitates root hair elongation in response to low external phosphate. Nat. Commun. 2018, 9, 1408. [Google Scholar] [CrossRef] [Green Version]
  59. Tang, S.; Shahriari, M.; Xiang, J.; Pasternak, T.; Igolkina, A.; Aminizade, S.; Zhi, H.; Gao, Y.; Roodbarkelari, F.; Sui, Y.; et al. The role of AUX1 during lateral root development in the domestication of the model C4 grass Setaria italica. J. Exp. Bot. 2022, 73, 2021–2034. [Google Scholar] [CrossRef] [PubMed]
  60. Spielmeyer, W.; Ellis, M.H.; Chandler, P.M. Semidwarf (sd-1), “green revolution” rice, contains a defective gibberellin 20-oxidase gene. Proc. Natl. Acad. Sci. USA 2002, 99, 9043–9048. [Google Scholar] [CrossRef]
  61. Bates, D.; Maechler, M.; Bolker, B.; Walker, S. lme4: Linear mixedeffects models using Eigen and S4. J. Stat. Softw. 2014, 67, 1–9. [Google Scholar]
Figure 1. Phenotypic characteristics of six panicle-related traits of 407 foxtail millet accessions in two environments (2015 and 2016). The scatter plots and the correlation coefficients of six panicle-related traits are listed below and above the diagonal, respectively. PL, MPD, PWP, GWP, BL, and TGW represent the panicle length, main panicle diameter, panicle weight per panicle, grain weight per panicle, bristle length, and thousand-grain weight, respectively. *, **, and *** represent significant correlations at p < 0.05, p < 0.01, and p < 0.001 levels, respectively.
Ijms 23 14735 g001
Figure 2. Genotypic characteristics of 407 foxtail millet accessions based on SNP variation information. (a) A line chart of Δk values performed by Structure Harvester software; (b,c) a phylogenetic tree and principal component analysis of 407 foxtail millet accessions, respectively; (d) the attenuation distance of the linkage disequilibrium of foxtail millet.
Ijms 23 14735 g002
Figure 3. The phenotypic distribution of six panicle-related traits of foxtail millet accessions from different sub-groups. These sub-groups were obtained by population structure and phylogenetic tree analysis based on genomic SNP variation information. The violin plots were drawn using the R backage ggplot2, and the width of the violin represents the distribution density of the phenotypic values.
Ijms 23 14735 g003
Figure 4. Manhattan and quantile–quantile plots performed by Tassel 5.0 to identify quantitative trait nucleotides (QTNs) significantly associated with six panicle-related traits in two environments. (af) The panicle length (PL), main panicle diameter (MPD), panicle weight per panicle (PWP), grain weight per panicle (GWP), bristle length (BL), and thousand-grain weight (TGW), respectively.
Ijms 23 14735 g004
Figure 5. QTL regions significantly associated with six panicle-related traits. (a) The number of QTN and QTL regions associated with six panicle-related traits; (b) the number of QTL regions associated with each panicle-related trait; (c) the distribution of QTL regions on chromosomes. The columns on the right represent the number of core QTL regions in (b), and the core QTL regions in (3) are marked with black triangles.
Ijms 23 14735 g005
Figure 6. Collinearity analysis of orthologous genes related to yield- and panicle-related traits in foxtail millet and rice. The outermost circle represents the chromosome combination of millet (Si) and rice (Os), and is marked with different color backgrounds. The next four circles represent the gene expression levels in the roots, stems, leaves, and panicles of foxtail millet and rice, respectively. All expression data were derived from the multi-omics database for Setaria italica (MDSi, http://foxtail-millet.biocloud.net/home (accessed on 10 May 2022)) and the rice expression database (RED, http://expression.ic4r.org/index (accessed on 10 May 2022)), and the average TPM values within 100 kb windows were used to display gene expression levels. The innermost circle represents the gene density. The light gray, gray, and red lines represent the collinear regions between millet and rice, the orthologous genes for yield and panicle-related traits, and the 27 candidate orthologous genes in the QTL regions, respectively.
Ijms 23 14735 g006
Figure 7. Expression characteristics of 27 pairs of orthologous genes in foxtail millet and rice. (a) The expression data of 27 pairs of orthologous genes in the roots, stems, leaves, and panicles of foxtail millet and rice were derived from the multi-omics database for Setaria italica (MDSi, http://foxtail-millet.biocloud.net/home (accessed on 10 May 2022)) and the rice expression database (RED, http://expression.ic4r.org/index (accessed on 10 May 2022)), respectively. (b) The expression patterns of 27 candidate genes in foxtail millet during grain development (S1 to S5). All expression data were derived from the multi-omics database for Setaria italica (MDSi, http://foxtail-millet.biocloud.net/home (accessed on 10 May 2022)). From blue to red, the expression level increases from low to high, and Log2 (TPM + 1) values are used to characterize the expression levels.
Ijms 23 14735 g007
Figure 8. Haplotype analysis of 27 candidate genes in QTL regions in two environments and BLUP. (a) The contribution of excellent haplotypes of 27 candidate genes to phenotypes in multiple environments. The red block represents that excellent haplotypes of candidate genes have significant contributions to the phenotype in this environment at p < 0.01. (b) The effects of different haplotypes of two representative genes Si5g01910 and Si3g11190 on the TGW and the GWP. Above and below represent the effects of Si5g01910 on the TGW and Si3g11190 on the GWP in two environments (2015, 2016) and BLUP, respectively. PL, MPD, PWP, GWP, BL, and TGW represent the panicle length, main panicle diameter, panicle weight per panicle, grain weight per panicle, bristle length, grain yield, and thousand-grain weight, respectively. Letters (a–c) in (b) represent significant differences.
Ijms 23 14735 g008
Table 1. Descriptive statistics of six panicle-related traits of foxtail millet in two environments.
TraitsEnvironmentsRangeMeanSDCVh2GenotypeEnvironment
Panicle length
(PL, cm)
20154.50–43.9022.205.5020%0.78****
20168.80–40.0019.304.4020%
BLUP10.72–31.2720.813.1215%
Main panicle diameter
(MPD, mm)
20159.40–48.2423.316.3627%0.74****
201610.19–42.8222.634.6921%
BLUP14.80–35.4722.953.0313%
Panicle weight per panicle
(PWP, g)
20150.58–57.6917.869.6954%0.73****
20161.06–35.7414.715.8940%
BLUP7.64–30.4516.264.3227%
Grain weight per panicle
(GWP, g)
20150.50–48.8815.068.5157%0.74****
20161.36–36.3412.515.2942%
BLUP6.30–26.7813.733.8828%
Bristle length
(BL, mm)
20150.00–14.374.232.0448%0.91***
20160.00–10.483.861.7646%
BLUP0.35–10.414.031.6040%
Thousand-grain weight
(TGW, g)
20150.72–3.622.580.4819%0.81****
20161.08–4.362.760.4416%
BLUP1.55–3.312.660.3111%
BLUP: best linear unbiased prediction; SD: standard deviation; CV: coefficient of variation; h2: broad-sense heritability; genotype and environment represent the significant levels of these traits between genotypes and environments, respectively; * and ** represent significant correlations at p < 0.05 and p < 0.01 levels, respectively.
Table 2. The number of significant SNP loci for six panicle-related traits by MLM model in two environments and BLUP.
TraitsEnvironmentsNumber of
Significant SNPs
Range of
R2 (%)
Average of
R2 (%)
Panicle length2015820.04–12.814.89
20161110.25–8.042.62
BLUP3714.06–6.634.90
Main panicle diameter2015130.04–20.214.37
2016410.06–7.893.45
BLUP554.03–6.674.72
Panicle weight per panicle20152310.44–25.855.69
2016280.01–12.376.92
BLUP364.06–5.954.63
Grain weight per panicle20152700.24–25.135.76
2016480.89–12.416.02
BLUP374.09–6.274.62
Bristle length2015360.03–26.7816.01
2016242.33–23.3011.91
BLUP3203.99–12.444.91
Thousand-grain weight20151540.01–11.531.70
2016650.03–10.083.13
BLUP3343.89–7.354.61
Total-18300.01–26.785.60
BLUP: the best linear unbiased prediction; R2: the phenotype interpretation rate.
Table 3. The core QTL regions associated with six panicle-related traits.
No.QTLChrQTL Region (Mb)No. of QTNQTNPosR2 (%)Trait Environment
1PL_q2-1226.405–26.44282:26442425264424259.30PL.15, PL.blup
2PL_q2-2237.921–37.9741122:37940934379409346.63PL.16, PL.blup
3PL_q2-3238.066–38.179372:38117003381170034.70PL.16, PL.blup
4PL_q3-1314.919–15.034313:14994886149948868.21PL.15, PL.blup
5PL_q3-4350.531–50.63593:50544489505444894.80PL.15, PL.blup
6PL_q6-1631.569–31.57846:31578055315780555.65PL.16, PL.blup
7PL_q7-1713.851–13.948267:138608221386082212.81PL.15, PL.blup
8PL_q7-2714.113–14.16967:141201111412011110.85PL.15, PL.16, PL.blup
9PL_q9-1945.700–45.712269:45712081457120815.62PL.15, PL.blup
10PWP_q1-2137.334–37.415111:373342343733423425.28PWP.15, PWP.blup
11PWP_q2-1226.393–26.41442:26392717263927174.55PWP.16, PWP.blup
12PWP_q7-1713.928–13.93747:139276831392768310.78PWP.15, PWP.blup
13GWP_q1-2137.334–37.415121:373342343733423424.66GWP.15, GWP.blup
14GWP_q2-4226.392–26.41442:26392093263920934.96GWP.16, GWP.blup
15GWP_q7-1713.853–13.95887:139276831392768310.60GWP.15, GWP.16, GWP.blup
16BL_q1-4130.818–30.944161:308900433089004312.67BL.15, BL.16, BL.blup
17BL_q1-5131.336–31.388191:313844183138441813.65BL.15, BL.blup
18BL_q1-6137.312–37.3861901:373221393732213923.46BL.15, BL.16, BL.blup
19BL_q1-7137.626–37.728391:377247713772477124.65BL.15, BL.16, BL.blup
20BL_q1-8137.730–37.818621:377516023775160224.16BL.15, BL.16, BL.blup
21BL_q1-9137.854–37.942151:378555553785555512.44BL.15, BL.16, BL.blup
22BL_q1-10138.004–38.10041:380997263809972623.57BL.15, BL.blup
23BL_q1-11138.240–38.293201:382512633825126321.12BL.15, BL.16, BL.blup
24BL_q4-140.833–0.89364:8931878931877.54BL.16, BL.blup
25BL_q8-181.635–1.668188:163525016352508.93BL.16, BL.blup
26BL_q9-1942.909–42.944209:429435714294357114.14BL.15, BL.blup
27TGW_q5-150.546–0.54945:5458985458988.32TGW.16, TGW.blup
Chr: chromosome; QTN: quantitative trait nucleotide; Pos: position; R2 (%): the highest phenotype interpretation rate in QTL region; Trait_environment: the trait–environment combination of QTN.
Table 4. The overlapped QTLs between present and previous studies.
QTL RegionsChrQTL Region (Mb)Previous Reported QTLPosition of Previous QTL (Mb)Ref.
BL_q1-5131.336–31.388qMPL1.1 (PL), qMPD1.1 (PD), qPWP1.1 (PWP), qGWP1.1 (GWP), qpl1 (PL), qpd1 (PD), C1.31690904 (GY)31.728–31.929[15,23,25]
PWP_q1-1, GWP_q1-1134.970–34.987unnamed (BL)35.883–35.869[24]
PL_q2-2, PL_2-3237.921–38.179qMPL2.1 (PL)39.726[15]
PL_q2-4249.117–49.200unnamed (GY)49.065[24]
TGW_q3-136.258–6.342unnamed (PWP)6.768[24]
PWP_q3-1, GWP_q3-137.353–7.409qGWP3.1 (GWP), unnamed (TGW)7.412–7.806[24,26]
PL_q3-1314.919–15.034unnamed (PL)14.391[23]
MPD_q3-1, TGW_q3-2323.616–23.733unnamed (GY)24.672[24]
PL_q3-2339.875–39.995qPWP3.1 (PWP), qGWP3.2 (GWP)39.037[26]
TGW_q3-3343.160–43.182unnamed (PL), unnamed (TGW)43.132–43.267[23,24]
MPD_q3-2347.020–47.023qPWP3.3 (PWP)46.338–46.477[26]
PL_q3-4350.531–50.635unnamed (GY)50.073[23]
BL_q4-140.833–0.893unnamed (BL)0.871[24]
MPD_q4-1434.740–34.746qtgw4 (TGW)34.306[25]
MPD_q5-2545.138–45.166qMPD5.2 (MPD), qTGW5.1 (TGW), qpw5 (PWP), qpd5(PD)44.125–44.511[15,25]
PWP_q6-1, GWP_q6-1, PWP_q6-2, GWP_q6-262.535–2.794qPWP6.2 (PWP), unnamed (GY)2.631–3.434[23,26]
PWP_q6-7, GWP_q6-7, GWP_q6-9, PWP_q6-8, GWP_q6-9627.924–28.247qPNL6 (PL)28.589[16]
TGW_q6-1634.670–34.733qMPD6.1 (PD)34.199[15]
PL_q7-1, TGW_q7-1, PWP_q7-1, GWP_q7-1713.851–13.961qGWP7.1 (GWP), qPWP7.2 (PWP)13.405–13.643[26]
PL_q7-2, TGW_q7-2, TGW_q7-3714.113–14.893unnamed (GY)14.094[23]
TGW_q7-8718.967–19.040unnamed (GY)19.465[23]
GWP_q8-182.181–2.191qGWP8.1 (GWP), qTGW8.1 (TGW)2.223–2.605[26]
TGW_q8-1828.829–28.851qPD8.1 (PD)29.501[16]
Chr: chromosome; Ref: reference; PL, MPD, PWP, GWP, BL, GY, and TGW represent the panicle length, main panicle diameter, panicle weight per panicle, grain weight per panicle, bristle length, grain yield, and thousand-grain weight, respectively.
Table 5. The details of 27 candidate genes associated with panicle-related traits in foxtail millet.
Gene IDChrPositionQTL
Region
Homologs in RiceThe Function of Orthologue in Rice
Si1g24310131.649-31.652BL_q1-5OsPRR1
(LOC_Os02g40510) [27]
Internode length, spike length, tiller number, grain size, and number of primary branches
Si1g27910134.867-34.874GWP_q1-1 PWP_q1-1OsMADS6
(LOC_Os02g45770) [28]
Protein content, sterility or low fertility, gelatinization temperature, amylose content, seed setting rate, grain width, grain length, floral organ development characteristics, and total starch content
Si1g31910137.921-37.926BL_q1-10OsGRF4; GS2; GL2; PT2; LGS1; GLW2(LOC_Os02g47280) [29]Grain shape, ear length, grain size, grain yield, seed drop, cold tolerance, grain width, grain length, plant dry weight, 1000-grain weight, plant cell size, plant fresh weight, and nitrogen use efficiency
Si1g34880140.251-40.252PL_q1-2OsMKK4; SMG1
(LOC_Os02g54600) [30]
Plant height, grain size, panicle type, filled grains per panicle, grain width, grain length, lignin content, cytokinin content, diterpenoid phytoalexin content, and 1000-grain weight
Si2g1022029.256-9.262GWP_q2-3LLB; pls3; OsMTS1
(LOC_Os07g14350) [31]
Rice blast resistance, bacterial blight resistance, leaf color, chlorophyll content, grain yield, leaf inclination, leaf senescence, lesion-like lesion, hydrogen peroxide, jasmonic acid, and aboveground biomass
Si2g27120236.896-36.902BL_q2-1qGW8; OsSPL16
(LOC_Os08g41940) [32]
Grain shape, cooking quality, grain size, mitotic cycle, and 1000-grain weight
Si2g43940249.297-49.308PL_q2-4DTH7; Ghd7.1; OsPRR37
(LOC_Os07g49460) [33]
Plant height, heading date, photoperiod sensitivity, growth period, and grain number per panicle
Si3g1119037.375-7.379PWP_q3-1 GWP_q3-1GSE5; GW5
(LOC_Os05g09520) [34]
Grain shape, grain size, grain width, grain length, and 1000-grain weight
Si3g1120037.390-7.394PWP_q3-1 GWP_q3-1OsDER1
(LOC_Os05g09550) [35]
Seed development characteristics, grain width, grain length, and 1000-grain weight
Si3g33230343.050-43.055TGW_q3-3OsCSLD4; NRL1; ND1; OsCD1
(LOC_Os12g36890) [36]
Plant height, leaf width, ear length, leaf inclination, leaf roll, grain number per ear, and sugar content
Si4g0281041.359-1.363TGW_q4-1OsACS6; SSG6
(LOC_Os06g03990) [37]
Grain size, grain width, grain length, starch granule shape, 1000-grain weight, chloroplast development, and starch granule size
Si4g23080434.377-34.386MPD_q4-1OsARF19; OsARF7a
(LOC_Os06g48950) [38]
Internode length, leaf width, leaf length, grain yield, leaf inclination, floral organ development characteristics, auxin content, 1000-grain weight, and plant cell size
Si5g0191050.793-0.800TGW_q5-1DFO1; CCP1
(LOC_Os01g12890) [39]
Plant height, male sterility, seed morphology and anatomy, ear length, tiller number, lemma morphology and anatomy, seed setting rate, and primary branch number
Si5g0749055.957-5.958PL_q5-1OsLIR1
(LOC_Os01g01340) [40]
Vegetative growth potential, seed setting rate, photosynthetic capacity, and spikelet fertility
Si5g0751055.969-5.971PL_q5-1OsNPF6.1
(LOC_Os01g01360) [41]
Plant height, panicle number, nitrogen content, nitrate transport, yield per plant, and nitrogen use efficiency
Si5g1026058.652-8.657PWP_q5-1OsSQD2.2
(LOC_Os01g04920) [42]
Tiller number, seed setting rate, total starch content, and total soluble sugar content
Si6g16030627.100-27.101PWP_q6-3 GWP_q6-3ONAC106
(LOC_Os08g33670) [43]
Leaf color, fertility, ear length, grain yield, salt tolerance, tiller angle, ear number, grain number per ear, oriented gravity, and 1000-grain weight
Si6g20480631.677-31.680PL_q6-1OsSPL14; IPA1; WFP
(LOC_Os08g39890) [44]
Rice blast resistance, bacterial blight resistance, plant height, ear length, tiller number, grain yield, ear branches, grain number per ear, seed setting rate, lodging rate, stem diameter, and 1000-grain weight
Si6g23990634.326-34.327TGW_q6-1OsSAUR45
(LOC_Os09g37400) [45]
Adventitious root number, plant height, root length, leaf width, and seed setting rate
Si7g07780715.603-15.606TGW_q7-7An-1
(LOC_Os04g28280) [46]
Awn length, grain number per ear, and grain length
Si7g10650719.276-19.279TGW_q7-8GIF1; OsCIN2
(LOC_Os04g33740) [47]
Viscous endosperm, grain size, grain yield, amylose content, amylopectin content, and invertase activity
Si7g20960727.099-27.101MPD_q7-1OsPIP1.1; OsPIP1a (LOC_Os02g44630) [48]Grain yield, salt tolerance, germination rate, and germination rate
Si7g27560732.242-32.246PL_q7-4GS5
(LOC_Os05g06660) [49]
Grain size, characteristics of seed development, grain yield, grain width, and 1000-grain weight
Si8g15190828.271-28.275TGW_q8-1OsFKF1
(LOC_Os11g34460) [50]
Fertility, heading date, number of panicles per plant, number of grains per panicle, and 1000-grain weight
Si9g1286098.332-8.335PWP_q9-1OsNF-YA4; OsHAP2D
(LOC_Os03g48970) [51]
Number of ears, number of ears, number of grains per ear, and grain weight
Si9g1355098.916-8.920GWP_q9-1OsFdC2
(LOC_Os03g48040) [52]
Plant height, leaf color, heading date, ear number per plant, grain number per ear, seed setting rate, photosynthetic capacity, carotenoid content, chlorophyll a content, chlorophyll b content, chlorophyll a/b ratio, and chloroplast development
Si9g39120945.984-45.994PL_q9-1VLN2
(LOC_Os03g24220) [53]
Morphological and anatomical characters of root, plant height, leaf angle, panicle type, seed setting rate, grain width, grain thickness, and 1000-grain weight
Chr: chromosome.
Publisher’s Note: MDPI stays neutral with regard to jurisdictional claims in published maps and institutional affiliations.

